


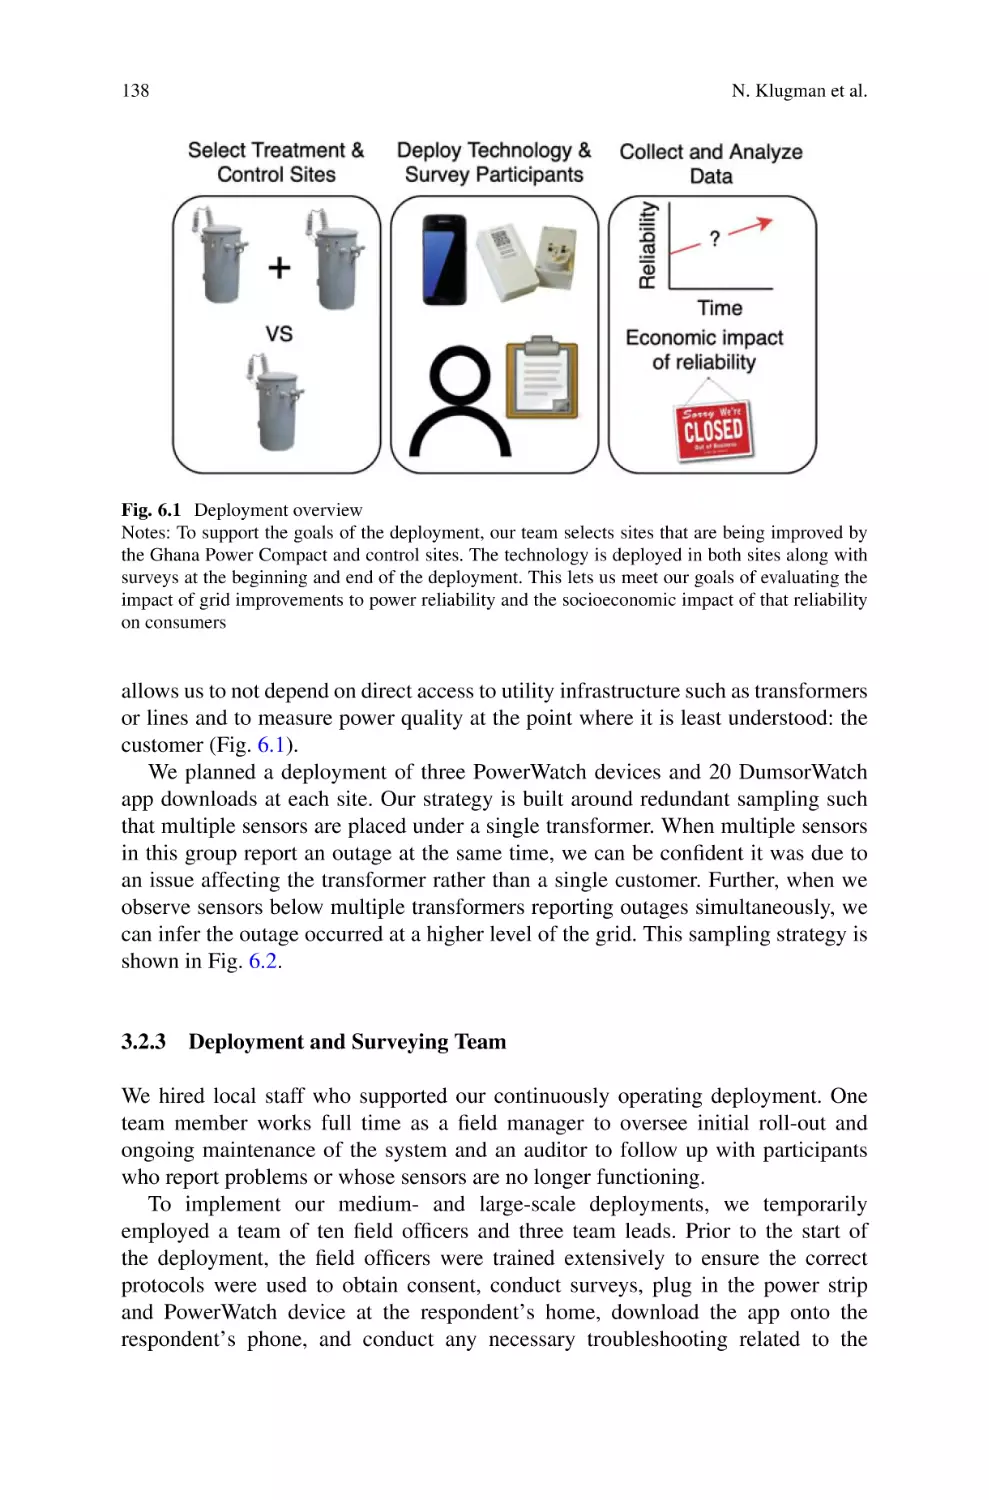


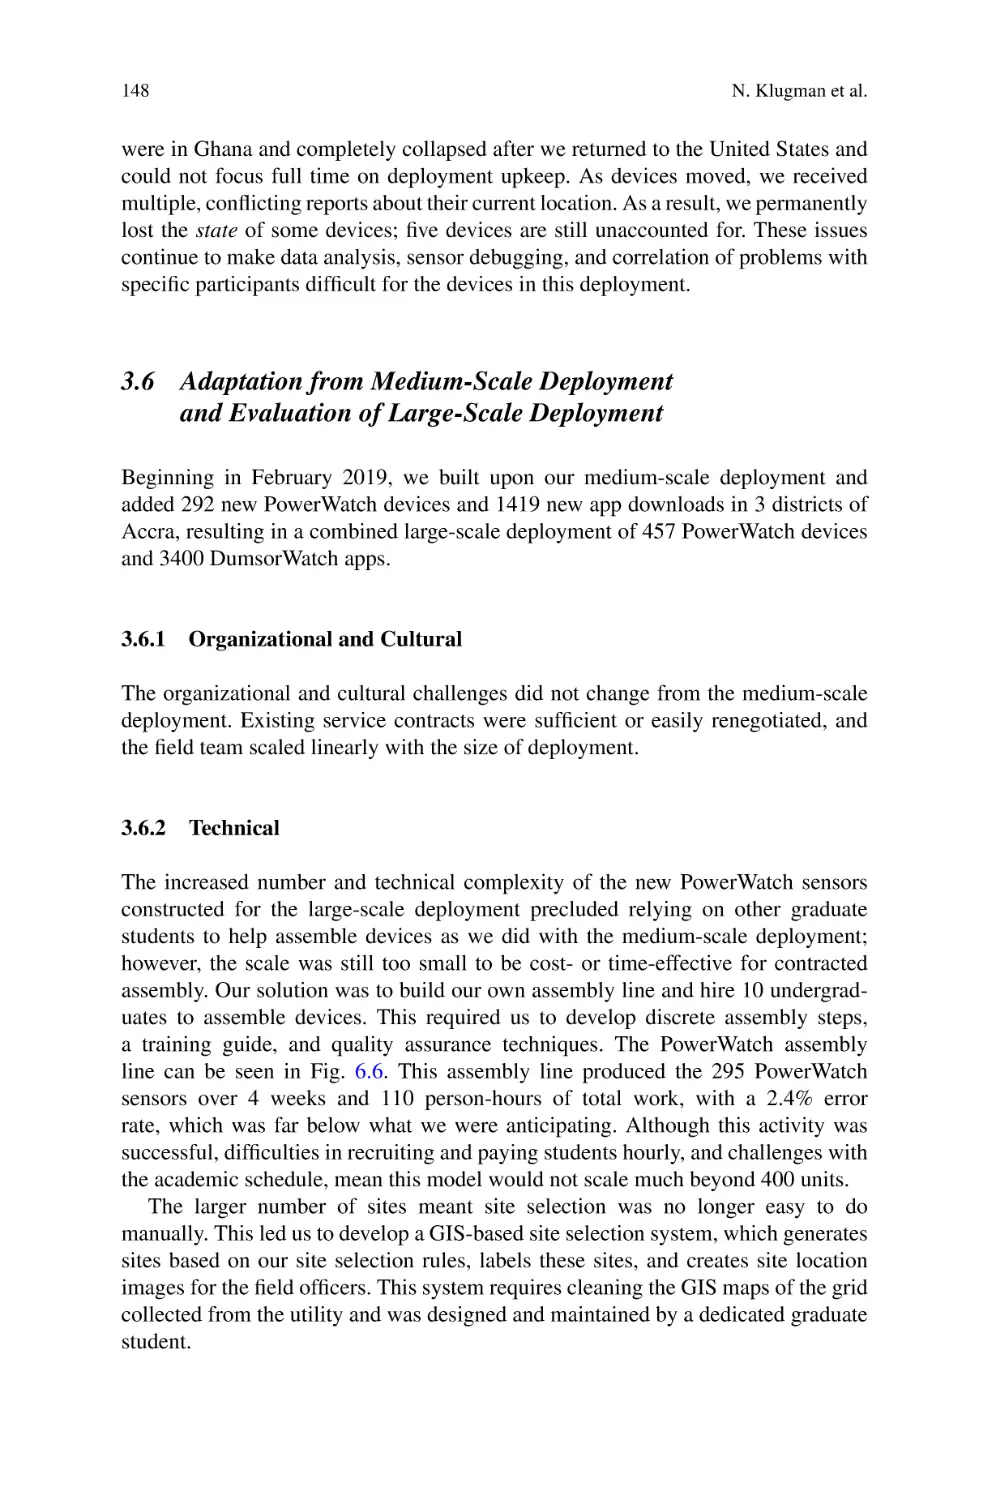


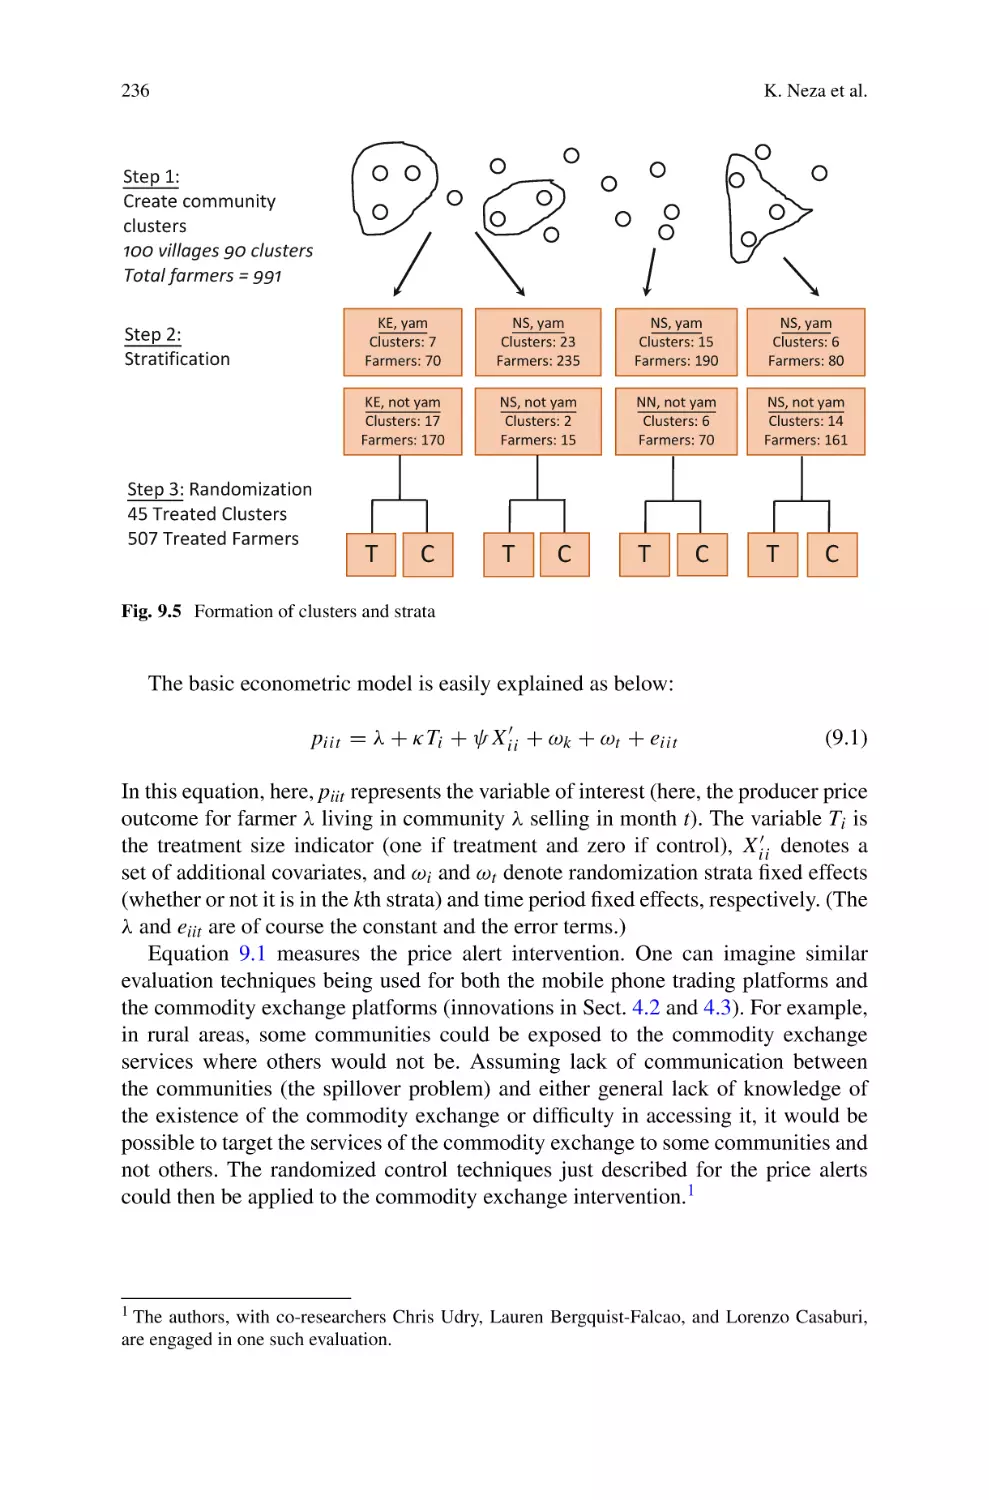


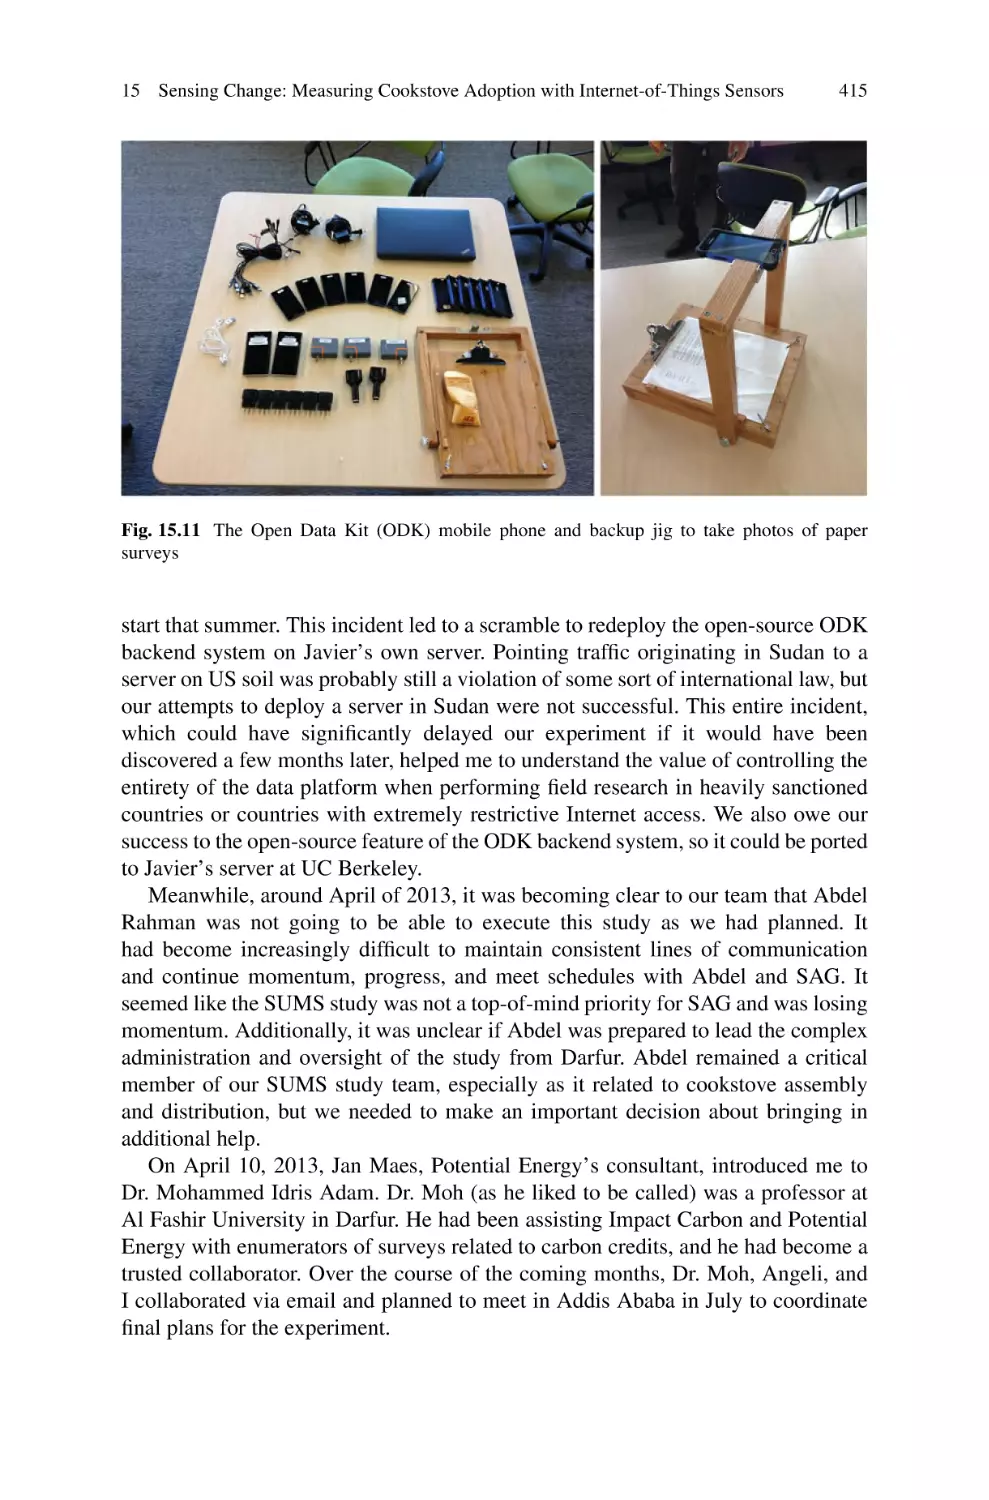

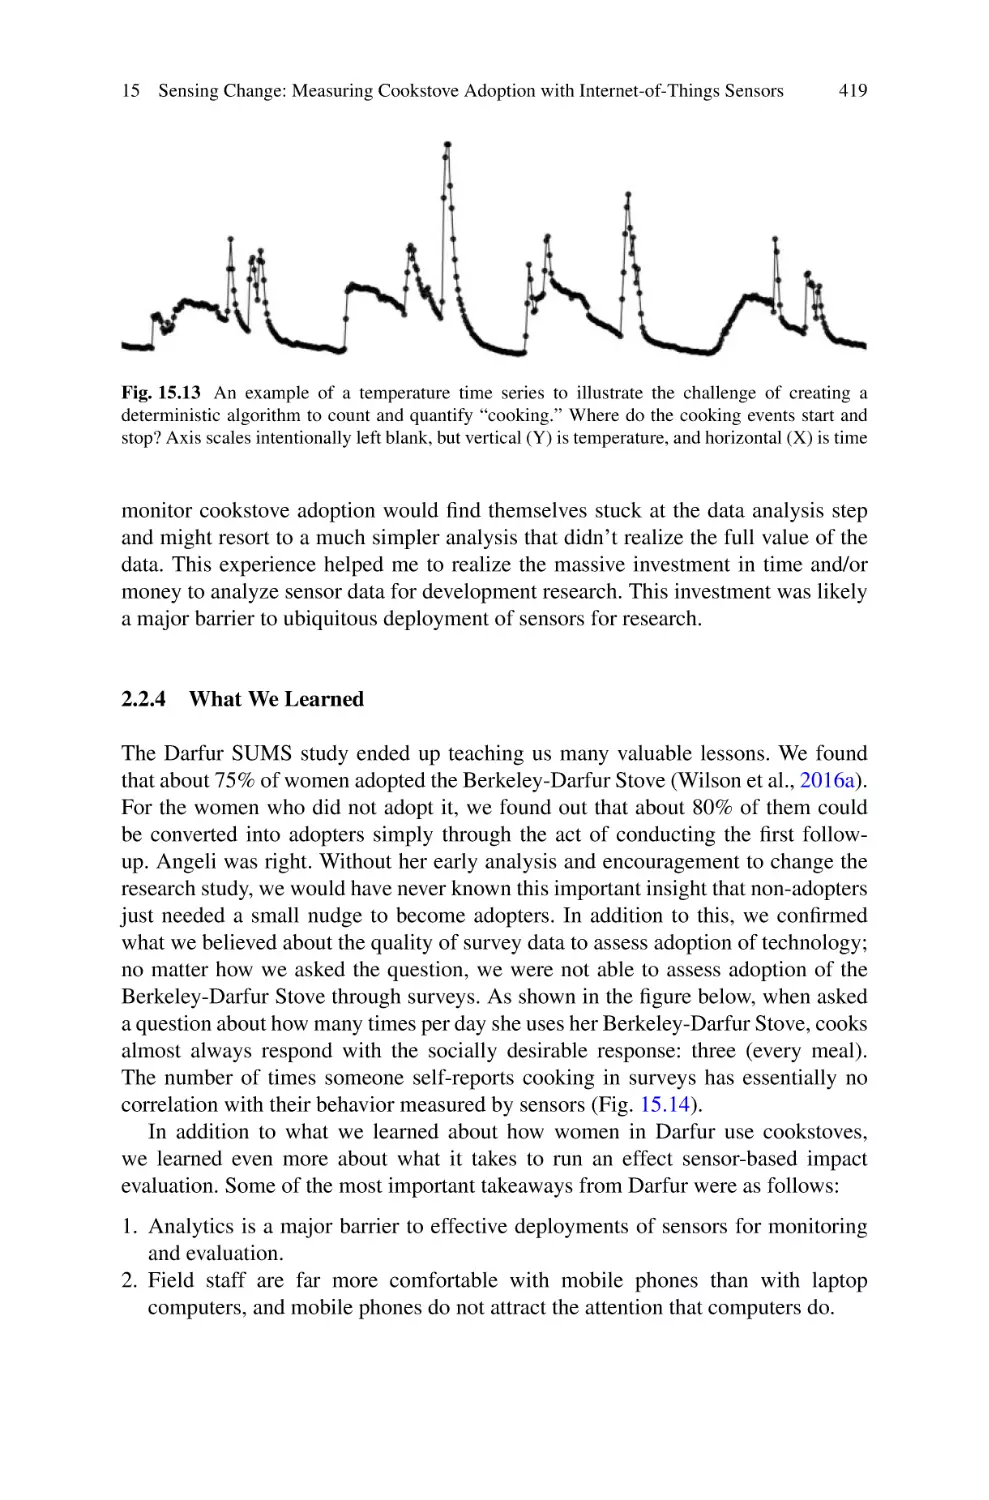


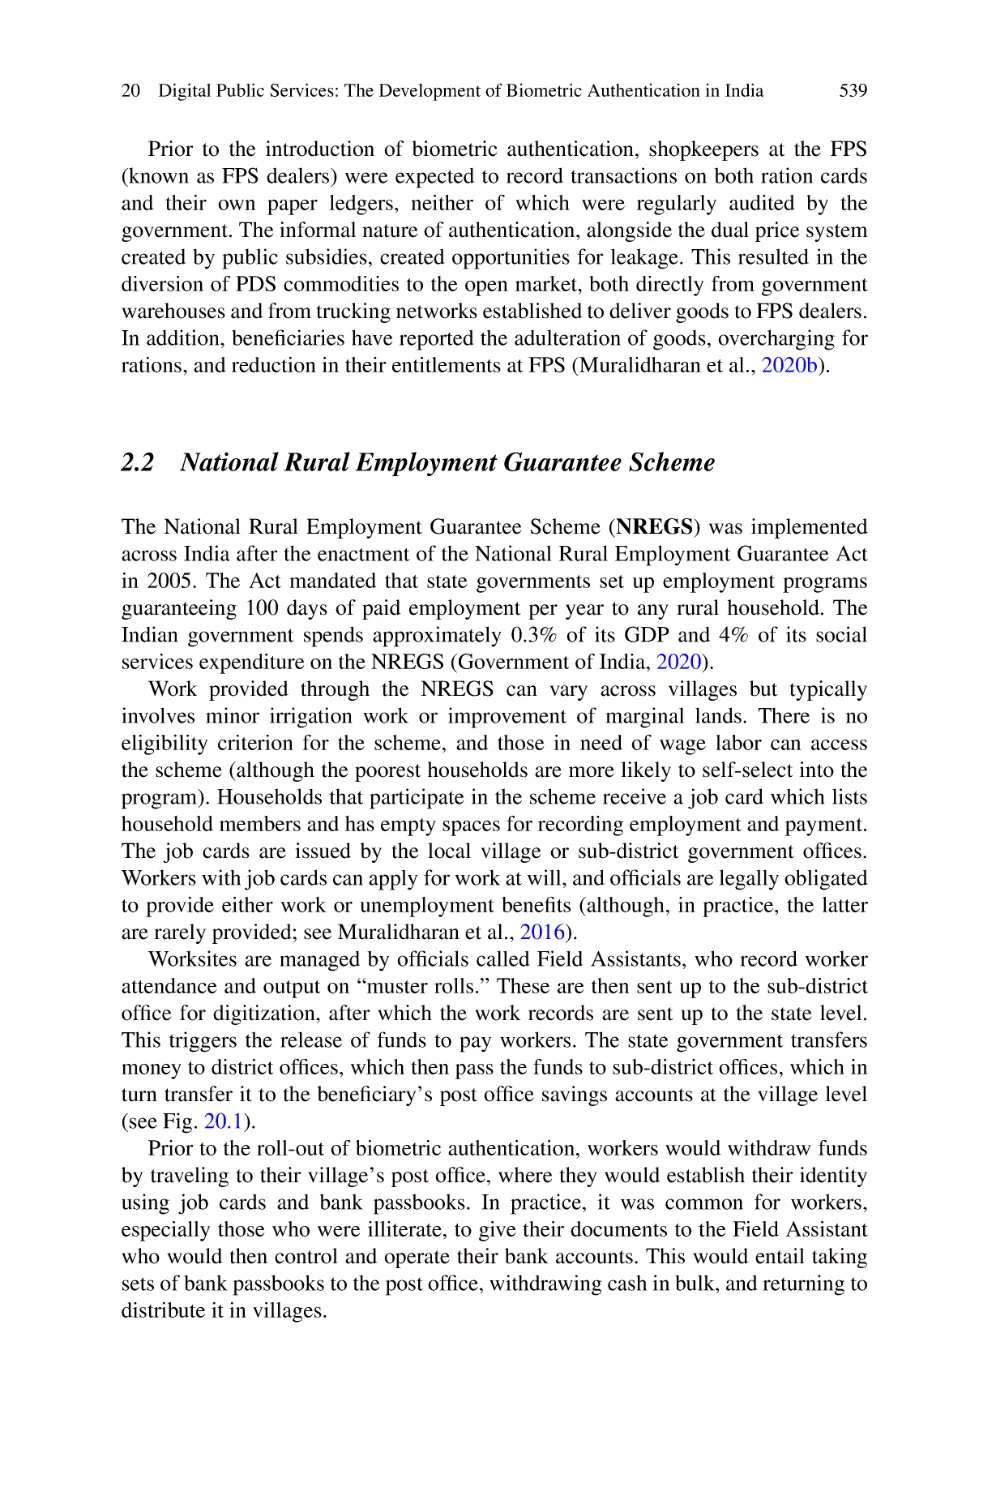


Author: Madon T. Gadgil A.J. Anderson R. Casaburi L. Kenneth Lee Rezaee A.
Tags: programming languages programming computer science springer publisher microprocessors reverse engineering
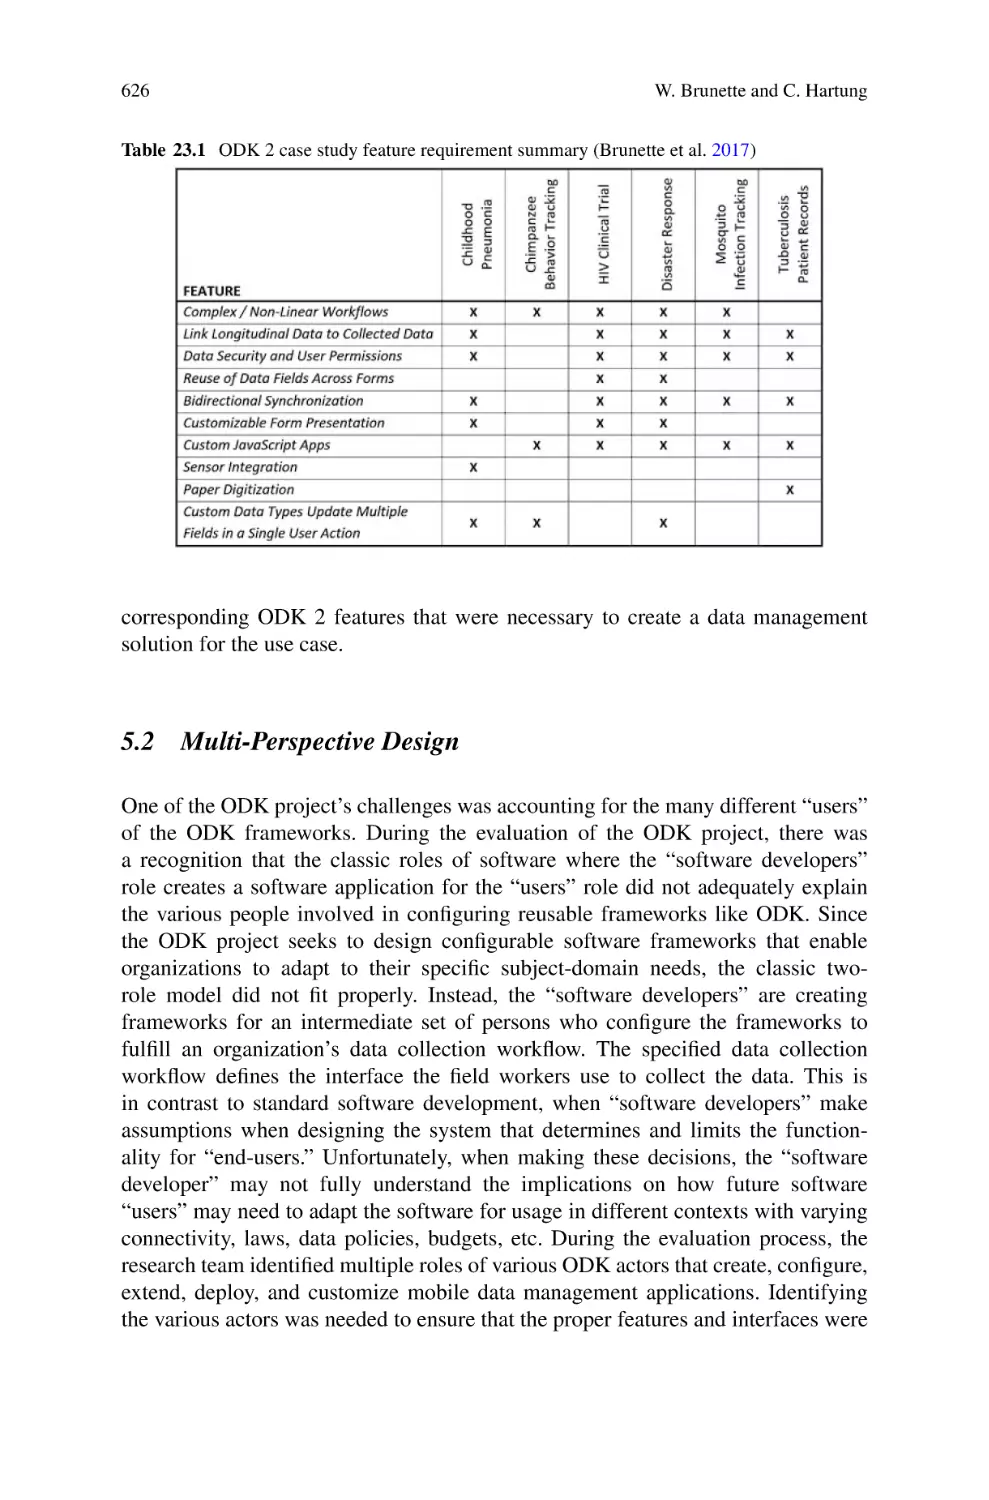
ISBN: 978-3-030-86064-6


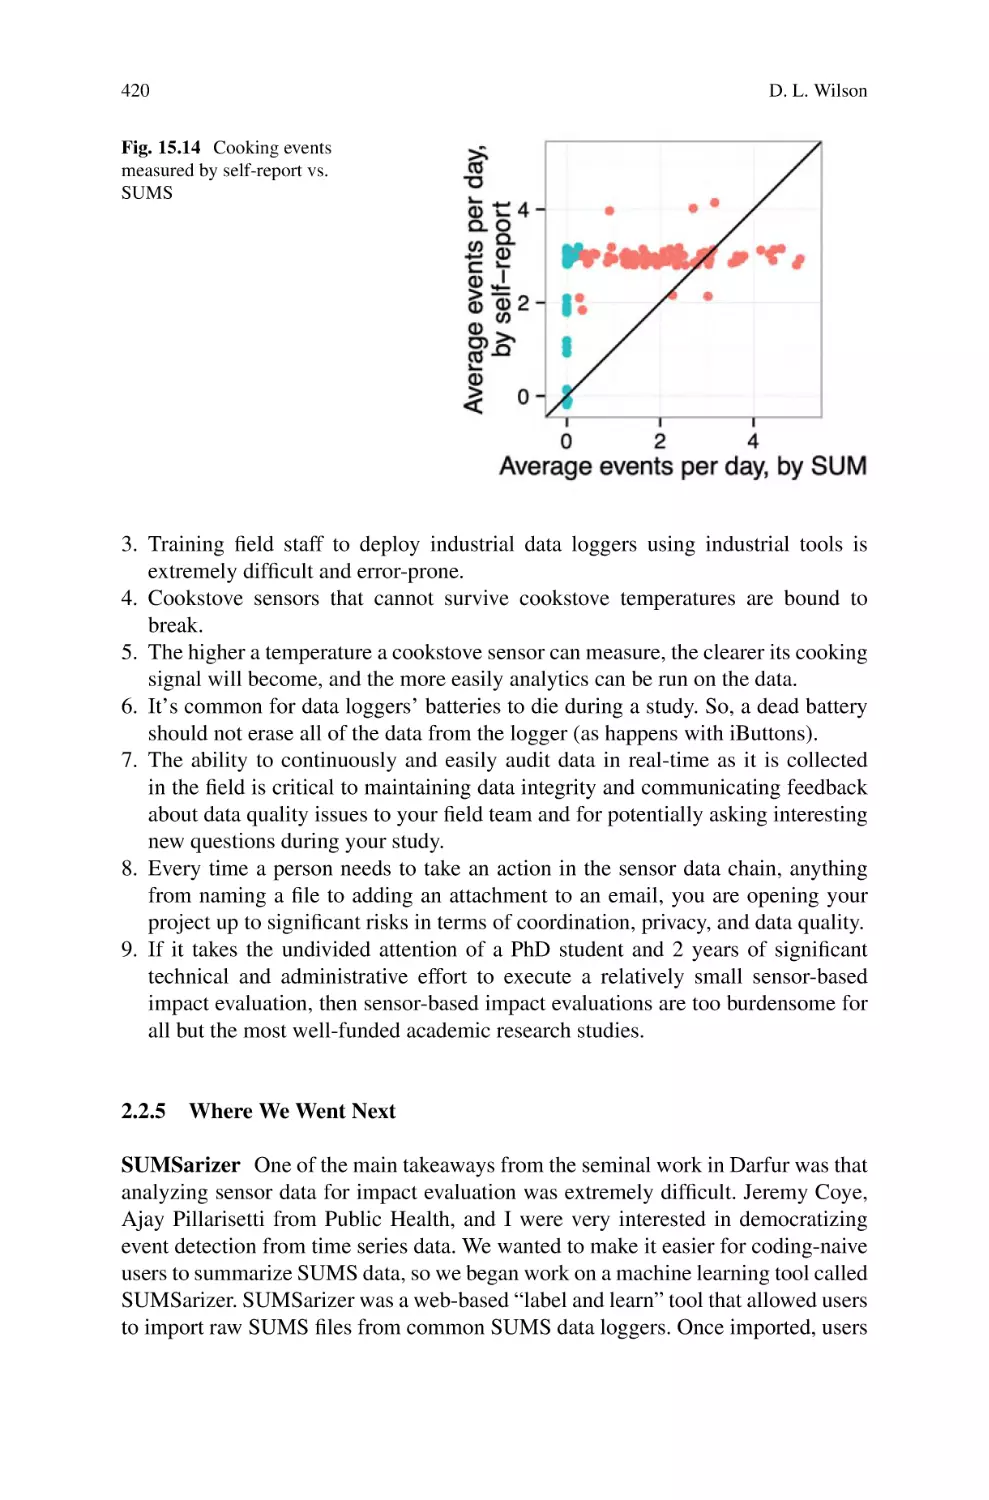
Temina Madon · Ashok J. Gadgil Editors
Richard Anderson · Lorenzo Casaburi
Kenneth Lee · Arman Rezaee Co-Editors
Introduction
to Development
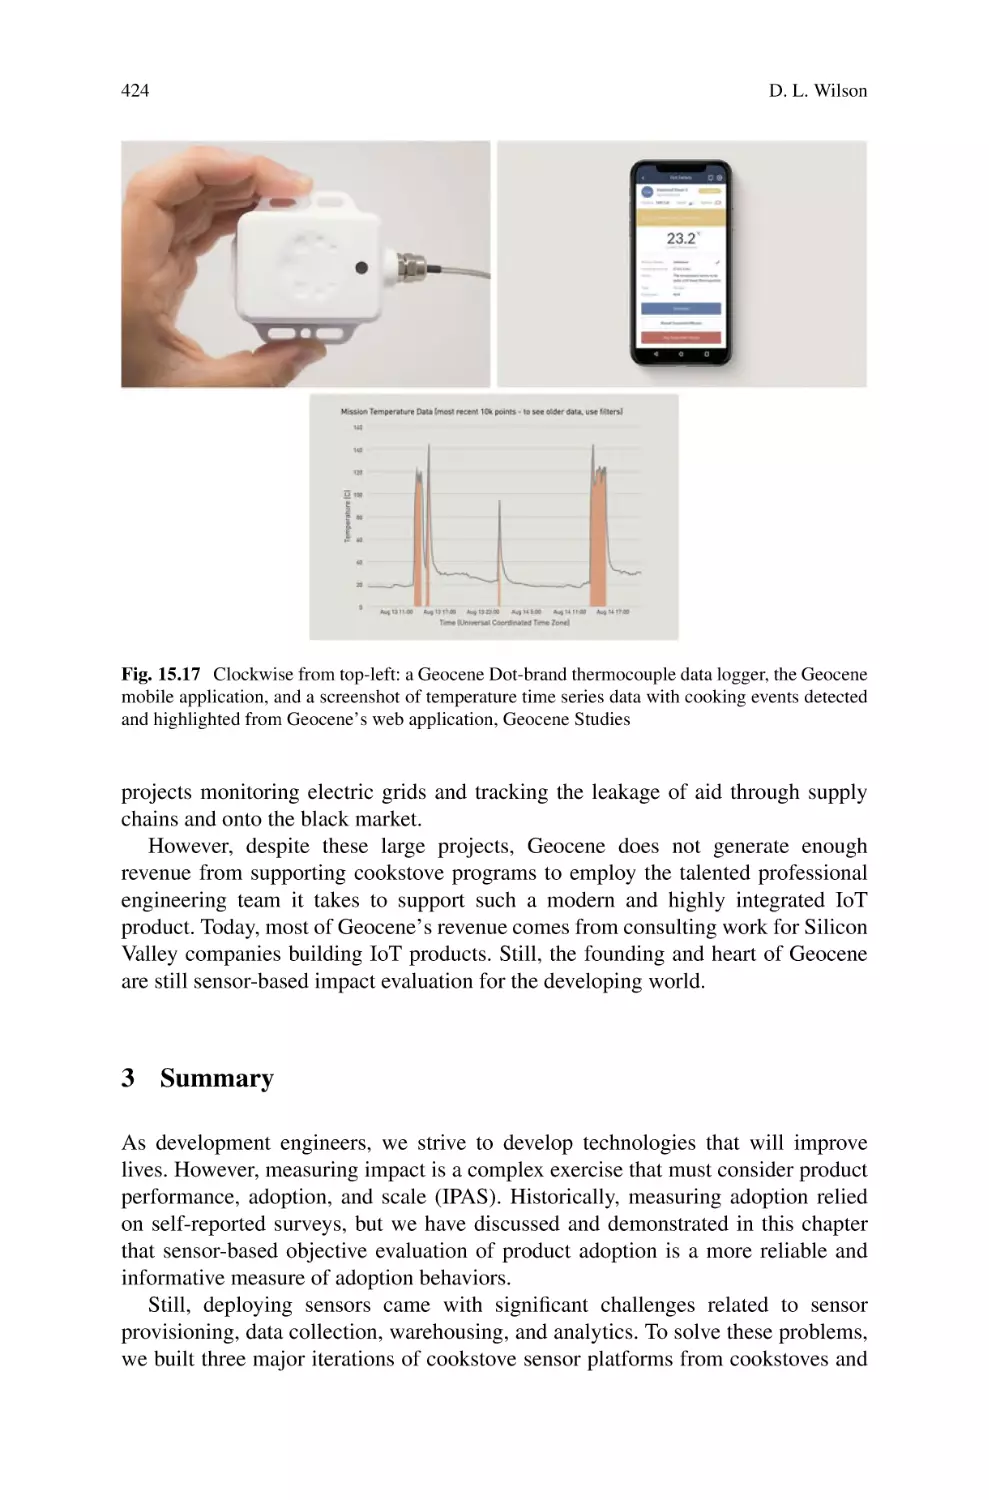
Engineering
A Framework
with Applications
from the Field
Introduction to Development Engineering
Temina Madon • Ashok J. Gadgil
Editors
Richard Anderson • Lorenzo Casaburi •
Kenneth Lee • Arman Rezaee
Co-Editors
Introduction to Development
Engineering
A Framework with Applications from
the Field
Editors
Temina Madon
Center for Effective Global Action
University of California, Berkeley
Berkeley, CA, USA
Co-Editors
Richard Anderson
Department of Computer Science
and Engineering
University of Washington
Seattle, WA, USA
Kenneth Lee
Chief Research and Evaluation Officer
The Pharo Foundation
Nairobi, Kenya
Ashok J. Gadgil
Department of Civil and Environmental
Engineering
University of California, Berkeley
Berkeley, CA, USA
Lorenzo Casaburi
Department of Economics
University of Zurich
Zurich, Switzerland
Arman Rezaee
Department of Economics
University of California, Davis
Davis, CA, USA
United States Agency for International Development (USAID)
ISBN 978-3-030-86064-6
ISBN 978-3-030-86065-3 (eBook)
https://doi.org/10.1007/978-3-030-86065-3
© The Editor(s) (if applicable) and The Author(s) 2023. This book is an open access publication.
Open Access This book is licensed under the terms of the Creative Commons Attribution 4.0
International License (http://creativecommons.org/licenses/by/4.0/), which permits use, sharing,
adaptation, distribution and reproduction in any medium or format, as long as you give appropriate
credit to the original author(s) and the source, provide a link to the Creative Commons licence and
indicate if changes were made.
The images or other third party material in this book are included in the book’s Creative Commons
licence, unless indicated otherwise in a credit line to the material. If material is not included in the book’s
Creative Commons licence and your intended use is not permitted by statutory regulation or exceeds the
permitted use, you will need to obtain permission directly from the copyright holder.
The use of general descriptive names, registered names, trademarks, service marks, etc. in this publication
does not imply, even in the absence of a specific statement, that such names are exempt from the relevant
protective laws and regulations and therefore free for general use.
The publisher, the authors, and the editors are safe to assume that the advice and information in this book
are believed to be true and accurate at the date of publication. Neither the publisher nor the authors or
the editors give a warranty, expressed or implied, with respect to the material contained herein or for any
errors or omissions that may have been made. The publisher remains neutral with regard to jurisdictional
claims in published maps and institutional affiliations.
This Springer imprint is published by the registered company Springer Nature Switzerland AG
The registered company address is: Gewerbestrasse 11, 6330 Cham, Switzerland
For Aditi, Arya, and Soma (T.M.)
For Anjali, Meghana,
and Madhurima (A.J.G.)
Preface
A defining question for every future generation is how to improve human welfare,
and reduce inequality, while respecting the boundaries of our planet. Indeed,
sustainable development is perhaps the greatest challenge we face as a species. It
will require continuous innovation and adaptation, across massive scales.
Development Engineering explores the design of technological solutions that can
rapidly accelerate life outcomes for people in poverty – particularly for those who
struggle most – without disruptive impacts on biodiversity and the environment.
This textbook serves as an introduction to the nascent field, which sits at an
intersection of development economics and engineering.
The scope of the textbook is broad, ranging from mobile services for lowliteracy users, to hardware solutions that bring clean water and electricity to remote
environments. It is also highly interdisciplinary, drawing on methods and theory
from political science and psychology as well as engineering and computer science.
The book’s diverse subject matter is woven together by a set of common
challenges that engineers and scientists face in designing technologies to accelerate
the development of disadvantaged communities. These challenges include market
failures (like high transport costs and financial exclusion) as well as institutional
weaknesses (like poor regulatory capacity or corruption). These forces commonly
prevent even promising technologies from improving welfare at any meaningful
scale. The book also considers the behavioral and social constraints facing communities, including the heavy burden of stress and anxiety among those living in
poverty. How can researchers learn to design around these constraints?
The opening part of this book offers a history of “technology-for-development”
and an overview of the channels through which technological innovations can
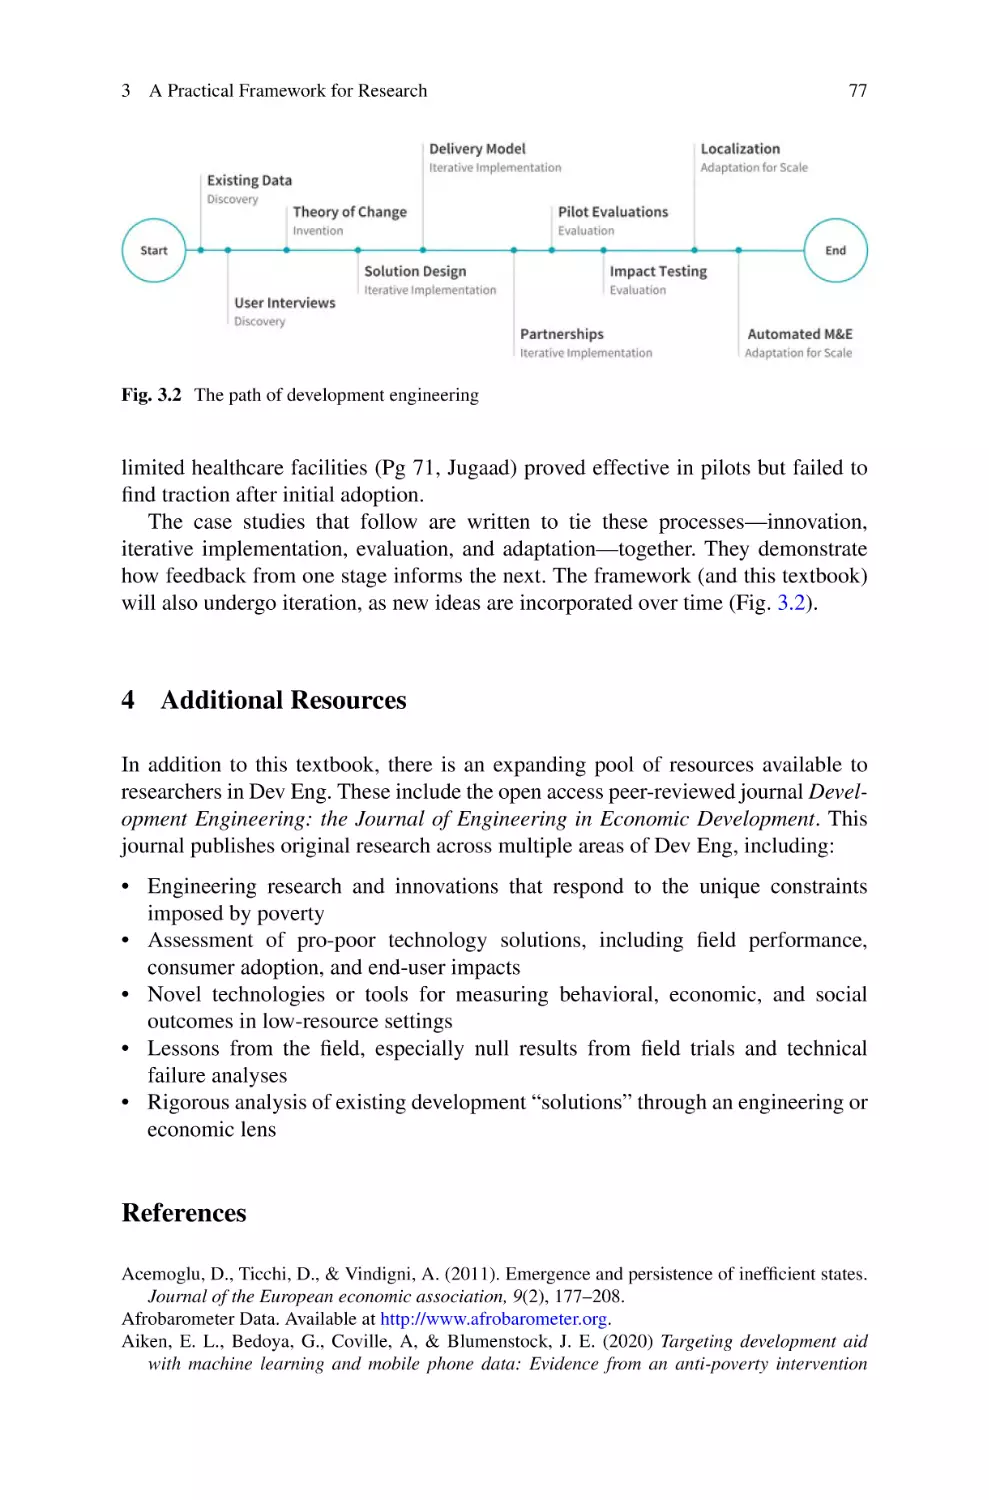
influence economic development. This is followed by a practical framework for
research that helps transform a vast multi-disciplinary field into a tractable practice.
This framework consists of four interlinked activities: innovation, iterative implementation, evaluation, and adaptation for scale.
The remainder of the textbook consists of six thematic parts, each focused on
a different sector: energy and resources; agricultural markets; education and jobs;
water, sanitation, and health; governance; and connectivity. Each part contains
vii
viii
Preface
multiple case studies describing landmark research that has influenced the field of
development engineering. The case studies demonstrate the practical framework for
research, analyze the researchers’ pivots and failures, and incorporate theories and
concepts relevant to each specific sector.
This book has prioritized research that directly integrates engineering innovation
with technically rigorous methods from the social sciences, such as randomized
evaluation. This is the essence of the new field of “development engineering,”
which connects insights from development economics and related disciplines with
engineering in order to promote impact at scale.
The intended audience for this book includes students, faculty, and other
researchers involved in the design, use, and evaluation of technologies that sustainably accelerate development. It is also written for development practitioners
(e.g., engineers, service providers, and technocrats) who work in low- and middleincome countries. Our motivation in writing this book is to help define a discipline
for those working on technology-for-development. For several decades, the field
has been dominated by practice (e.g., programs like “Engineers without Borders”),
emphasizing service learning in the absence of theory and empirical research.
This text attempts to provide a coherent intellectual framework for addressing the
challenges of poverty through the design and scaling of better technologies.
The book is inspired by the lessons learned from a multi-year, $30 million
investment in development engineering by the U.S. Agency for International Development. This investment, made through an award to the University of California,
has supported more than 100 pilot and large-scale research projects in 30 countries,
all focused on technologies for low-income communities.
We feel that the text is particularly timely given the increasing emphasis in
universities (and in business) on social innovation and social entrepreneurship. New
generations of young scientists and engineers are interested in careers that advance
social welfare, tackle inequality, and directly address climate change. They are
passionate about improving living conditions for people at the base of the economic
pyramid. However, there is a need for a rigorous discipline to help channel this
energy and ground it in an understanding of complex economic, political, and social
systems. We aim to fill this gap with An Introduction to Development Engineering.
Berkeley, CA, USA
Temina Madon
Berkeley, CA, USA
Ashok J. Gadgil
Seattle, WA, USA
Richard Anderson
Zurich, Switzerland
Lorenzo Casaburi
Nairobi, Kenya
Davis, CA, USA
Kenneth Lee
Arman Rezaee
Acknowledgments
The impetus for this textbook first emerged from a conversation with three dear
colleagues who have helped forge this new field of development engineering: Eric
Brewer, Edward Miguel, and Catherine Wolfram. We are indebted to these pioneers
for their individual intellectual contributions, and for their help in disciplining a
complex but vital area of research.
In truth, this book (and our field) has been shaped by decades of research
published by a diverse set of colleagues across the world. Art Rosenfeld, Rob
Socolow, and Amulya (A.K.N.) Reddy are three outstanding researchers who have
impacted how we deal with the real world. Alain de Janvry, Rachel Glennerster, and
Elisabeth Sadoulet have shaped our thinking, in pragmatic ways, about how markets
and institutions operate. Many others have contributed through their participation in
the Development Impact Lab, including Gaetano Borriello, Silvia Hostetler, Craig
McIntosh, Joyashree Roy, Evan Thomas, and Amos Winter as well as Engineer
Bainomugisha, Michael Callen, Edward Kirumira, and Paul Niehaus.
Along the way, a number of colleagues at UC Berkeley have contributed to our
thinking. We are grateful, above all, to Anustubh Agnihotri for insights and research
into the political and disruptive nature of technology; we are grateful also for his
gracious and persistent management of the textbook’s drafting. We acknowledge
valuable input from faculty and students across the campus, including Joshua
Blumenstock, Jennifer Bussell, Prabal Dutta, Daniel Fletcher, Meredith Fowlie, Ken
Goldberg, Angeli Kirk, Jeremy Magruder, Kara Nelson, Robert On, Kweku OpokuAgyemang, Matthew Podolsky, and Javier Rosa.
We are particularly grateful to Maryanne McCormick, Shankar Sastry, and the
team at the Blum Center for Developing Economies for spearheading this initiative
in partnership with the Center for Effective Global Action. We are also indebted to
past members of the Development Impact Lab staff, including Carson Christiano,
Guillaume Kroll, Heather Lofthouse, Anh-Thi Le, Sophi Martin, Kevin McCarthy,
Lina Nilsson, and Sarah White, for driving this learning odyssey.
The contours of this textbook have been profoundly shaped by early instructors in
development engineering at Berkeley, including Alice Agogino, Paul Gertler, David
Levine, Matthew Potts, and Jennifer Walske. We are also grateful to participants
ix
x
Acknowledgments
in the 2020 Development Engineering graduate courses at UC Berkeley and the
University of Washington, for providing helpful insights and feedback on early
versions of the text. In particular, we thank doctoral students Casey Finnerty and
Isa Ferrall, who have drafted the companion instructor guide for the textbook.
This endeavor would not have been possible without the support of the U.S.
Agency for International Development, which has supported an impressive body of
research in development engineering and has enabled us to publish the textbook as
an open access title. Colleagues at the agency, including Ticora Jones, Tara Hill,
and David Ferguson, have been valuable partners, supporters, and mentors. We
would also like to acknowledge Berber Kremer, Amy Bilton, Susan Amrose, and
the editorial board of the journal Development Engineering, which has advanced
the field immeasurably over the last 5 years.
Finally, much of the research described in this textbook has been supported
by dedicated individuals at non-profit organizations like BRAC, Innovations for
Poverty Action, the Abu Latif Jameel Poverty Action Lab, Evidence Action, and
GiveDirectly. We are grateful for their meticulous, creative, and tireless work in
the domain of economic development. We are also grateful to all of the research
participants, individual contributors, chapter authors, and communities whose life
experiences are represented in this book. Your efforts are helping to put innovation
to work for the resilience of people and planet.
Contents
1
Introduction to Development Engineering. . . . . . . . . . . . . . . . . . . . . . . . . . . . . . .
Anustubh Agnihotri, Temina Madon, and Ashok J. Gadgil
1
2
Technology and Development . . . . . . . . . . . . . . . . . . . . . . . . . . . . . . . . . . . . . . . . . . . . .
Menna Bishop, Robin Burgess, and Céline Zipfel
17
3
A Practical Framework for Research . . . . . . . . . . . . . . . . . . . . . . . . . . . . . . . . . . . .
Temina Madon, Anustubh Agnihotri, and Ashok J. Gadgil
59
4
Asking the “Right” Questions . . . . . . . . . . . . . . . . . . . . . . . . . . . . . . . . . . . . . . . . . . . . .
Temina Madon and Kentaro Toyama
83
Part I
Expanding Access to Affordable and Reliable Energy,
While Minimizing the Environmental Impacts
Kenneth Lee
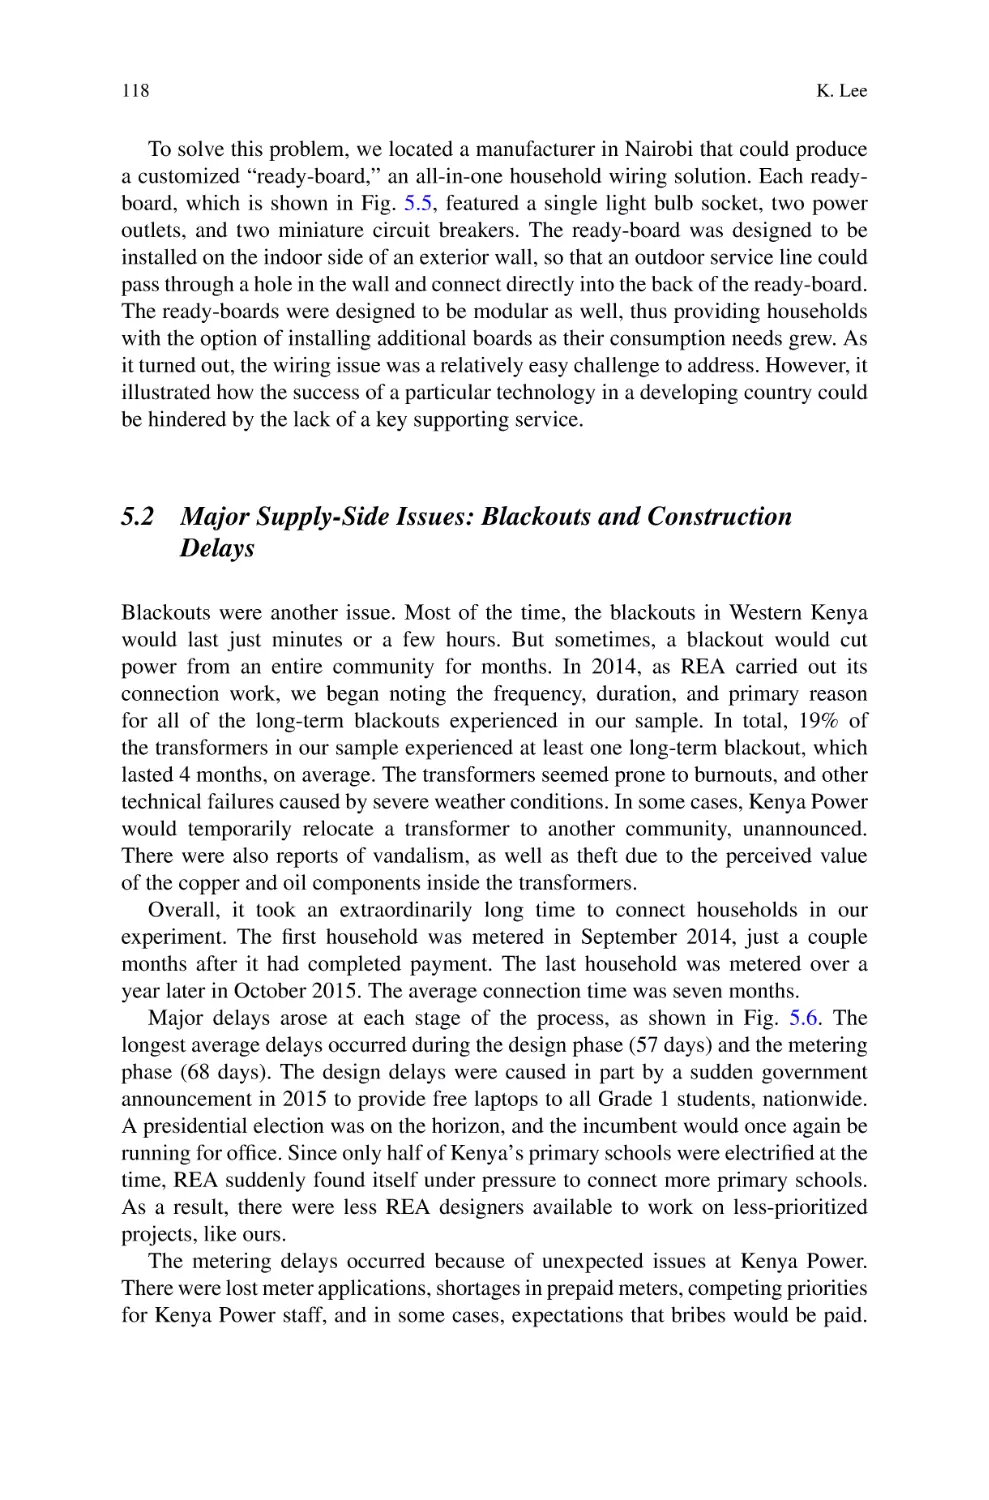
5
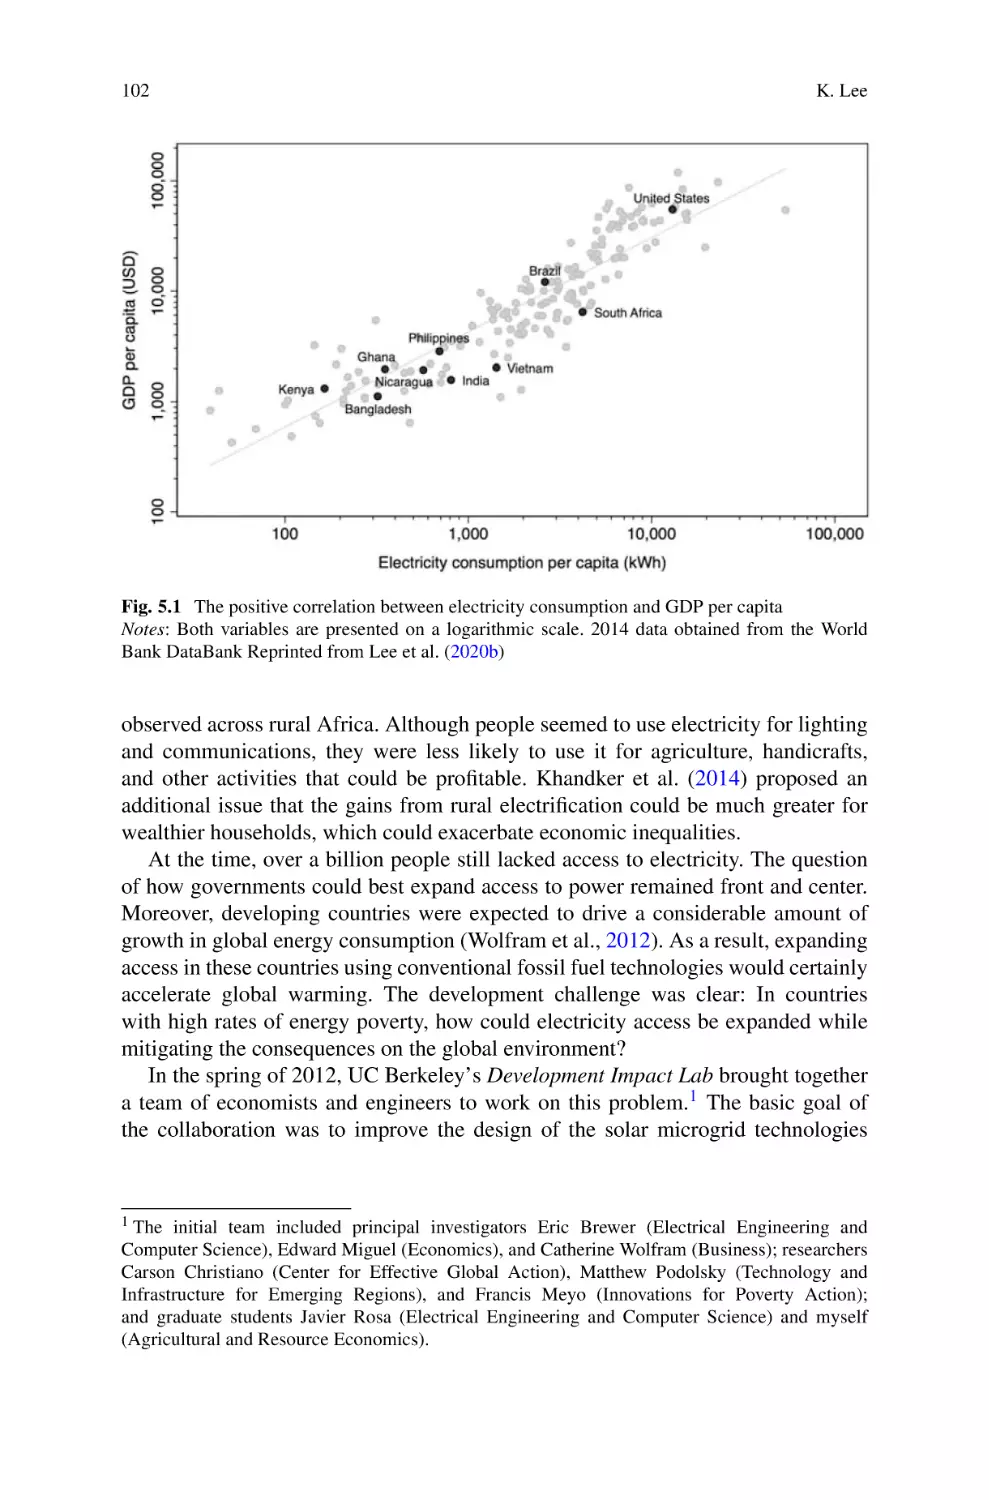
Expanding Access to Electricity in Kenya . . . . . . . . . . . . . . . . . . . . . . . . . . . . . . . 101
Kenneth Lee
6
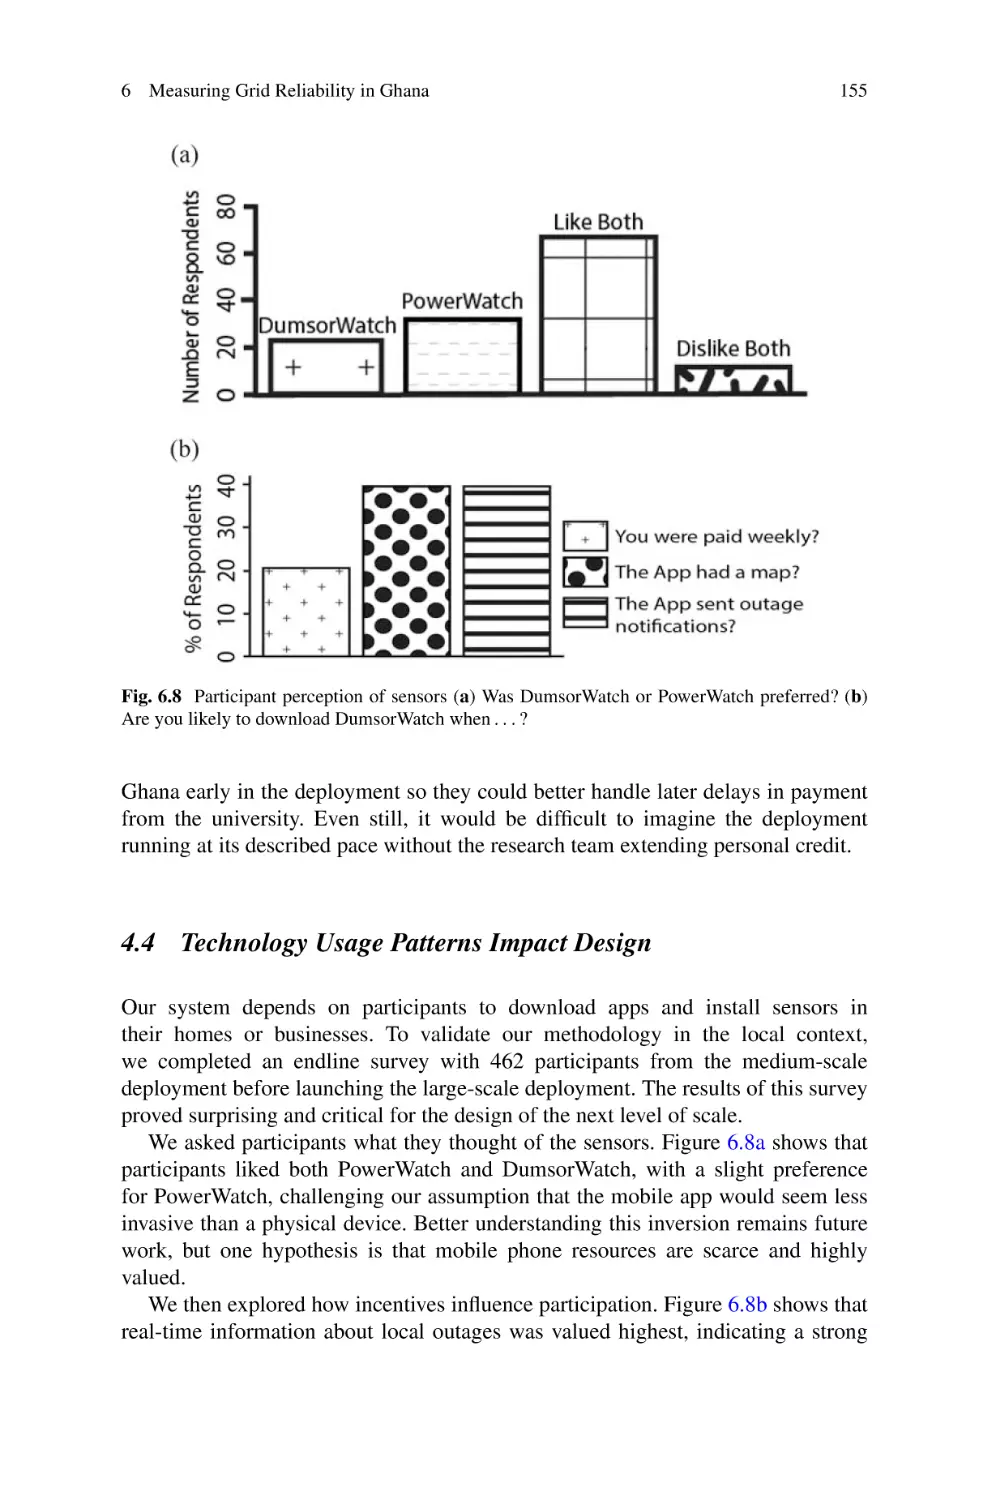
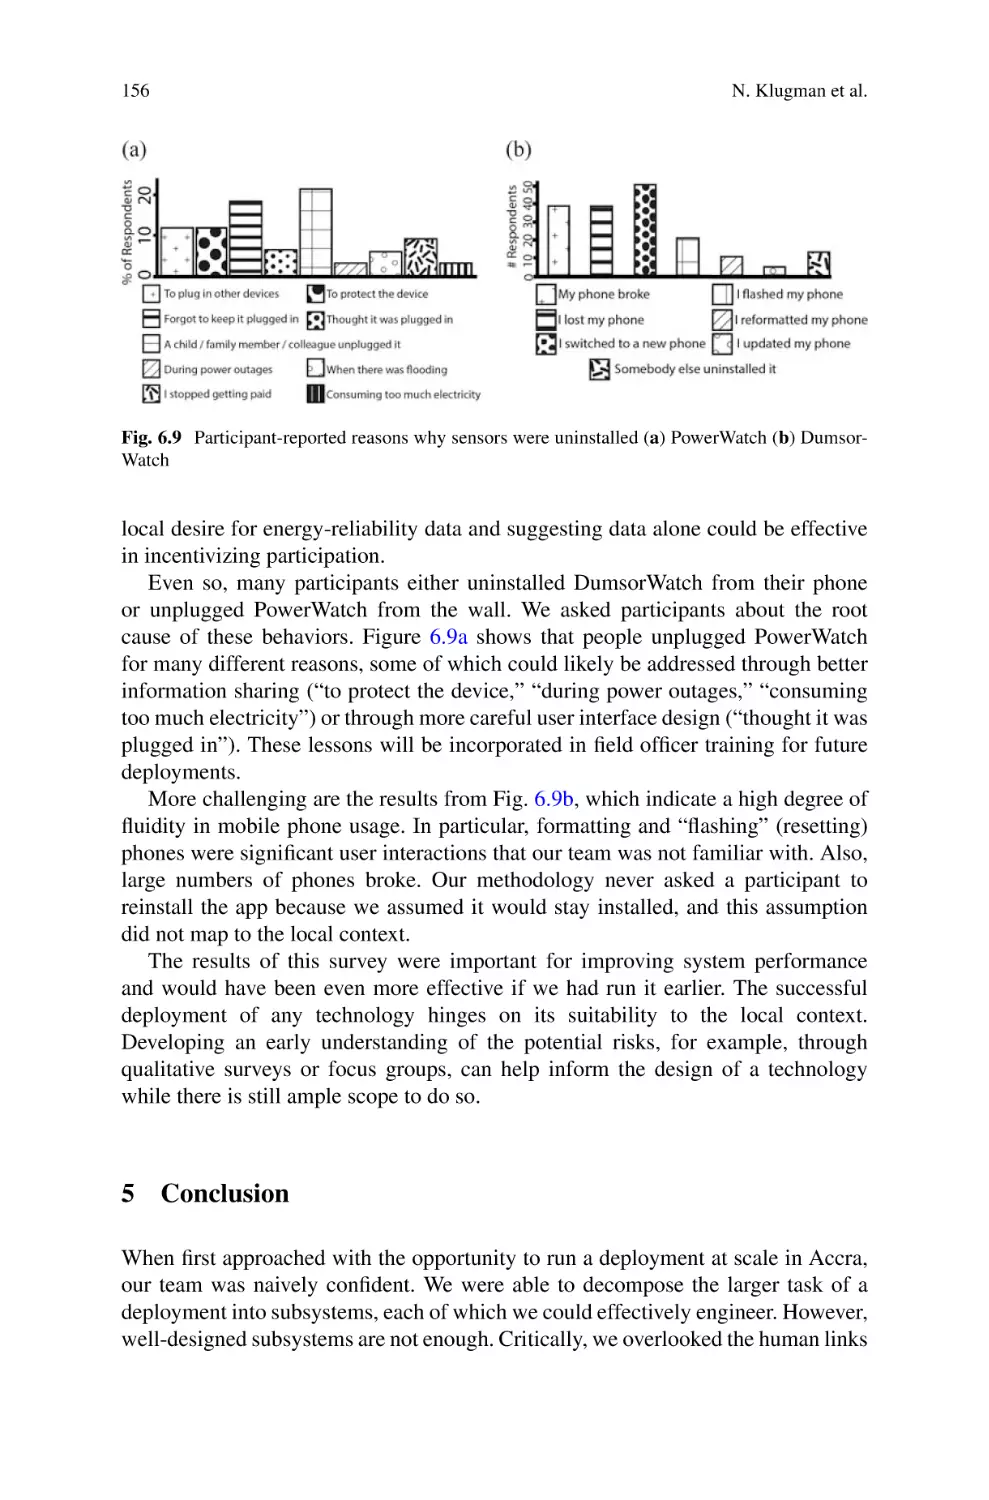
Measuring Grid Reliability in Ghana . . . . . . . . . . . . . . . . . . . . . . . . . . . . . . . . . . . . 129
Noah Klugman, Joshua Adkins, Susanna Berkouwer,
Kwame Abrokwah, Matthew Podolsky, Pat Pannuto,
Catherine Wolfram, Jay Taneja, and Prabal Dutta
7
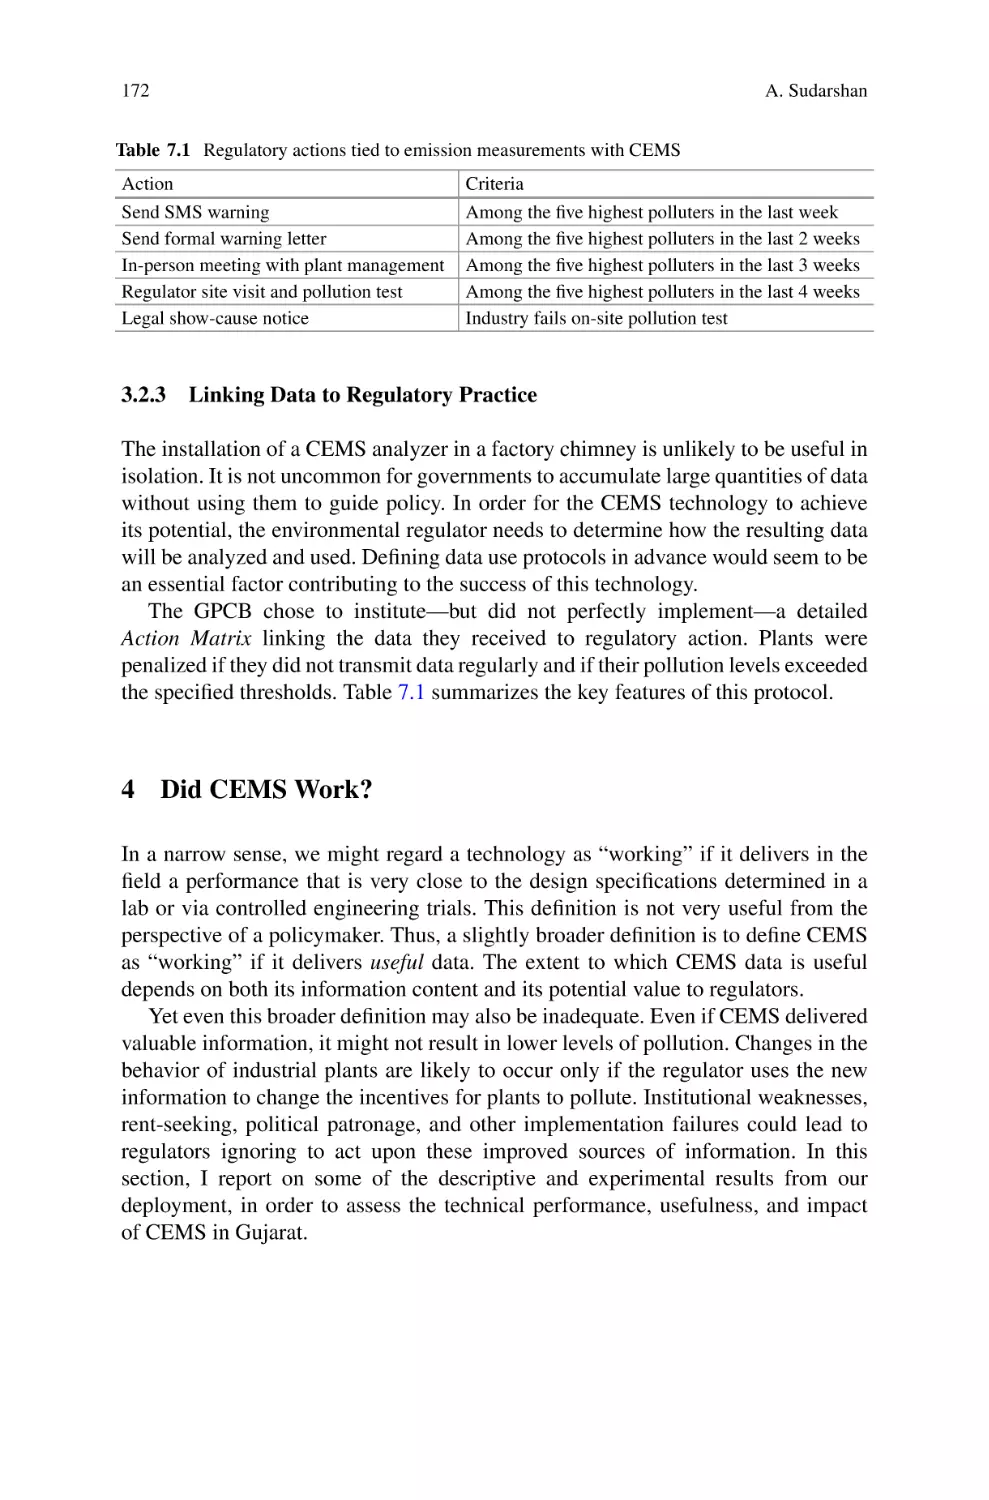
Monitoring Industrial Pollution in India . . . . . . . . . . . . . . . . . . . . . . . . . . . . . . . . 161
Anant Sudarshan
Part II Market Performance: Technologies to Improve
Agricultural Market Performance
Lorenzo Casaburi
8
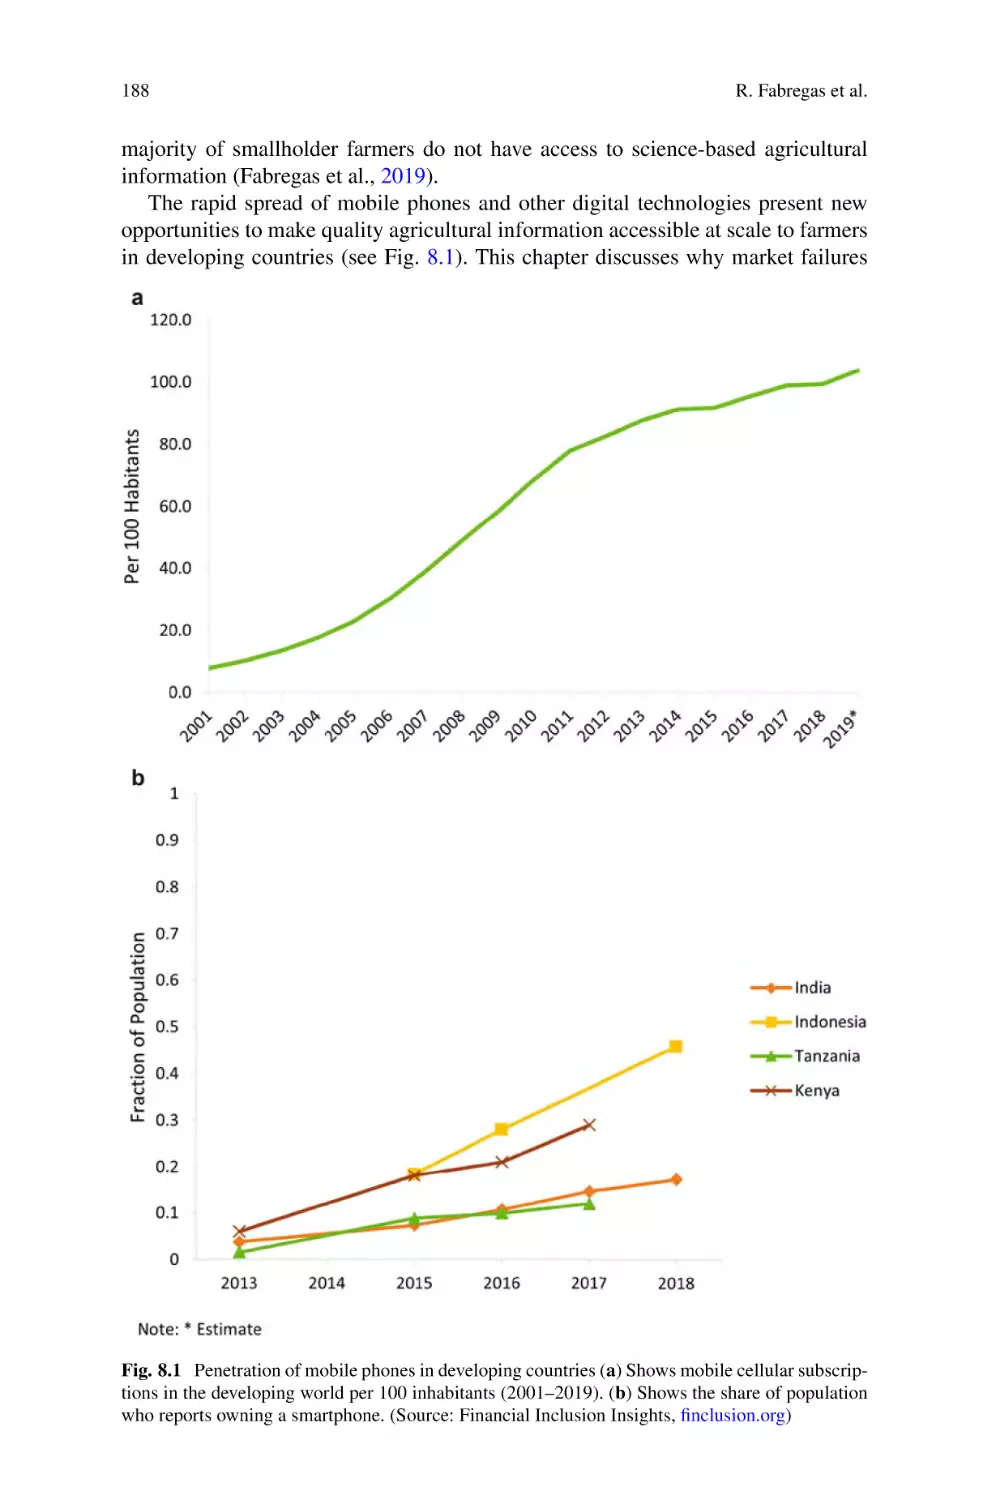
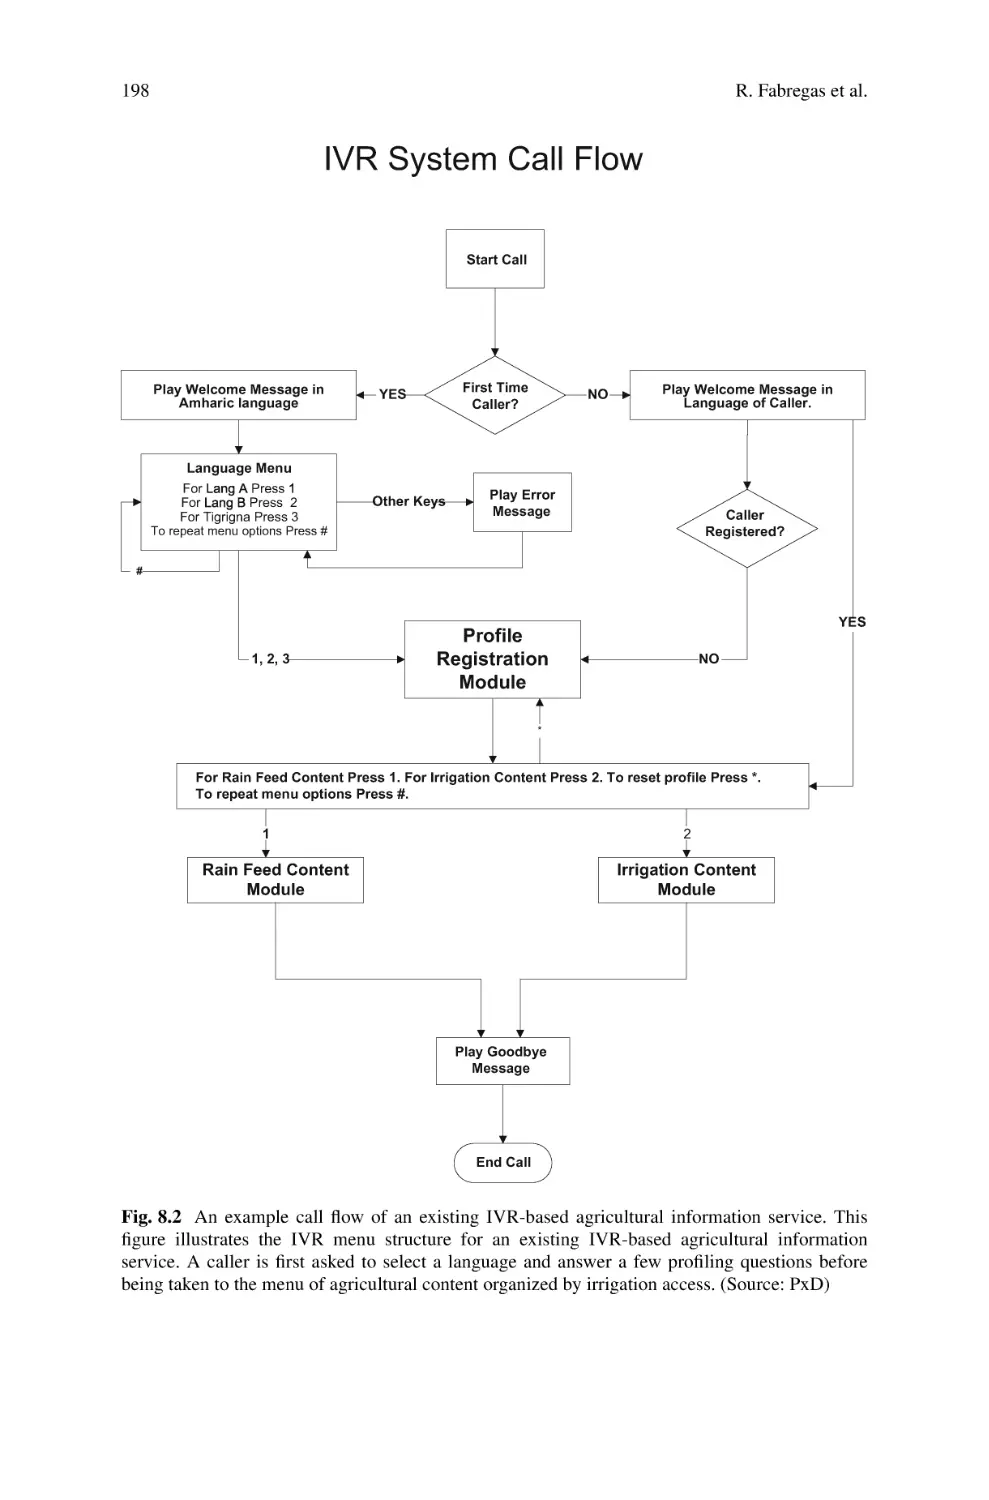
Digital Agricultural Extension for Development . . . . . . . . . . . . . . . . . . . . . . . . 187
Raissa Fabregas, Tomoko Harigaya, Michael Kremer,
and Ravindra Ramrattan
xi
xii
Contents
9
Digital Trading and Market Platforms: Ghana Case Study . . . . . . . . . . . 221
Keren Neza, Yaw Nyarko, and Angela Orozco
10
Fintech for Rural Markets in Sub-Saharan Africa . . . . . . . . . . . . . . . . . . . . . 247
Jenny C. Aker
Part III Expanding Human Potential: Technology-Based
Solutions for Education and Labor
Temina Madon
11
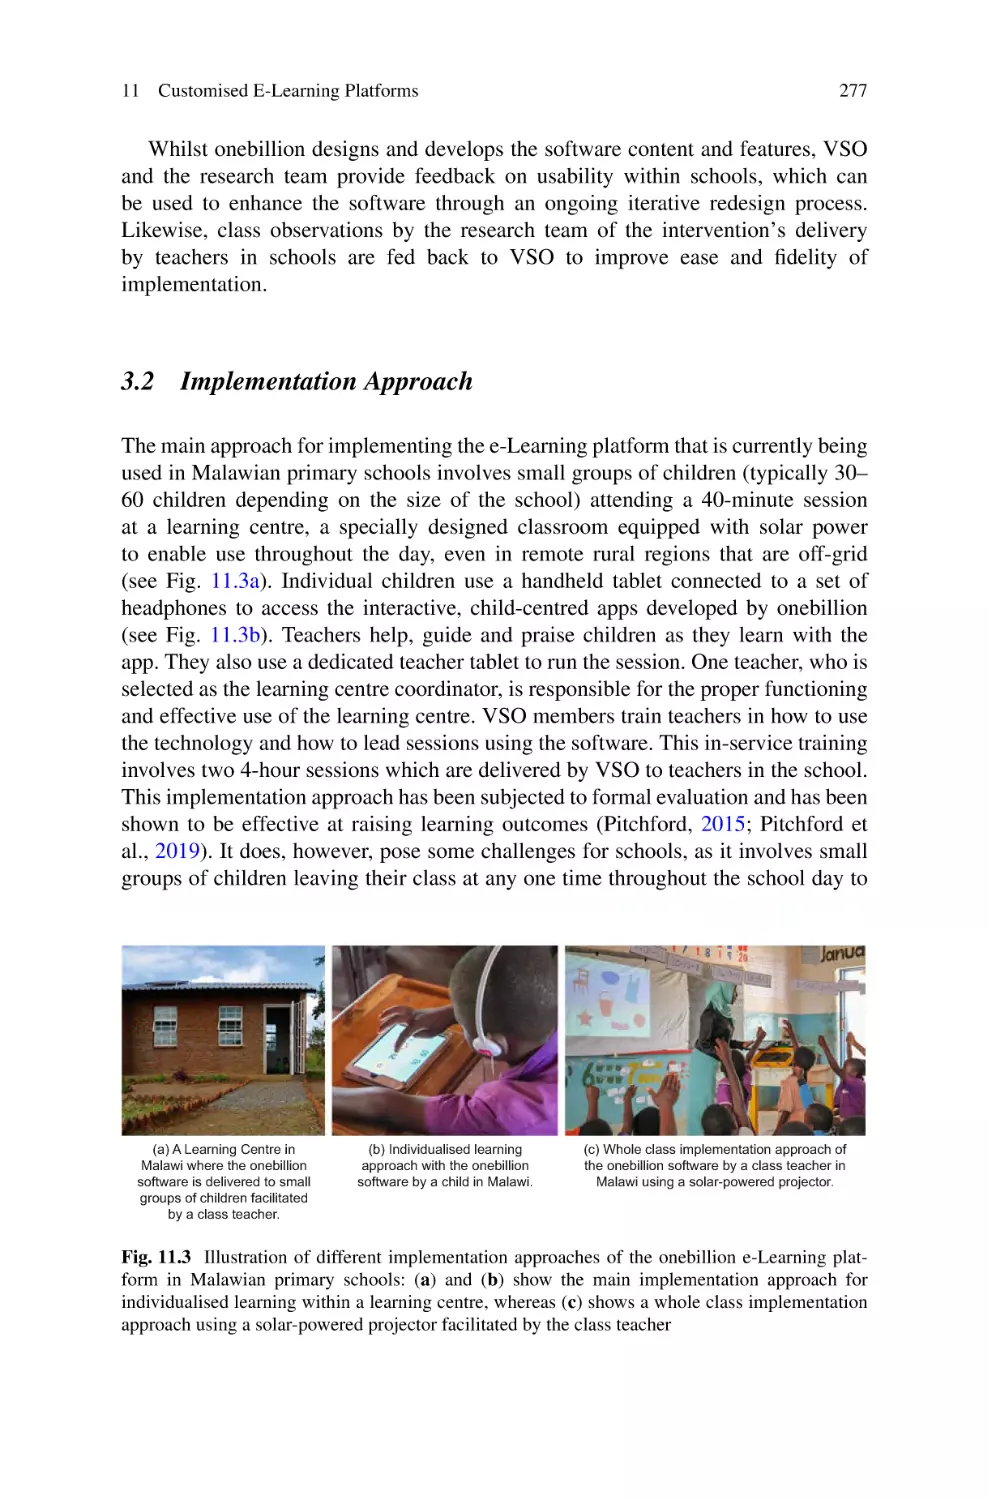
Customised E-Learning Platforms . . . . . . . . . . . . . . . . . . . . . . . . . . . . . . . . . . . . . . . 269
Nicola Pitchford
12
Digital Networking and the Case of Youth Unemployment
in South Africa . . . . . . . . . . . . . . . . . . . . . . . . . . . . . . . . . . . . . . . . . . . . . . . . . . . . . . . . . . . . . . 293
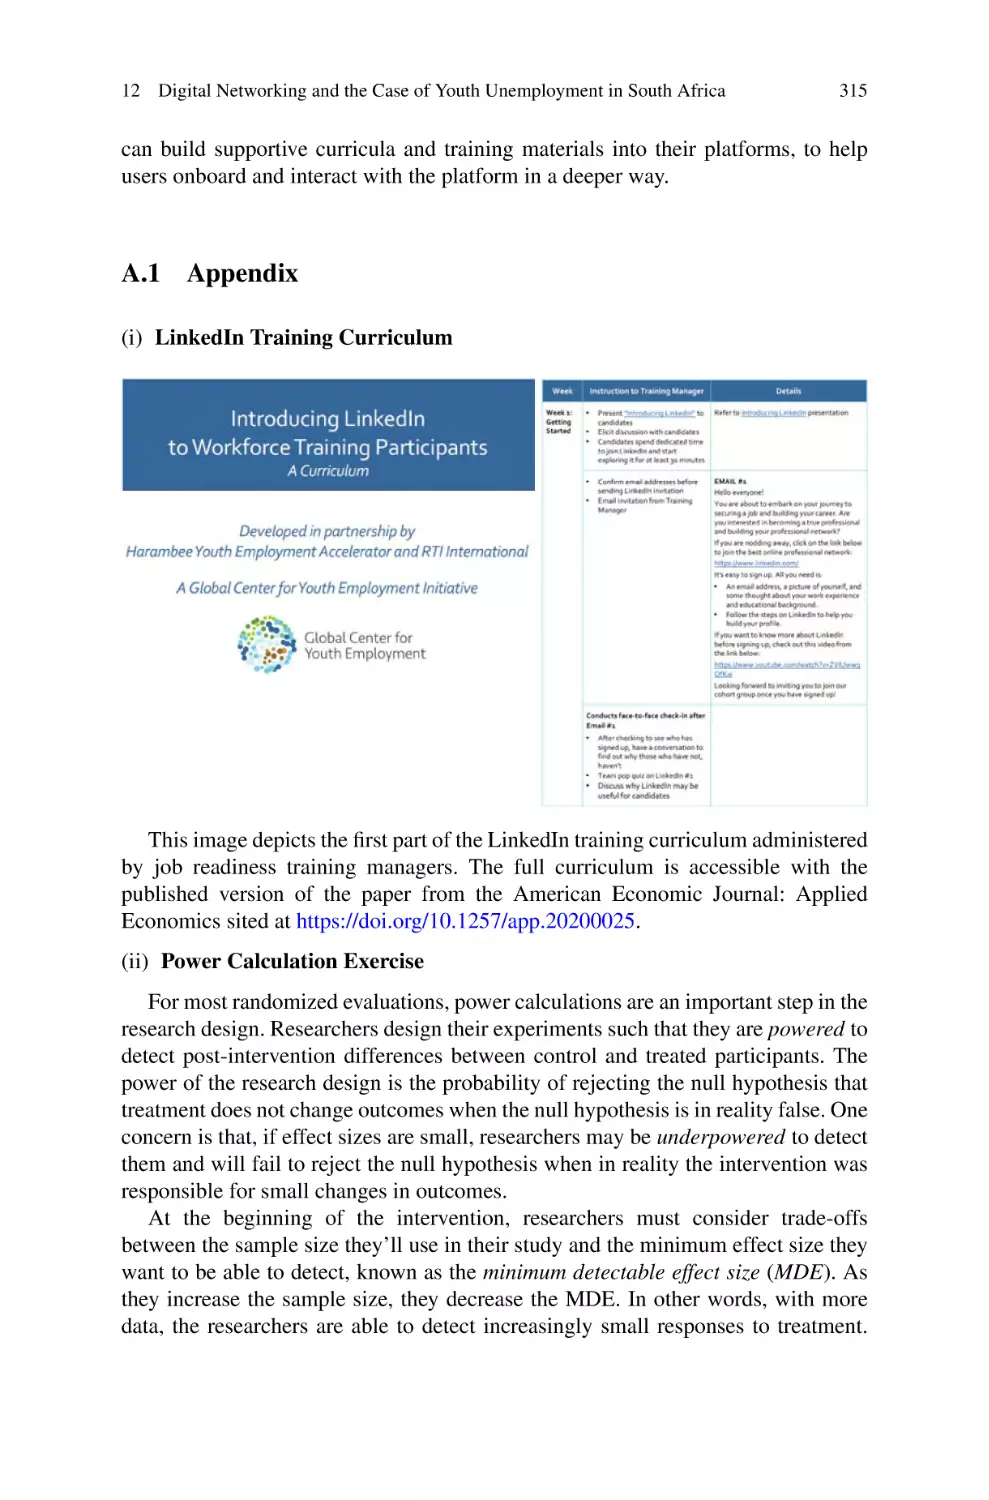
Patrick Shaw and Laurel Wheeler
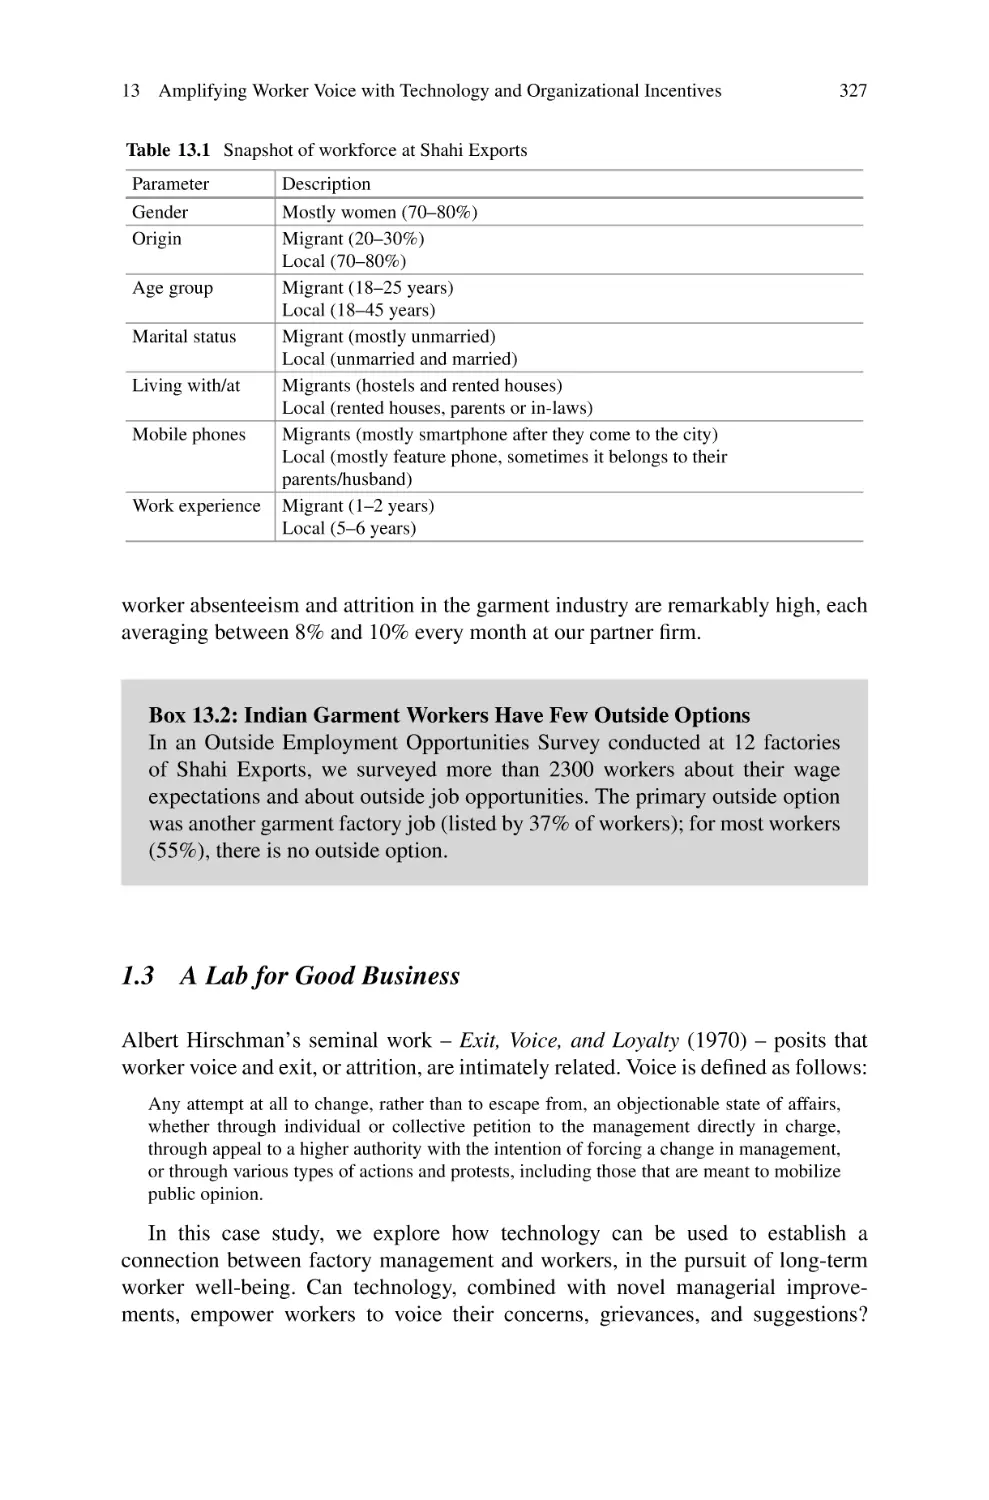
13
Amplifying Worker Voice with Technology and
Organizational
Incentives . . . . . . . . . . . . . . . . . . . . . . . . . . . . . . . . . . . . . . . . . . . . . . . . . . . . . . . . . . . . . . . . . . . . 323
Achyuta Adhvaryu, Smit Gade, Piyush Gandhi, Lavanya Garg,
Mansi Kabra, Ankita Nanda, Anant Nyshadham, Arvind Patil,
and Mamta Pimoli
Part IV Water, Health, and Sanitation
Ashok J. Gadgil
14
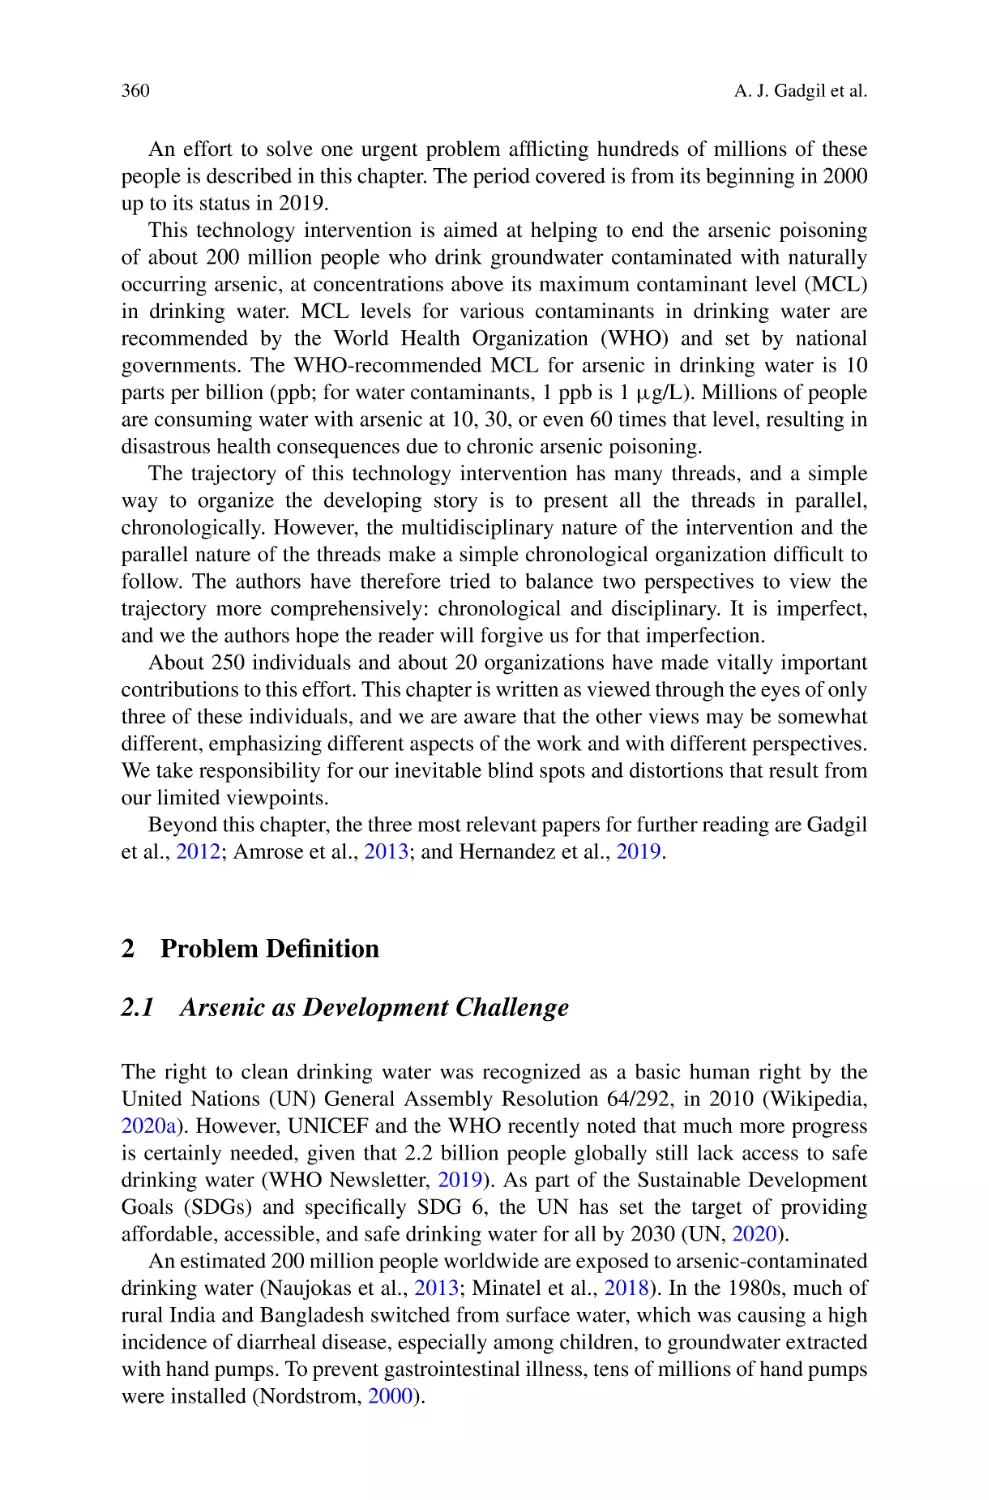
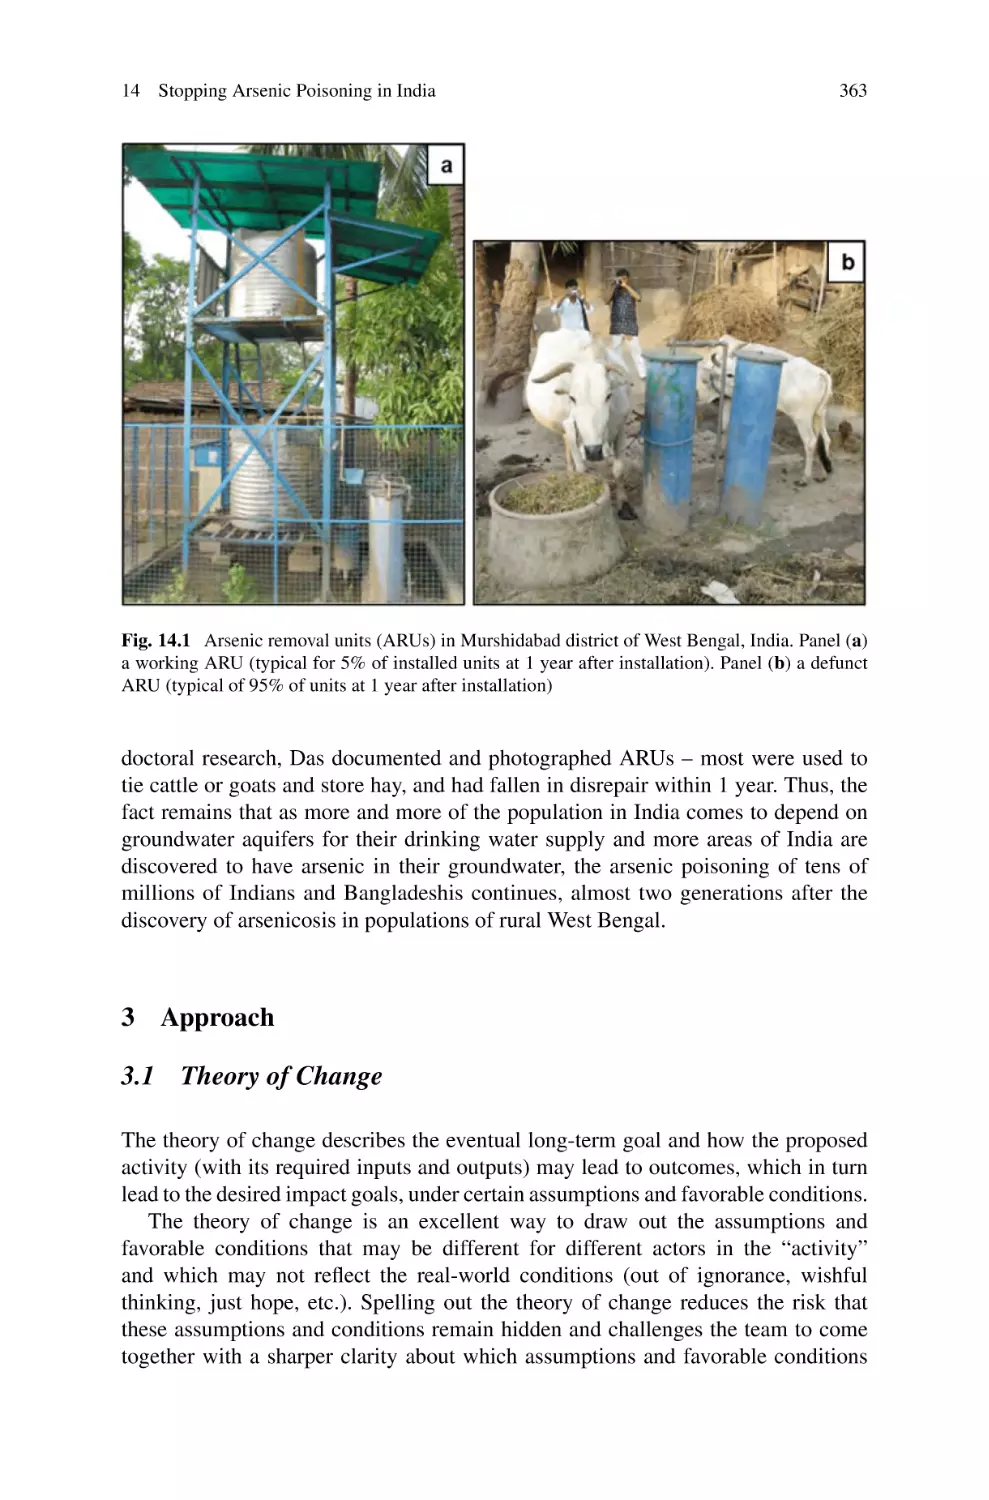
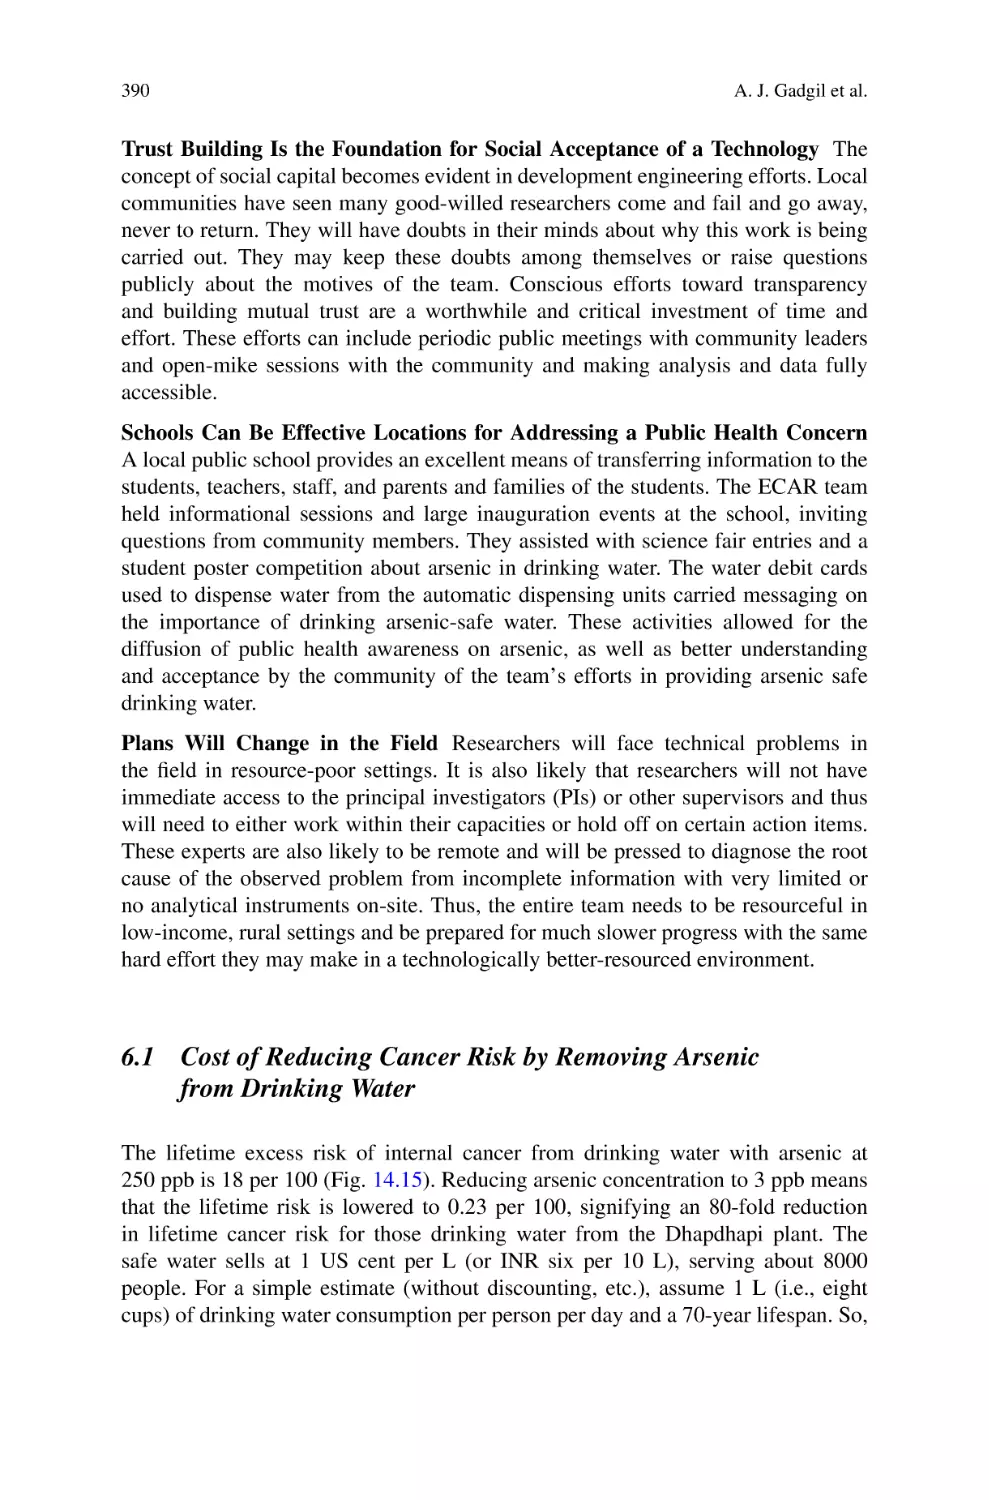
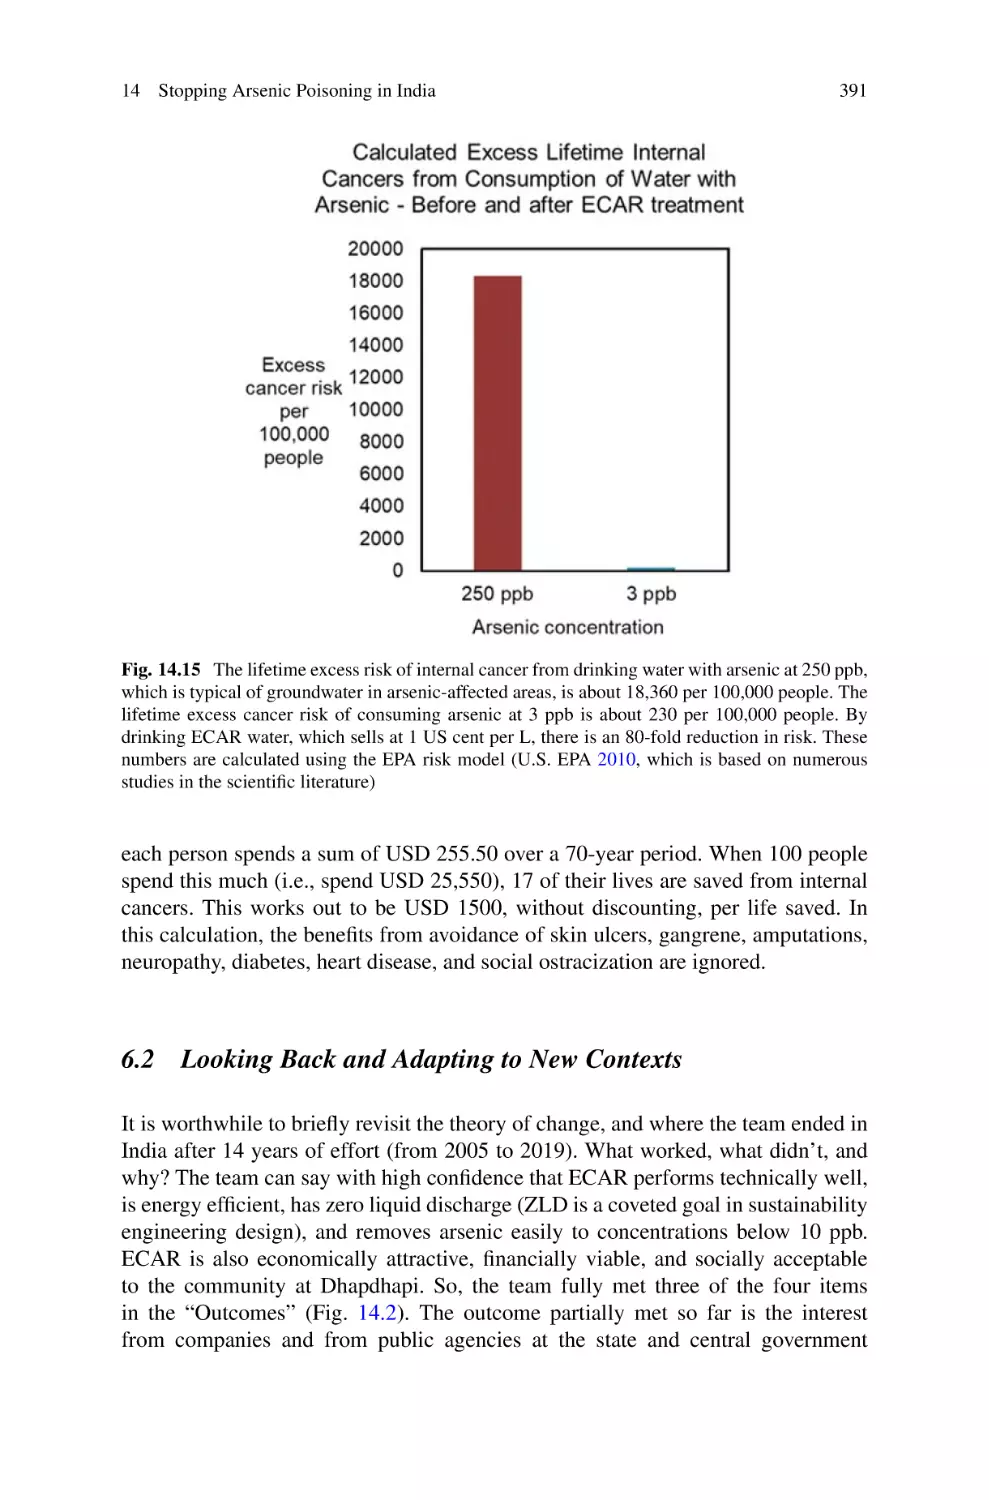
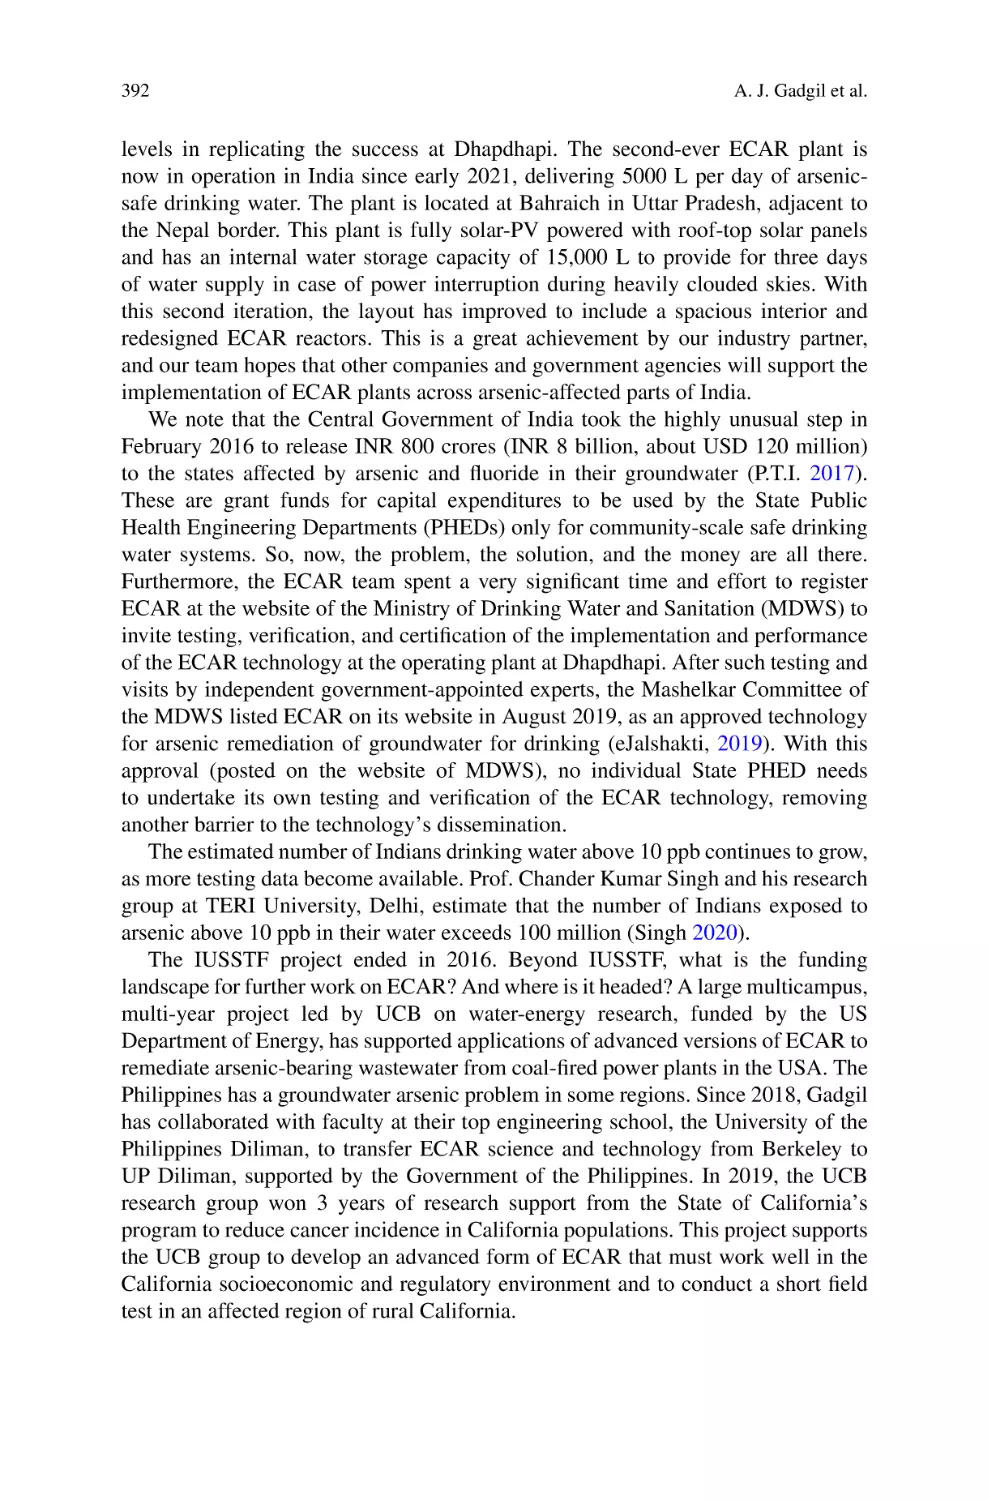
Stopping Arsenic Poisoning in India . . . . . . . . . . . . . . . . . . . . . . . . . . . . . . . . . . . . . 359
Ashok J. Gadgil, Susan Amrose, and Dana Hernandez
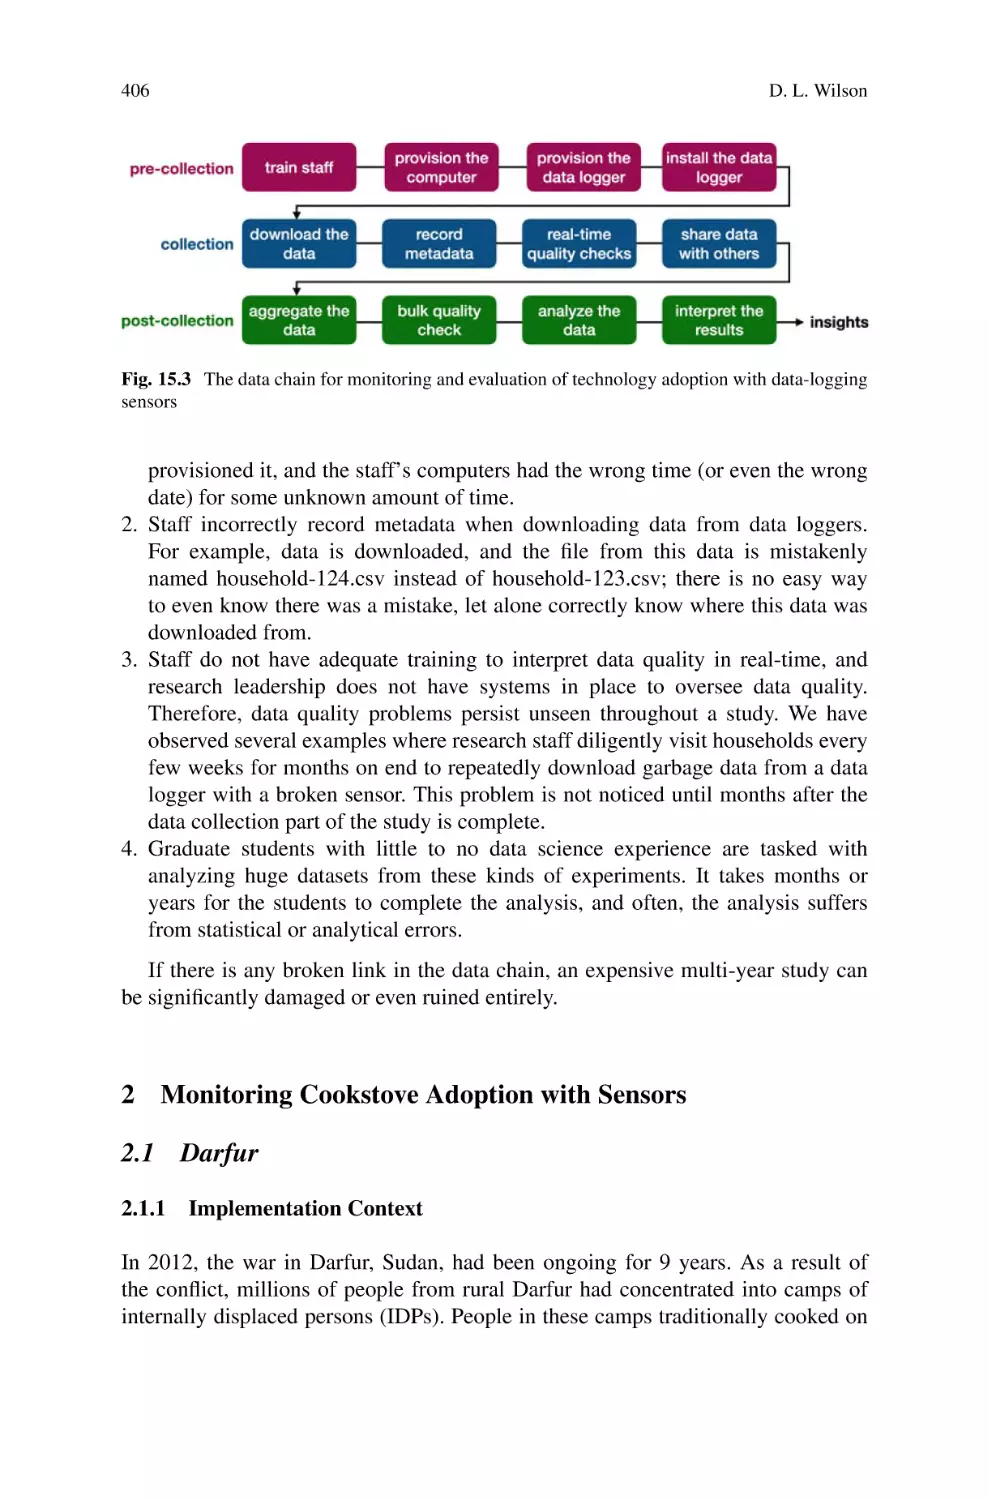
15
Sensing Change: Measuring Cookstove Adoption
with Internet-of-Things Sensors . . . . . . . . . . . . . . . . . . . . . . . . . . . . . . . . . . . . . . . . . . 399
Daniel L. Wilson
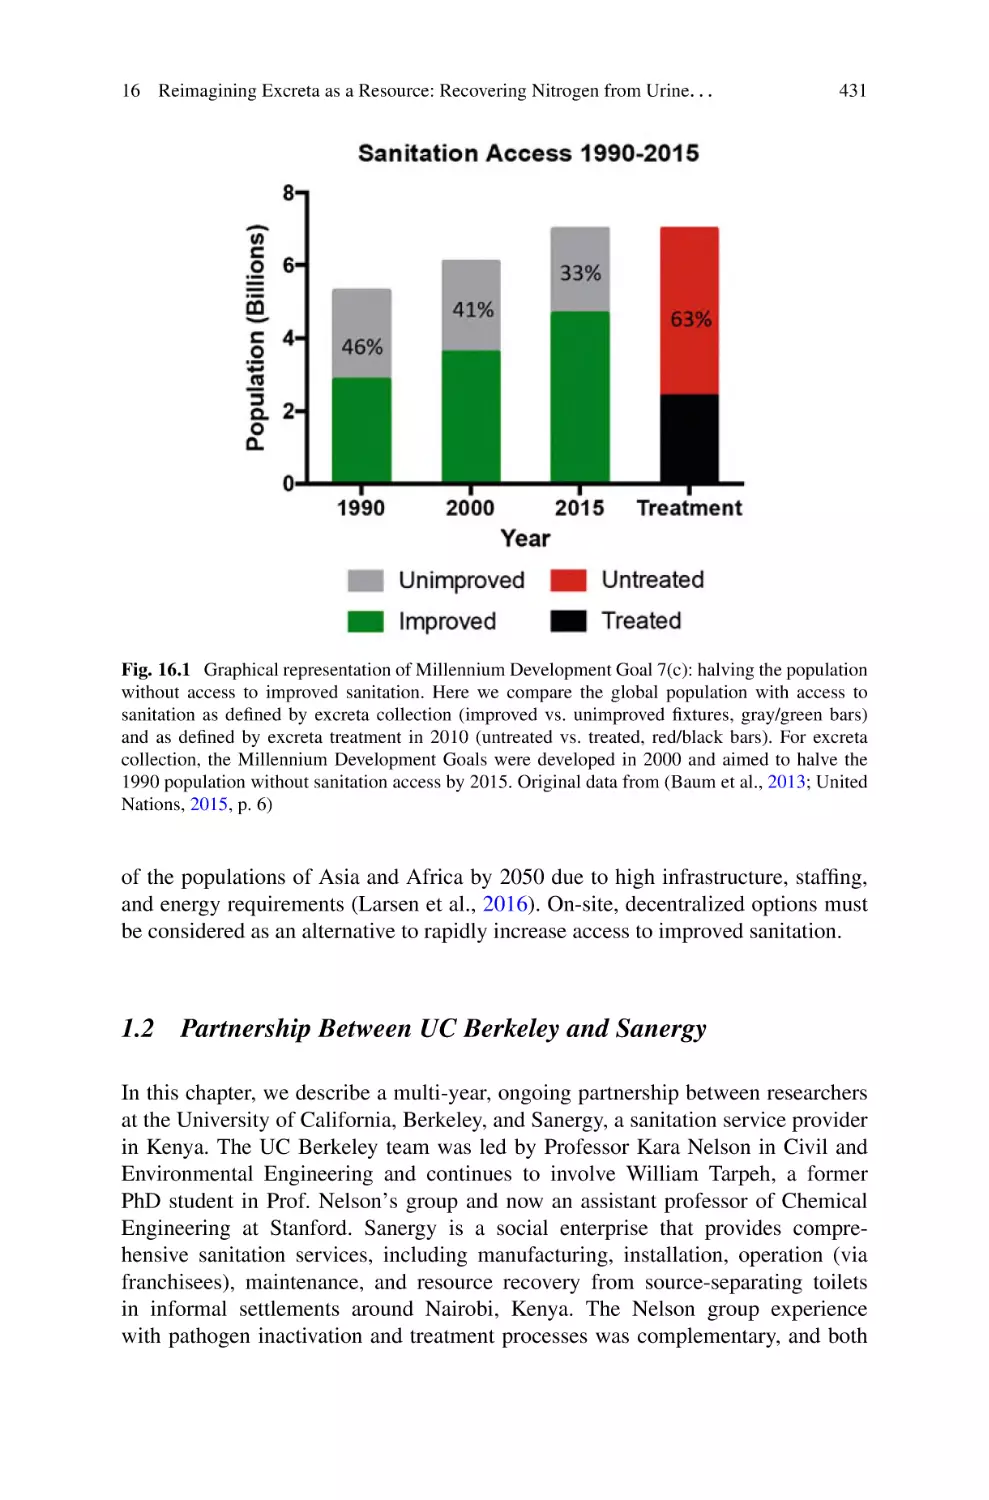
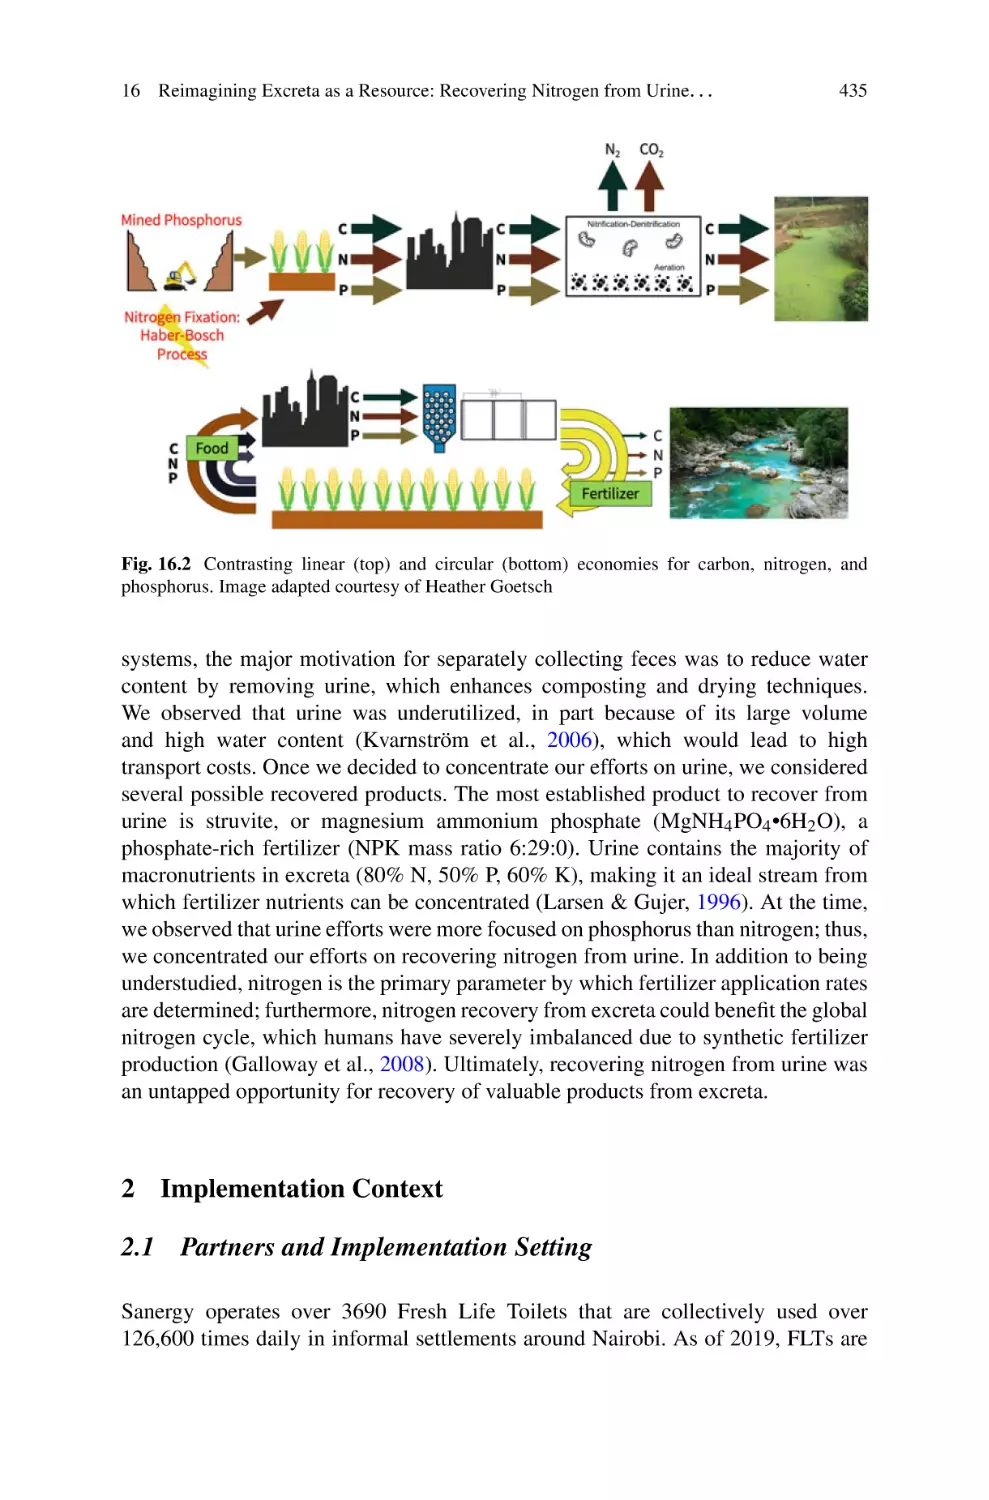
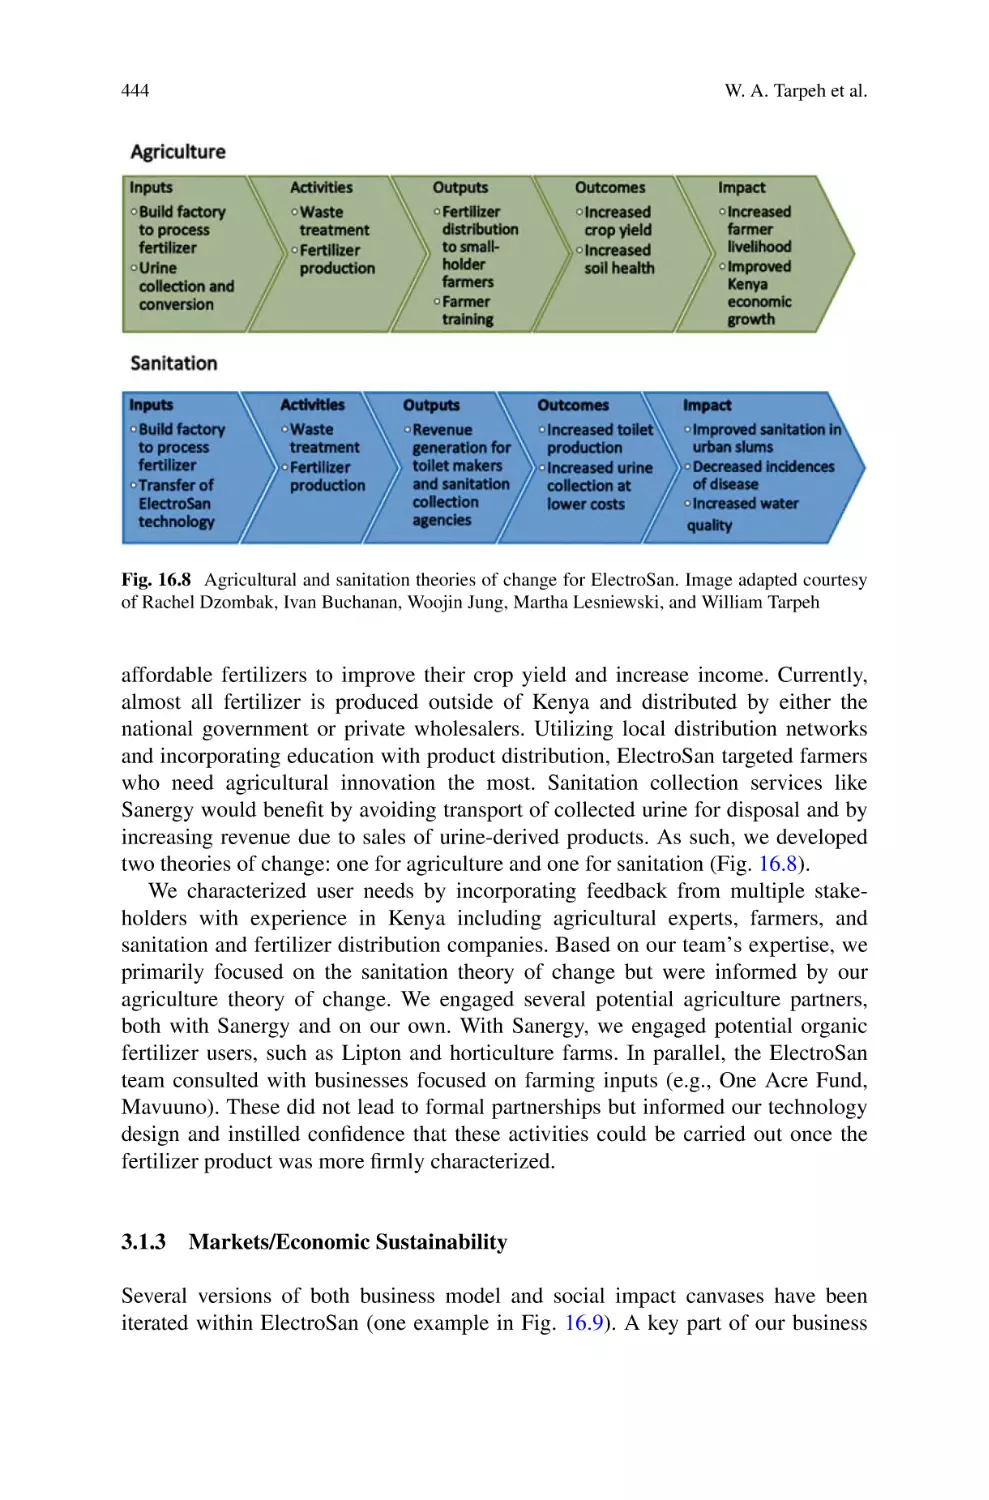
16
Reimagining Excreta as a Resource: Recovering Nitrogen
from Urine in Nairobi, Kenya . . . . . . . . . . . . . . . . . . . . . . . . . . . . . . . . . . . . . . . . . . . . . 429
William A. Tarpeh, Brandon D. Clark, Kara L. Nelson,
and Kevin D. Orner
17
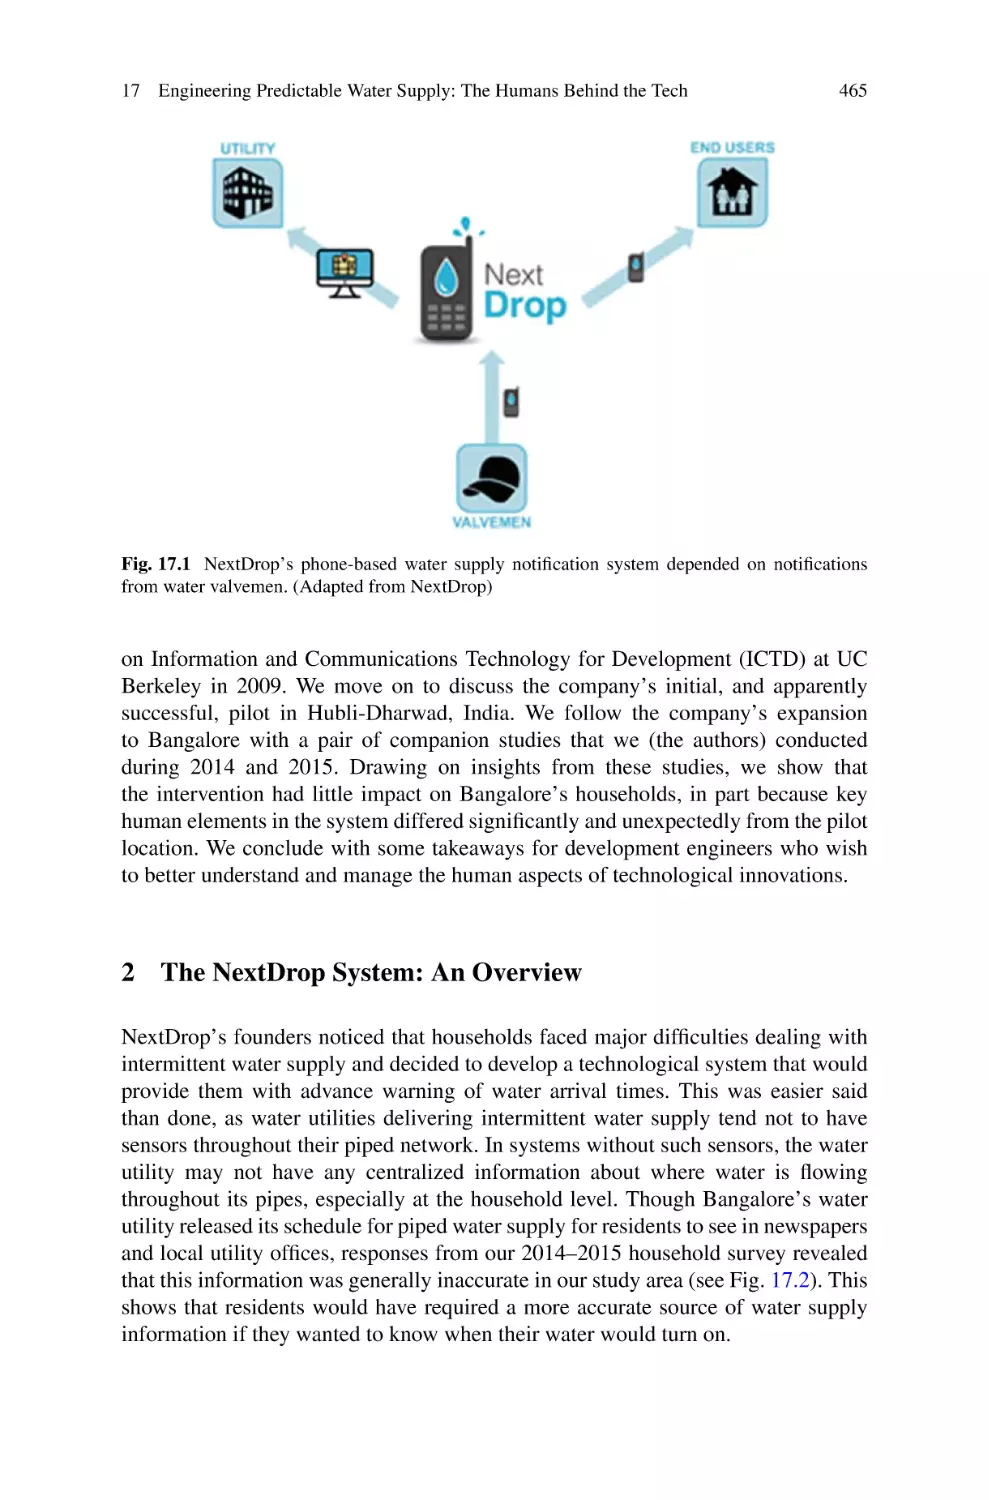
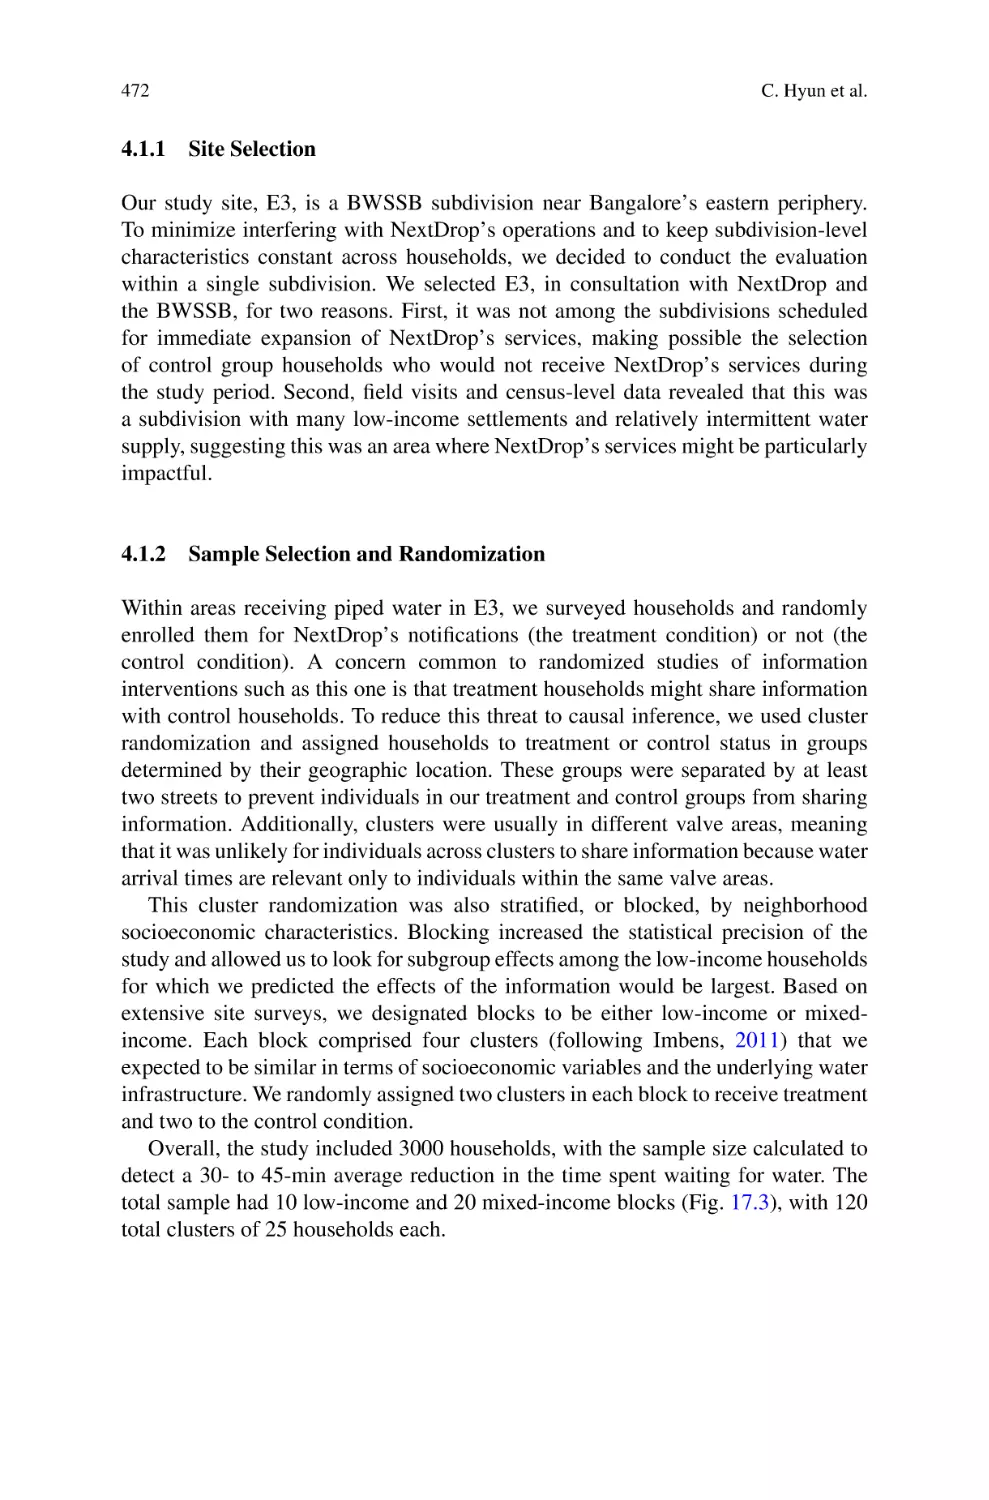
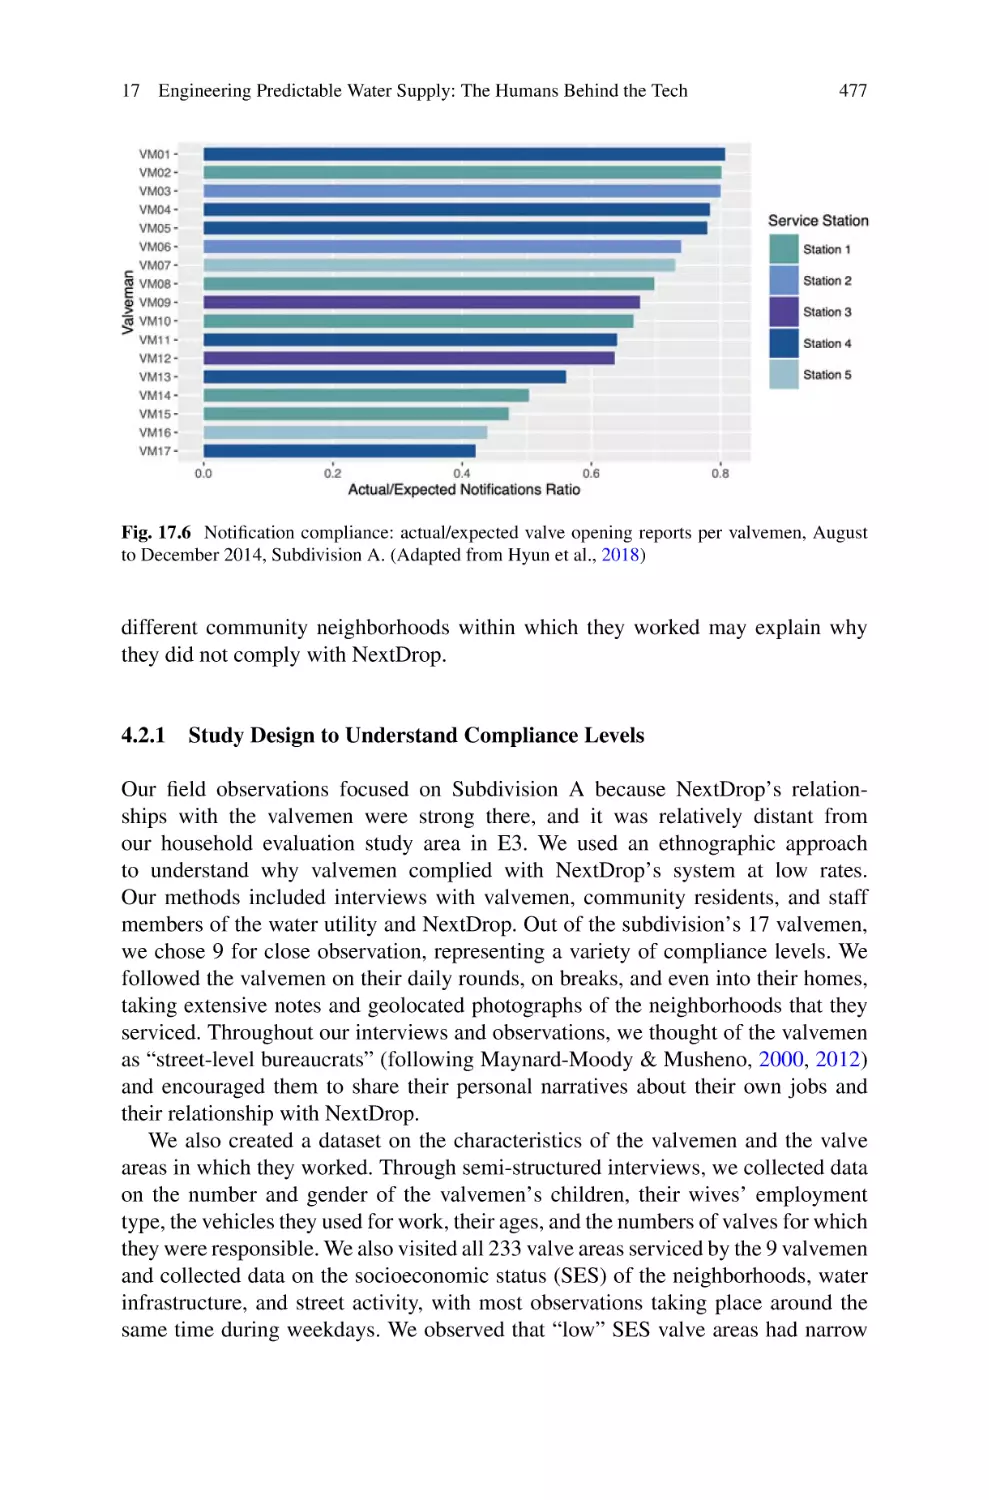
Engineering Predictable Water Supply: The Humans
Behind the Tech . . . . . . . . . . . . . . . . . . . . . . . . . . . . . . . . . . . . . . . . . . . . . . . . . . . . . . . . . . . . . 463
Christopher Hyun, Tanu Kumar, Alison E. Post, and Isha Ray
Part V Digital Governance
Arman Rezaee
18
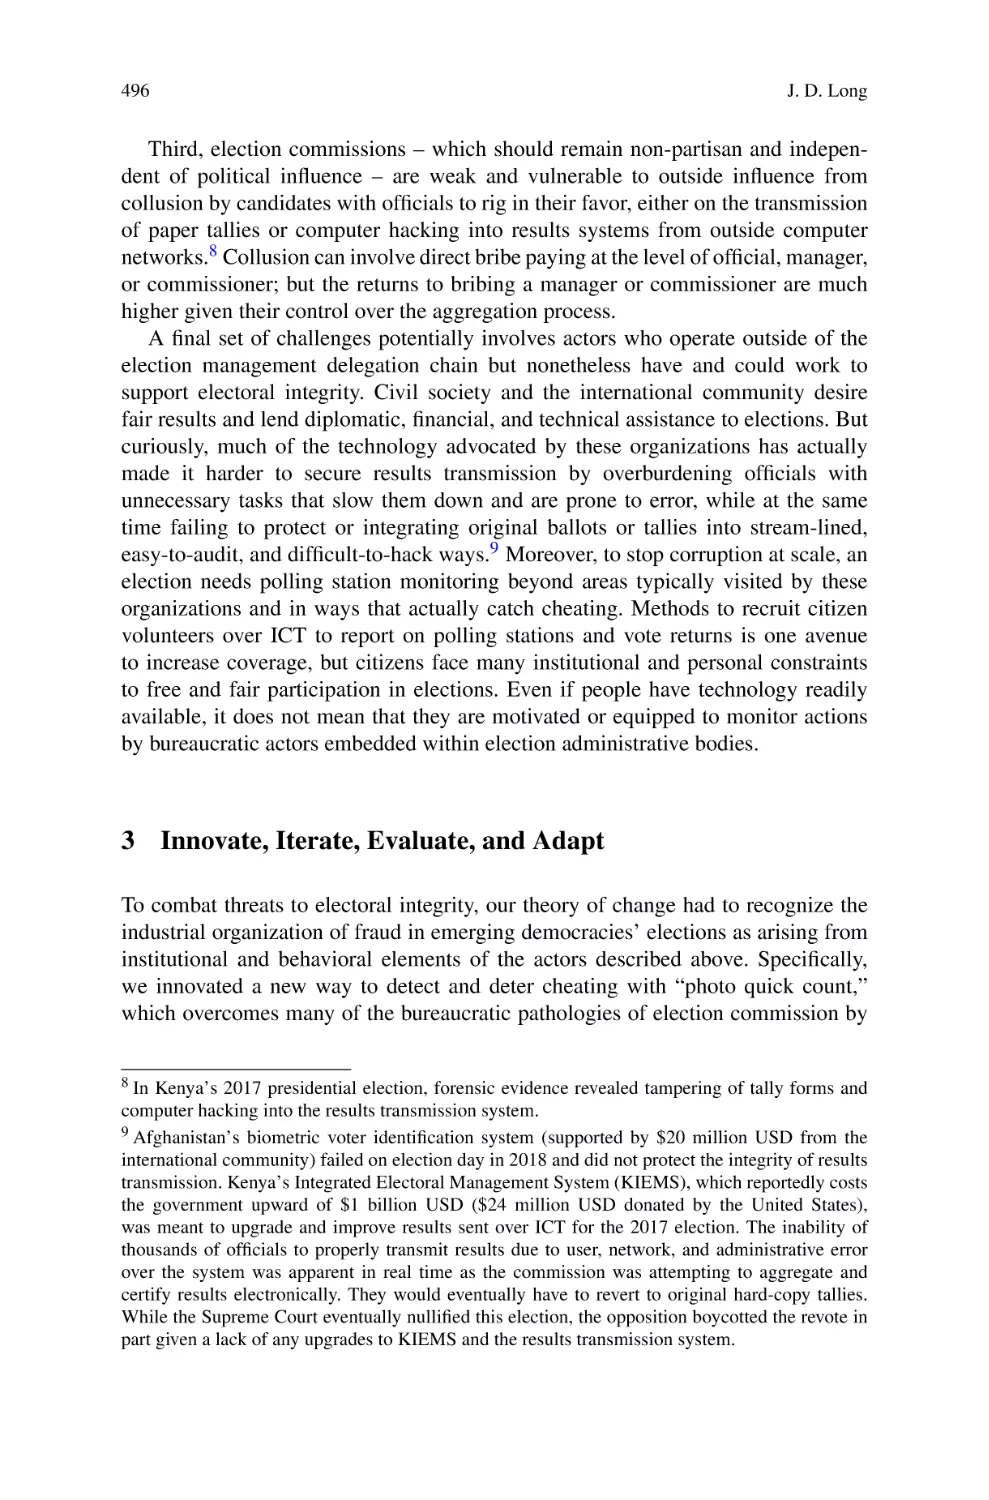
Protecting Electoral Integrity in Emerging Democracies . . . . . . . . . . . . . . 489
James D. Long
Contents
xiii
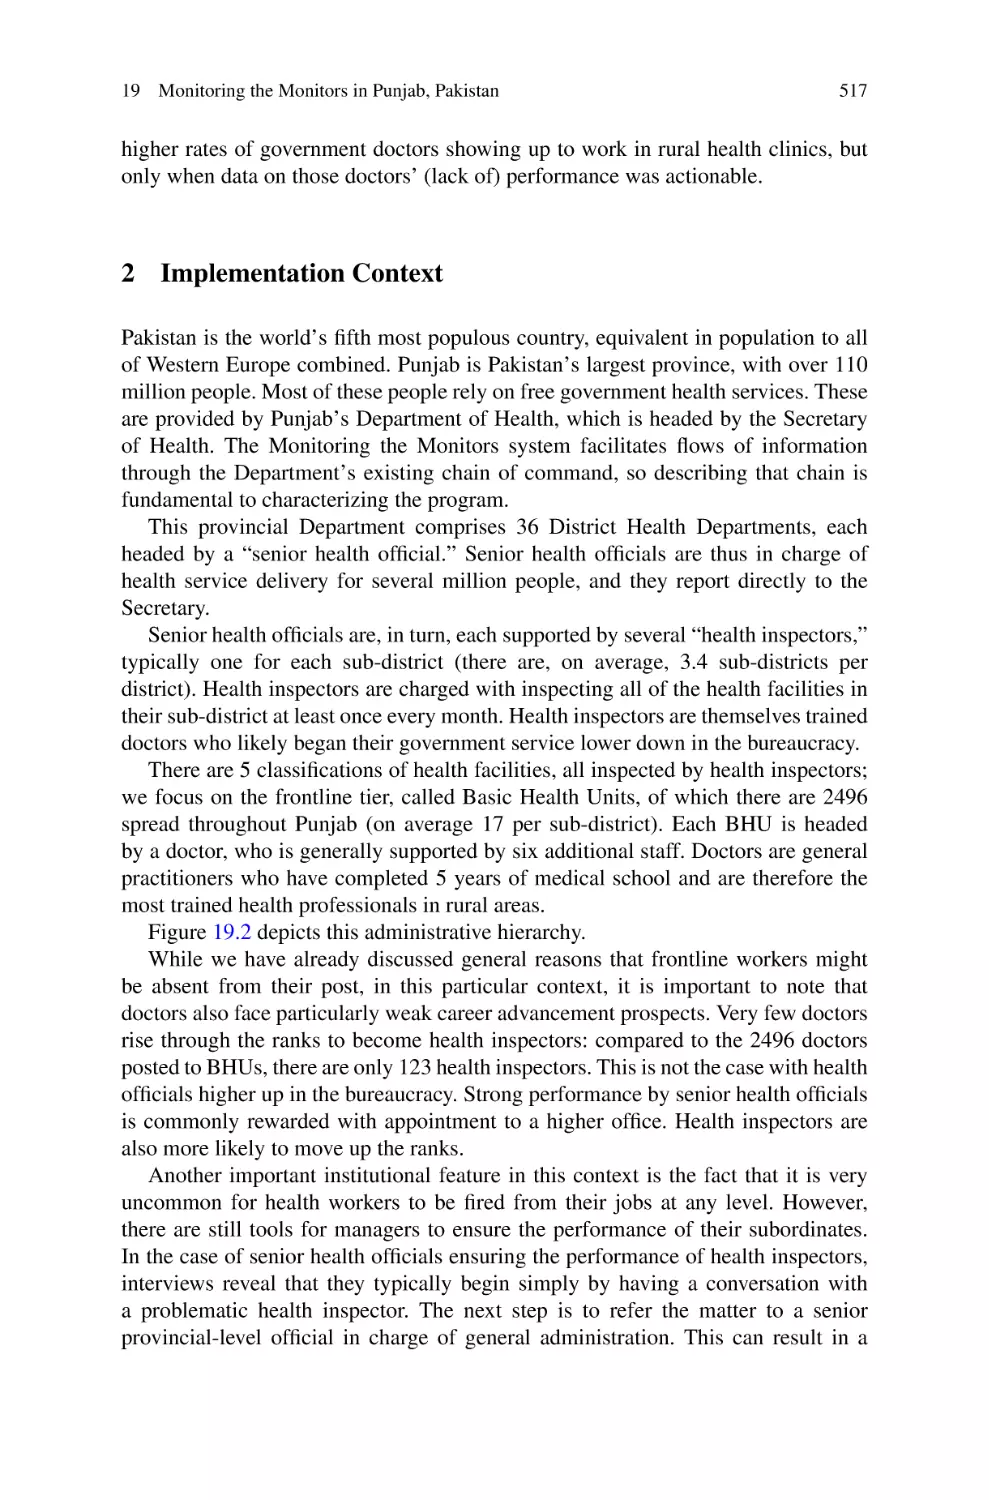
19
Monitoring the Monitors in Punjab, Pakistan . . . . . . . . . . . . . . . . . . . . . . . . . . 513
Arman Rezaee
20
Digital Public Services: The Development of Biometric
Authentication in India . . . . . . . . . . . . . . . . . . . . . . . . . . . . . . . . . . . . . . . . . . . . . . . . . . . . 533
Ashwin Nair and Burak Eskici
Part VI Connectivity: Digital Communication Technology
Richard Anderson
21
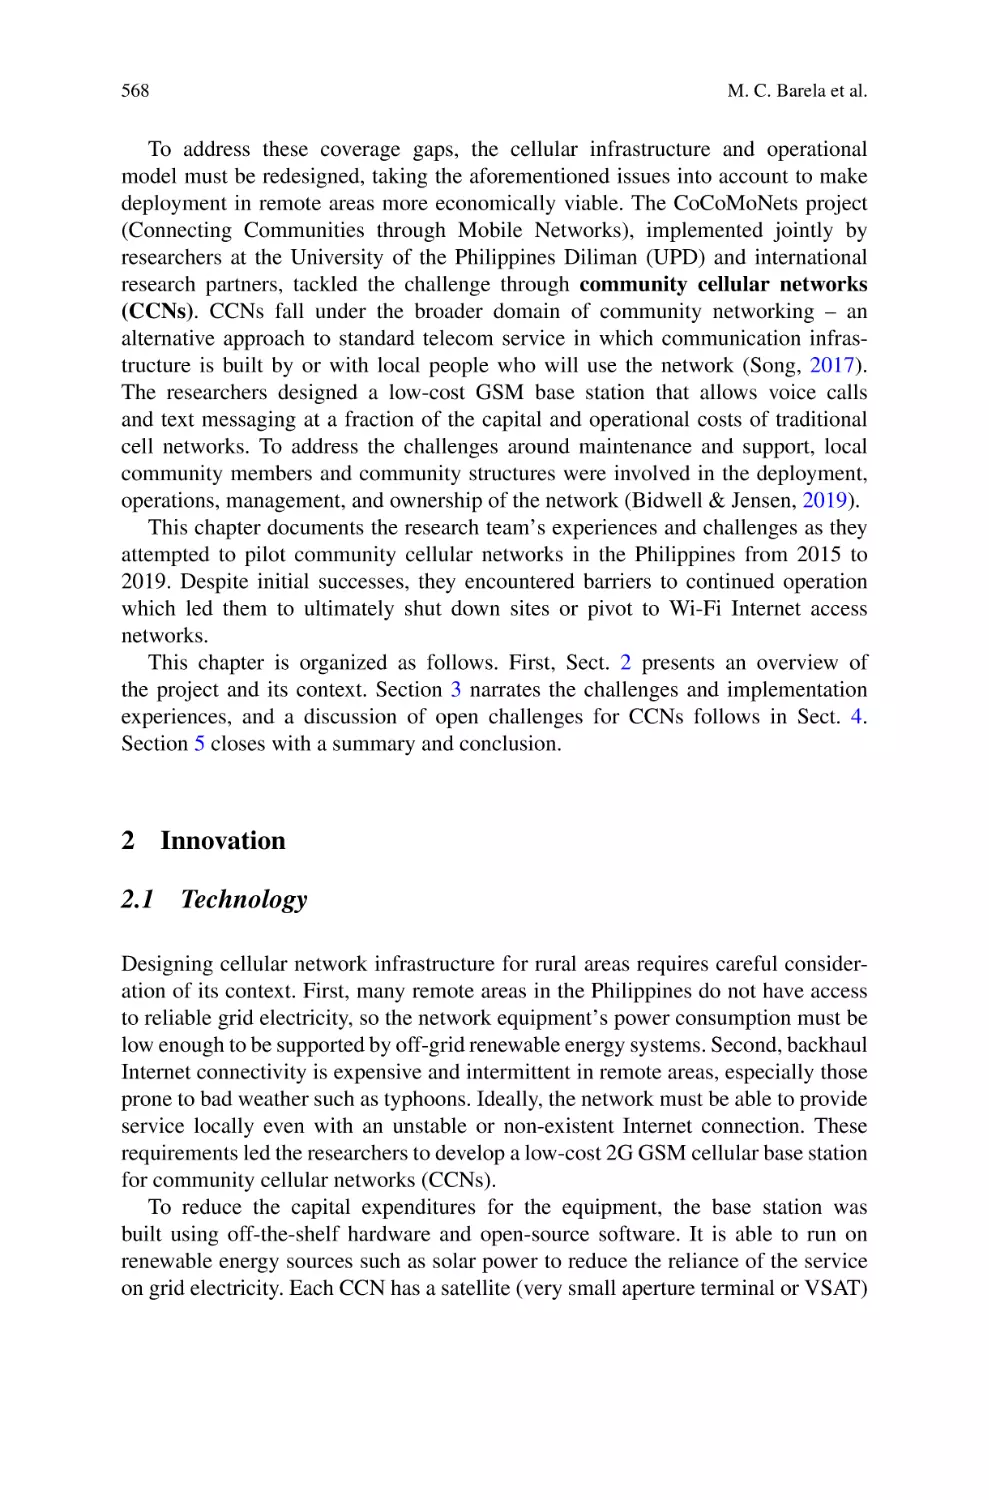
Connecting Communities Through Mobile Networks:
A Case Study of Implementing Community Cellular
Networks in the Philippines . . . . . . . . . . . . . . . . . . . . . . . . . . . . . . . . . . . . . . . . . . . . . . . 567
Mary Claire Barela, Maria Theresa Cunanan, Cedric Angelo Festin,
Kurtis Heimerl, Esther Jang, Matthew William Johnson,
Philip Martinez, and Ronel Vincent Vistal
22
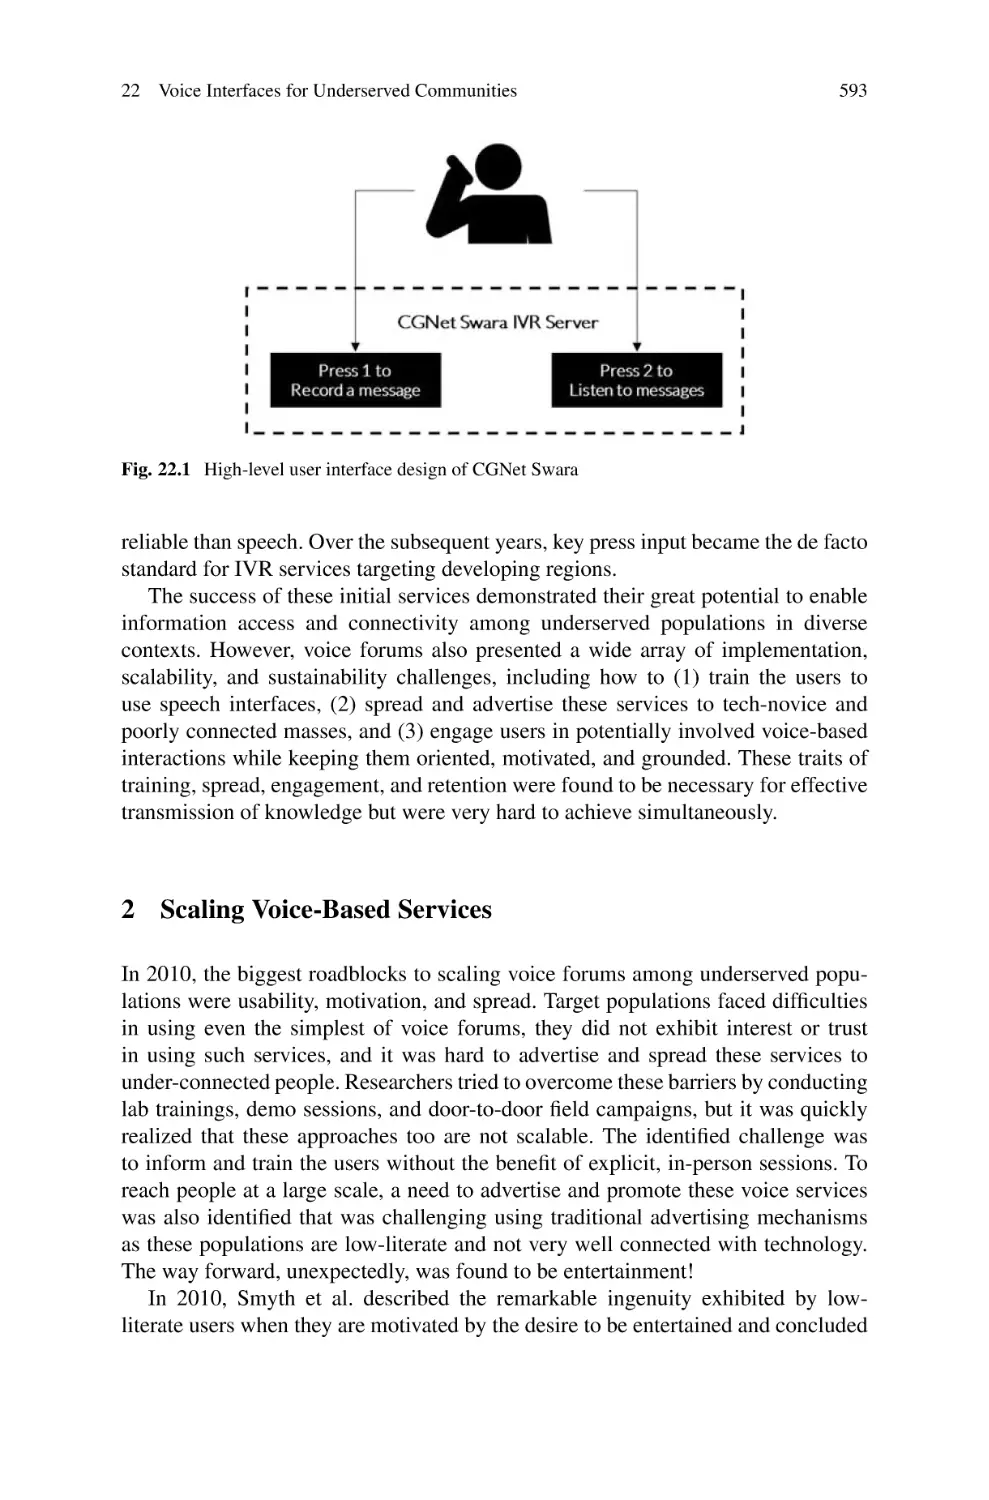
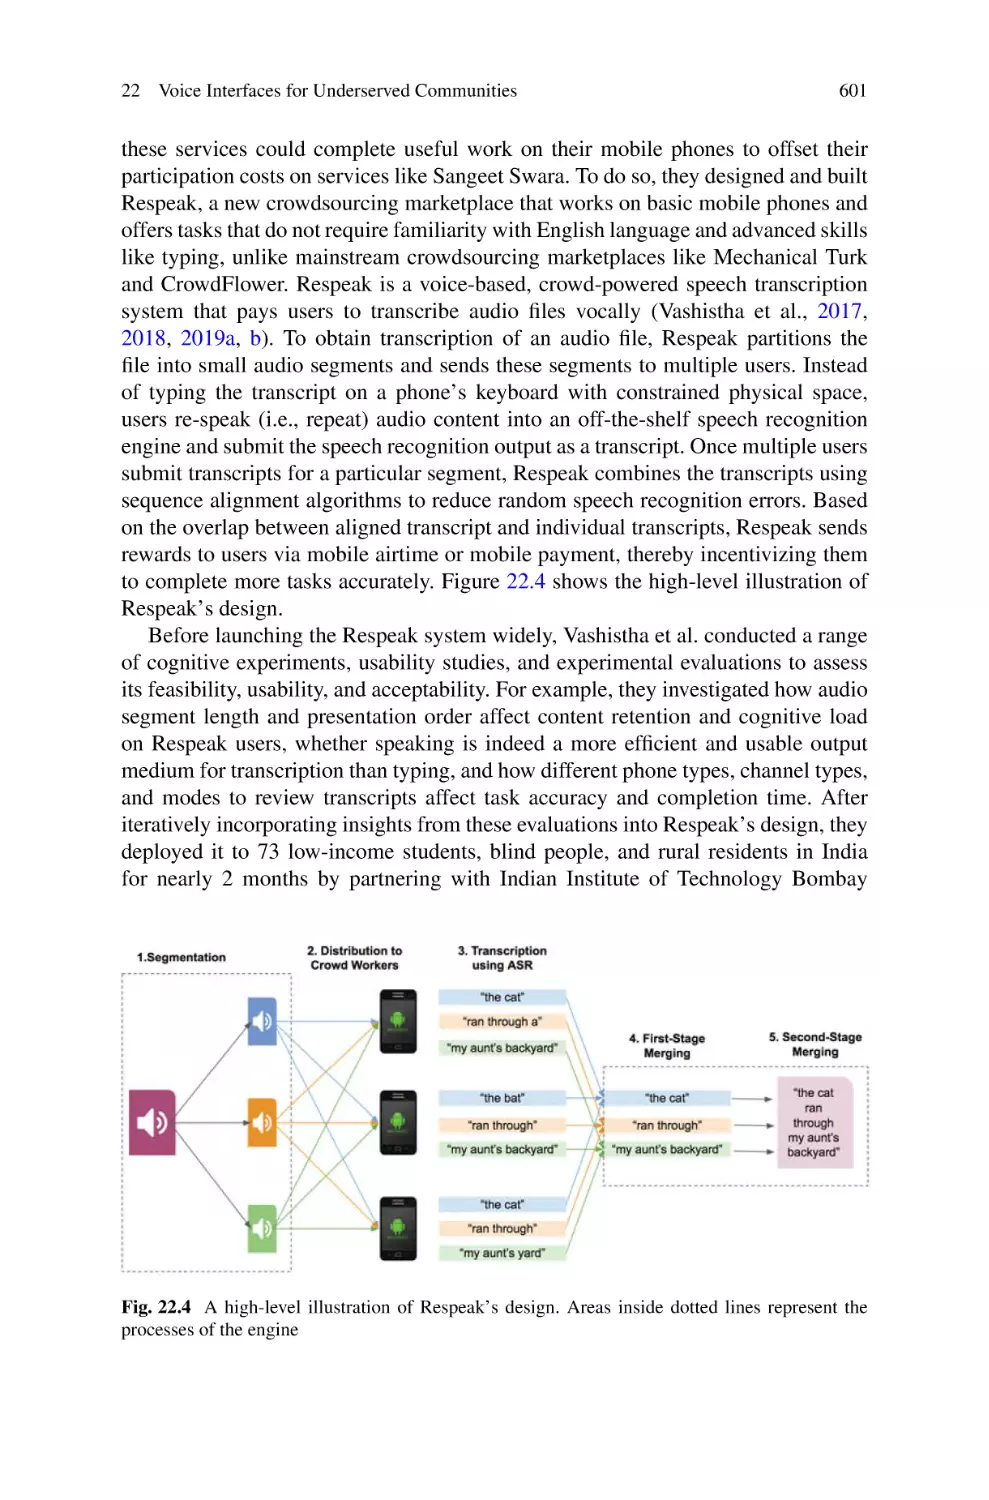
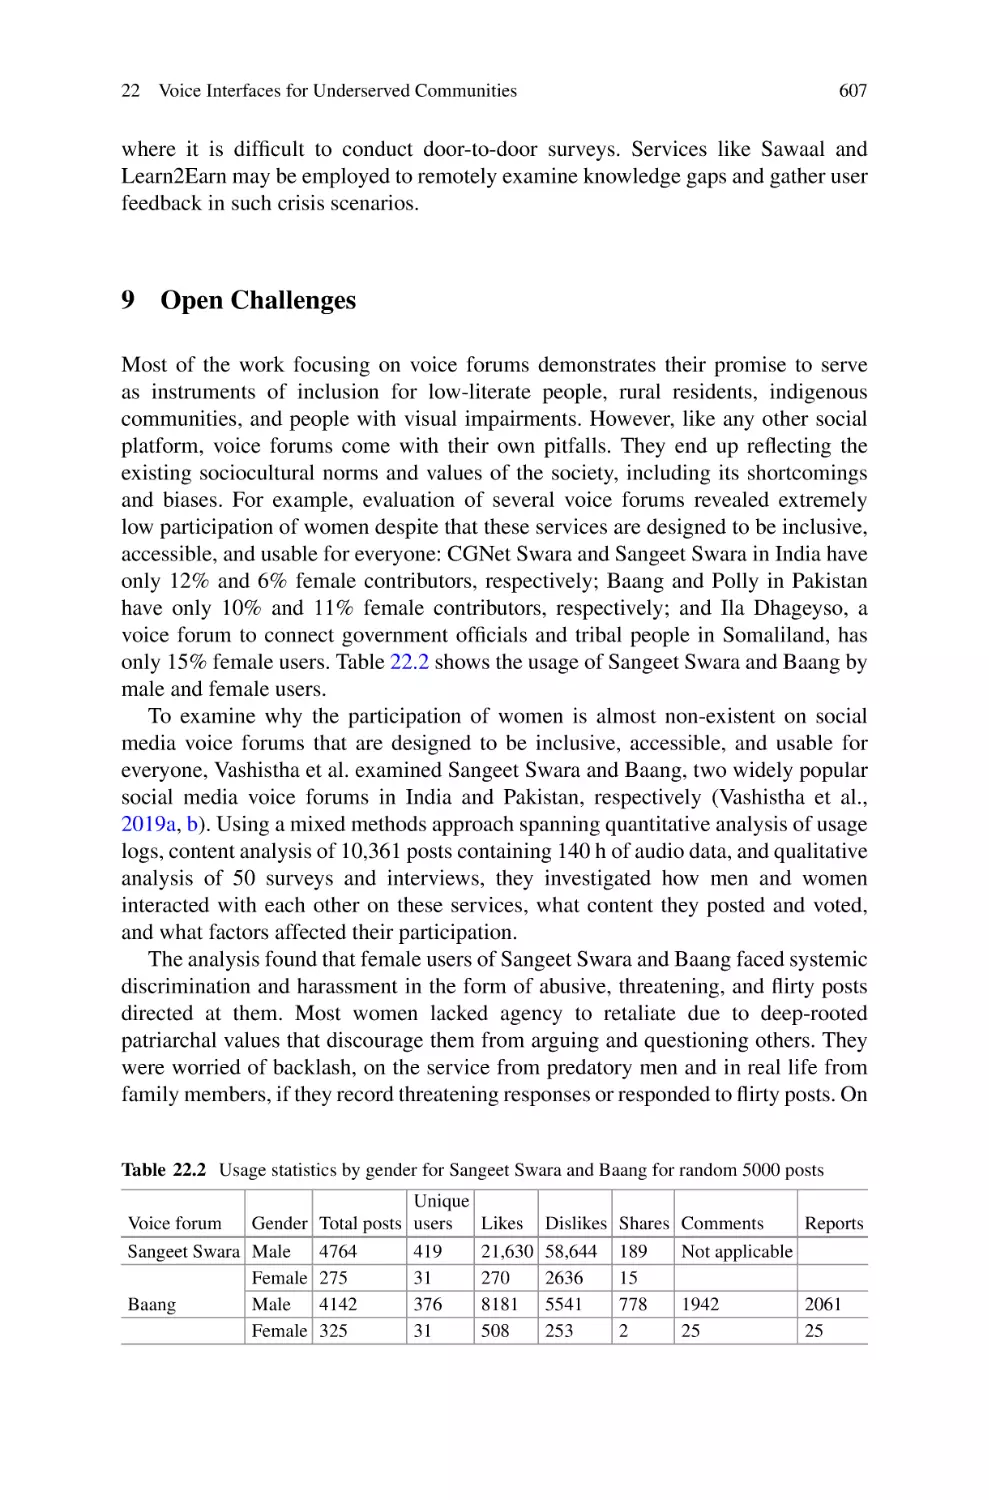
Voice Interfaces for Underserved Communities. . . . . . . . . . . . . . . . . . . . . . . . . 589
Aditya Vashistha and Agha Ali Raza
23
The Open Data Kit Project . . . . . . . . . . . . . . . . . . . . . . . . . . . . . . . . . . . . . . . . . . . . . . . . 613
Waylon Brunette and Carl Hartung
Epilogue . . . . . . . . . . . . . . . . . . . . . . . . . . . . . . . . . . . . . . . . . . . . . . . . . . . . . . . . . . . . . . . . . . . . . . . . . . . 639
Index . . . . . . . . . . . . . . . . . . . . . . . . . . . . . . . . . . . . . . . . . . . . . . . . . . . . . . . . . . . . . . . . . . . . . . . . . . . . . . . 641
Contributors
Kwame Abrokwah Brixels Company Limited, Accra, Ghana
Achyuta Adhvaryu William Davidson Institute, Ross School of Business, University of Michigan, Michigan, MI, USA
Good Business Lab, New Delhi, Delhi, India
Joshua Adkins Electrical Engineering and Computer Science, University of California, CA, USA
nLine, Inc, Berkeley, CA, USA
Anustubh Agnihotri University of California Berkeley, Berkeley, CA, USA
Jenny C. Aker Teffs University, Medford, MA, USA
Susan Amrose Department of Mechanical Engineering, Massachusetts Institute of
Technology, Cambridge, MA, USA
Richard Anderson Department of Computer Science and Engineering, University
of Washington, Seattle, WA, USA
Mary Claire Barela University of the Philippines Diliman, Diliman, Philippines
Susanna Berkouwer The Wharton School, University of Pennsylvania, Philadelphia, PA, USA
Menna Bishop London School of Economics, London, UK
Waylon Brunette Paul G Allen School of Computer Science & Engineering,
University of Washington, Seattle, WA, USA
Robin Burgess London School of Economics, London, UK
Lorenzo Casaburi Department of Economics, University of Zurich, Zurich,
Switzerland
Brandon D. Clark Department of Chemical Engineering, Stanford University,
Stanford, CA, USA
xv
xvi
Contributors
Maria Theresa Cunanan University of the Philippines Diliman, Diliman, Philippines
Prabal Dutta Electrical Engineering and Computer Science, University of California, CA, USA
nLine, Inc, Berkeley, CA, USA
Burak Eskici University of California at San Diego, San Diego, CA, USA
Raissa Fabregas Lyndon B. Johnson School of Public Affairs, The University of
Texas at Austin, Austin, TX, USA
Cedric Angelo Festin University of the Philippines Diliman, Diliman, Philippines
Smit Gade Good Business Lab, New Delhi, Delhi, India
Ashok J. Gadgil Department of Civil and Environmental Engineering, University
of California, Berkeley, Berkeley, CA, USA
Piyush Gandhi Good Business Lab, New Delhi, Delhi, India
Lavanya Garg Good Business Lab, New Delhi, Delhi, India
Tomoko Harigaya Senior Researcher, Precision Agriculture for Development
(PAD), Boston, MA, USA
Carl Hartung Paul G Allen School of Computer Science & Engineering, University of Washington, Seattle, WA, USA
Kurtis Heimerl Paul G. Allen School of Computer Science and Engineering,
Seattle, WA, USA
Dana Hernandez Department of Civil and Environmental Engineering, University
of California at Berkeley, Berkeley, CA, USA
Christopher Hyun University of California, Berkeley, CA, USA
Esther Jang Paul G. Allen School of Computer Science and Engineering, Seattle,
WA, USA
Matthew William Johnson Paul G. Allen School of Computer Science and
Engineering, Seattle, WA, USA
Mansi Kabra Good Business Lab, New Delhi, Delhi, India
Noah Klugman Electrical Engineering and Computer Science, University of
California, CA, USA
nLine, Inc, Berkeley, CA, USA
Michael Kremer University Professor in Economics and the College and the
Harris School of Public Policy (Recipient of 2019 Nobel Prize for Economics),
University of Chicago, Chicago, IL, USA
Tanu Kumar William & Mary, Williamsburg, VA, USA
Contributors
xvii
Kenneth Lee Chief Research and Evaluation Officer, The Pharo Foundation,
Nairobi, Kenya
James D. Long University of Washington, Seattle, WA, USA
Temina Madon Center for Effective Global Action, University of California,
Berkeley, Berkeley, CA, USA
Philip Martinez University of the Philippines Diliman, Diliman, Philippines
Ashwin Nair University of Virginia, Charlottesville, VA, USA
Ankita Nanda Good Business Lab, New Delhi, Delhi, India
Kara L. Nelson Department of Civil & Environmental Engineering, University of
California Berkeley, Davis Hall, Berkeley, CA, USA
Keren Neza Center for Technology and Economic Development, New York
University, New York, NY, USA
Yaw Nyarko Division of Social Science, New York University Abu Dhabi, New
York University, New York, NY, USA
Anant Nyshadham Ross School of Business, University of Michigan, Michigan,
MI, USA
Kevin D. Orner Department of Civil & Environmental Engineering, University of
California Berkeley, Davis Hall, Berkeley, CA, USA
Angela Orozco Center for Technology and Economic Development, New York
University, New York, NY, USA
Pat Pannuto Computer Science and Engineering, University of California, San
Diego, CA, USA
Good Business Lab, New Delhi, Delhi, India
Mamta Pimoli Good Business Lab, New Delhi, Delhi, India
Nicola Pitchford School of Psychology, University of Nottingham, Nottingham,
UK
Matthew Podolsky Electrical Engineering and Computer Science, University of
California, CA, USA
Alison E. Post University of California, Berkeley, CA, USA
Ravindra Ramrattan (deceased) Ravindra Ramrattan wrote this book while at
Kenya
Isha Ray University of California, Berkeley, CA, USA
Agha Ali Raza Lahore University of Management Sciences (LUMS), Lahore,
Punjab, Pakistan
xviii
Contributors
Arman Rezaee Department of Economics, University of California, Davis, CA,
USA
Patrick Shaw Brown University, Providence, RI, USAResearch Triangle International, Durham, NC, USA
Anant Sudarshan Ross School of Business, University of Michigan, Michigan,
MI, USA
Jay Taneja Electrical and Computer Engineering, University of Massachusetts,
Amherst, MA, USA
William A. Tarpeh Stanford University, Stanford, CA, USA
Kentaro Toyama University of Michigan School of Information, Ann Arbor, MI,
USA
Aditya Vashistha Cornell University, Ithaca, NY, USA
Ronel Vincent Vistal University of the Philippines Diliman, Diliman, Philippines
Laurel Wheeler Department of Economics, University of Alberta, Edmonton, AB,
Canada
Daniel L. Wilson Geocene Inc., Berkeley, CA, USA
Catherine Wolfram Haas School of Business, University of California, Berkeley,
CA, USA
Céline Zipfel London School of Economics, London, UK
About the Editors
Temina Madon is on the professional faculty of the University of California,
Berkeley, Haas School of Business, and a member of South Park Commons,
where she advises early-stage startups. Previously, she led business development
at machine learning startup Atlas AI. Earlier, Madon was the founding executive
director of the Center for Effective Global Action (CEGA), a global research
network focused on human and economic development, with headquarters at UC
Berkeley. In this role, she managed the Development Impact Lab, a USAID-funded
consortium of universities advancing the field of “development engineering.”
Madon worked with Ashok Gadgil to conceptualize a framework for this book
and recruit contributors. Madon began her career in science and technology policy,
working first in the US Senate (as an AAAS Science and Technology Policy Fellow)
and later at the US National Institutes of Health (NIH). She holds a PhD from UC
Berkeley in computational neuroscience and a BS from MIT.
Ashok J. Gadgil is a faculty senior scientist and former director of the Energy and
Environmental Technologies Division at Lawrence Berkeley National Laboratory,
and a Distinguished Professor of Civil and Environmental Engineering at the
University of California, Berkeley. Since 2012, Gadgil is the faculty director
of a large multi-campus, multi-disciplinary USAID-funded project, Development
Impact Lab, with headquarters at UC Berkeley. Since 2006, he has taught graduate
courses at UC Berkeley on inventing, implementing, and scaling up technologies
for development. His research and technology inventions have been recognized with
several significant awards and honors. Along with Dr. Temina Madon, Gadgil led
the conceptualization of this book, shaping its content, framework, and selection of
chapter authors. Gadgil holds a PhD in physics from UC Berkeley and an MSc in
physics from the Indian Institute of Technology Kanpur.
Richard Anderson is a Professor in the Paul G. Allen School of Computer
Science and Engineering at the University of Washington. His research interest
is in Computing for the Developing World, with work spanning educational
technology, mobile data management tools, global health information systems,
xix
xx
About the Editors
and digital financial services. He has conducted research at the Mathematical
Sciences Research Institute, the Indian Institute of Science, Microsoft Research,
and PATH, a Seattle based NGO working on health technologies for low resource
environments. He has been recognized with the NSF Presidential Young Investigator
award, the University of Washington College of Engineering Faculty Innovator for
Teaching Award, and the 2020 ACM Eugene L. Lawler Award for Humanitarian
Contributions within Computer Science and Informatics. Previously, he worked
in the theory and implementation of algorithms, including parallel algorithms,
computational geometry, and scientific applications. He graduated with a B.A. in
Mathematics from Reed College and a Ph.D. in Computer Science from Stanford
University.
Lorenzo Casaburi is an associate professor in the Department of Economics
at the University of Zurich. His main line of research focuses on agricultural
markets in Sub-Saharan Africa, with an emphasis on market structure, behavioral
insights, and agricultural finance. His research has received funding from the
European Research Council, the Swiss National Foundation, the U.S. Agency for
International Development, UK Aid, and others. He is a research fellow at the
Centre for Economic Policy Research and Bureau for Research and Economic
Analysis of Development, and a research affiliate at the International Growth
Centre, Innovations for Poverty Action, and the Abdul Latif Jameel Poverty Action
Lab. Lorenzo holds a BA from the University of Bologna and a PhD in economics
from Harvard. Before joining the University of Zurich, he was a postdoctoral fellow
at Stanford University.
Kenneth Lee is the director of Air Quality Life Index® and a senior research
associate in the Department of Economics at the University of Chicago. He
researches questions in the areas of development economics, environmental and
energy economics, and environmental health. He has designed and published field
experiments in both Kenya and India. Prior to this, he was the executive director of
the Energy Policy Institute at the University of Chicago (EPIC) in India. He also held
research fellow positions at the Center for Effective Global Action and the Energy
Institute at Haas. He holds a PhD from the University of California, Berkeley, a
master’s in international affairs from Columbia University, and a bachelor’s from
McGill University. Earlier in his career, he worked as an investment banker in
Toronto and London, covering media and telecoms companies in Africa, Europe,
and Canada.
Arman Rezaee is Assistant Professor of Economics at the University of California,
Davis. His research focuses on intersections of service delivery, political economy,
and technology. He makes use of large-scale field experiments that leverage cellular
technology, as well as natural experiments using historical archival data. Much of his
work focuses on Pakistan. He also has active projects in Uganda and the Philippines.
His work has been supported by the Center for Effective Global Action, the Bill
& Melinda Gates Foundation, the International Growth Centre, the Abu Latif
About the Editors
xxi
Jameel Poverty Action Lab, the Policy Design Evaluation Lab, Private Enterprise
Development in Low-Income Countries, and the University of California Labs.
Before obtaining his PhD in economics from UC San Diego, he earned his master’s
in public policy from the Harvard Kennedy School of Government, where he was a
public policy and international affairs fellow.
Chapter 1
Introduction to Development Engineering
Anustubh Agnihotri, Temina Madon
, and Ashok J. Gadgil
1 What is Development Engineering?
Technological change has always played a role in shaping human progress. From the
power loom to the mobile phone, new technologies have continuously influenced
how social and economic activities are organized—sometimes for better and
sometimes for worse. Agricultural technologies, for example, have increased the
efficiency of agricultural production and catalyzed the restructuring of economies
(Bustos et al., 2016). At the same time, these innovations have degraded the environment and, in some cases, fueled inequality (Foster and Rosenzweig, 2008; Pingali,
2012). Information technology has played a catalytic role in social development,
enabling collective action and inclusive political movements (Enikolopov et al.,
2020; Manacorda & Tesei, 2020); yet it has also fueled political violence and
perhaps even genocide (Pierskalla & Hollenbach, 2013; Fink, 2018).
Nevertheless, the United Nations (UN) has recognized technology as key to
achieving the Sustainable Development Goals (SDGs), a set of global policy targets
adopted by 193 national governments for implementation by 2030.1 An outstanding
question is how to systematically harness technology for sustainable development?
1 United
Nations Sustainable Development Goals at https://sdgs.un.org/goals
A. Agnihotri ()
University of California Berkeley, Berkeley, CA, USA
e-mail: anustubh@berkeley.edu
T. Madon
Center for Effective Global Action, University of California, Berkeley, Berkeley, CA, USA
A. J. Gadgil
Department of Civil and Environmental Engineering, University of California, Berkeley,
Berkeley, CA, USA
© The Author(s) 2023
T. Madon et al. (eds.), Introduction to Development Engineering,
https://doi.org/10.1007/978-3-030-86065-3_1
1
2
A. Agnihotri et al.
Fortunately, the research community has begun to offer paths forward. In this
textbook, we introduce the nascent field of development engineering, an area of
research focused on discovering generalizable technological solutions that can
improve development outcomes in poverty-constrained settings. It integrates the
theory and methods of development economics (and other social sciences) with the
practice of engineering, promoting the co-design of engineering advances alongside
the social and economic innovations required for impact in the “real world.” The
resulting solutions—whether they focus on intensifying agricultural production,
enhancing early child development, or expanding access to sanitation—are well
positioned to succeed at scale, and within planetary boundaries.
As a field, development engineering is closely aligned with the recent movement
to scientifically validate different approaches to poverty reduction, exemplified in
the 2019 Nobel Prize in Economic Sciences (awarded to development economists
Abhijit Banerjee, Esther Duflo, and Michael Kremer)2 . These researchers and their
co-authors have helped pioneer the use of randomized controlled trials in public
policy, bringing a precise and incremental approach to solving the problems of
poverty. Development engineering follows in this tradition, yet is distinct in its focus
on technological innovation as a tool for achieving sustainable development.
For all the promise of technology to accelerate sustainable development, we must
also recognize the potential for new tools to harm people and the environment.
Indeed the motivation in launching this new field has been, in part, the long
string of failures in the area of “technology for good.” There is a rich history
of engineering projects that have been technically sophisticated but have failed to
achieve social impact in the real world—or worse, have rolled back the frontiers of
human development. Examples include costly but ineffective attempts to improve
educational outcomes through low-cost laptops (Cristia et al., 2017; Kraemer et al.,
2009); water rollers3 that were intended to facilitate water transport but failed to
gain adoption within targeted communities (Borland, 2014; Crabbe, 2012; Stellar,
2010); and large-scale irrigation systems that failed to deliver promised benefits
(Higginbottom et al., 2021).
These failures have a number of elements in common. First, it is not obvious,
ex ante, that such projects should fail, and the causes of failure are not always
clear. They are often well intentioned efforts, employing human-centered design
to better meet the needs of individual users. Yet they often overlook the top-down
view of development: the politics, institutions, and social norms that surround any
user. These conditions can doom the most well-intentioned efforts to fail.
Second, engineers operating in the context of poverty often lack information
about users’ habits. Take this as a thought experiment: as a consumer in a wellfunctioning market, you benefit from a vast infrastructure for data collection that
reveals the economic behavior of you and people like you. The firms that service
your needs have access to your web traffic logs, digital payments, utility meters,
and mobile location data—not to mention household economic surveys, government
economic indicators, and industry analyst reports. But what about the homeless
2 See
3 See
https://www.nobelprize.org/uploads/2019/10/advanced-economicsciencesprize2019.pdf
https://www.hipporoller.org
1 Introduction to Development Engineering
3
consumer who lives in urban poverty, subsisting on free meals and donations? Or
the rural subsistence farmer who uses cash to operate in informal markets?
The most disadvantaged households are rarely reached by business analysts
and government enumerators. Just 10 percent of households in rural India have
access to formal sources of credit; the vast majority leave no trace in the credit
market (Demirguc-Kunt et al., 2018). Fewer than half of all nations in sub-Saharan
Africa have conducted a nationally representative household economic survey in
the last decade (Yeh et al., 2020). People living in poverty, by definition, are
excluded from participating actively in formal markets. As a result, their preferences
are rarely captured in market price signals or routine consumer data. They may
provide feedback to researchers in the form of self-reported preferences (e.g.,
through focus groups or interviews), but these inputs may be biased and unreliable.
Without reliable insights to guide technology design, it is unsurprising that so many
engineers have failed to achieve impact.
In recent years, we have developed better techniques to observe the preferences
and behaviors of underserved communities. These include low-cost sensors for
monitoring product use, automated digitization of administrative records, and even
behavioral experiments conducted outside the lab, in “the field.” Some of these tools
will be discussed in future chapters; they are increasingly being used by engineers
to design for people excluded from conventional markets.
A third challenge is the paucity of research identifying the long-term economic
and social impacts of new technologies (largely for a lack of investment in
rigorous evaluation). Rarely have the developers of “pro-poor” technologies had
the resources to evaluate the downstream social and economic impacts of their
inventions. We are all familiar with the use of randomized, controlled trials (RCTs)
in medicine; these methods are used to rigorously measure the effects of a novel
medical treatment or prophylactic, across large populations of patients. More
recently, software developers have adopted this approach to test the effects of
different product features, using rapid experimentation to generate user feedback
in a process known as A/B testing. Yet the tools of rigorous evaluation have only
slowly diffused into the broader engineering community. This is despite the fact
that engineers are interventionists at heart, seeking to make changes to markets, the
environment, and people’s lives.
Through collaboration with economists, political scientists, and public health
researchers, engineers are now investigating the impacts of their inventions. Adapting the experimental methods used in medical trials (and more recently in public
policy), we can now ask: How does the use of tablets in classrooms affect learning
outcomes, both for the highest-performing students and those in the bottom quantile
(Chap. 11)? How does the introduction of improved cookstove technology affect
household consumption and nutrition (Chap. 15)? What is the impact of mobile
telephony on local economies (Chap. 11), and what is the development impact of
access to grid electricity (Chap. 5)?
Rigorous evaluation can help explain the causal relationships between a technology and its downstream impacts, including impacts on the climate and the
environment (Alpízar & Ferraro, 2020). It allows us to learn how technologies
effect change, and it teaches us about the economic and social constraints that
4
A. Agnihotri et al.
any successful solution must address. Experiments in real-world settings have also
led to a better understanding of how technologies get adopted in disadvantaged
communities. These insights can be used to weave novel behavioral, economic, and
social interventions into the design of technological solutions.
What does a “development engineering” innovation look like? One of the
earliest examples is a community-scale water chlorination technology for rural
households, designed by a team of engineers and economists. For user convenience
and perceptual salience, it is a brightly colored device placed at high-traffic points
of water collection, like springs. It dispenses just the right amount of chlorine to
fill the typical household’s container, and it is provided free of charge. Its design is
based on rigorous studies of users’ willingness to pay, their consumption habits, and
an understanding of how social pressure influences hygiene practices (Kremer et al.,
2011; Null et al., 2012). The system is now being scaled to millions of households
across sub-Saharan Africa, with appropriate adaptations; and it is widely viewed
as one of the most sustainable modern solutions for providing clean water to rural
communities (Ahuja et al., 2015).
Technologies like these leverage important recent insights from economics—
for example, the finding that poverty-constrained households do not use preventive
health technologies (like insecticide treated bednets) when pricing is non-zero4
(Dupas, 2014). They are built for specific social, behavioral, environmental, and
economic contexts. This means that when markets cannot deliver the desired
development impact, the public sector (or civil society) is leveraged as the channel
for delivery.
In some sense, development engineering is similar to other problem-focused
fields, like environmental engineering and bioengineering, in that it combines two
or more disparate disciplines to holistically address a defined set of problems.
By definition it is highly interdisciplinary, combining insights from development
economics and political science as well as computer science, environmental science,
and of course engineering. Similarly, it is applied: there is a limited focus on basic
research and an emphasis on identifying innovations that solve problems reliably
(and at scale) within complex “real-world” environments. It is unique in its emphasis
on the challenges faced by individuals and communities subjected to poverty and
marginalization.
Defining Terms: Technology, Invention, Intervention
In this textbook, we refer to a “technological solution” as a technology integrated with the social and economic interventions required to achieve impact
at scale. When brought together, these two elements solve a development
problem that neither could have achieved independently. In some cases, we
will use the word “innovation” in place of the word “solution.” To help
(continued)
4 See
https://www.povertyactionlab.org/case-study/free-bednets-fight-malaria.
1 Introduction to Development Engineering
5
navigate the jargon-rich world of development engineering, here we define
a set of common terms that you will find throughout the textbook.
Technology is the body of scientific and engineering knowledge and its
application to improve the production of goods, the delivery of services, and
the accomplishment of societal objectives. Technology can take the form of
novel systems, practices, or processes.
An invention is a unique device, method, process, or composition that is
technically novel, nonobvious, and often patentable. An invention is the result
of a creative process that involves the discovery of something new. It may
not require new technology. For example, invention of the lightbulb brought
together multiple existing technologies in a new arrangement, yielding a
useful and novel product.
An intervention is an action taken to effect or modify the outcomes
of individuals, populations, and systems. In the context of development
engineering, an intervention may be a social or economic strategy designed to
change the behaviors of markets, institutions, and households. Interventions
can be innovative, and they may involve technologies or inventions, but these
are not required.
Development engineering is a practice, but it is also a field of research, with a
research agenda that explores how technological solutions (and their design) can be
optimized and applied for sustainable development. While the design of technology
has been well studied in developed markets, it is less clear how innovations
should be designed to solve development challenges. The field aims to generate
technological solutions that can be rigorously evaluated, can perform reliably at
scale, and can improve millions of lives.
The authors of the various case studies in this textbook speak from experience.
They have engaged in research and collaboration across disciplines and over many
years. Electrical engineers studying power grids have learned in the field alongside
development economists exploring the demand for electricity in rural communities.
Political scientists interested in post-conflict state capacity have collaborated with
computer scientists on the design of digital governance technologies. They have
also advanced the measurement of social and economic outcomes, leveraging tools
like remote sensing, mobile data, and networked sensors to observe and understand
the process of sustainable development. By learning each other’s languages—and
defining this new discipline—we are able to form a more coherent, systematic
approach to global development challenges.
While we attempt to define development engineering in the opening chapters
of this book, the research community has offered several diverse definitions of
the field (Nilsson et al., 2014; Agogino & Levine, 2016). Taken together, these
perspectives are beginning to shape an important dialogue about technology and
its role in sustainable development. We value these contributions, and we aim for
this textbook to offer a comprehensible (if not comprehensive) synthesis of research
to date.
6
A. Agnihotri et al.
2 Intellectual History of the Field
The concepts of “engineering for development” and “technology for development”
have taken many forms over the last few decades. This section sketches an intellectual history of the field, tracing the different paradigms that have dominated our
thinking about technology in resource-constrained settings. We start with research
on the broad relationship between technological change and human development
and then review the various movements employing technology as a solution for
societal challenges. We conclude by explaining how this new field differs from
earlier paradigms.
It is well established that technological innovation is central to economic growth.
Technological advances, with an enduring consistency, have led to increases in the
productive capacity of societies, allowing them to move from scarcity to surplus
(Landes, 2003; Nelson & Nelson, 2005). Economic historians have studied this
process in great detail, starting with the industrial revolution (Mokyr, 2018; Landes,
2003; Polanyi & Maclver, 1944; Piketty, 2014). Propelled by technological innovation, the industrial revolution had a profound impact on the thinking of philosophers
and economists. It introduced the idea that technological transformations can make
persistent improvements in economic conditions; it also established the centrality
of markets in shaping the economic life of individuals and societies. It introduced
the notion that human intervention can actually shift the course of our development
(Smith, 2010).5
However, the idea that human development could be achieved through policy
intervention did not take root until the end of the second World War and the
so-called Marshall Plan. Postwar policy initiatives focused on economic growth
across war-torn Europe, with the underlying assumption that technological progress
would increase productivity and create economic surplus (Landes, 2003, Keynes,
2018). Such progress was “engineered” through large-scale industrialization that
was managed by corporations and guided by governments through economic policy.
The success in spurring postwar economic growth led to a Western concept of
development that had well-defined stages of growth, with all societies passing
through distinct phases and eventually converging through the diffusion of technology (Rostow, 1960).
In the postwar era, Europe’s success in using large-scale industrial technology
to solve the challenges of production led to the transfer of these technologies to
less developed countries, with the aim of rapidly transforming their economies.
However, this effort to transplant technology was riddled with failures. Not only did
many of these technologies (like synthetic fertilizers and large-scale dams) create
5 Prior to the industrial revolution, economic growth was seen as cyclical. Scholars embraced the
notion of a Malthusian trap, an argument that views technical progress as linear and population
growth as exponential. Malthus (in his famous essay published in 1798) argued that for a fixed
technical growth in resources, small populations will experience greater per capita income,
resulting in population growth that overshoots the available resource base. This, in turn, will reduce
per capita income, inevitably driving a contraction of the population.
1 Introduction to Development Engineering
7
unforeseen environmental harm; they also failed to be widely adopted or fell into
disuse (e.g., handpumps to access groundwater).
2.1 Appropriate Technology Movement
The movement for appropriate technology emerged, in part, as a reaction to
the frustrations stemming from attempts to rapidly replicate “Western” models
of technology-driven growth in lower-income settings. The Western model often
excluded community input, treating people as recipients of intervention rather than
participants in development.
Peaking in the 1970s and 1980s, the appropriate technology movement argued for
small-scale technological solutions that were based on local needs and “appropriate”
for the nature of local endowments, rather than implemented by central authorities
(Schumacher, 2011, Dunn, 1979). The movement borrowed heavily from the
Gandhian ideal of self-reliant village communities. It also viewed the adoption
of technology, and its consequences, through the lens of equality, by focusing on
who adopts a technology, and how the gains from a technology are distributed. As
a consequence, the approach has focused on local and indigenous production of
(appropriate) technology, so that communities benefit from wider-scale adoption in
multiple ways.
Impact on the environment is also a central tenet of the movement, with a strong
emphasis on sustainability and the use of renewable sources. An example of a
widely adopted appropriate technology is the treadle-pump for irrigation, which is
easily constructed at the village level and sustainably enables the farmer to provide
water to his or her fields (Adeoti et al., 2007). In reality, this innovation has been
delivered through a centralized nongovernmental organization (NGO) to enable
product quality certification (“KrishiBandhu”), signaling some of the shortcomings
of this approach.
The appropriate technology movement has had a deep impact on how the
development community thinks about the role of technology in shaping lives of
people in poor communities. It has highlighted the need to pay closer attention to the
negative environmental externalities of industrial technology. However, appropriate
technologies have not seen widespread and sustained adoption over the medium to
the long run. Critiques have suggested that the lack of attention to the role of markets
and scalability has limited the success of “appropriate” technologies (Rybczynski,
1980; Willoughby, 1990).
2.2 Market-Oriented Approaches
In parallel to the appropriate technology movement is a long history of leveraging
market-based incentives to stimulate innovation for resource-poor settings. The idea
8
A. Agnihotri et al.
of profit at the “bottom of the pyramid,” popularized by CK Prahalad, asserts that
there are large, untapped market opportunities in low-resource communities that
can be exposed by making technologies more affordable for the poor (Prahalad,
2009). Rather than viewing people who live under $2 a day as passive recipients
of development aid, this approach views them as consumers of profitable goods
and services. Given the very large number of people living in resource-poor
environments, even a small profit margin can yield substantial profits at scale.
While the poorest households cannot afford a bottle of shampoo or a box of
tea, they do desire, and can afford, a small sachet that is cheaply priced. This
approach has encouraged corporations to pursue profit while ensuring that people
with limited resources can access the products they need. This approach too has
its limitations, since it focuses exclusively on needs that can be addressed through
market expansion. Large “public goods” requirements—like education and health—
are not always effectively met by this approach.
A different market-oriented approach has focused on the productive and creative
capacity of people living in resource-poor settings. Challenging the often held
assumptions that associate technological innovation with high levels of formal education, this approach emphasizes the entrepreneurial and generative capabilities of
the poor as “frugal innovators.” The idea is that within resource-constrained settings,
local innovators can develop technologies with unique forms and functionalities,
tailored to local problems and environments. Anil Gupta’s Honey Bee network
leverages the traditional knowledge created by grassroot innovators to identify and
screen new technologies for scale up (Gupta, 2006). An example of this is the
biosand filter, an adaptation of centuries-old indigenous technology that was refined
for scale-up in 1990. It is now estimated to serve more than 4 million people in 55
countries.
Like Prahalad’s market-oriented approach, the view of people in resource-poor
environments as technology creators leads to technologies that are adapted to local
contexts and preferences. This can have spillover benefits for wealthier consumers,
when products optimized for low-income communities move into developed markets. Indeed the unique nature of innovations from resource-constrained settings has
led to a so-called “boomerang” effect, with products designed for scarcity benefiting
users in more prosperous economies (Immelt et al., 2009; Winter & Govindarajan,
2015). For example, the leveraged freedom chair which provided users navigating
uneven terrain in rural India with added control and flexibility was also successfully
marketed in the United States as GRIT Freedom Chair, at a higher cost (Judge
et al., 2015). Thus, market-oriented approaches have focused on people in underresourced conditions as both consumers and producers of technological innovation
for solving development problems.
2.3 Humanitarian Engineering
Humanitarian engineering is a paradigm that explores how engineering solutions
can be used to provide access to basic human needs—like water, sanitation, energy,
1 Introduction to Development Engineering
9
and shelter—in response to disasters, emergencies, and other resource-challenged
environments. Unlike market-oriented approaches, humanitarian engineering takes
a rights-based view, placing the needs of communities as the central motivation
behind intervening. It often relies on researchers and innovators contributing their
time to develop a technological solution that solves a well-identified problem within
a community.
While the field of humanitarian engineering has begun to embrace market-based
solutions, for example, through the distribution of cash transfers to households
recovering from economic shocks, it is unclear whether private sector approaches
actually work, particularly when it comes to provision of goods like water and
sanitation (Martin-Simpson et al., 2018). Alongside recent exploration of marketbased programming, there has been an emphasis on the design of “dual-use”
solutions that operate in an emergency and also enhance community resilience by
building preparedness for future emergencies. For example, a project to provide
clean drinking water within a refugee tent camp might be taken up by a voluntary
organization like engineers without borders but designed to support sustained use as
the camp evolves into a longer-term settlement.
Humanitarian engineering has been especially effective when applied to disaster
mitigation, a process that prepares disaster-prone communities to rebuild using
resilient technologies. For example, the Berkeley-Darfur Stove, developed initially
for Darfur refugees, now serves more than 60,000 families in different settings
across Africa (see PotentialEnergy.org). UVWaterworks, a water purification technology initially developed in response to a cholera epidemic in India, now serves 26
million customers across 5 different countries (see WaterHealth.com).
2.4 ICTD
The proliferation of information and communication technology (ICT) across the
world has fundamentally altered how individuals access and receive information,
search for jobs, obtain government services, engage with financial institutions,
and communicate with others. With more than 3 billion Internet users worldwide,
ICT plays a central role in how under-resourced communities experience social
and economic development (WDR, 2016). Gains from access to ICT can be
significant for people who previously lacked access to the technology: for example,
fish markets in Kerala saw dramatic reduction in spatial price variation after the
introduction of cell phones, which allowed fishermen and wholesalers to more easily
exchange information (Jensen, 2007). Similarly, M-pesa, a mobile-based money
transfer application introduced in Kenya, has allowed millions of people to easily
access remittance flows (Mbiti & Weil, 2015). However, the adoption and benefits of
ICTs depend heavily on social and economic factors. For example, more educated
people living in urban areas are more likely to have access to smartphones (World
Development Report, 2016, Pg 167).
10
A. Agnihotri et al.
The field of ICT for Development (ICTD or ICT4D) has focused on understanding how this digital divide can be bridged, by making access to ICTs more equitable.
One thrust of the field is how to reduce information asymmetries, so that remote
and disconnected populations can connect to markets. For example, modifications
to communication services like interactive voice response (IVR) enable those with
low literacy to access relevant digital information (Chu et al., 2009; Mudliar et al.,
2012).
ICTD researchers have also partnered with governments to change how states
deliver services to their citizens. The most common innovation is the deployment
of “helplines” that enable citizens to register their grievances through web-based
or IVR platforms. Thoughtful design of these systems can empower marginalized
citizens, providing new channels for reporting their grievances (Chakraborty et al.,
2017). This approach has also been adopted by civil society, enabling individuals
and communities to act collectively and voice their grievances (World Development
Report, 2016, Chap. 3). For example, IVR platforms are being used to help
smallholder farmers to raise concerns and grievances with local authorities (Patel
et al., 2010).
A corrective critical perspective for the field of ICTD explores the inability of
technology, by itself, to improve welfare and the need for institutional arrangements
that support technological solutions and their effective adoption (Toyama, 2015;
Johri and Pal, 2012). Indeed in the private sector, deployment of ICTs often
focuses on the end-user and the product, without close attention to institutional
arrangements, power dynamics, and the cultural environment of targeted users. For
example, the one-laptop per child (OLPC) program aimed to transform learning by
providing every child with an affordable laptop. However, it failed to achieve the
impact at scale by failing to account for local cultures and preferences within the
educational system (Kraemer et al., 2009).
2.5 Human-Centered and Participatory Design
A persistent challenge in “technology for development” is that products are designed
by people who are far removed from the end-user’s context. Human-centered design
(HCD) advocates for a product design strategy that explicitly centers around the
daily experiences of people in their native environments. The hypothesis of HCD
is that failing to understand and empathize with the user’s needs and requirements
can lead to failure in adoption when the technology finally arrives at the user’s
doorstep. As discussed earlier, the water-roller was designed to help women in rural
low-income settings access large quantities of water. Yet it fell into disuse as a
result of severe design flaws, including failures on uneven terrain and the size of
the product, which failed to meet women’s needs (Crabbe, 2012). HCD emphasizes
the perspective of the user and her environment, focusing on the complete product
cycle from interface to manufacturing, distribution, and repair (Donaldson, 2009).
A successful example of HCD is the wheelchair by the Gear Lab at MIT, which
1 Introduction to Development Engineering
11
serves people with disabilities. The specific needs of disabled people living in lowincome settings were incorporated into a redesign of the traditional wheelchair
model, allowing users to traverse more rugged terrain with greater maneuverability
(Winter and Govindarajan, 2015).
A related effort has been that of participatory design (or co-design), which
actively involves end-users and other stakeholders in the design process (Spinuzzi,
2005; Steen, 2013). Thus, the consumers of the new technology provide their inputs
from initial ideation to finalization and production. The active involvement of the
end user ensures that the design of a new product does not leave out needs of the
consumers. However, the deep involvement of a small number of end-users can
limit the effort taken to get feedback from a larger, more representative sample
of customers. It remains unclear whether human-centered design and co-design
result in innovations that achieve superior development outcomes at scale. However,
they are a promising complement to approaches that focus on market constraints,
institutional failures, and social and behavioral norms.
2.6 Development Engineering
Development engineering borrows from many of the intellectual paradigms
mentioned above but also differentiates itself in key ways. Like appropriate
technology and frugal innovation, it pursues the well-being of people living in
resource-constrained environments (as opposed to targeting rapid industrialization,
or macroeconomic growth). Yet unlike these movements, development engineering
brings attention to the importance of markets and political institutions in shaping
human development. As with humanitarian engineering, we focus on sustainability
and resilience, yet we also seek to discover the causal mechanisms through which
technology shapes sustainable development over the long term. By studying the
mechanisms of development, development engineering aims for generalizable
lessons that extend beyond any one context, population, or environment.
In many ways, this new field follows in the tradition of ICTD, particularly its
emphasis on interdisciplinary collaboration. It seeks to bring insights from the
rapid adoption and positive impact of ICTs to other important areas of engineering,
including some with great economic promise (like off-grid energy and precision
agriculture) and some with importance for health (such as wastewater treatment
and sanitation). As such, development engineering extends beyond ICTD’s focus
on information and computing to include civil and environmental engineering,
mechanical engineering, electrical and power systems engineering, materials science, chemical engineering, and related disciplines. And unlike market-oriented
approaches, development engineering does not rely on one particular strategy for
the implementation of a technological innovation: if markets are the appropriate
channel, they are leveraged—while not ruling out the option of delivering a
technology through government agencies, nongovernmental organizations (NGOs),
or communities.
12
A. Agnihotri et al.
Indeed development engineering has emerged in the absence of a profit motive,
driven by university researchers focused on efficiently meeting the unmet demands
of disadvantaged people. These university actors have worked alongside international development agencies, governments, social enterprises, and for-profit
ventures to create “testbeds” for innovations that can advance progress toward the
SDGs. This team-based architecture has allowed for the accumulation of knowledge
and the discovery of generalizable solutions, while also facilitating the transition to
scale of effective solutions.
On that note, we should point out that development engineering focuses explicitly
on the scalability of technological solutions. It does not emphasize “boutique” or
bespoke solutions to niche problems nor does it rely exclusively on the participatory
approaches that some technical groups (e.g., MIT D-Lab) have developed. The
scalability and generalizability of research findings are viewed as critically essential
and important features of development engineering, while recognizing that scale-up
of any innovation will require localization, customization, and adaptation to local
conditions.
References
Adeoti, A., et al. (2007). Treadle pump irrigation and poverty in Ghana (Vol. 117). IWMI.
Aghion, P., & Howitt, P. (1990). A model of growth through creative destruction. National Bureau
of Economic Research.
Ahuja, A., Gratadour, C., Hoffmann, V., Jakiela, P., Lapeyre, R., Null, C., Rostapshova, O., &
Sheely, R. (2015). Chlorine dispensers in Kenya: scaling for results, 3ie Grantee Final Report.
International Initiative for Impact Evaluation (3ie).
Alpízar, F., & Ferraro, P. J. (2020). The environmental effects of poverty programs and the poverty
effects of environmental programs: The missing RCTs. World Development, 127, 104783.
Banerjee, A. V., Banerjee, A., & Duflo, E. (2011). Poor economics: A radical rethinking of the way
to fight global poverty. Public Affairs.
Basu, P. (2006). Improving Access to Finance for India’s Rural Poor. The World Bank. https://
doi.org/10.1596/978-0-8213-6146-7
Beaman, L., BenYishay, A., Magruder, J., & Mobarak, A. M. (2018). Can network theory-based
targeting increase technology adoption?. National Bureau of Economic Research.
Borland, R. (2014). The PlayPump. The gameful world: Approaches, issues, applications, 323–
338.
Brewer, E., et al. (2005). The case for technology in developing regions. Computer, 38(6), 25–38.
Bustos, P., Caprettini, B., & Ponticelli, J. (2016). Agricultural productivity and structural transformation: Evidence from Brazil. American Economic Review, 106(6), 1320–1365.
Chakraborty, D., Ahmad, M. S., & Seth, A. (2017). Findings from a civil society mediated and
technology assisted grievance redressal model in rural India. In Proceedings of the Ninth
International Conference on Information and Communication Technologies and Development.
Chu, G., Satpathy, S., Toyama, K., Gandhi, R., Balakrishnan, R., & Menon, S. R. (2009, April).
Featherweight multimedia for information dissemination. In 2009 International Conference on
Information and Communication Technologies and Development (ICTD) (pp. 337–347). IEEE.
Crabbe, A. (2012). Three strategies for sustainable design in the developing world. Design Issues,
28(2), 6–15.
1 Introduction to Development Engineering
13
Cristia, J., Ibarrarán, P., Cueto, S., Santiago, A., & Severín, E. (2017). Technology and child
development: Evidence from the one laptop per child program. American Economic Journal:
Applied Economics, 9(3), 295–320.
Demirguc-Kunt, A., Klapper, L., Singer, D., Ansar, S., & Hess, J. (2018). The Global Findex
Database 2017: Measuring financial inclusion and the fintech revolution.. The World Bank.
Donaldson, K. (2009). The future of design for development: three questions. Information
Technologies & International Development, 5(4), 97.
Dunn, P. D. (1979). Appropriate technology: Technology with a human face. Macmillan International Higher Education.
Dupas, P. (2014). Getting essential health products to their end users: Subsidize, but how much?
Science, 345(6202), 1279–1281.
Dym, C. L., et al. (2005). Engineering design thinking, teaching, and learning. Journal of
engineering education, 94(1), 103–120.
Enikolopov, R., Makarin, A., & Petrova, M. (2020). Social media and protest participation:
Evidence from Russia. Econometrica, 88(4), 1479–1514.
Fink, C. (2018). Dangerous speech, anti-muslim violence, and facebook in Myanmar. Journal of
International Affairs, 71(1.5), 43–52.
Foster, A., & Rosenzweig, M. (2008). Inequality and the sustainability of agricultural productivity
growth: Groundwater and the Green Revolution in rural India. In Prepared for the India Policy
Conference at Stanford University (Vol. 5).
Gupta, A. K. (2006). From sink to source: The Honey Bee Network documents indigenous
knowledge and innovations in India. Innovations: Technology, Governance, Globalization,
1(3), 49–66.
Higginbottom, T. P., Adhikari, R., Dimova, R., Redicker, S., & Foster, T. (2021). Performance of
large-scale irrigation projects in sub-Saharan Africa. Nature Sustainability, 1–8.
Immelt, J. R., Govindarajan, V., & Trimble, C. (2009). How GE is disrupting itself. Harvard
Business Review, 87(10), 56–65.
Jensen, R. (2007). The digital provide: Information (technology), market performance, and welfare
in the South Indian fisheries sector. The Quarterly Journal of Economics, 122(3), 879–924.
Johri, A., & Pal, J. (2012). Capable and convivial design (CCD): a framework for designing
information and communication technologies for human development. Information Technology
for Development, 18(1), 61–75.
Judge, B. M., Hölttä-Otto, K., & Winter, A. G. (2015). Developing world users as lead users: a
case study in engineering reverse innovation. Journal of Mechanical Design, 137(7).
Keynes, J. M. (2018). The General Theory of Employment, Interest, and Money. Springer.
Kraemer, K. L., Dedrick, J., & Sharma, P. (2009). One laptop per child: vision vs. reality.
Communications of the ACM, 52(6), 66–73.
Kremer, M., Miguel, E., Mullainathan, S., Null, C., & Zwane, A. P. (2011). Social engineering:
Evidence from a suite of take-up experiments in Kenya. Unpublished Working Paper.
Landes, D. S. (2003). The unbound Prometheus: technological change and industrial development
in Western Europe from 1750 to the present. Cambridge University Press.
Levine, D. I., Agogino, A. M., & Lesniewski, M. A. (2016). Design thinking in development
engineering. International Journal of Engineering Education, 32(3), 1396–1406.
Madon, T., et al. (2007). Implementation science, 1728–1729.
Manacorda, M., & Tesei, A. (2020). Liberation technology: Mobile phones and political mobilization in Africa. Econometrica, 88(2), 533–567.
Mani, A., et al. (2013). Poverty impedes cognitive function. Science, 341(6149), 976–980.
Martin-Simpson, S., Parkinson, J., & Katsou, E. (2018). Measuring the benefits of using market
based approaches to provide water and sanitation in humanitarian contexts. Journal of
Environmental Management, 216, 263–269.
Mbiti, Isaac, and David N. Weil. “Mobile banking: The impact of M-Pesa in Kenya.” African
Successes, Volume III: Modernization and Development. University of Chicago Press, 2015.
247-293.
Mokyr, J. (2018). The British industrial revolution: an economic perspective. Routledge.
14
A. Agnihotri et al.
Mudliar, P., Donner, J., & Thies, W. (2012). Emergent practices around CGNet Swara, voice forum
for citizen journalism in rural India. Proceedings of the Fifth International Conference on
Information and Communication Technologies and Development.
Mullainathan, S., & Shafir, E. (2013). Scarcity: Why having too little means so much. Macmillan.
Nelson, R. R., & Nelson, R. R. (2005). Technology, institutions, and economic growth. Harvard
University Press.
Nilsson, L., Madon, T., & Shankar Sastry, S. (2014). Toward a new field of development
engineering: linking technology design to the demands of the poor. Procedia Engineering, 78,
3–9.
Null, C., Kremer, M., Miguel, E., Hombrados, J. G., Meeks, R., & Zwane, A. P. (2012). Willingness
to pay for cleaner water in less developed countries: Systematic review of experimental
evidence. In The International Initiative for Impact Evaluation (3iE).
Patel, N., Chittamuru, D., Jain, A., Dave, P., & Parikh, T. S. (2010). Avaaj otalo: a field study
of an interactive voice forum for small farmers in rural india. In Proceedings of the SIGCHI
Conference on Human Factors in Computing Systems (pp. 733–742).
Pierskalla, J. H., & Hollenbach, F. M. (2013). Technology and collective action: The effect of cell
phone coverage on political violence in Africa. American Political Science Review, 207–224.
Piketty, Thomas. “Capital in the 21st Century.” (2014).
Pingali, P. L. (2012). Green revolution: impacts, limits, and the path ahead. Proceedings of the
National Academy of Sciences, 109(31), 12302–12308.
Polak, Paul. Out of poverty: What works when traditional approaches fail.. ReadHowYouWant.
com, 2009.
Polanyi, K., & MacIver, R. M. (1944). The great transformation (Vol. 2). Beacon press.
Postel, S., et al. (2001). Drip irrigation for small farmers: A new initiative to alleviate hunger and
poverty. Water International, 26(1), 3–13.
Prahalad, Coimbatore K. The fortune at the bottom of the pyramid, revised and updated 5th
anniversary edition: Eradicating poverty through profits. FT Press, 2009.
Radjou, N., Prabhu, J., & Ahuja, S. (2012). Jugaad innovation: Think frugal, be flexible, generate
breakthrough growth. Wiley.
Rostow, W. W. (1960). The Five Stages of Growth–A Summary (pp. 4–16).
Roy, B., & Hartigan, J. (2008). Empowering the rural poor to develop themselves: The barefoot
approach (Innovations case narrative: barefoot college of Tilonia). Innovations: Technology,
Governance, Globalization, 3(2), 67–93.
Rybczynski, Witold. “Paper heroes; a review of appropriate technology.” (1980).
Schumacher, E. F. (2011). Small is beautiful: A study of economics as if people mattered. Random
House.
Smith, A. (2010). The Wealth of Nations: An inquiry into the nature and causes of the Wealth of
Nations.. Harriman House Limited.
Solow, R. M. (1957). Technical change and the aggregate production function. The Review of
Economics and Statistics, 312–320.
Spinuzzi, C. (2005). The methodology of participatory design. Technical Communication, 52(2),
163–174.
Steen, M. (2013). Co-design as a process of joint inquiry and imagination. Design Issues, 29(2),
16–28.
Stellar, D. (2010). The PlayPump: what went wrong? In State of the Planet The PlayPump What
Went Wrong Comments, Np 1.
Sterling, S. R., & Bennett, J. K. (2012). Three Bad Assumptions: Why Technologies for Social
Impact Fail. International Journal of Computational Engineering Research (IJCER), 2(4),
1012–1015.
Toyama, K. (2015). Geek heresy: Rescuing social change from the cult of technology. Public
Affairs.
Willoughby, K. W. (1990). Technology choice: A critique of the appropriate technology movement.. Dr Kelvin Wayne Willoughby.
1 Introduction to Development Engineering
15
Winter, A., & Govindarajan, V. (2015). Engineering reverse innovations principles for creating
successful products for emerging markets. Harvard Business Review, 93(7-8), 80–89.
World Bank Group. (2016). World development report 2016: digital dividends. World Bank
Publications.
Yeh, C., Perez, A., Driscoll, A., Azzari, G., Tang, Z., Lobell, D., . . . Burke, M. (2020). Using
publicly available satellite imagery and deep learning to understand economic well-being in
Africa. Nature communications, 11(1), 1–11.
Open Access This chapter is licensed under the terms of the Creative Commons Attribution 4.0
International License (http://creativecommons.org/licenses/by/4.0/), which permits use, sharing,
adaptation, distribution and reproduction in any medium or format, as long as you give appropriate
credit to the original author(s) and the source, provide a link to the Creative Commons license and
indicate if changes were made.
The images or other third party material in this chapter are included in the chapter’s Creative
Commons license, unless indicated otherwise in a credit line to the material. If material is not
included in the chapter’s Creative Commons license and your intended use is not permitted by
statutory regulation or exceeds the permitted use, you will need to obtain permission directly from
the copyright holder.
Chapter 2
Technology and Development
Menna Bishop, Robin Burgess, and Céline Zipfel
1 Introduction
Two major challenges face humanity in the coming century. The first is to generate
the innovations and productivity improvements that will keep people on a path
to higher standards of living. The second is to ensure that expanding human
activity does not generate negative environmental externalities that block this path
to progress.1 In short, our future is about balancing the need for growth with the
externalities that arise from that growth.
1 Both
these challenges are enshrined in the sustainable development goals (SDGs): SDG1 – “End
poverty in all its forms everywhere”; SDG2 – “End hunger, achieve food security and improved
nutrition, and promote sustainable agriculture”; SDG3 – “Ensure healthy lives and promote wellbeing for all at all ages”; SDG4 – “Ensure inclusive and equitable quality education and promote
lifelong learning opportunities for all”; SDG6 – “Ensure availability and sustainable management
of water and sanitation for all”; SDG7 – “Ensure access to affordable, reliable, sustainable and
modern energy for all”; SDG8 – “Promote sustained, inclusive and sustainable economic growth,
full and productive employment and decent work for all”, SDG9 – “Build resilient infrastructure,
promote inclusive and sustainable industrialization, and foster innovation”; SDG12 – “Ensure
sustainable consumption and production patterns”; SDG13 – “Take urgent action to combat climate
change and its impacts”; SDG14 – “Conserve and sustainably use the oceans, seas and marine
resources for sustainable development.”
M. Bishop
University of Warwick, Coventry, UK
e-mail: menna.bishop@warwick.ac.uk
R. Burgess ()
London School of Economics, London, UK
e-mail: r.burgess@lse.ac.uk
C. Zipfel
Stockholm School of Economics, Stockholm, Sweden
e-mail: Celine.Zipfel@hhs.se
© The Author(s) 2023
T. Madon et al. (eds.), Introduction to Development Engineering,
https://doi.org/10.1007/978-3-030-86065-3_2
17
18
M. Bishop et al.
How both these challenges play out will be determined in large part by what
happens in developing countries. It is here that the need to banish poverty is greatest.
Indeed, 196 countries have signed up to the goal of eliminating extreme poverty by
2030. It is also in developing countries that environmental externalities from growth
are increasing at the most rapid rate and where populations stand to be most affected.
These challenges are both complex and multifaceted and so require not just
the development of new innovations but also their careful adaption to developing
country contexts. Ensuring that new technologies work when deployed at scale in
this way will require the coming together of engineers, technologists, economists,
and policymakers. It is this collaborative approach to addressing development
challenges which is at the core of development engineering.
This chapter provides an overview of some of the research areas where technology and development can be brought together in a fruitful manner. As with any
nascent field, this is a preliminary and incomplete set of topics which is intended to
foster and encourage further research in this exciting and important area of work.
We begin with the role of technology in shaping productivity and economic
growth. A focus on productivity and growth is inescapable when one is considering
poor populations and poor countries. This makes it natural for us to devote considerable attention to the role of technology in the production side of the economy.
Hence, we consider how technological innovations can make firms in agriculture,
manufacturing, and services more productive. Here, it will be made clear that
information and communication technologies (ICTs) such as mobile phones have
a critical role to play. The chapter also examines how trade can be made to flow
more freely, both internally within countries and externally between countries,
and the development benefits that follow from this. Furthermore, we explore how
investments in communication and transportation infrastructures can improve the
functioning of markets and accelerate structural change and the movement of people
from less productive to more productive jobs.
Structural change is ultimately what drives poverty downwards as workers
become more productive.2 For most poor people in the world, labor is their only
asset. This means that much of development is about getting people into better jobs,
with people’s incomes largely being determined by the returns on their labor. We
therefore consider how technology can be harnessed in this vital process, both in
improving the efficiency of job search and matching and in expanding the size of
the markets within which people can sell their labor. We also comment on how the
automation of labor market activities brings both challenges and opportunities as
the nature of work changes across the world. Finally, this section will summarize
evidence on how technology can be used in schools to widen access to quality
education.
Also central to production, particularly for populations with little capital, is
access to financial technologies such as mobile money. These are beginning to
2 Structural change in the economy is a process involving the movement of people from less
productive jobs (e.g., subsistence agriculture) to more productive jobs.
2 Technology and Development
19
transform the landscape of financial services in the developing world by bringing the
ability to borrow and save to populations who have traditionally been excluded from
formal financial institutions, thus allowing them to fund new productive activities.
These financial technologies may also expedite the movement of money and make
households more resilient when hit with different types of shocks. Finally, digital
payment technologies are increasingly being used by governments and firms to
reduce leakages in payment systems, whether this be payments for workers or
welfare transfers to poor populations. Together, these can bring improvements in
efficiency and changes in household financial behavior that stand to have long-run
implications for development.
It is clear that different inputs are needed for people and firms to take on
the modern production activities that drive structural change. One key input is
electricity. Our chapter will outline how innovations in renewables such as solar are
being combined with technological improvements in national grids to universalize
access to electricity. This is revolutionizing the choice of electricity source for firms
and households across the developing world, many of whom have been entirely
without access to electricity until now. Given that the bulk of greenhouse gas
emissions come from the combustion of fossil fuels, one major issue that needs
to be confronted in the energy space is how electricity is generated and how the
associated environmental externalities are reflected in policies and pricing. Equally
critical is the removal of electricity theft and subsidies which are often regressive
but are endemic to public utilities in several developing countries. Improvements
in generation technologies, energy efficiency, and technologies for monitoring
consumption can all be harnessed to ensure that rapid growth in electricity demand
in developing countries will be met in a manner that is as sustainable as possible.
This concern with sustainability extends beyond the issue of energy generation
and is discussed throughout the chapter. Both growth and the externalities from
growth are now deemed central to the study of development economics, which was
not the case a decade ago. As such, we will consider how human activity will
affect the environment and how technology can be used to minimize the negative
environmental externalities that emanate from this activity in a range of different
areas, including agriculture and transport. This will involve considering what type
of growth is occurring, including the kinds of firms involved and the types of work
people engage in but also how technology can be harnessed to counter processes
like climate change.
Strong state capacity is required to steer a path towards sustainable growth and
development. Here, there is increasing recognition that technology can play an
important role, both in the form of platforms that promote political engagement
and in applications that serve to increase the accessibility, monitoring, and integrity
of elections. Together, these serve to improve the accountability of governments to
citizens and help close the gap between the design of policy and its implementation
that often exists in developing countries. Closing this gap can lead to improvements
in the functioning of the state, for example, in ensuring that populations have access
to a higher quality of public services.
20
M. Bishop et al.
In the final part of the chapter, we consider how technology can play a role in
development by shaping access to healthcare. Exciting new work is documenting
how, in doing so, technology can help to bridge the gap in health between developing
and developed countries. This also loops back into what types of work people can
do, the returns to their labor, and how well firms function.
The complexity of the development challenges that humanity is facing in each
of these areas demands that technological innovations and ideas be brought to bear
on them. This is what makes the study of development engineering so important. It
is really about bringing in frontier thinking from technology into development, to
guide interventions and policy decisions. Only in doing so will we have a chance at
achieving the difficult balance between ending extreme poverty by 2030 and doing
so in a way that does not block the path of prosperity for future generations.
2 Firms, Trade, and Infrastructure
The relationship between technology and productivity is at the core of many economic models, with theories that stress the importance of technological innovations
for sustained growth making up a significant share of the growth economics literature (e.g., Solow, 1957; Aghion & Howitt, 1992; Romer, 1990). In this section, we
review the existing literature on two channels linking technology to development,
an area of research that remains comparatively small. First, technology can improve
productivity in firms and agriculture. Second, technology can facilitate trade,
enhancing the integration of markets both within and across countries (Donaldson,
2015). These in turn have the propensity to accelerate the structural change process
which underpins economic development.
2.1 Boosting Productivity in Firms and Agriculture
2.1.1
Agriculture
To date, agricultural productivity remains relatively low in the world’s poorest
regions, with subsistence farming still the most widespread occupation in many
developing countries (Lowder et al., 2016). An important body of research in development economics has been dedicated to understanding the role technology can play
in rectifying these vast disparities in productivity across countries. This may take
the form of agricultural biotechnologies, including improved seeds and fertilizers
promising higher yields, or ICTs used to receive and share agriculture-relevant
information. The hope is that resulting shifts in productivity can eventually enable
developing countries to jumpstart their structural change processes, facilitating the
flow of labor from agriculture into the manufacturing and service sectors.
2 Technology and Development
21
The adoption of agricultural biotechnologies such as improved fertilizers and
seeds has been a hallmark of production in many developed countries, given
their proven impact on yields and cost (Brookes & Barfoot, 2018). Many have
studied how these benefits have been extended to developing countries, who in
2018 accounted for 54% of global biotech crop area (ISAA, 2018). For example,
in a study in Kenya, Duflo et al. (2008) estimated annualized rates of return of
70% to the use of chemical fertilizer. Similarly, Bustos et al. (2016) study the
introduction of genetically engineered soybean seeds in Brazil and its positive
impact on agricultural productivity. They show that such technologies can in turn
trigger industrial growth, releasing labor from agriculture and allowing it to shift
towards industry and services.
ICTs represent another avenue for boosting agricultural productivity in developing countries. This encompasses the use of mobile phones, Internet, television, and
radio to receive and share information on prices, weather, and farming techniques,
both within private networks and as part of government initiatives. By improving
information circulation and connectivity, ICTs stand to help farmers optimize
production decisions. Rosenzweig and Udry (2019) shed further light on this in
their study of weather forecasts in India. They argue that accurate forecasts increase
profits by allowing farmers to allocate resources to exploit rainfall conditions. For
example, in areas where forecasts are accurate, they show that a pessimistic forecast
lowers planting-stage investment and use of rainfall-sensitive crops. In settings such
as India (Jensen, 2007) and Niger (Aker, 2010), the use of mobile phones for sharing
price information was furthermore shown to promote arbitrage in fish and grain
markets.
ICTs can also reduce the cost of agricultural extension services, particularly in
low population density regions. Fabregas et al. (2019) discuss how this may be vital
for increasing exposure to science-based agriculture advice. They furthermore note
that GPS-enabled devices may facilitate the tailoring of information, for example,
notifying farmers of local pest outbreaks, as well as two-way communication,
where farmers are able to ask specific questions. Digital Green is one development
organization harnessing ICTs in this way. It connects farmers with experts and
disseminates information via video. In India, it was shown to increase adoption of
certain practices sevenfold relative to traditional training and visit-based extension
approaches and to be 10 times more effective per dollar spent (Ghandi et al., 2009).
Overall, in sub-Saharan Africa and India, meta-analyses indicate that information
transmission via mobiles has increased yields by 4% and the likelihood of adopting
recommended agrochemical inputs by as much as 22% (Fabregas et al., 2019).
Despite significant enthusiasm for biotech crops, development initiatives have
sometimes been confronted with poor adoption rates, presenting an important puzzle
for economists and policymakers. Where returns have proven heterogeneous across
farmers, this may simply reflect optimal decision-making. For example, in rural
Kenya, Suri (2011) showed that at least some farmers are better off not adopting
technologies such as hybrid maze. In other cases, however, returns to a technology
have been shown to significantly exceed the cost of the investment, implying other
constraints might be at play (Duflo et al., 2011).
22
M. Bishop et al.
Here, one important strand of the literature has emphasized the role of market
inefficiencies, including poor infrastructure, insecure land rights, and missing
markets, particularly in the area of financial services (Jack, 2011). For example,
where agriculture is rain-fed and farmers lack access to formal insurance, incentives
to invest in inputs and technologies may be diminished. This has been tested
experimentally in Ghana by Karlan et al. (2014), who find that when provided with
insurance against the primary risks they face, farmers could find the resources to
increase expenditures on their farms. Similarly, even where the benefits of ICTs are
well known, farmers may be unable to access or act on information due to lack of
telecommunications, electricity, and transportation infrastructure or illiteracy.
Behavioral factors can also inhibit the diffusion of agricultural technologies. In
the case of ICTs, for example, information disseminated via these interfaces may not
be afforded the same level of trust as that shared via social networks and traditional
extension services. Here, some have pointed to the role of social learning and
network effects in the diffusion of agricultural technologies. Studies such as Foster
and Rosenzweig (1995), Conley and Udry (2010), Bandiera and Rasul (2006), and
Duflo et al. (2010) suggest that their adoption might pose less of a risk for poor
farmers when the cost of experimentation is shared with others.
Interlinked with the desire to increase agricultural efficiency are sustainability
concerns. It has been estimated that the global population will reach 9 billion by
2050, which will demand a 60% increase in agricultural production (Alexandratos
& Bruinsma 2012). However, this intensification risks accelerating climate change
through its contribution to greenhouse gas emissions and resource degradation.
Moreover, our ability to meet the growing global demand is in itself threatened
by climate change and the damaging impact of changing weather patterns on
yields, increasing the risk of food insecurity in developing regions (Ignaciuk &
Mason-D’Croz, 2014). As such, it is imperative that agricultural technologies enable
farmers’ adaptation to a changing climate while minimizing any further environmental degradation. Evidence suggests that biotechnologies have contributed
significantly to agriculture’s sustainability, for example, by reducing the need for
pesticide spray and facilitating cuts in fuel use and tillage changes (Brookes &
Barfoot, 2018). There has also been much enthusiasm surrounding conservation
agriculture (CA) practices. Centered on diversified crop rotation, minimum soil
tillage, and maintenance of permanent soil cover, these intend to prevent soil erosion
and degradation and enhance biodiversity whilst improving yields (FAO, 2001).
One notable application of CA is the Kenya Cereal Enhancement Program –
Climate Resilience Agricultural Livelihoods Window (KCEP-CRALW), co-funded
by the European Union and the International Fund for Agricultural Development
(IFAD). This provides smallholders with access to training, improved inputs, and
CA services through an electronic voucher system, hoping to reduce poverty and
promote food security in Kenya’s vast arid lands (IFAD, 2015). IFAD reports that
the initiative has already reached 83,000 famers and is currently being scaled up
throughout Kenya (IFAD, 2020). However, evidence regarding the success of CA
in practice has been mixed. For example, in a study of rural Zimbabwe, Michler
et al. (2019) find that CA produces no yield gains and sometimes yield losses in
2 Technology and Development
23
years of average rainfall, but does mitigate the negative impacts of deviations in
rainfall. Other studies have shown that yield gains are heavily context-dependent
and may only be observable after several years (Stevenson et al., 2014). Ultimately,
rigorous evidence on the effectiveness of these technologies and the potential tradeoffs involved in their uptake remains limited, as are adoption rates. As such, this
must be an important focus for research in coming years.
Overall, much remains unknown as to the constraints to technology adoption
in agriculture. Solutions might lie in packaged interventions that relax multiple
constraints simultaneously, for example, making complementary infrastructure
investments. Another area worthy of further investigation is the unequal adoption
of biotech crops across the developing world. While adoption of biotech crops
has reached over 90% in countries such as Brazil, Argentina, and India, other
regions have been lagging behind (ISAAA, 2018). This links to persisting political
opposition to genetically modified crops in certain regions, which must be met with
dialogue between plant scientists, economists, and policymakers across countries
(Elliott & Keller, 2016). Simultaneously, research must continue to seek paths to
achieve sustainable intensification of our agricultural production.
2.1.2
Firms
Another fundamental link between technology and development relates to its ability
to improve the productivity of firms in manufacturing and services. Neoclassical
economic theory has long accepted technological change as the sole driver of longterm growth since the seminal work of Solow (1957). This prompted a vast body of
research aimed at understanding the drivers of productivity (Syverson, 2011; Bloom
& Van Reenen, 2010) and testing the impact of technological innovations.
In the context of developed countries, various studies have documented a positive
impact of new technologies on industry-wide productivity. One notable example is
the minimill’s introduction to the US steel manufacturing sector, to which CollardWexler and De Loecker (2015) attribute a significant increase in productivity in the
second half of the twentieth century. Here, they identify a reallocation of output
among incumbents, where the least productive firms that failed to adopt the new
technology were driven out of the industry. Other evidence has robustly linked the
1990s acceleration in US productivity to the development of ICTs.3 For example,
focusing on the valve manufacturing industry, Bartel et al. (2007) find that new
IT investments improved the efficiency of all stages of the production process and
increased the skill requirements of machine operators.
There also exists a small but growing literature on technology’s role in firm
and sector productivity in the developing world. Exploiting firm-level survey data,
Commander et al. (2011) find evidence of a large, positive productivity effect of ICT
3 See Draca, Sadun, and Van Reenen (2007) for a review of the literature on ICTs and firm
productivity.
24
M. Bishop et al.
adoption in both Brazil and India. In Brazil, this effect was largest for firms simultaneously investing in flattening organizational structures and, in India, in areas
with better infrastructure. Moreover, ICT capital intensity was negatively correlated
with poor infrastructure and pro-worker labor regulation. A more recent study by
Atkin et al. (2017a) investigates the introduction of a new cutting technology in
Pakistan’s soccer-ball industry. While this was found to reduce waste and increase
technical efficiency for nearly all firms in the sector, adoption rates were low when
the technology was offered free of charge to a random subset of these. The authors
attribute this to misaligned incentives in piece-rate contracts, where employees
were initially slowed by the new technology and faced no private incentive to
reduce waste, resulting in resistance to adoption. Indeed, when employees were
offered financial incentives conditional on demonstrating competence in using the
technology, adoption increased significantly.
Ultimately, the literature on technology’s impact on firm productivity in developing countries remains in its nascent stages. However, the examples above provide an
important cautionary tale for policymakers – though new technologies can be highly
effective at raising productivity in firms, we must not lose sight of the conditions
that encourage adoption and high returns. This should involve consideration of
infrastructure investments and the regulatory environment.
2.2 Facilitating Trade
Firms and households in developing countries face relatively restricted access to
markets. Whether a result of policy barriers (e.g., regulations) or poor transportation
infrastructure, this prevents firms from engaging in trade and inhibits the transfer
of technology. This also stops households from accessing cheaper goods and
seeking more productive work opportunities which are key drivers of growth and
development. As such, many experts have argued for measures to facilitate trade,
such as investments in transportation infrastructure. The use of ICTs can also help
to overcome transport costs and facilitate arbitrage, improving market efficiency and
firm performance and reducing waste.
A small but growing empirical literature emphasizes the positive welfare effects
of trade for both producers and consumers in developing countries. For example,
Atkin et al. (2017b) randomize access to export markets for small carpet-making
firms in Egypt. They find evidence of “learning by exporting,” where exporting firms
witnessed improvements in technical efficiency, resulting in higher output quality
and profits. On the consumer side, Atkin et al. (2018) study retail FDI (foreign
supermarkets’ entry into the local retail sector) in Mexico. They detect large welfare
gains for the average household, primarily driven by lower living costs. Finally,
Redding and Sturm (2008) offer rigorous evidence on the importance of market
access for economic development using Germany’s division and reunification as a
natural experiment.
2 Technology and Development
25
One important factor that inhibits trade and its associated welfare benefits
is high transportation costs. In recent years, a number of studies have demonstrated how combatting this via infrastructure investments can accelerate economic
development. For example, railroads – a major technological advancement of the
nineteenth century – were shown to facilitate internal trade and market access
and produce lasting growth and welfare effects in settings such as colonial India
(Donaldson, 2018) and nineteenth-century US (Donaldson & Hornbeck, 2016).
Similarly, focusing on 15 countries in sub-Saharan Africa who have a port as their
largest city, Storeygard (2016) finds that incomes in secondary cities are highly
sensitive to the cost of transport to the largest city.
By reducing transport costs, transportation infrastructure investments also allow
households to access external work opportunities, which may improve the allocation
of human capital. For example, Morten and Olivera (2018) study the road networks
connecting Brasilia and Brazil’s state capitals. These are shown to have decreased
both trade and migration costs, resulting in important welfare gains. Adukia et al.
(2020) focus instead on transport networks to rural areas in their study of India’s
$40 billion program to construct all-weather roads to nearly 200,000 villages. They
detect a positive impact on adolescent schooling outcomes, particularly in areas
where the relative return to high-skill work increased the most. This is consistent
with market access having raised the return to human capital investment, suggesting
the potential for long-run gains to infrastructure investments. In a later study of the
same intervention, Asher and Novosad (2020) detect a large reallocation of workers
out of agriculture. This is reinforced by a model developed by Gollin and Rogerson
(2014) in which reducing transportation costs generates agricultural productivity
gains, in turn decreasing the fraction of people working in subsistence farming.
On the other hand, another strand of the literature has cautioned that gains
from infrastructure and trade may be unevenly distributed. This may be the case
where certain regions are disadvantaged in ways that prevent them from realizing
the benefits of improved market access and instead are confronted with issues
such as capital flight. Faber (2014) explores this question in his study of China’s
National Trunk Highway system, as a by-product of which many peripheral
counties were connected to major production centers. He argues that declining
trade costs produced adverse growth effects for peripheral regions as economic
activity and employment were displaced to urban regions. In another study of
China’s transportation networks, Banerjee et al. (2020a) detect only a small positive
effect on sectoral GDP per capita and no effect on growth. Tsivanidis (2018) sheds
further light on the distribution of infrastructure gains, focusing on urban public
transport. He studies the construction of the world’s largest bus rapid transit system
in Bogotá, estimating large aggregate output and welfare gains. However, he finds
that these were accrued slightly more by high-skilled workers, despite this being a
service relied upon more by the low skilled. His model points to knock-on effects
on commuting costs, commuting decisions, and wages. Together, these studies
underline the emphasis that must be placed on general equilibrium effects in the
study of transportation infrastructure and provide a cautionary note to policymakers
attempting to use such investments as means of targeting certain groups or regions.
26
M. Bishop et al.
Another consideration which must factor importantly into infrastructure investments relates to environmental concerns. For example, Balboni (2019) documents
the high coastal concentration of populations and infrastructure and demonstrates
the negative impact of rising sea levels on the profitability of this allocation. She
argues that, under a central sea-level rise scenario, 72% higher welfare gains could
have been achieved by a foresighted allocation avoiding the most vulnerable regions.
Others have cautioned that improved transportation infrastructure risks deforestation
and biodiversity loss (Damania & Wheeler, 2015; Dasgupta & Wheeler, 2016).
These highlight the importance of accounting for future environmental change when
making contemporary infrastructure investment decisions. Sustainability considerations must also steer the nature of the transportation investments being made and
how these are powered. Here, an encouraging example is India’s Dedicated Freight
Corridor, a major infrastructure investment which stands to increase India’s share of
rail in freight transportation and generate significant reductions to CO2 emissions
(Pangotra & Shukla, 2012).
Alongside transportation infrastructure, another force which may act to facilitate
trade is the improved circulation of market information. The fast expansion of ICTs,
in particular mobile phones, has been shown to generate major efficiency gains. For
example, Jensen (2007) documents how the 1997–2000 expansion of mobile phone
coverage along India’s Keralan coast allowed fishermen to call sellers at different
markets in search of the best price for their output. This resulted in a dramatic
fall in price variation across local markets, higher profits, and the elimination of
waste, generating welfare gains for producers and consumers alike. Similarly, Aker
(2010) finds that the 2000–2006 introduction of mobile phones in Niger reduced
price dispersion by 10–16% and increased profits, which she attributes to reduced
search costs for farmers.
3 Labor Markets and Structural Change
Development is all about structural change, that is the movement of people from less
productive to more productive jobs. In many cases, this involves movement across
geography, for example, from the countryside to cities or from poor to rich countries.
How technology can encourage this process of development is an area of significant
interest in which research in economics is beginning to make some inroads. These
technologies, however, also imply that the nature of work is changing, with the
enormous expansion of platform-type employment as well as the disruption arising
from the mechanization of many occupations. Technology thus has the ability to
create new employment opportunities as well as to destroy them. Navigating the
path to understanding how technology influences labor markets will require careful
investigation into how precisely occupational structures are being affected, rather
than assuming that technology will be either a good or a bad thing for employment.
2 Technology and Development
27
3.1 Bridging the Employer-Employee Information Gap
Research has shown labor market frictions to be an important impediment to firm
growth (Greenwald, 1986; Gibbons & Katz, 1991; Abebe et al., 2017a, 2017b),
suggesting that improving the efficiency of the job-matching process could be
crucial for developing countries. This may be especially the case given their
large youth populations, with over ten million Africans entering the labor force
annually (Mohammed, 2015), coupled with the high youth unemployment rates
characterizing many poorer regions (McKenzie, 2017). Here, technology offers
immense opportunities, particularly in labor markets where information may be
scarce and for workers considering migration.
In their seminal paper, Bryan et al. (2014) show that encouraging workers to
seasonally migrate to cities improves the welfare of rural households in Bangladesh.
This is predicated on workers being able to find jobs. Technologies which allow
them to do so and indeed allow employers to contract workers for specific tasks
are becoming ever more prevalent across the developing world. For example, many
of India’s migrant workers are contracted online by recruitment companies to fill
positions carrying out a huge range of services in Indian cities. Babajob is the
country’s largest marketplace for informal and entry-level formal jobs, having
registered 6.1 million jobseekers and over 370,000 employers across India as of
2018. To promote its accessibility, the platform offers a range of online and offline
access options, including Internet, text messaging, and interactive voice response
(GIE, 2018).
The availability of contracting online has also meant that large numbers of
workers from low- and middle-income countries can secure employment across
international borders before migrating to these jobs. Some obvious examples of this
are the huge numbers of workers who move from India, Pakistan, and Bangladesh
to the Gulf countries to work in construction and other activities.4 But online
contracting is also central to the movement of health workers and domestic maids,
for example, from the Philippines to a whole range of countries (Calenda, 2016).
The advent of these technologies implies that labor markets have become much
broader, in effect expanding job opportunities from the national to the international.
While the benefits in theory could be large, existing research on technology’s
impact on the efficiency of the job-matching process is extremely limited. Dammert
et al. (2013) provide the first experimental evidence in a study of a public
labor market intermediation service (LMI) in Peru, randomly assigning registered
job seekers to be contacted via SMS or traditional methods (in person or by
phone). They detect a positive impact on employment which was larger for SMS
intermediation, though not statistically significantly so. Moreover, the employment
effect dissipated after 3 months and was not accompanied by an effect on matching
efficiency. They furthermore note that those with less labor market experience
4 See, for example, the Musaned electronic platform used in Saudi Arabia to hire Bangaldeshi
domestic workers.
28
M. Bishop et al.
seemed to benefit less from the service and were less likely to search for jobs
through digital means. Ultimately, digitization of the intermediation service proved
both viable and cost-effective but was not in any way transformative.
Overall, the body of research on these technologies is too small to reach a
conclusion regarding their impact on job search behavior, migration, unemployment duration, the quality of matches, and labor market efficiency in developing
countries. Moving forward, attention should also be paid to their inclusionary
potential, for example, the effectiveness of Babajob’s use of different access options
in combatting potential barriers such as illiteracy. Ultimately, it is also clear that
technologies that facilitate job search will be restricted to regions with sufficient
telecommunications and electricity infrastructures. Complementary investments in
these will be vital to ensure the success of any such platforms. However, it is
clear that by increasing the size of the markets over which workers can search
and by improving matches between employers and workers, these technologies
undoubtedly hold promise.
3.2 Transforming the World of Work
Technological advances prompt questions about the future of work, with automation
and digitization threatening the existence of jobs that can be carried out by robots.
Prominent examples include assembly-line work and clerical jobs involving “routine
tasks” (Autor et al. 2003). Indeed, various studies have attributed declines in
employment in these positions in the US across the twentieth century to automation
and digitization (Autor et al., 2003; Autor, 2015; Levy & Murnane, 2004). Conversely, others have emphasized complementarities between automation and human
labor, painting a more optimistic picture for the future of work. This relates to a
conjecture by Autor (2014) that some tasks may be inherently “uncodifiable.” In this
way, automation may enhance the value of labor that humans can uniquely supply
and protect certain occupations from substitution altogether. This is consistent with
the phenomenon of job polarization that has been well-documented in developed
countries, i.e., the simultaneous growth of high-skill, high-wage and low-skill, lowwage occupations.5
What can these debates, which have largely revolved around developed countries,
tell us about what lies in store for countries at earlier stages in the structural change
process? On the one hand, the “alarmist” view argues that larger employment
shares in low-skill work in developing countries imply that more of their jobs
could feasibly be taken over by technological change that is skill-biased. Indeed, the
World Bank (2016) estimates that two-thirds of all jobs in developing countries are
susceptible to automation. Others have furthermore warned of potential “reshoring,”
5 See
Goos & Manning 2007; Goos et al., 2014; Autor & Dorn 2013; Autor et al., 2015; Autor et
al., 2006, 2008; Autor 2014; Michaels et al., 2014; Graetz & Michaels 2015.
2 Technology and Development
29
where labor in poorer countries gradually loses its cost advantage to robots in
richer ones, ceasing the outsourcing of manufacturing that has hitherto been an
important source of growth (Schlogl & Sumner, 2018; Maloney & Molina, 2016).
For these reasons, Schlogl and Sumner (2018) project that, in developing countries,
automation will cause wage stagnation and “premature deindustrialization,” as
proposed by Rodrik (2016). On the other hand, by breaking existing barriers to entry
and efficiency, Maloney and Molina (2016) argue that technology may support new
ICT-intensive industries. For example, Kenya’s M-PESA mobile money program
works with nearly 400,000 agents across the Democratic Republic of Congo,
Egypt, Ghana, Kenya, Lesotho, Mozambique, and Tanzania (Vodafone, 2020), and
India’s IT sector created 200,000 new jobs in 2019 alone (Bhattacharya, 2020).
Further dampening concerns surrounding automation, others have pointed out that
technologies typically diffuse at an altogether slower rate in developing countries.
Indeed, many of the jobs being carried out by humans in poorer regions have longsince been automated in developed countries (World Bank, 2016).
Several notable attempts have been made to quantify technology’s impact on
labor markets in developing countries to date. Maloney and Molina (2016) use
census data to test for job polarization in the developing world, of which they find
no strong evidence. However, they point to a relative decline in employment in the
“plant and machine operators and assemblers” category in Indonesia, Brazil, and
Mexico since around 2000 as potential evidence of incipient deindustrialization.
In another study, Hjort and Poulsen (2019) provide the first direct evidence on the
causal relationship between ICTs and labor markets in a developing country context,
exploiting the gradual arrival of fast Internet in a range of African countries. They
detect a large increase in employment rates and argue that this is driven by job
creation in higher-skill occupations. For example, they find evidence of firm entry
in South Africa, primarily in ICT-intensive sectors such as finance, and increased
productivity of existing firms in Ethiopia. Moreover, the authors show that, after
obtaining a fast Internet connection, firms in Ghana, Kenya, Mauritania, Nigeria,
Senegal, and Tanzania seemed to engage in more exporting, online communication
with clients and training. These benefits appear to have also extended to workers
with lower skill levels. In particular, the increase in the probability of employment
that the authors observe is of comparable magnitude for those with primary,
secondary, and tertiary education. Together, these results paint a different picture
to that described by the more alarmist view of technological change’s labor market
impact.
Overall, we are yet to find rigorous evidence of labor market polarization and
displacement in developing countries of the kind experienced in developed countries
to date. However, this is an understudied area far from the point of consensus.
Additional uncertainty for workers in developed and developing countries alike is
introduced by future technological advances that will inevitably extend the range
of automatable jobs. Here, machine learning and artificial intelligence have raised
particular concerns, given their potential to master “nonroutine” tasks (Autor, 2015;
Webb, 2019).
30
M. Bishop et al.
With vast uncertainty ahead, countries must enact forward-looking policy change
to equip their workforces as best possible for skill biased technology change.
One option is to focus on education investment. Encouragingly, the World Bank
(2019) report that, between 2000 and 2014, the share of employment in high-skill
occupations increased by 8 percentage points in Bolivia and 13 percentage points in
Ethiopia. However, Schlogl and Sumner (2018) caution that education is no panacea.
Indeed, even developed countries with far higher average skill levels are struggling
to insulate their labor forces from competition with new technologies. Rather, the
authors underline the likely future importance of a social safety net. How exactly
developing countries might fund this remains an extremely pressing open question.
3.3 Widening Access to Quality Education
Education represents a critical input to labor markets and development, and it is the
focus of SDG 4 to “ensure inclusive and equitable quality education and promote
lifelong learning opportunities for all” (UN, 2020). As described above, educational
investments may also help equip the labor force for future skill-biased technological
change. It is estimated that there were 750 million illiterate adults in 2016, largely
concentrated in South Asia and sub-Saharan Africa, and 262 million children aged
6–17 out of school in 2017 (UN, 2019). However, measures to increase enrolment
will do little to improve attainment unless the education provided in schools is of
high quality (Banerjee et al., 2008). Whether technological applications can help
guarantee this has been the focus of an increasing number of studies.
One important strand of the literature has focused on computer-assisted learning
(CAL). This consists of educational software programs which often adjust to
students’ achievement levels. Optimists have highlighted how these can target
some of the issues endemic to education provision in developing countries, such
as underqualified teachers and large classrooms with significant heterogeneity in
student learning levels. Indeed, in their review of the literature on education and
technology, Bulman and Fairlie (2016) note that effects are generally stronger in
developing country contexts, perhaps due to lower levels of human capital. However,
this overall positive result masks some important nuances.
In particular, Banerjee et al. (2008) conduct a randomized evaluation of a CAL
program in Vadodara, India. Here, grade 2 students were given weekly access
to a computer for playing math games which tailored themselves to students’
achievement levels. The authors detect substantial test score gains, though these
dissipated over time. In another study of India, Muralidharan et al. (2019) evaluate
the “Mindspark” CAL program for after-school instruction of middle-school students, which also offers customized content. They find significant improvements in
test scores which were particularly large for weaker students, implying the program
effectively catered to a wide range of learning levels.
On the other hand, in a randomized evaluation in Gujarat, Linden (2008) found
that CAL caused students to learn significantly less when computers were used as a
2 Technology and Development
31
substitute for the normal curriculum. However, when used as a complement, i.e.,
as an out-of-school program, CAL had a positive effect on learning, especially
for weaker students. This the author attributes to the program’s design, which
reviewed material in the existing curriculum. Outside of India, Carrillo et al.
(2010) evaluate a mathematics and language CAL program for primary school
students in Ecuador. They detect positive impacts on mathematics test scores and an
insignificant (negative) effect on language test scores. Together, these results suggest
that CAL is able to promote learning for students of a wide range of abilities but also
reinforce the importance of careful format design and considerations of the context
into which CAL is being implemented.
In contrast to generally positive results in evaluations of CAL, programs focused
on improving access to computers have shown limited success. Such was the
case for Beuermann et al. (2015), who analyze an experiment in Peru in which
students were given a laptop for home use and fail to detect an impact on
academic achievement. In another study, Barrera-Osorio and Linden (2009) evaluate
a national program in Colombia to install computers in public schools, also training
teachers on how to use them in specific subjects. Here again, the authors detect
no impact on student outcomes, which they attribute to their limited incorporation
into classroom teaching. These results underline the potential ineffectiveness of
interventions that do not tailor technologies to a specific need.
Throughout this chapter, we have documented how successful applications of
mobile technologies can have a vital impact on living standards and economic
development. In addition to their use in school instruction, these encompass digital
agricultural extension programs, mobile money, online job portals, social media,
and simple SMS communication. However, the persistent problem of illiteracy in
developing countries serves as an important barrier to their use, preventing people
from accessing the associated benefits. While development initiatives have taken
measures to help overcome this, for example, harnessing interactive voice response
technologies, another solution is to tackle the problems of illiteracy and digital
illiteracy head-on via targeted initiatives. Research has also shown that this can in
turn enhance learning outcomes in other areas.
In particular, Aker et al. (2012) evaluate the experimental incorporation of mobile
phone instruction into a standard adult education program in Niger. This was found
to substantially increase writing and math test scores compared to the original
model, with a relative improvement in math scores still visible after 7 months. The
authors attribute this to improved motivation and effort in the classroom, which
links to their conjecture that being able to use mobile phones for other services
increases the returns to education. Treated students also used mobile phones more
actively beyond the classroom, which may have served as means for them to practice
their skills. In a later study of the same program, Aker and Ksoll (2020) document
that immediate gains in reading scores persisted after 2 years and also reveal a
wide range of other socioeconomic effects. In particular, individuals who received
additional mobile phone instruction had more diverse income-generating activities,
improved food security and asset ownership, were more likely to sell a cash crop,
and were more likely to save. The authors were unable to disentangle whether these
32
M. Bishop et al.
effects are due to improved learning outcomes or use of the mobile technology itself,
an important question for future research.
Overall, the limited success of programs focusing on the distribution of hardware
suggests that access to technology may not be the binding constraint to its successful
use in education (Bulman & Fairlie, 2016; Escueta et al., 2017). Rather, this seems
to depend on the careful design of the CAL programs that students use them
for and their thoughtful integration into existing curriculums. In these cases, it
has been proven that technology may enhance the learning of students across the
achievement spectrum. Moreover, it appears that equipping students with digital
literacy can improve learning outcomes in traditional areas of academic study
and generate further welfare and economic benefits. However, the success of
technology-enabled education broadly rests on the quality of telecommunications
and electricity infrastructure, which remains dire in many developing contexts. In
sub-Saharan Africa in particular, under 50% of all primary and lower-secondary
schools have access to electricity, the Internet, computers, and basic drinking water
(UN, 2019). Investing in these crucial amenities must be a first order priority for
education initiatives.
It is also vital that we do not understate the importance of human capital in the
education workforce. Improvements in educational outcomes will hinge on the skill,
motivation, and efforts of teachers in the delivery of both ICT-enhanced and more
traditional lessons. Indeed, Aker et al. (2012) note that teachers in their sample with
higher education were “better able to harness mobile phones to improve students’
educational experiences.” Here, technology can also play its own role, for example,
in enabling the monitoring of teacher attendance. In an experiment in India, Duflo et
al. (2012) show that such initiatives can provoke substantial increases in attendance
with positive knock-on effects on student outcomes.
There is also hope that technology can be exploited to educate children in settings
where teachers are unavailable altogether. This has become particularly salient in
light of the COVID-19 pandemic. For example, the Vodafone foundation reports
that over 1.1 million young people in Africa are accessing educational materials
online via their e-school programs (Vodafone, 2020). Here, future research must
also consider whether and how technology can be used to tackle the gender gaps in
educational attainment that remain in developing countries.
4 Financial Technologies
Throughout this chapter, we have documented the range of new opportunities
for communication and service provision that have accompanied mobile technology’s fast expansion throughout the developing world. One such case is financial
technologies, namely, mobile money. This generally refers to the application of
mobile phones for sending and receiving money. Transfers take place via SMS
for a small fee, and do not require ownership of a formal bank account. Deposits
and withdrawals are made by visiting a mobile money agent, a process akin to
2 Technology and Development
33
exchanging cash with “e-money.” In this way, mobile money is far removed from
the mobile banking applications used by many in developed countries.
Demirgüç-Kunt et al. (2020) estimate that there are 1.7 billion unbanked adults
globally, 1.1 billion of whom have a mobile phone. This has sparked enthusiasm
surrounding mobile money as a way of bringing formal financial institutions to
populations hitherto reliant exclusively on cash. In doing so, it has the propensity
to significantly reduce transaction costs and facilitate saving, with important
implications for welfare and development. For firms and governments harnessing
mobile money for the transfer of wages and welfare payments, there is also scope for
significant efficiency gains and reduced leakage. However, whether this technology
actually constitutes a development “leapfrog” for low-income countries, whereby
mobile banking facilitates universal financial inclusion while bypassing the formal
banking sector, remains unclear. This may crucially depend on countries’ regulatory
frameworks, among other important factors. These issues are discussed in this
section.
4.1 Increasing Financial Resilience
In the absence of access to financial services, households revert to inefficient, risky,
and costly methods for making transfers to friends and relatives. These include
informal practices, such as asking friends or bus drivers to pass on cash, and use
of money transfer services, such as Western Union (Aker, 2018). Mobile money
stands to significantly facilitate these processes – senders can transfer funds through
a simple SMS, requiring only that both parties own a mobile phone and the payment
of a transaction fee. A new body of research is beginning to show that, in doing so,
mobile money is having an important impact on household financial behavior and
welfare.
This question is examined by Jack and Suri (2014) in their seminal study of MPESA, the developing world’s most renowned mobile money success story. The
authors document that users experience a significant reduction in the transaction
costs associated with sending remittances, which in turn facilitated inter-household
risk sharing. In particular, following a negative income shock, M-PESA users
received more remittances and from a wider range of sources, allowing them to
avoid cutting their consumption. In another study of the same program, the authors
reveal that improved smoothing also extended to negative health shocks (Suri et
al., 2012). Batista and Vicente (2018) confirm that these effects are not limited
to Kenya’s M-PESA, offering some of the first experimental evidence in a study
of rural Mozambique. Here again, they detect evidence of improved smoothing
and reductions in hunger episodes, which they attribute to increased receipt of
remittances. These studies speak to mobile money’s ability to bolster the financial
resilience of poor households in the face of shocks that would have otherwise cut
into their consumption and education spending, suggesting significant welfare gains.
34
M. Bishop et al.
Beyond facilitating consumption smoothing, there is evidence of wider socioeconomic effects following mobile money’s introduction. For example, in rural
Mozambique, Batista and Vicente (2018) detect a fall in agricultural activity in
treatment areas as well as an increase in out-migration, which can be a route out
of poverty (Bryan et al., 2014). Similarly, in a long-run evaluation of M-PESA’s
economic impacts, Jack and Suri (2014) estimate that access to mobile money lifted
almost 194,000 households, equivalent to 2% of Kenyan households overall, out of
extreme poverty, which they attribute to improved financial resilience and higher
savings. They also document a shift of women out of subsistence agriculture and
into business and retail occupations. Together, these studies indicate a causal link
between mobile money and development via improvements to the economic lives
of the poor.
Recent years have seen mobile money extending beyond simple transfer and
savings facilities to include other traditional financial services, such as loans. For
example, Safaricom’s M-Shwari enables consumers to open a bank account and
make deposits and withdrawals via M-PESA. They can also request a loan, the
decision for which is based on financial history data (Suri, 2017). In their evaluation,
Bharadwaj et al. (2019) document that M-Shwari had high take-up and effectively
improved access to credit and resilience to income shocks. However, the potential
for transformative socioeconomic impacts was limited by the small and short-term
nature of the loans. In another study of Indonesia, Harigaya (2016) evaluates the
experimental digitization of a group microfinance program via mobile money, which
meant deposits and withdrawals were more convenient and could be carried out in
the absence of peers. The author detects a decline in savings, which he attributes to
a weakening of the peer effects that underline the motivation for group banking, as
well as sensitivity to fees, which, though small, appeared to increase the salience
of transaction costs. Blumenstock et al. (2016) study a separate mobile money
innovation in which this was used for wage payments in an Afghan firm, and
half of employees were experimentally assigned a 5% default savings contribution.
This was found to significantly increase savings, which the authors attribute to the
overcoming of behavioral barriers. Together, these studies highlight the potential
for innovative applications of mobile money but caution that behavioral factors can
work to both their advantage and disadvantage.
4.2 Facilitating Firm and Government Transactions
In recent years, applications of mobile money have been extending from person-toperson payments to also include person-to-business and government-to-person (or
NGO-to-person) payments (Suri, 2017). This can include the payment of wages,
as described above, as well as the transfer of welfare payments to households,
transactions which would otherwise have to take place via cash. In this way,
mobile money may produce important efficiency gains for firms, governments,
and NGOs. This question is evaluated by Blumenstock et al. (2015) in another
2 Technology and Development
35
RCT in Afghanistan wherein a subset of employees was transitioned from cash to
mobile money payments. They detect significant benefits to the organization, which
included significant savings in salary disbursement activities. In an experiment in
Niger, Aker et al. (2016) study an NGO application of mobile money to send
emergency cash transfers to households following a drought, of which women were
the primary beneficiaries. Here, households in which women received electronic
rather than cash payments had improved diet diversity and their children consumed
one third of an extra meal per day. In addition to time savings in obtaining the
transfer, the authors present evidence of improved female bargaining power to
explain their results. Overall, these studies show that the efficiency gains enabled
by mobile money can benefit both firms and households.
Applications of mobile money are also coming to form an important part of the
COVID-19 response, partly to prevent disease transmission via cash exchanges.
For example, telecommunication operators across Africa, including M-PESA,
have removed fees on small mobile money transactions (Flood, 2020). Others
have lowered the barriers to opening accounts, such as by waiving additional
documentation requirements (Peyton, 2020). In a move to support struggling small
businesses, M-PESA has also raised daily transaction limits (Finextra Research,
2020). Similarly, governments have been using mobile money to scale up emergency
welfare programs. For example, Togolese informal workers have been able to
register for and receive a state grant via their mobile phones (Financial Times, 2020).
The UNHCR has also been distributing mobile phones and SIM cards to displaced
families and making assistance payments into these (Faivre, 2020). This positive
shock to the use of mobile money stands to kick-start its diffusion in areas where
adoption has been hitherto limited.
Dampening enthusiasm surrounding mobile money are concerns surrounding its
inclusionary potential, i.e., whether mobile money can effectively extend access to
financial services throughout the developing world. This relates to the finding that
initial adopters of mobile money may be positively selected in terms of education
and income (Batista & Vicente, 2020; Suri et al., 2012). Here, researchers have
pointed to potential barriers such as lack of trust, illiteracy, affordability, and
possession of official documents required to sign up for accounts, issues which
may disproportionately affect women. Indeed, the GSM Association (2019) report
that women in low- and middle-income countries are 10% less likely to own a
mobile phone and 23% less likely to use mobile Internet in the first place. This
ownership gap extends to 28% in South Asia. These figures underline the need for
more research into what drives female adoption of mobile phones and mobile money
in particular.
Another important barrier to the widespread diffusion of mobile money is the
strength of the agent infrastructure, to which Suri (2017) attributes M-PESA’s
success relative to other mobile money initiatives. For example, in her study of
Niger, Aker (2018) discusses how, in one region, households lived an average of
15 km away from the nearest agent. In such contexts, adoption of mobile money
was low, despite high costs of alternative methods for sending remittances and high
ownership of mobile phones.
36
M. Bishop et al.
Overall, it is clear that mobile money is already beginning to transform the
landscape of financial services in the developing world. Its use has been proven to
facilitate transactions for individuals, firms, governments, and NGOs, translating to
improvements in efficiency and changes in household financial behavior that stand
to have long-run implications for development. Recent years have also seen mobile
money technology applied to a range of other financial services characteristic of
more traditional bank accounts. However, whether these can have the transformative
impact that appears to accompany mobile money’s basic transfer and savings
functions is yet unknown. There are also many remaining questions surrounding the
factors that impact the widespread diffusion of mobile money, including behavioral
biases, the agent infrastructure, illiteracy, and affordability. Moving forward, there
is high demand for further rigorous economic evidence to inform these debates.
5 Energy and Environment
To this day, nearly 1 billion people remain without an electricity connection, and
many others receive only partial and intermittent supply (IEA, 2019). Lack of access
to this vital technology constrains the set of productive activities households can
engage in and inhibits firm performance. The desire to scale energy generation
to close this gap has inspired investments into both national grid capacity and
alternative off-grid technologies. However, as with any other form of technology,
availability may not be the binding constraint to its successful use. Rather, barriers
such as electricity theft and poorly functioning utilities continue to inhibit the
uninterrupted flow of power to households and firms and its associated benefits for
growth and development. Simultaneously, it is vital that growing energy demand in
developing countries is met with sustainable sources. These challenges can only be
met by harnessing technological innovation.
5.1 Scaling Energy Access
It has been well-documented that reliable energy access is an essential ingredient
to economic development (Moneke, 2019; Lipscomb et al., 2013), with many
emphasizing an important firm performance channel. For example, both Kassem
(2020) and Rud (2012) detect positive impacts of electrification on the entry and
performance of manufacturing firms in their respective studies of Indonesia and
India. In their evaluation of the Indian textiles industry, Allcott et al. (2016)
furthermore document that electricity shortages reduced average output by about
5–10%, underlining the importance of the grid’s reliability.
Another dimension of electrification’s promise lies in its potential to generate
behavioral change, namely, by allowing households prolonged access to light and
powering time-saving appliances such as fridges and microwaves. These extend the
2 Technology and Development
37
time available for studying and productive tasks, which may in turn generate longerrun economic benefits to further motivate electrification efforts. Several studies
have attempted to capture these effects. Most notably, Dinkelman (2011) studies
South Africa’s mass rollout of the grid to rural households. She finds that electrification significantly boosted female employment by releasing women from home
production and fostering micro-entrepreneurship. This positive impact on female
employment is also detected by Grogan (2018) in his study of rural, indigenous
households in Guatemala. Interestingly, Fujii and Shonchoy (2020) furthermore find
evidence of a negative impact of electrification on fertility. Ultimately, effects of
this nature are harder to study, and so much remains unknown as to the longer-run
social and economic impact of electrification. However, it is vital that these remain
an important focus of research, lest we understate the benefits of and therefore
underinvest in electricity.
In line with the well-documented benefits of electrification, infrastructure investments to scale up national energy generation and transmission have become
a mainstay of development policy. Here, many African countries are turning
to hydropower, exploiting the abundant water supply provided by their rivers.
A landmark example is the Grand Ethiopian Renaissance Dam, set to become
Africa’s largest hydropower project with a 6000 MW capacity (Power Technology,
2020). Overall, hydropower is set to provide 90% of Ethiopia’s electricity and
also constitutes a promising avenue for growth as it intends to export surplus to
neighboring countries (IHA, 2017). In South America, Brazil houses the continent’s
largest installed hydropower capacity (IHA, 2018), which accounts for around
80% of domestic electricity generation (IEA, 2020). Solar has become another
important avenue for scaling national energy generation. 2016 saw the completion
of Rwanda’s Rwamagana Solar Power Plant, whose 8.5 MW capacity made it East
Africa’s first utility-scale solar power plant (Mininfra, 2020). Another standout
case is Kenya, quickly approaching 100% renewable energy generation thanks to
investment in geothermal, wind, and hydropower sources. In 2019, it opened the
Lake Turkana Wind Power farm, the largest in Africa with 365 turbines and a
310 MW capacity (Dahir, 2019).
In spite of the aforementioned investments in national energy capacity, a
significant share of the developing world is expected to remain off-grid due to the
high cost of extensions to remote, rural areas. In particular, of the 315 million set to
gain access to electricity in Africa’s rural regions by 2040, it is estimated that only
30% will be connected to national grids (African Progress Panel, 2017). Instead,
many are anticipated to be electrified via off-grid and micro-grid technologies.
These can consist of systems powering individual households or larger-scale ones
serving several at a time. They are able to reach remote regions at relatively low
cost and can be powered by renewable sources. Smaller devices are insufficient for
powering large appliances such as fans, fridges, and TVs, instead primarily intended
for phone charging and lighting. These technologies have been met with much
enthusiasm and are inspiring a generation of tech entrepreneurs. For example, in
Côte d’Ivoire, Evariste Akoumian’s Solarpak makes backpacks with built-in solar
panels that collect energy while children walk to school (Capron, 2016). These
38
M. Bishop et al.
absorb enough energy during the day to power a lamp for 4 to 5 h – enough to
allow children to do their homework at night.
In practice, however, evidence from India suggests that the theoretical benefits
of microgrids have not always manifested. In a study targeting non-electrified
households in Uttar Pradesh, Aklin et al. (2015) installed solar microgrids in
81 randomly selected villages that were previously reliant on kerosene lamps to
light their homes. They document an increase in electricity supply, as indicated
by reduced kerosene expenditure, but detect no broader socioeconomic impacts.
The authors suggest that the power supply supported by the microgrids had been
insufficient to encourage business activities or the accumulation of social and human
capital.
Others have assessed the microgrid’s viability in contexts where it is available
alongside the grid. In a study of Bihar, Burgess et al. (2020a) conduct an experiment
in which microgrids were offered to a sample of villages at different prices. In this
setting, households were also faced with the choices of individual household solar
panels (own solar), diesel generators, and the grid, which was being rolled out over
the course of the study. They found that, at market price, just 6% of households
purchased microgrids, increasing to 19% under a 50% subsidy. Moreover, they saw
microgrid demand collapse following grid extensions and improvements in own
solar quality. Overall, they argue that richer households have a strong preference
for the grid’s higher capacity and predict that future income growth will drive
electrification primarily via the grid. Simultaneously, off-grid solar will play a
key role for poorer households in more remote areas. In this sense, off-grid solar,
though highly valuable in situations where the grid alternative is not available, may
ultimately be supplanted by the grid. Interestingly, however, the grid itself may
increasingly be powered by renewables, including solar. In another study in India,
Fowlie et al. (2019) document one company’s experience deploying microgrids in
Rajasthan. These are also met with low demand, eventually forcing the company
to cease its operations. Here, the authors point to competition with the grid, with
politicians’ promises of imminent local extensions potentially deterring microgrid
purchases.
Ultimately, in the face of large government subsidies for grid connections,
microgrids may find it impossible to compete. In India in particular, the government
has several schemes offering free grid connections to households below the poverty
line. Here, Fowlie et al. (2019) argue for transparency in state expansion schedules
and measures to ensure microgrids can be technologically integrated into the grid if
and when this does arrive. Demand for microgrids also seems to be constrained by
their relatively low capacity, which in turn may inhibit the socioeconomic benefits
of electrification from manifesting. In this regard, there is certainly room for tech
professionals to provide valuable improvements to these energy provision systems.
A natural conclusion of the above discussion on the development benefits of
the grid, combined with the proven limitations of off-grid alternatives, would be
to pursue rapid universal grid extension. However, a number of recent studies
have documented that such efforts may too be alone insufficient to secure the
economic benefits of reliable access. In particular, in a study of Western Kenya,
2 Technology and Development
39
Lee et al. (2016) reveal that, despite high population density and extensive grid
coverage, electrification rates remain at 5% on average for rural households and
22% for rural businesses. Moreover, half of unconnected households are “under
grid,” meaning they could be connected to a low-voltage line at a relatively low
cost. In another study, Lee et al. (2020) experimentally offer households in this
setting the opportunity to connect to the grid at different subsidized prices. They
detect surprisingly low demand even at high subsidy rates, which, combined with
costs of supplying connections, imply rural electrification may even have reduced
welfare.
Researchers have proposed different explanations for the advent of low-grid
demand. Lee et al. (2020) point to credit constraints and the overall low quality
of grid provision, with evidence of excess costs from leakage during construction,
bureaucratic red tape, low grid reliability, and unaccounted for spillovers. For
example, in addition to short-term blackouts lasting minutes or hours, households
in rural Kenya face long-term blackouts which can extend for months. Others have
argued that issues of grid quality are themselves a function of poor enforcement of
payments and informal connections, i.e., individuals illegally connecting for free,
a pervasive problem in developing countries. This is documented by Burgess et al.
(2020b) in their study of Bihar, whose state electricity utility recovers just 34% of
its costs. They argue that this is overwhelmingly the result of electricity having been
treated as a right regardless of payment, producing tolerance for subsidies, theft, and
nonpayment. The end result is an insolvent utility dependent on government bailouts
and tightly rationed supply. McRae (2015) studies a similar paradox in Colombia.
He demonstrates that quality upgrades are unprofitable for utility firms, as the state
subsidizes their losses and low-income households prefer to receive a low-quality
service for which they do not pay.
Ultimately, many developing countries are stuck in a low-quality electricity
equilibrium in which households pay little for poor supply and governments
battle the competing objectives of sustaining utility companies and retaining the
political support of low-income households. More research must focus on finding
paths to enhancing the reliability of grid supply and improving the organizational
performance and financial sustainability of utilities. Without doing so, it may be
impossible to generate the level of demand for and supply of reliable electricity to
achieve the development benefits of electrification.
5.2 Guaranteeing Sustainability
World energy demand is on the rise, with the majority of growth set to stem
from low-income countries (Wolfram et al., 2012). While this has the potential
to spur welcome growth and development, higher energy consumption will also
increase levels of pollution and other externalities. Though some national grid
investment projects involve large-scale exploitation of renewable energies, others
raise sustainability concerns. For example, the China-Pakistan Economic Corridor
40
M. Bishop et al.
consists of $60 billion worth of infrastructure projects, including $35 billion for
the scaling-up of Pakistan’s energy supply (Stacey, 2018). Almost 75% of the new
generation capacity will be coal-fired, contributing to an expected rise in the coal
share of Pakistan’s energy mix from 3% in 2017 to 20% in 2025 (Downs, 2019).
Efficiency issues also arise on the consumer-end, with nontechnical losses such as
electricity theft prevalent across the developing world, as discussed above. In subSaharan Africa in particular, Kojima and Trimble (2016) estimate the total annual
value of uncollected electricity bills at 0.17% of national GDP on average. In this
section, we discuss the potential for technological innovations to promote both
sustainability and the efficient production and consumption of energy.
Electronic meters represent one such technology hailed as a potential solution to
energy losses. One variety is the smart meter, which records electricity consumption
and communicates this to the distribution company. These were a feature of the
microgrids deployed by Fowlie et al. (2019) in Rajasthan, India. Here, however, the
authors found that interpersonal relations and inter-caste dynamics rendered operators unwilling to enforce penalties in practice, making cost recovery impossible and
the scheme ultimately unviable. Moreover, in his study of Colombia, McRae (2015)
argues that grid upgrades involving the installation of meters are unprofitable for
utilities, given that many households would be unwilling to pay a nonzero marginal
cost even for a higher quality supply and that their existing losses were covered by
state subsidies.
Perhaps a more promising technological solution is that of prepaid metering,
which has grown in popularity across both the developed and developing world.
Here, consumers must credit their accounts in order to access electricity, thus
transferring the enforcement burden away from the utility. Jack and Smith (2020)
evaluate the viability of this technology in a study of Cape Town, South Africa,
in collaboration with the local utility. They detect a 14% decrease in consumption
but a net increase in revenue thanks to improved cost recovery, mostly driven by
a subset of poor customers who were delinquent on bills. The authors argue that
the prevalence of this group in other developing countries suggests the technology
could be effective in other settings. However, they caution that they are unable to
assess the effect of the prepaid meters on theft, a large increase in which could undo
positive revenue effects.
Another category of technologies that may encourage sustainability are energysaving appliances, such as LED lighting. Evidence suggests that this can also
have positive productivity co-benefits, as was recently shown in a study of Indian
factories by Adhvaryu and Nyshadham (2020). The authors found that LED lighting,
which emits approximately seven times less heat, reduced factory floor temperatures
by several degrees, in turn leading to increased productivity. Another notable
example is that of cooking appliances. An estimated 3 billion people across lowand middle-income countries continue to rely on traditional stoves and solid fuels
such as firewood, biomass, or charcoal for heating and cooking (CCA, 2020).
These contribute to deforestation and household air pollution, the death rates for
which are highly concentrated in developing countries (Landrigan et al., 2018).
2 Technology and Development
41
Various initiatives have attempted to encourage transitions away from these harmful
methods, with varying success. Kar et al. (2019) evaluate one such program in
Karnataka, India, which uses loans and subsidies to promote the use of liquefied
petroleum gas. Despite increases in enrolment, they detect no impact on fuel sales,
suggesting beneficiaries were not fully transitioning away from solid fuels. This
underlines the potential barriers governments may face in encouraging households
to replace traditional appliances with cleaner ones, especially in cases where
individual gains are only felt once widespread adoption has been achieved.
Another major question facing developed and developing countries alike in their
attempts to shift towards renewables relates to energy storage. This is especially
the case for wind and solar as variable renewable energy (VRE) sources. For
instance, wind generation can be high at night, generating power at a time where
demand is low. Similarly, extra energy from peak sunlight generation cannot be
easily stored for use at a later period. Even more concerning is the prospect of
increasingly unpredictable weather patterns, which are only likely to heighten these
issues. Existing scientific efforts to overcome these challenges are primarily taking
place in developed countries. As such, solutions proposed are unlikely to be wellattuned to the electricity infrastructures characterizing developing countries, which
for example often suffer from insufficient capacity (De Sisternes et al., 2020).
In recognition of this disparity, the World Bank has committed $1 billion to a
new program focused on accelerating investments in battery storage designed for
developing and middle-income countries (World Bank, 2018d).
The extent of the challenge facing developing countries must not be understated.
In order to guarantee growth and development, it is necessary that they find paths to
scale up energy generation in a way that is sustainable for the planet and financially
viable. Off-grid alternatives have thus far seen limited success and, without further
technological adaptations, are unlikely to be able to meet the growing energy needs
of populations in developing countries. However, without improvements to their
organizational performance, national grids will also fail in this respect. There is
thus a vital need for the economics and engineering communities to convene to
design energy policies and programs that are suited to the needs and constraints of
developing countries.
6 State Capacity and Public Sector Delivery
The growth of low-income countries may be constrained by limited state capacity,
lack of transparency and accountability, and poor public service delivery. Technology can help address the agency problem in governments, both inside layers of
government, by improving government transparency, public service monitoring and
state effectiveness, and between government and citizens, by improving accountability and expanding political participation.
42
M. Bishop et al.
6.1 Bolstering State Effectiveness and Accountability
An important theme throughout this chapter has been the importance of infrastructure for growth and development. In addition to transport, telecommunications, and
energy infrastructures, this extends to the administrative and fiscal infrastructures
used by the government to raise and spend tax revenue. These are critical for
the effective provision of the welfare programs and public goods that firms and
households rely upon. However, these infrastructures tend to be much weaker in
developing countries. Here, tax shares in GDP resemble those of now developed
countries from 100 years ago (Besley & Persson, 2013) and administrations are
grappling with corruption, evasion, and leakage (World Bank, 2003; Olken, 2006;
Olken & Pande, 2012). This prevents the secure flow of funds and services to
intended beneficiaries and disproportionately hurts the most vulnerable (World
Bank, 2018a).
The question of how to tackle these issues is a vital one for development. Here
again, policymakers and economists have been hoping that at least part of the
answer lies in technological innovation. In particular, government administrations
are increasingly harnessing ICTs and other forms of technology, ranging from
electronic procurement platforms to biometric authentication. These share the
general benefits of limiting informal interactions between officials and households
and firms and streamlining administrative processes. However, each can be faced
with its own limitations. These are discussed in the following section.
One essential faculty of the state is the procurement of goods and services from
firms, accounting for an estimated $820 billion of annual spending in developing
countries alone (World Bank, 2018b). However, this process is often marred by
corruption and collusion, for example, where contracts are restricted to select
insiders and firms collude to raise prices. In the attempt to overcome this important
barrier to effective provision, governments have been transitioning towards electronic procurement platforms (e-procurement) that provide a standardized online
mechanism for advertising bids and awarding and pricing contracts. By increasing
the transparency of the bidding process, reducing the cost of submitting a bid
and restricting interaction between officials and firms, e-procurement intends to
facilitate the entry of non-favored firms and those beyond the local area. This
enhanced competition may in turn improve project costs and quality. On the other
hand, a more sophisticated system risks excluding those without Internet access.
Thus, whether e-procurement is ultimately to the benefit of competition or the
quality of public provision is an empirical question.
Lewis-Faupel et al. (2016) provide some of the first rigorous evidence on eprocurement, exploiting its gradual roll-out for public works programs in India
and Indonesia. This was found to improve project timeliness in Indonesia and
road quality in India, which the authors contend was driven by entry of higherquality firms beyond the home region. In another study, Abdallah (2015) documents
preliminary evidence on a similar e-procurement scheme in Bangladesh. He detects
a 12% decrease in the price-to-cost ratio of procurement packages, amounting to
over $10 million in estimated savings for 2013 alone. He suggests this may have
2 Technology and Development
43
been driven by reduced political influence rather than by increased national competition. Conversely, using cross-country evidence, Kochanova et al. (2018) find that
e-procurement is only associated with higher public procurement competitiveness
in developed countries. Ultimately, despite a few promising results, much remains
unknown about the success of these initiatives and what might drive the observed
effects.
Another prerequisite for the efficient provision of public services is the effectiveness of civil servants. To this end, various studies have evaluated the application of
ICTs to monitor employee performance and improve work incentives. One notable
example is a study by Debnath and Sekhri (2017) of school meal provision in Bihar,
in which intermediate officials had become a source of leakage. In the attempt
to tackle this problem, the state rolled out an Interactive Voice Response System
(IVRS) that made daily calls to schools to collect reliable data with which to hold
officials accountable. This reform was found to improve the likelihood of lunch
provision as well as the quality and quantity of meals, suggesting a significant
reduction in leakage. Other applications have targeted absenteeism among frontline
providers. For example, Duflo et al. (2012) conduct an experiment wherein tamperproof cameras were used to record teacher attendance in India’s NGO schools,
data which was then used to determine wages. The authors detect an impressive
21 percentage point decrease in absenteeism, which furthermore translated into
higher student test scores. In a similar experiment with nurses, Banerjee et al. (2008)
also document an initial drastic improvement in attendance. However, this began to
dissipate after just 6 months, at which point the health authority began to undermine
the system through granting exemptions. Together, these studies underline both
technology-enabled monitoring’s potential for motivating service providers and the
necessity of political will for guaranteeing successful implementation.
In developing countries, many households are acutely reliant on social safety
nets to fund basic expenditures, programs on which 1.5% of GDP is spent on
average by their governments (World Bank, 2018c). However, the effectiveness of
these well-intentioned initiatives can be seriously inhibited by leakage and identity
fraud, issues that another set of technology-enabled initiatives are attempting to
target. These include transitioning from cash to electronic disbursal of benefits,
with accounts linked to recipients’ biometric information. The Indian government
in particular has rested much hope on such technologies. Its Aadhaar program has
become the world’s largest biometric digital identification system, having registered
over one billion users in just 6 years (Nilekani, 2018). Research in economics is
beginning to respond with evaluations of these efforts.
Muralidharan et al. (2016) assess biometric authentication at scale, experimentally introducing biometric smartcards for the receipt of pension and workfare
payments in collaboration with the Andhra Pradesh state government. They detect
large, positive returns that far exceeded costs for both programs, including a
reduction in leakages and “ghost beneficiaries,” i.e., false benefit claims on behalf of
other individuals, as well as improved public satisfaction. In another study, Barnwal
(2019) examines the Indian government’s deployment of biometric authentication
for household receipt of subsidized fuel, attempting to stem its diversion to a black
44
M. Bishop et al.
market for firms (who otherwise had to pay a higher, taxed price). He argues that
biometric authentication was initially effective in curtailing this illegal activity.
However, when the reform was unexpectedly reversed following political lobbying
by local officials, black market supply was quickly re-established. Overall, these
seem to suggest that programs utilizing biometric authentication can effectively
prevent the leakage of vital transfers but may be susceptible to loss of political will.
A related technology that has been harnessed by the Indian government is
e-invoicing, whose application to their flagship workfare program is evaluated
by Banerjee et al. (2020a, 2020b). These digital platforms enable “just-in-time”
financing, where funds are dispensed only in response to specific invoices, rather
than in the form of advances to be justified down the line. Drawing upon an
experiment in collaboration with the Bihar state government, the authors detect
a fall in leakage in the form of fewer ghost workers and a decrease in local
officials’ wealth, culminating in a 24% fall in expenditure. However, this was
accompanied by only a small increase in beneficiaries and no change in wages or
projects completed, as well as longer delays in household payments, consistent with
the higher administrative burden placed on local officials. Echoing the experience
of Barnwal (2019), the Bihar experiment was unexpectedly ceased after a few
months. However, a comparable scheme was subsequently rolled out across India,
providing the authors with a longer-run quasi-experiment. Here, they find a similar,
persistent fall in expenditure. Overall, e-invoicing seems to have yielded long-run
fiscal savings without generating direct benefits to households of the kind witnessed
by Mularidharan et al. (2016). This relates to the broader question of the potential
co-existence of winners and losers to technological applications.
Many studies have documented significant savings following the deployment of
technology-enabled initiatives by governments in developing countries, sometimes
also translating into a higher quality of service for firms and households. However,
these have unsurprisingly sometimes been met with efforts by local officials with
vested interests to thwart their implementation. Overcoming these political barriers
is a vital obstacle to progress. The success of these initiatives will also rely upon
levels of technical proficiency and complementary infrastructure that may be hard
to come by in poorer regions and demand significant investment to overcome
inevitable logistical hurdles. Such was the experience of Muralidharan et al. (2016)
in India, where after 2 years, only around 50% of subdistricts had been converted to
smartcard payments. Furthermore, there remain many open questions surrounding
general equilibrium effects, in particular whether these initiatives simply displace
corruption to other areas.
Another area of increasing importance relates to the privacy concerns that
accompany large-scale state data collection efforts, particularly regarding their
potential use as part of wider state surveillance efforts (Drèze & Tiwari, 2016).
These have become highly salient in light of the COVID-19 pandemic, which has
seen several nations request the universal downloading of contact-tracing apps. In
many cases, there is limited transparency as to who can access the data and how
it might be used post-pandemic (O’Neill et al., 2020). Given the speed at which
administrations in developing countries have been harnessing technologies, it is vital
that research continues to respond with their rigorous evaluation.
2 Technology and Development
45
6.2 Improving Political Participation and Electoral Integrity
Another channel through which technology stands to impact the functioning
of government is by increasing political participation. This view, described by
Diamond (2010) as the “liberation technology” argument, emphasizes that ICTs
such as Internet, mobile phones, and social media can facilitate communication and
information transmission and promote political mobilization. These technologies
are also being harnessed to increase the accessibility and integrity of elections,
namely, by helping to overcome illiteracy and prevent the tampering of vote counts.
This is vital for the effective functioning of democracy and ensuring that people’s
preferences are reflected in policy, which too often fall short in developing countries.
These have in turn been shown to have implications for the extent to which policies
are efficient and support the needs of the most vulnerable (Becker, 1983; Besley &
Burgess, 2002).
Following the rapid diffusion of ICTs across the developing world, the question
of their impact on political mobilization has been the focus of an increasing
number of studies. One notable example is a study by Manacorda and Tesei (2020)
exploiting detailed georeferenced data on protest incidence and participation across
the African continent. They estimate that mobile phone coverage does increase the
probability of a protest but only during times of economic downturn – periods where
grievances are high and the opportunity cost to participation is low. The authors
also find evidence of “strategic complementarities” in protesting, whereby fellow
community members’ participation reduces the costs and increases the returns to
one’s own participation. These appear to be enhanced by mobile technology, which
can easily publicize information on protest attendance.
Others have focused on the role of social media, a relatively new technology
whose impact on democracy has been the subject of much debate, both in developed
and developing countries. Here, Diamond (2010) cautions that technology is “open
to both noble and nefarious purposes.” For example, alongside potential reductions
of communication costs and equalizing effects, there has been much concern
surrounding their control by powerful actors and the proliferation of “fake news”
(Allcott & Gentzkow, 2017). Here, existing evidence, especially in the context of
developing countries, remains limited, though a number of studies are beginning to
uncover social media’s impact on political mobilization. For example, Enikolopov
et al. (2020) study the effect of one popular social network on a wave of political
protests in 2011 Russia, using quasi-random variation in the platform’s penetration.
They detect evidence of a positive causal impact on both the incidence and size of
protests, which they argue is driven by reduction in the cost of collective action.
In another study, Acemoglu et al. (2018) examine the impact of street protests in
Egypt’s Arab spring. They find that Twitter activity data is a predictor of protest
incidence, suggesting a role for social media in facilitating coordination. Finally,
in China, Qin et al. (2017) document a surprisingly large number of posts on
China’s Sina Weibo microblogging platform discussing politically sensitive topics
and corruption allegations and find that the latter is predictive of future corruption
46
M. Bishop et al.
charges of specific individuals. Building further on these initial results presents an
important area for future research.
When citizens lack an effective mechanism for expressing their political preferences, governments face weakened incentives to deliver policies that will benefit
them. This underlines the importance of both the accessibility and integrity of elections, an area to which ICTs have also been applied. For example, Fujiwara (2015)
documents an important barrier to political participation that disproportionately
affects the most vulnerable: illiteracy. In Brazil, he describes how this meant ballots
were often erroneously completed and had to be discarded. As a result, when an
electronic system offering guidance and visual aids was implemented in the late
1990s, the author reveals that millions of citizens, particularly those with lower
levels of education, were de facto enfranchised. The implications for both political
and health outcomes are striking: the vote-share of left-wing parties increased,
which in turn translated into higher government expenditure on healthcare and
improved service utilization and outcomes. More specifically, uneducated mothers
received more prenatal visits, and there was a lower incidence of low-weight
births.
In 2012, it was estimated that under 40% of elections in low- and middle-income
countries were free and fair, a problem often attributed to lack of information (World
Bank, 2016). Here, it has been shown that technology-enabled monitoring stands to
make an important contribution. For example, Callen and Long (2015) study the
issue of aggregation fraud, where votes are altered in the process of being added
up across polling stations. In an Afghani election, they experimentally announce
a “photo quick count,” where provisional results posted at individual stations are
photographed and compared to post-aggregation figures. This was found to provoke
a 60% reduction in theft of election materials by candidate representatives and a
25% reduction in votes for politically powerful candidates. In Callen et al. (2016),
the authors conduct an experiment to evaluate a similar photo technology in a
Ugandan election. They detect similar evidence of reduced illegal practices and a
fall in the vote share for the incumbent. Together, these studies make clear that
photo quick counts can be a simple yet effective method of improving electoral
integrity, which the authors furthermore emphasize are well-suited to being scaled
via citizen-based implementation as mobile access expands. Relatedly, Aker et al.
(2017) study the use of SMS messaging for the reporting of electoral irregularities
in Mozambique, detecting a 5% increase in political participation as a result. These
results underline the potential of ICTs to empower citizens in reinforcing the
accountability of vital democratic processes.
Political participation and electoral integrity are the backbone of a functioning
democracy. Research in economics has documented how these have often fallen
short in developing countries, particularly in ways that disproportionately hurt the
most vulnerable. The studies discussed above have highlighted some important
successes in terms of how technologies have been harnessed to tackle these
problems, which in the case of Fujiwara (2015) translated into tangible impacts on
political outcomes and household welfare. However, we are left with a number of
important unanswered questions, especially as regards their long-run effectiveness.
2 Technology and Development
47
In particular, the use of ICTs to enhance political engagement and improve election
monitoring will only be effective insofar as these cannot be subverted by powerful
interests.
7 Health
In developing countries, access to healthcare is still a major problem faced by a large
share of the poor, especially in rural areas. This constrains both living standards and
productive capacity. Technology may offer solutions to both sides of the problem by
expanding access to quality healthcare.
7.1 Improving the Quality and Delivery of Healthcare Services
For centuries, landmark innovations in health technology have generated drastic
improvements in living standards and life expectancies, which in turn enhance
the stock of human capital. In this way, they are vital to economic development.
However, there remain vast global inequalities in health, with at least half the
world’s population still lacking access to essential health services (WHO, 2017).
In developing countries, households experience worse access to immunization,
professional birth attendants and contraception and suffer disproportionately from
HIV, malaria, pollution-related diseases, and unsafe drinking water (Landrigan et
al., 2018; UN, 2019). Overcoming these disparities is at the heart of Sustainable
Development Goal (SDG) 3, to “ensure healthy lives and promote well-being for all
at all ages”, as well as SDG6, to “ensure availability and sustainable management
of water and sanitation for all” (UN, 2020).
Health technologies targeting issues from which poor populations suffer disproportionately are vital in the fight against global health inequality. One such
example is soil-transmitted helminth infections or worms, with a quarter of the
world’s population estimated to be at risk (Landrigan et al., 2018). In their landmark
paper, Miguel & Kremer (2004) evaluate a program in which Kenyan primary
school students were experimentally administered deworming drugs. They detect
substantial health benefits and reductions in school absenteeism, effects which also
spilled over to the non-treated. A decade later, Baird et al. (2016) estimate significant
long-run impacts. In particular, men that had been treated as boys were found to
work an additional 2.5 hours per week and spend more time in nonagricultural selfemployment and were more likely to work in manufacturing. Similarly, women were
more likely to have attended secondary school and worked more in nonagricultural
self-employment and growing cash crops, rather than in traditional agriculture.
Together, these studies indicate a link between healthcare technologies and the
welfare improvements and transition out of agriculture that are intrinsic to our
understanding of development.
48
M. Bishop et al.
Other studies have focused on health technologies for combatting malaria, a
leading cause of death in the developing world that is both curable and preventable
(WHO, 2019). For example, Bleakley (2010) studies anti-malaria campaigns in the
United States in the early twentieth century and in Brazil, Colombia, and Mexico
in the mid-twentieth century, made possible by critical scientific discoveries. These
provoked significant declines in the incidence of the disease. Moreover, the author
finds that cohorts more exposed to eradication efforts as children had higher literacy
and incomes in their adult lives, which he attributes to a positive effect on labor
productivity. Lucas (2010) also examines malaria eradication campaigns in his study
of Paraguay and Sri Lanka, which effectively eliminated malaria in both countries.
The author estimates that this in turn had a positive effect on educational attainment
and literacy in both countries.
Despite many successful efforts to eradicate malaria and worms, these and other
critical health problems remain endemic in certain parts of the world. In the case of
malaria, 2018 saw an estimated 228 million cases worldwide, with almost 85% of
the global burden concentrated in just 19 countries in sub-Saharan Africa and India
(WHO, 2019). In order to generate further progress, it is clear that more investment
in the dissemination of medications and insecticides, public health, and hygiene
and health education will be required. What remains unclear, however, is whether
applications of new technologies such as ICTs can support these vital functions.
Optimism regarding the application of ICTs to improve the efficiency and quality
of health provision has been particularly strong in the case of rural areas, where
existing services are most limited. For example, Lemay et al. (2012) study a
small-scale intervention in which an SMS-based mobile network was established
between community health workers (CHWs) in rural Malawi. They report improved
information sharing between CHWs and district staff, for example, allowing them
to report stockouts, ask medical questions, and manage emergency cases. In another
study of rural Guatemala, Martinez et al. (2018) evaluate a smartphone application
designed for supporting traditional birth attendants as they examined patients. These
care providers are heavily relied upon by local communities but typically have
limited support and linkage with public hospitals. The application was found to
increase referral rates for pregnancy and childbirth complications. These positive
initial results suggest that ICTs’ proven benefits for enhancing connectivity and
information in markets might be equally crucial for healthcare services.
The use of drones for the delivery of medical products, such as blood, vaccines,
and insulin, represents another flagship example of technology’s potential for
improving healthcare provision. The company spearheading these efforts is Zipline,
who in 2016 established the world’s first and only national scale commercial medical drone delivery service in Rwanda, a country whose geography is notoriously
hard to navigate (McCall, 2019). In 2019, Zipline delivered over 65% of Rwanda’s
blood supply outside of the capital (Robotics and Automation News, 2019).
Health technologies are also being used to deal with emerging challenges related
to the COVID-19 outbreak. This includes the use of drones in the distribution of
medical supplies, a service Zipline plans to offer (Zipline, 2020), as well as to
broadcast social distancing regulations and monitor people’s compliance, as has
2 Technology and Development
49
been carried out in Rwanda and India (Uwiringiyimana, 2020; Jamkhandikar, 2020).
Furthermore, ICT applications are enabling virtual doctors’ appointments and the
dissemination of COVID-related information, for example, in mass government text
messages (Flood, 2020). ICTs will also be vital in global efforts to track the virus’s
spread, echoing their use in Sierra Leone during the Ebola outbreak (O’Donovan &
Bersin, 2015).
Overall, we have much to thank health technology for in terms of the life
expectancies we enjoy today. Their harnessing to tackle the health problems suffered
disproportionately in developing regions is also helping to slowly chip away at
the vast inequalities in health outcomes that persist between countries. Research in
economics has furthermore demonstrated the presence of knock-on effects these can
have on education, incomes, and welfare. It is widely accepted that further progress
will hinge on basic investments into public health and sanitation infrastructures
and proven health technologies. However, much less is known about the potential
contribution that applications of new technologies, such as ICTs, can make to these
efforts. Indeed, Sundin et al. (2016) document that most of these initiatives fail
to progress beyond the pilot stage but emphasize the importance of social and
economic factors over technological ones. For example, they describe how healthrelated mobile phone applications have been limited by patients’ inability to charge
their phones. As such, they argue that health technologies must be supported by
thorough knowledge of sociocultural dynamics and business practices in order to be
able to effectively scale.
8 Conclusion
Development and growth are fundamentally about the spread of innovations and
ideas. In this chapter, we reviewed a range of areas of work which can help to
enhance this spread. A key insight that we have gleaned is that the same ingenuity
that has driven human progress since time immemorial will also be required to tackle
the externalities that have been engendered by that progress.
Development engineering is fundamentally about harnessing innovations and
bringing them to bear on development challenges, but that is not where the subject
stops. Indeed, much of the value of recent work is concerned with how alliances
between technologists, engineers, economists, and policymakers can enable the
design of interventions that work at scale in developing countries in particular.
This is easier said than done as there is often a tougher and more complex set of
constraints to overcome in scaling technological innovation in developing versus
developed countries. These are not just related to the way markets work but also to
some fundamental barriers associated with the design of regulations and the way
that political and other institutions work. In this sense, development engineering is
truly a field that bridges between science and social science.
The types of challenges faced by developing countries are not only large in
magnitude, but also extremely urgent. There are close to a billion people in extreme
50
M. Bishop et al.
poverty and close to a billion without electricity, with nearly all growth in energy
demand over the next few decades expected to stem from developing countries
(Wolfram et al., 2012). With extremely young populations, there is the challenge
of how millions of young women and men will find meaningful work (Alfonsi et al.
2020). There also exists a wealth of unanswered questions regarding the relationship
between growth and the environmental damages that accompany it, with evidence
that these may be more acute in the world’s poorer regions (Burgess et al., 2017;
Greenstone & Jack, 2015). If we are serious about eliminating extreme poverty by
2030 and about shielding more vulnerable populations from the effects of climate
change, and pollution, then we cannot sit on our hands.
This chapter has begun to point to some areas where technology can play a
critical role in addressing the major development challenges which are enshrined
in the SDGs, but it is still just a start. In many ways, it is more of a call to arms for a
diverse set of actors from the private sector, civil society, academia, and government
to come together to maximize the positive role that different technologies can play
in the process of development. Only in this way can we generate the innovations and
productivity improvements needed to keep humans on a trajectory to higher living
standards while ensuring that negative externalities generated by this growth do not
block the path to progress.
References
Abdallah, W. (2015). Effect of electronic public procurement: Evidence from Bangladesh. Working
paper.
Abebe, G., Caria, S., Fafchamps, M., Falco, P., Franklin, S., & Quinn, S. (2017a). Anonymity or
distance? Job search and labor market exclusion in a growing African city. LSE.
Abebe, G., Caria, S., Fafchamps, M., Falco, P., Franklin, S., Quinn, S., & Shilpi, F. (2017b). Job
fairs: Matching firms and workers in a field experiment in Ethiopia. Working paper.
Acemoglu, D., Hassan, T., & Tahoun, A. (2018). The power of the street: Evidence from Egypt’s
Arab spring. Review of Financial Studies, 31, 1–42.
Adhvaryu, A., Kala, N., & Nyshadham, A. (2020). The light and the heat: Productivity co-benefits
of energy-saving technology. The Review of Economics and Statistics, 102(4), 779–792.
Adukia, A., Asher, S., & Novosad, P. (2020). Educational investment responses to economic
opportunity: Evidence from Indian road construction. American Economic Journal: Applied
Economics, 12(1), 348–376.
African Progress Panel (APP). (2017). Lights power action: Electrifying Africa. February 2017.
Aghion, P., & Howitt, P. (1992). A model of growth through creative destruction. Econometrica,
60(2), 323–351.
Aker, J. C. (2010). Information from markets near and far: Mobile phones and agricultural markets
in Niger. American Economic Journal: Applied Economics, 2(3), 46–59.
Aker, J. (2018). Migration, money transfers and mobile money: Evidence from Niger. Pathways for
prosperity commission background paper series.
Aker, J. C., & Ksoll, C. (2020). Can ABC lead to sustained 123? The medium-term effects of a
technology-enhanced adult education program. Economic Development and Cultural Change,
68(3), 1081–1102.
Aker, J. C., Ksoll, C., & Lybbert, T. J. (2012). Can mobile phones improve learning? Evidence from
a field experiment in Niger. American Economic Journal: Applied Economics, 4(4), 94–120.
2 Technology and Development
51
Aker, J. C., Boumnijel, R., McClelland, A., & Tierney, N. (2016). Payment mechanisms and
antipoverty programs: Evidence from a mobile money cash transfer experiment in Niger.
Economic Development and Cultural Change, 65(1), 1–37.
Aker, J. C., Collier, P., & Vicente, P. C. (2017). Is information power? Using mobile phones and
free newspapers during an election in Mozambique. The Review of Economics and Statistics,
99(2), 185–200.
Aklin, M., Bayer, B., Harish, S. P., & Urpelainen, J. (2015). Rural electrification with off grid
community microgrids: An impact evaluation in Uttar Pradesh, India. IGC Report.
Alfonsi, L., Bandiera, O., Bassi, V., Burgess, R., Rasul, I., Sulaiman, M., & Vitali, A. (2020). Tackling youth unemployment: Evidence from a labor market experiment in Uganda. Econometrica,
88(6), 2369–2414.
Allcott, H., & Gentzkow, M. (2017). Social media and fake news in the 2016 election. Journal of
Economic Perspectives, 31(2), 211–236.
Allcott, H., Collard-Wexler, A., & O’Connell, S. D. (2016). How do electricity shortages affect
industry? Evidence from India. American Economic Review, 106(3), 587–624.
Alexandratos, N. & Bruinsma, J. (2012). World agriculture towards 2030/2050: the 2012 revision.
ESA Working Paper No. 12-03. FAO.
Asher, S., & Novosad, P. (2020). Rural roads and local economic development. American
Economic Review, 110(3), 797–823.
Atkin, D., Chaudhry, A., Chaudry, S., Khandelwal, A. K., & Verhoogen, E. (2017a). Organizational
barriers to Technology adoption: Evidence from soccer-ball producers in Pakistan*. The
Quarterly Journal of Economics, 132(3), 1101–1164.
Atkin, D., Khandelwal, A. K., & Osman, A. (2017b). Exporting and firm performance: Evidence
from a randomized experiment*. The Quarterly Journal of Economics, 132(2), 551–615.
Atkin, D., Faber, B., & Gonzalez-Navarro, M. (2018). Retail globalization and household welfare:
Evidence from Mexico. Journal of Political Economy, 126(1), 1–73.
Autor, D. H. (2014). Polanyi’s paradox and the shape of employment growth.
Autor, D. H. (2015). Why are there still so many jobs? The history and future of workplace
automation. Journal of Economic Perspectives, 29(3), 3–30.
Autor, D. H., & Dorn, D. (2013). The growth of low-skill service jobs and the polarization of the
us labor market. American Economic Review, 103(5), 1553–1597.
Autor, D. H., Levy, F., & Murnane, R. J. (2003). The skill content of recent technological change:
An empirical exploration*. The Quarterly Journal of Economics, 118(4), 1279–1333.
Autor, D. H., Katz, L. F., & Kearney, M. S. (2006). The polarization of the U.S. labor market.
American Economic Review, 96(2), 189–194.
Autor, D. H., Katz, L. F., & Kearney, M. S. (2008). Trends in US wage inequality: Revising the
revisionists. The Review of Economics and Statistics, 90(2), 300–323.
Autor, D. H., Dorn, D., & Hanson, G. H. (2015). Untangling trade and technology: Evidence from
local labor markets. The Economic Journal, 125(584), 621–646.
Baird, S., Hicks, J. H., Kremer, M., & Miguel, E. (2016). Worms at work: Long-run impacts of a
child health investment*. The Quarterly Journal of Economics, 131(4), 1637–1680.
Balboni, C. (2019). In harm’s way? Infrastructure investments and the persistence of coastal cities.
Bandiera, O., & Rasul, I. (2006). Social networks and technology adoption in northern Mozambique*. The Economic Journal, 116(514), 869–902.
Banerjee, A., Duflo, E., & Glennerster, R. (2008). Putting a band-aid on a corpse: Incentives for
nurses in the Indian public health care system. Journal of the European Economic Association,
6(2–3), 487–500.
Banerjee, A., Duflo, E., Imbert, C., Mathew, S., & Pande, R. (2020a). E-governance, accountability,
and leakage in public programs: Experimental evidence from a financial management reform
in India. American Economic Journal: Applied Economics, 12(4), 39–72.
Banerjee, A., Duflo, E., & Qian, N. (2020b). On the road: Access to transportation infrastructure
and economic growth in China. Journal of Development Economics, 145, 102442.
Barnwal, P. (2019). Curbing leakage in public programs: Evidence from India’s direct benefit
transfer policy for LPG subsidies.
52
M. Bishop et al.
Barrera-Osorio, F. & Linden, L. L. (2009). The use and misuse of computers in education: evidence
from a randomized experiment in Colombia. Policy Research Working Paper, (1).
Bartel, A., Ichniowski, C., & Shaw, K. (2007). How does information Technology affect productivity? Plant-level comparisons of product innovation, process improvement, and worker skills*.
The Quarterly Journal of Economics, 122(4), 1721–1758.
Batista, C. & Vicente, P. (2018). Is mobile money changing rural Africa? Evidence from a field
experiment.
Batista, C., & Vicente, P. (2020). Adopting mobile money: Evidence from an experiment in rural
Africa. AEA Papers and Proceedings, 110, 594–598.
Becker, G. S. (1983). A theory of competition among pressure groups for political influence. The
Quarterly Journal of Economics, 98(3), 371–400.
Besley, T., & Burgess, R. (2002). The political economy of government responsiveness: Theory
and evidence from India. The Quarterly Journal of Economics, 117(4), 1415–1451.
Besley, T., & Persson, T. (2013). Chapter 2 - taxation and development. In A. J. Auerbach, R.
Chetty, M. Feldstein, & E. Saez (Eds.), Handbook of public economics (Vol. 5, pp. 51–110).
Elsevier.
Beuermann, D. W., Cristia, J., Cueto, S., Malamud, O., & Cruz Aguayo, Y. (2015). One laptop per
child at home: Short-term impacts from a randomized experiment in Peru. American Economic
Journal: Applied Economics, 7(2), 53–80.
Bharadwaj, P., Jack, W., & Suri, T. (2019). Fintech and household resilience to shocks: Evidence
from digital loans in Kenya.
Bhattacharya, A. (2020). India’s IT industry created more jobs in 2019 than a year ago. Quartz
India.
Bleakley, H. (2010). Malaria eradication in the Americas: A retrospective analysis of childhood
exposure. American Economic Journal: Applied Economics, 2(2), 1–45.
Bloom, N., & Van Reenen, J. (2010). Why do management practices differ across firms and
countries? Journal of Economic Perspectives, 24(1), 203–224.
Blumenstock, J., Callen, M., Ghani, T., & Koepke, L. (2015). Promises and pitfalls of mobile
money in Afghanistan: Evidence from a randomized control trial.
Blumenstock, J., Callen, M., & Ghani, T. (2016). Mobile-izing savings with automatic contributions: Experimental evidence on present bias and default effects in Afghanistan.
Brookes, G., & Barfoot, P. (2018). Farm income and production impacts of using gm crop
technology 1996–2016. GM Crops & Food, 9(2), 59–89.
Bryan, G., Chowdhury, S., & Mobarak, A. M. (2014). Underinvestment in a profitable technology:
The case of seasonal migration in Bangladesh. Econometrica, 82(5), 1671–1748.
Bulman, G., & Fairlie, R. (2016). Chapter 5 - technology and education: Computers, software, and
the internet. In Volume 5 of handbook of the economics of education (pp. 239–280). Elsevier.
Burgess, R., Deschenes, O., Donaldson, D., & Greenstone, M. (2017). Weather, climate change
and death in India. LSE.
Burgess, R., Greenstone, M., Ryan, N., & Sudarshan, A. (2020a). The consequences of treating
electricity as a right. Journal of Economic Perspectives, 34(1), 145–169.
Burgess, R., Greenstone, M., Ryan, N., & Sudarshan, A. (2020b). Demand for electricity on the
global electrification frontier.
Bustos, P., Caprettini, B., & Ponticelli, J. (2016). Agricultural productivity and structural transformation: Evidence from Brazil. American Economic Review, 106(6), 1320–1365.
Calenda, D. (2016). Case studies in the international recruitment of nurses: Promising practices
in recruitment among agencies in the United Kingdom, India, and the Philippines.
Callen, M., & Long, J. D. (2015). Institutional corruption and election fraud: Evidence from a field
experiment in Afghanistan. American Economic Review, 105(1), 354–381.
Callen, M., Gibson, C. C., Jung, D. F., & Long, J. D. (2016). Improving electoral integrity with
information and communications technology. Journal of Experimental Political Science, 3(1),
4–17.
Capron, A. (2016). Pas de lumière pour faire ses devoirs? Voici le cartable solaire ivoirien. Les
Observateurs de France, 24.
2 Technology and Development
53
Carrillo, P. E., Onofa, M., & Ponce, J.. (2010). Information Technology and student achievement:
Evidence from a randomized experiment in Ecuador. IDB working paper series.
Clean Cooking Alliance (CCA). (2020). Clean cooking Alliance 2019 annual report.
Collard-Wexler, A., & De Loecker, J. (2015). Reallocation and technology: Evidence from the US
steel industry. American Economic Review, 105(1), 131–171.
Commander, S., Harrison, R., & Menezes-Filho, N. (2011). ICT and productivity in developing
countries: New firm-level evidence from Brazil and India. The Review of Economics and
Statistics, 93(2), 528–541.
Conley, T. G., & Udry, C. R. (2010). Learning about a new technology: Pineapple in Ghana.
American Economic Review, 100(1), 35–69.
Dahir, A. L. (2019). Africa’s largest wind power project is now open in Kenya. Quartz Africa.
Damania, R. & Wheeler, D. (2015). Road improvement and deforestation in the Congo basin
countries. Policy Research Working Paper; No. 7274. World Bank.
Dammert, A. C., Galdo, J. C., & Galdo, V. (2013). Digital labor-market intermediation and job
expectations: Evidence from a field experiment. IZA Discussion Paper No. 7395.
Dasgupta, S. & Wheeler, D. (2016). Minimizing ecological damage from road improvement in
tropical forests. Policy Research Working Paper; No. 7826. World Bank, 2016.
De Sisternes, F. J., Worley, H., Mueller, S., & Jenkin, T. (2020). Scaling-up sustainable energy
storage in developing countries. Journal of Sustainability Research, 2(1), e200002. https://
doi.org/10.20900/jsr20200002
Debnath, S. & Sekhri, S. (2017). No free lunch: Using technology to improve the efficacy of school
feeding programs.
Demirguc-Kunt, A., Klapper, L., Singer, D., Ansar, S., & Hess, J. (2020). The global findex
database 2017: Measuring financial inclusion and opportunities to expand access to and use
of financial services. The World Bank Economic Review, 34(Supplement1), S2–S8.
Diamond, L. (2010). Liberation Technology. Journal of Democracy, 3, 69–83.
Dinkelman, T. (2011). The effects of rural electrification on employment: New evidence from
South Africa. American Economic Review, 101(7), 3078–3108.
Donaldson, D. (2015). The gains from market integration. Annual Review of Economics, 7(1),
619–647.
Donaldson, D. (2018). Railroads of the raj: Estimating the impact of transportation infrastructure.
American Economic Review, 108(4–5), 899–934.
Donaldson, D., & Hornbeck, R. (2016). Railroads and American economic growth: A “market
access” approach *. The Quarterly Journal of Economics, 131(2), 799–858.
Downs, E. (2019). The China-Pakistan economic corridor power projects: Insights into environmental and debt sustainability. Columbia SIPA.
Drèze, J., & Tiwari, P. (2016). Making Aadhaar compulsory jeopardizes privacy rights. IGC.
Duflo, E., Kremer, M., & Robinson, J. (2008). How high are rates of return to fertilizer? Evidence
from field experiments in Kenya. American Economic Review, 98(2), 482–488.
Duflo, E., Michael K., and Jonathan, R. (2010). Understanding Technology Adoption: Fertilizer in
Western Kenya, Evidence from Field Experiments. Unpublished.
Duflo, E., Kremer, M., & Robinson, J. (2011). Nudging farmers to use fertilizer: Theory and
experimental evidence from Kenya. American Economic Review, 101(6), 2350–2390.
Duflo, E., Hanna, R., & Ryan, S. P. (2012). Incentives work: Getting teachers to come to school.
American Economic Review, 102(4), 1241–1278.
Elliott, K. A., & Keller, J. M. (2016). Can GMOs play a role in a new green revolution for Africa?
Center for Global Development.
Enikolopov, R., Makarin, A., & Petrova, M. (2020). Social media and protest participation:
Evidence from Russia. Econometrica, 88, 1479–1514.
Escueta, M., Quan, V., Nickow, A. J., & Oreopoulos, P. (2017). Education technology: An evidencebased review. (23744).
Faber, B. (2014). Trade integration, market size, and industrialization: Evidence from China’s
National Trunk Highway System. The Review of Economic Studies, 81(3), 1046–1070.
Fabregas, R., Kremer, M., & Schilbach, F. (2019). Realizing the potential of digital development:
The case of agricultural advice. Science, 366(6471).
54
M. Bishop et al.
Faivre, F. (2020). Mobile money helps displaced Congolese survive amid coronavirus threat.
UNHCR.
Finextra Research. (2020). Covid-19: M-PESA waives fees to discourage cash usage.
Flood, Z. (2020). How Africa’s tech innovators respond to the coronavirus pandemic. Al Jazeera.
Food and Agriculture Organizaton of the United Nations (FAO) (2001). Land, and W. D. Division.
The Economics of Conservation Agriculture. FAO, 2001.
Foster, A. D., & Rosenzweig, M. R. (1995). Learning by doing and learning from others: Human
capital and technical change in agriculture. Journal of Political Economy, 103(6), 1176–1209.
Fowlie, M., Khaitan, Y., Wolfram, C., & Wolfson, D. (2019). Solar microgrids and remote
energy access: How weak incentives can undermine smart technology. Economics of Energy
Environmental Policy, 8.
Fujii, T., & Shonchoy, A. S. (2020). Fertility and rural electrification in Bangladesh. Journal of
Development Economics, 3, 102430.
Fujiwara, T. (2015). Voting technology, political responsiveness, and infant health: Evidence from
Brazil. Econometrica, 83(2), 423–464.
Gandhi, R., Veeraraghavan, R., Toyama, K., & Ramprasad, V. (2009). Digital green: Participatory
video and mediated instruction for agricultural extension, 5(1), 1–15.
Gibbons, R., & Katz, L. F. (1991). Layoffs and lemons. Journal of Labor Economics, 4, 351–380.
Gollin, D., & Rogerson, R. (2014). Productivity, transport costs and subsistence agriculture.
Journal of Development Economics, 107(C), 38–48.
Goos, M., & Manning, A. (2007). Lousy and lovely jobs: The rising polarization of work in Britain.
The Review of Economics and Statistics, 89(1), 118–133.
Goos, M., Manning, A., & Salomons, A. (2014). Explaining job polarization: Routine-biased
technological change and offshoring. American Economic Review, 104(8), 2509–2526.
Graetz, G., & Michaels, G. (2015). Robots at work. The Review of Economics and Statistics,
100(5), 753–768.
Greenstone, M., & Jack, B. K. (2015). Envirodevonomics: A research agenda for an emerging field.
Journal of Economic Literature, 53(1), 5–42.
Greenwald, B. C. (1986). Adverse selection in the labour market. The Review of Economic Studies,
53(3), 325–347.
Grogan, L. (2018). Time use impacts of rural electrification: Longitudinal evidence from
Guatemala. Journal of Development Economics, 135, 304–317.
GSM Association (GSMA). (2019). Connected women: The mobile gender gap report 2019.
Harigaya, T. (2016). Effects of digitization on financial behaviors: Experimental evidence from the
Philippines. Working Paper.
Hjort, J., & Poulsen, J. (2019). The arrival of fast internet and employment in Africa. American
Economic Review, 109(3), 1032–1079.
IEA. (2019). World Energy Outlook 2019. IEA.
IEA. (2020). Brazil. IEA.
IFAD. (2015). Kenya cereal enhancement programme climate resilient agricultural livelihoods
window (KCEP-CRAL). International Fund for Agricultural Development (IFAD), 2015.
IFAD. (2020). Before and during covid-19, an e-voucher initiative makes a difference for Kenyan
farmers. International Fund for Agricultural Development (IFAD), 2020.
Ignaciuk, A., & Mason-D’Croz, D. (2014). Modelling adaptation to climate change in agriculture,
70.
International Hydropower Association (IHA). (2017). Ethiopia.
International Hydropower Association (IHA). (2018). Brazil.
ISAAA. (2018). Global status of commercialized biotech/gm crops in 2018: Biotech crops continue
to help meet the challenges of increased population and climate change. 54, 2018.
Jack, K. (2011). Market inefficiencies and the adoption of agricultural technologies in developing
countries. Center for Effective Global Action.
Jack, K., & Smith, G. (2020). Charging ahead: Prepaid metering, electricity use, and utility
revenue. American Economic Journal: Applied Economics, 2, 134–168.
Jack, W., & Suri, T. (2014). Risk sharing and transactions costs: Evidence from Kenya’s mobile
money revolution. American Economic Review, 104(1), 183–123.
2 Technology and Development
55
Jamkhandikar, S. (2020). With drones and tests, India battles to keep virus out of Mumbai’s slums.
Reuters.
Jensen, R. (2007). The digital provide: Information (Technology), market performance, and
welfare in the south Indian fisheries sector*. The Quarterly Journal of Economics, 122(3),
879–924.
Kar, A., Pachauri, S., Bailis, R., & Zerriffi, H. (2019). Using sales data to assess cooking gas
adoption and the impact of India’s Ujjwala programme in rural Karnataka. Nature Energy, 4.
Karlan, D., Osei, R., Osei-Akoto, I., & Udry, C. (2014). Agricultural decisions after relaxing credit
and risk constraints. The Quarterly Journal of Economics, 2, 597–652.
Kassem, D. (2020). Does electrification cause industrial development? Grid expansion and firm
turnover in Indonesia.
Kochanova, A., Hasnain, Z., & Larson, B. (2018). Does e-government improve government capacity? Evidence from tax compliance costs, tax revenue, and public procurement competitiveness.
The World Bank Economic Review, 1, 101–120.
Kojima, M., & Trimble, C. P. (2016). Making power affordable for Africa and viable for its utilities.
World Bank, Washington DC.
Landrigan, P. J., Fuller, R., Acosta, N. J. R., Adeyi, O., Arnold, R., Basu, N., Balde, A. B.,
Bertollini, R., Bose-O’Reilly, S., Boufford, J. I., Breysse, P. N., Chiles, T., Mahidol, C., CollSeck, A. M., Cropper, M. L., Fobil, J., Fuster, V., & Greenstone, M. (2018). The lancet
commission on pollution and health. The Lancet, 391(10119), 462–512.
Lee, K., Brewer, E., Christiano, C., Meyo, F., Miguel, E., Podolsky, M., Rosa, J., & Catherine, W.
(2016). Electrification for “under grid” households in rural Kenya. Development Engineering,
1, 26–35.
Lee, K., Miguel, E., & Wolfram, C. (2020). Experimental evidence on the economics of rural
electrification. Journal of Political Economy, 128(4), 1523–1565.
Lemay, N. V., Sullivan, T., Jumbe, B., & Perry, C. (2012). Reaching remote health workers in
Malawi: Baseline assessment of a pilot M-health intervention. Journal of Health Communication, 17(Suppl 1), 105–117.
Levy, F., & Murnane, R. J. (2004). The new division of labor: How computers are creating the next
job market. Princeton University Press.
Lewis-Faupel, S., Neggers, Y., Olken, B. A., & Pande, R. (2016). Can electronic procurement
improve infrastructure provision? Evidence from public works in India and Indonesia. American Economic Journal: Economic Policy, 3, 258–283.
Linden, L. L. (2008). Complement or substitute? The effect of technology on student achievement
in India. InfoDev working paper, 17.
Lipscomb, M., Mobarak, A. M., & Barham, T. (2013). Development effects of electrification:
Evidence from the topographic placement of hydropower plants in Brazil. American Economic
Journal: Applied Economics, 5(2), 200–231.
Lowder, S. K., Skoet, J., & Raney, T. (2016). The number, size, and distribution of farms,
smallholder farms, and family farms worldwide. World Development, 7, 16–29.
Lucas, A. M. (2010). Malaria eradication and educational attainment: Evidence from Paraguay and
Sri Lanka. American Economic Journal: Applied Economics, 2(2), 46–71.
Maloney, W. F. & Molina, C. A. (2016). Are automation and trade polarizing developing country
labor markets, too? Policy Research Working Paper; No. 7922. World Bank, 2016.
Manacorda, M., & Tesei, A. (2020). Liberation technology: Mobile phones and political mobilization in Africa. Econometrica, 88(2), 533–567.
Martinez, B., Ixen, E., Hall-Clifford, R., Juarez, M., Miller, A., Francis, A., Valderrama, C., Stroux,
L., Clifford, G., & Rohloff, P. (2018). M-health intervention to improve the continuum of
maternal and perinatal care in rural Guatemala: A pragmatic, randomized controlled feasibility
trial. Reproductive Health.
McCall, B. (2019). Sub-Saharan Africa leads the way in medical drones. The Lancet, 3, 17–18.
McKenzie, D. (2017). How effective are active labor market policies in developing countries? A
critical review of recent evidence. World Bank Research Observer, 32(2), 127–154.
McRae, S. (2015). Infrastructure quality and the subsidy trap. American Economic Review, 105(1),
35–66.
56
M. Bishop et al.
Michler, J. D., et al. (2019). Conservation agriculture and climate resilience. Journal of Environmental Economics and Management, 93, 148–169.
Michaels, G., Natraj, A., & Van Reenen, J. (2014). Has ICT polarized skill demand? Evidence
from eleven countries over twenty-five years. The Review of Economics and Statistics, 96(1),
60–77.
Miguel, E., & Kremer, M. (2004). Worms. Econometrica, 72(1), 159–217.
Mohammed, O. (2015). Africa has the world’s fastest-growing labor force but needs jobs growth
to catch up. Quartz Africa.
Moneke, N. (2019). Can big push infrastructure unlock development? Evidence from Ethiopia.
Morten, M. & Oliveira, J. D.. (2018) The effects of roads on trade and migration: Evidence from a
planned capital city.
Muralidharan, K., Niehaus, P., & Sukhtankar, S. (2016). Building state capacity: Evidence from
biometric smartcards in India. American Economic Review, 06(10), 2895–2929.
Muralidharan, K., Singh, A., & Ganimian, A. J. (2019). Disrupting education? Experimental
evidence on technology-aided instruction in India. American Economic Review, 109(4), 1426–
1460.
Nilekani, N. (2018). Giving people control over their data can transform development. World Bank
Blogs.
O’Donovan, J., & Bersin, A. (2015). Controlling Ebola through M-health strategies. The Lancet.
Global Health, 3, 22.
O’Neill, P. H., Ryan-Mosley, T., & Johnson, B. (2020). A flood of coronavirus apps are tracking
us. Now it’s time to keep track of them. MIT Technology Review.
Olken, B. A. (2006). Corruption and the costs of redistribution: Micro evidence from Indonesia.
Journal of Public Economics, 90(4), 853–870.
Olken, B. A., & Pande, R. (2012). Corruption in developing countries. Annual Review of
Economics, 4(1), 479–509.
Pangotra, P., & Shukla, P. R. (2012). Infrastructure for low-carbon transport in India: A case study
of the Delhi-Mumbai dedicated freight corridor. UNEP.
Peyton, N. (2020). Coronavirus seen as trigger for mobile money growth in West Africa. Reuters.
Qin, B., Stromberg, D., & Wu, Y. (2017). Why does China allow freer social media? Protests versus
surveillance and propaganda. The Journal of Economic Perspectives, 31(1), 117–140.
Redding, S. J., & Sturm, D. M. (2008). The costs of remoteness: Evidence from German division
and reunification. American Economic Review, 98(5), 1766–1767.
Republic of Rwanda Ministry of Infrastructure (MININFRA). (2020) Solar energy in Rwanda.
Robotics and Automation News. (2019). UPS foundation supports Ghana’s vaccine drone delivery
network.
Rodrik, D. (2016). Premature deindustrialization. Journal of Economic Growth, 1(1), 1–33.
Romer, P. M. (1990). Endogenous technological change. Journal of Political Economy, 98(5), S71–
S102.
Rosenzweig, M. R., & Udry, C. R. (2019). Assessing the benefits of long-run weather forecasting
for the rural poor: Farmer investments and worker migration in a dynamic equilibrium model.
Working Paper.
Rud, J. P. (2012). Electricity provision and industrial development: Evidence from India. Journal
of Development Economics, 97(2), 352–367.
Schlogl, L. & Sumner, A. (2018). The rise of the robot reserve army: Automation and the future of
economic development, work, and wages in developing countries. SSRN Electronic Journal.
Solow, R. M. (1957). Technical change and the aggregate production function. The Review of
Economics and Statistics, 39(3), 312–320.
Stacey, K. (2018). Pakistan’s pivot to coal to boost energy gets critics fired up. Financial Times.
Stevenson, J. R., Serraj, R., & Cassman, K. G. (2014). Evaluating conservation agriculture
for small-scale farmers in sub-Saharan Africa and South Asia. Agriculture, Ecosystems
Environment, 187, 1–10.
Storeygard, A. (2016). Farther on down the road: Transport costs, trade and urban growth in subSaharan Africa. The Review of Economic Studies, 3(3), 1263–1295.
2 Technology and Development
57
Sundin, P., Callan, J., & Mehta, K. (2016). Why do entrepreneurial M-health ventures in the
developing world fail to scale? Journal of Medical Engineering & Technology, 40(7–8), 444–
457.
Suri, T. (2011). Selection and comparative advantage in technology adoption. Econometrica, 79(1),
159–209.
Suri, T. (2017). Mobile money. Annual Review of Economics, 9(1), 497–520.
Suri, T., Jack, W., & Stoker, T. (2012). Documenting the birth of a financial economy. Proceedings
of the National Academy of Sciences of the United States of America, 109, 10257–10262.
Syverson, C. (2011). What determines productivity? Journal of Economic Literature, 49(2), 326–
365.
Power Technology. (2020). The grand renaissance hydroelectric project.
Tsivanidis, N.. (2018). The aggregate and distributional effects of urban transit infrastructure:
Evidence from Bogotá’s Transmilenio.
United Nations (UN). (2019). Report of the secretary-general: Progress towards the sustainable
development goals.
United Nations (UN). (2020). SDGs: Sustainable development goals. Sustainable Development
Knowledge Platform, 2020.
Uwiringiyimana, C. (2020). Rwanda uses drones to help catch lockdown transgressors. Reuters.
Vodafone. (2020). What is M-PESA?
Webb, M. (2019). The impact of artificial intelligence on the labor market. SSRN Electronic
Journal.
Wolfram, C., Shelef, O., & Gertler, P. (2012). How will energy demand develop in the developing
world? Journal of Economic Perspectives, 26(1), 119–138.
World Bank. (2003). World development report 2004: Making services work for poor people.
World Bank. (2016). World development report 2016: Digital dividends.
World Bank. (2018a). Combating corruption.
World Bank. (2018b). The state of social safety nets.
World Bank. (2018c). Why modern, fair and open public procurement systems matter for the
private sector in developing countries.
World Bank. (2018d). World bank group commits $1 billion for battery storage to ramp up
renewable energy globally.
World Bank. (2019). World development report 2019: The changing nature of work.
World Health Organization (WHO). (2017). Tracking universal health coverage: 2017 global
monitoring report.
World Health Organization (WHO). (2019). World malaria report 2019.
Zipline. (2020). Zipline’s Covid-19 response.
Open Access This chapter is licensed under the terms of the Creative Commons Attribution 4.0
International License (http://creativecommons.org/licenses/by/4.0/), which permits use, sharing,
adaptation, distribution and reproduction in any medium or format, as long as you give appropriate
credit to the original author(s) and the source, provide a link to the Creative Commons license and
indicate if changes were made.
The images or other third party material in this chapter are included in the chapter’s Creative
Commons license, unless indicated otherwise in a credit line to the material. If material is not
included in the chapter’s Creative Commons license and your intended use is not permitted by
statutory regulation or exceeds the permitted use, you will need to obtain permission directly from
the copyright holder.
Chapter 3
A Practical Framework for Research
Temina Madon
, Anustubh Agnihotri, and Ashok J. Gadgil
1 Introduction
This chapter outlines a practical framework for designing scalable technology solutions that solve development challenges. We begin with an overview of the common
constraints to sustainable development that often are encountered in the context of
poverty. These constraints are based on a large body of research in development
economics, political economy, psychology, and other social sciences; and they help
to explain why engineering innovations so frequently fail to achieve outcomes when
implemented in the real world. In the second part of this chapter, we provide a
framework for implementing development engineering projects, consisting of four
key activities: innovation, implementation, evaluation, and adaptation. Combining
these activities in an iterative (and usually nonlinear) path allows the researcher to
anticipate and design around the most common pitfalls associated with “technology
for development.”
T. Madon ()
Center for Effective Global Action, University of California, Berkeley, Berkeley, CA, USA
e-mail: temina@ocf.berkeley.edu
A. J. Gadgil
Department of Civil and Environmental Engineering, University of California, Berkeley,
Berkeley, CA, USA
A. Agnihotri
University of California Berkeley, Berkeley, CA, USA
e-mail: anustubh@berkeley.edu
© The Author(s) 2023
T. Madon et al. (eds.), Introduction to Development Engineering,
https://doi.org/10.1007/978-3-030-86065-3_3
59
60
T. Madon et al.
2 Innovation Under Constraints
To find solutions to thorny development challenges, researchers must begin with
building a deep understanding of context and environment. To some extent, this
can come from direct observation—from researchers embedding themselves within
representative communities, observing the cadence of daily life, learning how it is
to walk in the shoes of the potential users of a future innovation. This approach is
central to the success of product design firms like IDEO (Kelley, 2005).
Until recently, direct observation (and other elements of human-centered design)
has remained relatively uncommon in the technocentric approaches to “engineering
for development” found in many elite universities. Yet development economists,
political scientists, and others in the social sciences have invested decades in such
work, and in the collection of descriptive data across populations and contexts.
This has resulted in generalizable findings about the market systems, institutions,
behaviors, and social norms governing life in many low-resource settings. Learning
to systematically apply these insights to the design of a novel technology is an
essential thrust of development engineering.
This section provides an overview of the common constraints encountered
in many developing countries—and to some extent in low-resource communities throughout the world. Without judgement, these constraints are actually just
alternatives to the “ideal” market systems and institutions imagined to exist in
wealthy countries. In some cases, they have emerged as critical adaptations to local
conditions (such as resource scarcity, conflict, colonization, and ethnic diversity). In
the engineer’s mindset, we can think of these conditions as design requirements,
because they can affect the adoption, performance, impact, and scaling of a
technological solution. We can also think of these constraints, themselves, as targets
for intervention (Soss et al., 2011). For example, predatory policing, which may
be observed as a constraint to economic development, could be directly targeted
through the design of mobile applications and political reforms that empower
citizens to monitor and report police activity.
In a sense, the most basic constraint faced by people living in poverty is income
uncertainty. For survival, humans require continuous access to food, water, heating,
cooling, and shelter. Yet poor households, by definition, experience scarcity—not
just lack of income but also income that is lumpy across time (Collins et al., 2009).
This makes it difficult to invest in basic needs, let alone new technologies or other
assets. In urban settings, this lumpiness may take the form of irregular income from
small family-owned enterprises. These businesses are often constrained by a lack of
formal access to capital (in the form of savings or credit products). As a result they
find it difficult to invest in the inventory, marketing, supply chain tools, and other
inputs needed to build more reliable profits.
It is a more complex story for households reliant on farming for survival.
Agriculture employs the majority of the world’s poor, typically on small familyowned farms. Income from agriculture is seasonal by nature: profits are generated
largely at harvest time. This cyclic pattern of production creates lumpiness in
household consumption (Mobarak and Reimao, 2020). In addition, productivity is
dependent on weather and climate conditions, which are highly unpredictable and
3 A Practical Framework for Research
61
can vary substantially from season to season or from year to year. This uncertainty
makes it difficult for households to purchase goods or services on a regular basis,
and it can also deter households making investments in new technologies (even
when the longer-term economic benefits of a technology are well understood).
Beyond lumpy consumption, households face a lack of access to savings, credit,
and insurance products, all of which are useful for managing risk and smoothing
household consumption. This unmet need for financial services—combined with
unpredictable “shocks” like climate change, illness, and death—means that many
poor households are risk averse when it comes to spending on new products and
services.
There are a host of other constraints encountered by low-income households in
developing countries (and in many developed countries). In this chapter, we will
outline three classes of constraints that the development engineer should consider:
(1) market constraints; (2) institutional constraints; and (3) behavioral and social
constraints. You may not encounter all of these constraints in a given project,
and those encountered may not be binding (meaning that they may not be the
bottleneck we need to target). However, they are useful as diagnostic and design
tools (Hausmann et al., 2008), and they can help explain why technologies that have
worked in “developed” settings may fail when transplanted to a new setting.
These constraints can be considered as design requirements, but they can also
be direct targets for technological innovation. Where markets fail to meet the
needs of poor households, there may be a technology—say, the capture of realtime information on prices—that can level the playing field for disadvantaged
consumers. When institutions have been captured by elites (creating conditions for
inequality), there may be innovations that enable the decentralization of assets or
force transactions to be more transparent to citizens. While some of these problems
require policy reform, others may be amenable to technological intervention.
2.1 Market Constraints
Markets are the mechanisms through which goods and services are produced,
distributed, and consumed; and well-functioning markets can generate clear signals
of supply and demand, partially transmitted in the form of prices. In reality, all
markets operate imperfectly, and every country suffers from market distortions (or
“failures”) that result in the inefficient allocation of resources. Yet the developing
world is particularly complex.
In most developing countries, the economy is dominated by the informal sector,
which consists of market activity that is not organized, monitored, or regulated
by government. This informality, combined with challenges like weak infrastructure and high transport costs, inhibits the development of modern, market-based
economies. Informality also reduces government tax revenue and the state’s ability
to redistribute resources through public benefits programs. As a result, markets
in developing countries often fail to efficiently allocate the supply of goods and
services to those with greatest demand.
62
T. Madon et al.
Informality may enhance resilience in some communities and contexts; however, it also intensifies the uncertainty that poor households already deal with.
Understanding informal and imperfect markets—and anticipating their effect on the
performance and sustainability of a technology—is key to designing a product or
service that will achieve development impacts. A brief summary of common market
constraints is outlined in Table 3.1.
2.2 Institutional Failures
Organizations, in particular government bureaucracies and nongovernmental organizations (NGOs), play a critical role in delivering basic services to people in
developing countries—from water, sanitation, and education to pensions and social
protection schemes. Many low-income households rely on these formal institutions,
whose operations are guided by written rules and laws, for their welfare. At the same
time, people in resource constrained settings also rely on informal arrangements1 ,
like social networks, based on kinship or caste for accessing services. For example,
it is common for villagers in rural settings to finance loans or emergency support
from family members or money lenders within the village.
Both formal and informal institutions can introduce inefficiencies and distortions
in implementation of new technologies or policies (Helmke & Levitsky, 2006).
For example, ethnic or provincial community leaders may hold socially important
positions in communities, limiting the power of government appointees to manage
local affairs. In the absence of effective community oversight, these local leaders can
control the functioning of the state apparatus and capture public goods for private
benefits (a process known as “elite capture”; see Bardhan & Mookherjee, 2000).
Governments may find that their policies fail to achieve outcomes for disadvantaged
communities, or that outcomes differ from a policy’s stated objectives. For example,
states in resource constrained settings tend to generate less tax revenue than
targeted, due to weak collections and audit capacity as well as missing infrastructure
(Acemoglu et al., 2011).
In all parts of the world where formal institutions are inefficient or weak,
informal institutions remain relevant and effective at meeting the needs of citizens.
Indeed informal institutions, like their more codified counterparts, can establish
and enforce rules, negotiate disputes, distribute shared resources, and constrain
social behavior. However, informality is also challenging for the scale-up of a
technology: Informal institutions often follow tacit rules, known only to “insiders.”
By their very nature, informal norms and institutions (particularly those without
written record) require context-specific understanding. Researchers who want to
successfully implement and scale up new technologies need to invest time and
resources in trying to understand how informal institutions behave. A few examples
of commonly encountered constraints are given in Table 3.2.
1 See
Helmke and Levitsky (2006) for understanding the role of informal arrangement. They
describe informal institutions as “created, communicated, and enforced outside of officially
sanctioned channels.”
3 A Practical Framework for Research
63
Table 3.1 Examples of market constraints
Lack of insurance (risk transfer) markets: People living in poverty face a diversity of risks, made
worse by a lack of formal insurance products. This naturally reduces the appetite for risk-taking.
Even innovations that demonstrably improve welfare may seem too risky for upfront investment
by households, which is why money-back guarantees, free trials, and warranties can be useful
(Fuchs et al., 2020). Unmitigated risk is a particularly important issue for agricultural businesses,
because actuarially-priced crop insurance is still too expensive for most small-scale farmers (Cole
& Xiong, 2017). Without insurance, the investment in a yield-enhancing technology can be lost to
unexpected floods or drought.
Capital constraints and weak credit markets: Firms and households in low-income communities
often lack access to the upfront capital needed to invest in a new technology. They may lack
savings, or they may face high interest rates for credit (Banerjee and Duflo 2007). In part this is
because lenders incur fixed costs when servicing loans, and partly it is because of asymmetric
information and high default rates: people who are unbanked (or underserved by formal financial
services) lack conventional credit histories, which makes it difficult for lenders to assess
creditworthiness. When developing a solution that requires upfront costs, researchers may need to
design smart subsidies, cost-sharing arrangements, or innovative financing to be deployed
alongside the solution.
Missing information: Buyers in low-income settings may lack access to information about the
products available in markets, particularly if they have limited literacy or live in remote areas.
This missing information reduces agency and can prevent households from adopting affordable
technologies that could improve their welfare outcomes (Fuglie et al., 2019). Sellers in these
settings may also lack access to information, including demand signals, as a result of missing
market data. While digital receipts are the norm in developed countries, these enabling
technologies have not yet penetrated the majority of small merchants in developing countries. As
a result, sellers may not have the consumer insights needed to stock the right inventories. Finally,
SMEs often have weak knowledge of management practices; where such practices are widely
adopted, they can increase the efficiency of production and trade (McKenzie, 2020). An example
is the adoption of improved agricultural practices by smallholder farmers; farmers may lack
information about how to optimally weed or manage pests, and simply providing information
provision can increase yields (Fabregas et al., 2019). Of course it matters how the information is
presented and many have observed that conventional trainings for farmers or SMEs fail to
improve outcomes (Bridle et al., 2020, McKenzie, 2020).
High transaction costs: For remote households, the travel to markets to buy a product can be
prohibitively costly, even where subsidized public transportation is available. In addition to
transport costs, households may face high opportunity costs when accessing certain products;
losing a day’s income on travel to a distant market can have serious implications for daily earners.
In addition, there are the costs of searching for the right product to meet needs; it can be difficult
to gather information about product quality and prices, since they are often opaque or negotiable
in informal markets. Collectively, these transaction costs can put welfare-enhancing technologies
outside the reach of low-income communities.
High transport costs and shallow markets: Lack of physical infrastructure (like warehousing and
roads) increases the cost of transporting goods. This can make it prohibitively expensive to
transport goods to market, particularly those requiring refrigeration. These high transport costs
make it difficult for buyers and sellers to enter into transactions. As a result, small rural markets
are often insulated from larger markets, leading to price variation and spikes in supply and
demand. Middlemen with access to transport often exploit price variations as arbitrage
opportunities; this undermines more inclusive development by pushing profits for agricultural
production toward traders, rather than producers.
(continued)
64
T. Madon et al.
Table 3.1 (continued)
Labor market failures: Inefficiencies in the labor markets of the developing world are driven in
part by the high costs of job search for would-be workers, as well as asymmetric information
between employers and job seekers. It is difficult for job candidates to signal their skills and
experience, in part because of unregulated of unregulated vocational training firms and firms and
counterfeit training certifications. There are also lumpy labor supply cycles in agricultural
settings, due to harvest cycles: for parts of the year, there is too much labor, and at other times,
there is too little. Seasonal migration from rural to urban centers can partially address this
challenge, but there are high upfront costs for laborers looking to migrate. These frictions in labor
markets make it difficult for businesses to grow, consolidate, and achieve economies of scale
(Nilsson, 2019). For the developer of a new technology, labor market failures can also introduce
difficulties in establishing the technical workforce needed to operate, support, and maintain a
solution.
Input and output market inefficiencies: To maintain profitability, firms must sustain business
operations (or other productive activities) over time. However, interruptions and inefficiencies in
business operations are often introduced by upstream and downstream failures. For example, in
agriculture, a lack of reliable access to fertilizer and other inputs can reduce crop yields, while a
lack of access to output markets reduces farmers’ bargaining power over the prices they receive.
Traffic and transport delays can introduce uncertainty into the delivery times for key inputs and
outputs, resulting in wastage and other inefficiencies. Also an issue is the seasonality (or temporal
variation) of input and output markets, particularly in agriculture and related businesses.
Seasonality introduces time sensitivity, by requiring that inputs or outputs be available at specific
points in time.
Market-distorting policies: Even well-intentioned government policies can create distortions in
how markets function. For example, governments often procure staple crops from farmers at a
minimum support price. This can limit the development impact of technologies that improve
farm-to-market supply chains, since higher input costs are not recovered from market prices
(Jayne et al., 2013). Government subsidies, taxes, and mandated commodity pricing can all
introduce inefficiencies in markets and need to be accounted for by researchers developing
technologies that leverage market-based processes for successful implementation
Lack of quality grading: The lack of standards and certifications in informal and less developed
markets—for example, the lack of technology to grade the quality of agricultural produce—can
affect the price received for goods and services (Bernard et al., 2017). When quality information
is not signaled, the market does not return the expected premium to producers of higher quality
goods. As a result, the incentive to provide higher quality goods is eliminated, and producers are
less likely to adopt quality-improving technologies.
Missing human capital: A common challenge in low-resource communities is underinvestment in
people’s skills, knowledge, and, which begins at primary school and carries through to higher
education. For people’s skills, knowledge, and education, this can mean a lack of access to
trained workers to produce, distribute, or support a product. It may also mean that you need to
invest more in onboarding users and building their confidence in using a new product. Ultimately,
missing skills and expertise can limit the ability of new technologies to achieve impact and can
affect the efficiency of firms, particularly in areas of management (McKenzie, 2020).
3 A Practical Framework for Research
65
Table 3.2 Examples of institutional constraints
Elite capture: A pervasive challenge in developing countries is the capture of formal (and
informal) institutions by elites. Elites capture resources for private benefit rather than for
(intended) public use (Bardhan & Mookherjee, 2000). Elite capture is also linked to political
patronage networks where resources are used to monitor and control how citizens and
communities elect political representation (Stokes et al., 2013; Kitschelt & Wilkinson, 2007).
Thus, officials may often be unable to adhere to rules and guidelines while implementing
public policies.
Intermediaries: Intermediaries are pervasive lower-level actors that use private information or
networks to impose “rents” on individuals seeking their rightful access to public services
(Bertrand et al., 2007). This takes the form of bribes or speed-money paid by citizens to get
their requests processed by an institution or bureaucracy. Intermediaries rely on social norms
and strong social networks to help citizens get access to government services (Witsoe, 2012).
The presence of intermediaries is also linked to the inability of citizens to directly hold the
bureaucracy accountable. There is an analogous network of intermediaries in markets, for
example agricultural middlemen who use private information about market prices to exploit
smallholder farmers (Goyal, 2010).
Weak contracting environments: In resource-constrained contexts, the ability to enforce
contracts is often weak or absent, due to limited resources invested in courts and other
mechanisms of conflict resolution. Thus, the process of seeking judicial redress for lack of
adherence to contracts can take years if not decades. Even contracts with governments may not
be implemented properly due to lack of transparency, red tape, or corruption (Gupta, 2012).
This introduces uncertainty into business transactions and can reduce trust in formal
institutional processes
High transaction costs: There are often heavy user costs for “free” services provided by
government agencies. Because formal institutions in developing countries are often inefficient,
they often impose costs on those seeking access (in the form of high transport costs to reach a
government agent, long delays in the administration of benefits, or expensive documentation
required to qualify for benefits). Thus, many citizens avoid these high transaction costs by
seeking the help of intermediaries to get government approvals.
Principal-agent problems within government: Principal agent problems arise when the goals of
the “principal” (a person or group with authority) are misaligned with the incentives of the
“agent” performing a service on the principal’s behalf. Governments regularly face this
challenge, for example, when programs formulated by political leaders need to be
implemented by local officials. Ensuring that the local official implements the program
appropriately (rather than shirking duties, skimming resources, or altering protocols) requires
sophisticated monitoring systems. Without the ability to monitor the principal cannot ensure
that agents are performing tasks that align with the goals. The lack of monitoring results in
absenteeism among officials and increases the corruption and leakage from public programs
resulting in poor performance in the government’s delivery of public services (Pande, 2020).
Principal-agent problems among citizens: Voters are the principal (they are the ultimate source
of authority). Yet they can only hold politicians (the agents) accountable at the ballot box,
which gives just one opportunity for accountability every 4–5 years. In the interim,
communities should have access to effective grievance redressal systems—channels through
(continued)
66
T. Madon et al.
Table 3.2 (continued)
which citizens can voice their dissatisfaction with government. Yet, these are often unavailable
to disadvantaged communities, who may also lack the information and incentives to engage in
political action (Pande, 2020). The same is true of civil society. A well-funded civil society
(including watchdog groups, advocacy organizations, universities, and religious institutions)
can act to hold the government accountable. In wealthier countries, this is funded by a
combination of philanthropists, government grants, and individual citizens—as in the case of
news subscriptions supporting independent journalism. There is limited civil society capacity
in many developing countries, and within most disadvantaged communities.
Asymmetric information (and disinformation): The lack of literacy and education limits the
extent to which written information can be expected to spread across different segments of a
community or society. While the advent of smartphones and greater Internet penetration is
rapidly changing how information is disseminated. Individuals may lack the ability to seek out
credible information sources, due to limited social networks or lack of connection to
government decision-makers. This can result in rapid spread of misinformation (Badrinathan,
2021).
Collective action failures: Cooperation among individuals, households and firms may be
required to capture economies of scale, for example through bulk purchasing, collective
marketing, or industry-wide standardization. Coordination is also important to increase
bargaining power (e.g., labor unions among workers, farmer cooperatives for smallholders),
invest in public goods (e.g., infrastructure and education), and manage shared resources (e.g.,
water for irrigation). Disadvantaged or marginalized groups often find it difficult to bargain
collectively for their rights; they may also struggle with cooperation due to cultural factors
(Ostrom, 2010). Part of the challenge is due to limited social capital. Societies with limited
social capital (i.e., reduced trust and sense of reciprocity among individuals) find it difficult to
leverage collective action. Ethnic diversity also contributes towards the challenge of collective
action, with more homogeneous societies being able to overcome collective action challenges
(Habyarimana et al., 2007)
Weak social capital: In communities that have experienced colonialism, civil war, and other
forms of violence, there is often a lack of trust among individuals. This loss of social capital
leads to lack of trust in institutions. Individuals may not view institutions as fair, or impartial,
and working in the common public interest. Limited social capital can reduce the ability to act
collectively (Nunn and Wantchekon, 2011).
2.3 Social Norms and Behaviors That Constrain Development
Communities and individuals living in poverty face unique behavioral and cognitive
constraints that affect their decision-making about technology. Further, social norms
at the community and the household level also have the potential to shape decisionmaking around technology adoption in resource constrained settings. Some of these
are outlined in Table 3.3.
3 A Practical Framework for Research
67
Table 3.3 Examples of norms and behavioral constraints
Cognitive biases: While lack of information impacts how individuals in resource-constrained
settings make economic decisions (about their jobs, investment in children’s education,
household expenses, savings, etc.), this alone does not predict a household’s decisions. A large
body of research from psychology and behavioral economics suggests that decision-making is
influenced by cognitive biases that emerge under the pressure of resource constraints
(Mullainathan, 2013; Banerjee & Duflo, 2011, Kremer et al., 2019). These biases are
associated with cognitive scarcity or to reduced attention available to allocate to tasks (given
high levels of uncertainty and routine income shocks that poor people must weather).
Cognitive biases can prevent or slow adoption of promising technologies, and researchers
implementing new technologies should take into account the biased nature of decision-making
(Mani et al., 2013)
Intra-household bargaining: While products or technological innovations are targeted towards
individuals, the decision to adopt a product is often taken at the level of the household. The
nature of intra-household bargaining has a large and adverse impact on women, who often lack
the economic and social agency to make the decision to adopt new technologies without the
consent of other household members (elders like mother-in-law or husband). For example,
while mobile phones have rapidly spread across developing countries access to them is often
gendered with men being able to access them more easily (Joshi et al., 2020; Women, 2018).
Intra-household bargaining and women’s limited control over resources need to be accounted
for when designing new technologies
Social norms: Individual decisions are heavily constrained by societal norms and rules,
especially in communities where individuals have limited anonymity and interact with other
members on a regular basis. In such settings the decision to adopt a new product can both be
sanctioned or influenced by community norms. For example, in poor villages people with
limited resources take loans to organize a lavish wedding in order to meet expectations from
the community (Banerjee and Duflo, 2007). Similarly, in Brazilian communities social norms
related to family size were induced by telenovelas, which depicted the lives of female
characters with small families (La Ferrara et al., 2012).
Social learning: Learning and gathering information is often a social process. Women’s
self-help groups have often been used to disseminate products (e.g., microfinance interventions
or sanitary products are often introduced through SHGs), since they facilitate social learning In
addition, social learning is playing an increasing role in the adoption of agricultural
technologies (BenYishay and Mobarak, 2019).
Aspirations: Aspirations are affected by societal expectations, peer pressure, and sanction
within communities. These mental constructs can influence individuals’ decisions, including
about investments of effort, attention, and other limited resources (Genicot and Ray, 2020)
Mental models: There are assumptions about what researchers know and what power they
have, derived from people’s experiences with colonialism, inequality, and poverty. These
experiences are internalized and can deprive individuals of agency and a sense of self-efficacy,
instead endowing outsiders with authority (Wuepper and Lybbert, 2017).
Mood disorders (depression): Mounting evidence suggests that poverty is a driver of
depression, which has disabling effects on people’s well-being, productivity, and ability to
provide care for others (Ridley et al., 2020). In some cases, it may be useful to design a new
solution with the expectation that end-users are suffering from depression, which can affect
decisions and behaviors
68
T. Madon et al.
Box 3.1: Reviews of Market, Institutional, and Behavioral Constraints
Below is a collection of practical white papers outlining the constraints
faced by households, institutions, and markets in developing economies.
These are organized by sector, making them a useful resource for engineers
and development practitioners. Additional reviews of the evidence from
international development research can be found at the International Initiative
for Impact Evaluation (http://3ieimpact.org).
Agriculture
Experimental Insights on the Constraints to Agricultural Technology
Adoption (2019), accessed at https://escholarship.org/uc/item/79w3t4ds
Market inefficiencies and the adoption of agricultural technologies in
developing countries (2013), accessed at https://escholarship.org/uc/item/
6m25r19c
Governance
Governance Initiative Review Paper, J-PAL Governance Initiative (2019).
J-PAL Working Paper, accessed at https://www.povertyactionlab.org/sites/
default/files/review-paper/GI_review-paper_2019.pdf
Digital Identities
Digital Identification & Finance Initiative Africa: An Overview
of Research Opportunities (2019). J-PAL Working Paper, accessed
at https://www.povertyactionlab.org/sites/default/files/review-paper/DigiFI_
framing-paper_june-2019.pdf
Post-Primary Education
Expanding access and increasing student learning in post-primary education in developing countries: A review of the evidence (2013). J-PAL Working
Paper, accessed at https://www.povertyactionlab.org/sites/default/files/202003/PPE_review-paper_executive-summary_2013.05.07.pdf
Gender and Women
What Works to Enhance Women’s Agency: Cross-Cutting Lessons
from Experimental and Quasi-Experimental Studies (2020). J-PAL Working Paper, accessed at https://www.povertyactionlab.org/page/what-worksenhance-womens-agency
Labor Markets
Reducing search barriers for job seekers (2018). J-PAL Policy Insights,
accessed at https://doi.org/10.31485/pi.2234.2018
(continued)
3 A Practical Framework for Research
69
Box 3.1 (continued)
Urban Services
Improving Access to Urban Services for the Poor: Open Issues and a Framework for a Future Research Agenda (2012). J-PAL Working Paper, accessed
at https://www.povertyactionlab.org/sites/default/files/2020-03/USI_reviewpaper.pdf
Youth and Employment
J-PAL Youth Initiative Review Paper (2013). Abdul Latif Jameel Poverty
Action Lab Working Paper, accessed at https://www.povertyactionlab.org/
sites/default/files/documents/YouthReviewPaper_March_2013_0.pdf
J-PAL Skills for Youth Program Review Paper (2017). Abdul Latif
Jameel Poverty Action Lab Working Paper, accessed at https://www.
povertyactionlab.org/sites/default/files/review-paper/SYP_review-paper_
2017.pdf
3 Framework for Research
As the previous section outlines, the success of any innovation requires deep understanding of the constraints—market, institutional, and behavioral—that can prevent
adoption of a development solution and its impact at scale. These constraints inform
the design of technology, and they can also affect our ability to implement high
quality research. Years of field work have resulted in a set of best practices that we
present here, as a practical framework for advancing promising technologies from
the lab to the field. The most important guiding principle behind this framework is
its emphasis on feedback and iteration and the avoidance of a linear implementation
process.
The practice of development engineering focuses on the entire arc of
innovation—from problem discovery and technological invention, to prototyping
and pilot testing, impact evaluation, and finally adaptation for scale-up. These stages
are part of a continuum, and they are not necessarily carried out in sequence. In
some cases, the real-world evaluation of an existing product will lead to the design
of an entirely new technology, based on iterative feedback from users. The chlorine
water dispensers developed by Miguel, Kremer, and colleagues is one example
(Null et al., 2012). In other cases, a novel technology will enable measurement of
development outcomes at higher frequency or resolution, leading to the discovery
of new problems and opportunities (Blumenstock et al., 2016; also see Chap. 15 in
this textbook by Wilson).
Each of the following chapters in this textbook will describe a unique research
workflow, but they all fit within the framework of four activities: innovation,
implementation, impact evaluation, and adaptation for scale (see Fig. 3.1).
70
T. Madon et al.
Fig. 3.1 Iterative framework for development engineering
Innovation
Innovation is at the heart of every development engineering intervention or solution.
It is the process of discovering and characterizing a problem and then developing
a generalizable technological solution—one that can address the challenge at scale.
The innovation can lie in adapting technology to solve a new problem (e.g., by
bundling an emerging or existing technology with a novel economic, political, or
behavioral intervention); or it might lie in designing an entirely new technology
around any of the constraints outlined earlier in this chapter. The innovation may
even lie in creating new ways to measure development outcomes, either through
instrument design (like a wireless cookstove sensor) or the design of new analytic
techniques (like the use of remotely sensed imagery to predict household asset
wealth).
However, the discovery of a suitable problem, and the development of the design
requirements for a solution, is never linear; it requires a critical and evolving
understanding of local context. As an example, we consider the design of a
treatment system for removal of arsenic from drinking water. First, we investigate
the experiences and environment of households affected by arsenic contamination
(mostly people living in rural Bangladesh and Eastern India). In this context, shallow
tube wells are the main source of drinking water, household asset wealth and
consumption are low, and willingness to pay for Arsenic-safe water is lower than
3 A Practical Framework for Research
71
willingness to pay for piped water (Khan et al., 2014). Perhaps there are collective
action failures in the maintenance of existing water infrastructure, and community
trust of outside commercial providers is limited (Alfredo and O’Garra, 2020).
The engineer’s goal is to solve the problem of access to clean water, using a
combination of technological and socio-economic innovations to overcome these
hypothesized constraints. The solution must address market failures, institutional
challenges, and the preferences and behaviors of people facing arsenic poisoning—
in addition to their public health needs. These constraints can be shaped into
the solution’s design space, in the form of performance parameters (e.g., failure
tolerance, reliability, salience, desirability, cost, accessibility). It is also important to
anticipate any negative externalities created by the innovation, such as wastewater
production and environmental contamination.
Once the problem has been defined, the constraints characterized, and a solution
posed and prototyped (often just on paper), the researcher can begin to articulate a
theory of change: a set of hypotheses about how the proposed solution overcomes
observed constraints. This is the key output of the innovation activity: prototype
brainstorming and a set of hypotheses that are to be tested. But how do we get here?
To develop basic insights about a community’s development challenges,
researchers often use qualitative approaches like ethnographic observation and
human-centered design (HCD).2 Much has been written about these methods,
and we refer readers to a few resources in Box 3.1. In addition to these methods,
development engineers often consult existing data and survey research to understand
their targeted communities. Well-designed surveys can offer a quantitative and
representative view of users’ perceptions and preferences. Examples include
nationally representative datasets like the Living Standards Measurement Surveys
(Grosh & Glewwe, 1995) and the Demographic and Health Surveys (Corsi et al.,
2012), as well as survey research projects published in journals of development
economics and political economy. In addition, national statistical offices in most
countries publish census data at intervals, and they may release other de-identified
administrative datasets. Large nongovernmental organizations (NGOs) often
publish their own datasets, in areas like education (Banerji et al. 2013; Mugo et al.,
2015), health (Murray et al., 2020), and politics (Afrobarometer Data). Resources
like these are described and referenced in many of the chapters in this book.
Of course there are many challenges in collecting reliable survey data in lowresource settings (Iarossi, 2006), and these have been deeply documented across
a range of domains—from health, nutrition, and gender to welfare and politics
(Caeyers et al., 2012; Glennerster et al., 2018; Lupu & Michelitch, 2018). Issues
2 Human-centered design (HCD) is a pervasive new approach that offers detailed toolkits for
designing solutions that are participatory and attend to human values (Holeman and Kane, 2020).
It often encourages practitioners to set aside knowledge of existing solutions, instead entering the
design process with as few assumptions as possible. It focuses on listening and responding to users
and building empathy for their lived experiences. However, users can provide incomplete, biased,
or irrelevant information, and there is growing concern that these newer approaches lack evidence
of effectiveness, despite their popularity (Robertson & Salehi, 2020; Sloane et al., 2020; Thomas
et al., 2017).
72
T. Madon et al.
with survey data include sampling errors, respondent biases, and small sample sizes
(because budgets for survey research are always limited). There are other sources
of unexplained variation in survey data, as well—artifacts that are introduced
throughout the surveying process. These range from the selection of interviewers
(West & Blom, 2017) and nuances in the wording or order of survey questions (Blair
et al., 2020) to the length of a survey and how you compensate study participants
(de Weerdt et al., 2020).
To improve the reliability and reproducibility of survey results, some researchers
carry out intensive qualitative research with random samples of individuals surveyed in quantitative surveys, particularly in cases where survey questions address
sensitive issues like corruption, crime, or other risky behaviors (Blattman et al.,
2016). Some researchers now publish their survey protocols or use published
questionnaires that have been validated against more reliable methods of data
collection (Meyer et al., 2015). Still, there are few repositories that allow you to
browse and search for questionnaires by geography, population, or topic. You will
often need to sift through the supplementary materials published as part of academic
journal articles (in fields as diverse as sociology, anthropology, economics, political
science, and public health) to discover existing survey instruments.
To supplement survey datasets, researchers increasingly leverage digital technologies that capture complementary and (in some cases) less subjective information about context within their communities of interest. For example, financial
transactions using mobile phones or debit cards can offer a view into consumer
behavior including purchasing patterns (Bachas et al., 2017), loan repayments
(Björkegren & Grissen, 2018), and social insurance mechanisms (Blumenstock et
al., 2016). Remotely sensed data—like satellite imagery or drone video footage—
allow us to directly observe agricultural yields and management practices from the
sky (Lobell et al., 2020). Data extracted from social media platforms can expose
relative poverty (Fatehkia et al., 2020) as well as popular sentiment and prevailing
social norms, using natural language processing to automate analysis (Calderon et
al., 2015). Technology companies like Facebook have begun leveraging internal,
georeferenced user interaction logs to produce a range of datasets, from human
population density to international firm surveys (Stevens et al., 2019; Schneider,
2020). Anonymized call detail records and geolocation data from mobile phones
can also reveal household outcomes—from consumption patterns and asset wealth
to migration decisions and response to violence (Aiken et al., 2020; Blumenstock
et al., 2015; Chi et al., 2020; Blumenstock et al., 2018).
Insights obtained using these large-scale datasets can be useful to understand
context and also to measure development outcomes. However, few of these methods
have been extensively validated against “ground truth.” In addition, these digital
data sets carry their own biases, for example, based on who has access to mobile
technology or on which communities have been surveyed enough to train a machine
learning algorithm based on satellite imagery.
Ultimately, the data take us only so far. It takes decades to build deep knowledge
of the development constraints facing any country or community. It requires
knowledge of domestic and regional politics and economic history; it requires
3 A Practical Framework for Research
73
familiarity with local views about colonialism and its legacies. It also requires
understanding a nation’s struggles with ethnic and gender identity. Perhaps this
creates a natural imperative to collaborate with researchers, policymakers, and civil
society organizations based in the communities you wish to empower. Inclusive,
respectful partnerships with local actors are key to many successful development
engineering projects, and this success relies on the alignment of incentives for all
participants.
Box 3.2: Resources for Defining Development Challenges
Qualitative and Design Methods
•
•
•
•
Field work for development research (Scheyvens, 2014)
Qualitative research methods (Marshall & Rossman, 2014)
Participatory action research (Kindon et al., 2007)
Human-centered design methods (Holeman & Kane, 2020)
Quantitative survey research
• Academic research surveys of specific populations, including in-person
enumerated surveys or mobile surveys (Rossi et al., 2013)
• Nationally representative surveys and census data (Nikolov, 2009)
• International surveys like the demographic and health surveys (Corsi et
al., 2012) and Living Standards Measurement Study (Grosh & Glewwe,
1995)
Administrative Data
• Transactions records generated in the delivery of services by health
systems, schools, government agencies, cooperatives, and other public
organizations (Meyer & Mittag, 2019)
• Customer transaction records generated by retailers and other private
sector firms (Di Clemente et al., 2018)
“Big” Data
• Social media traffic scraped from public sources or accessed through
agreements with technology firms (Calderon et al., 2015)
• Satellite imagery, including public and private assets (Jean et al., 2016)
• Anonymized call detail records accessed through agreements with
mobile network operators (Blumenstock et al., 2015)
• Geolocation data captured through consumer smartphone applications
(Williams et al., 2015)
• Networked sensors (e.g., personal activity monitors, grid electricity
sensors, and precision agriculture devices) that capture large volumes
of environmental or behavioral data (Ramanathan et al., 2017)
74
T. Madon et al.
Implementation
Implementation is the process of piloting a new innovation, monitoring its technical
performance in the field, and understanding the factors that influence “effective”
implementation. This is in sharp contrast with the linear (and often idealized) model
of the engineer moving directly from invention to impact. An iterative approach is
required—a multistage progression from invention, to pilot, to full deployment—
with feedback loops. We must frequently return to earlier stages of our research
to update our hypotheses and theories of change. Each assumption is revisited in
light of the data and insights gained from the previous iteration. This iteration—the
process of advancing, updating, and retrialing—can start within the lab. But it is
also part of the move from the lab to field trials or the expansion from one market
to another.
In industrialized countries, such iterative loops are relatively commonplace in
product development. Technology firms have specialized teams focused on product
marketing, user interaction, design, product management, engineering, quality control, sales and growth, and financing. Because these activities are well-resourced and
have been well-studied, they result in relatively reliable processes of iteration. In the
context of development engineering, often the same team is blessed with the burden
of taking a technological invention from the lab, all the way to product development,
evaluation, and distribution. There are plenty of stumbles and failures along the way.
This framework therefore focuses on training the practitioner to cultivate a learning
mindset, treating each iteration as a valuable learning opportunity, and remaining
ready to investigate and pivot when outcomes diverge from expectation.
The implementation stage does not focus on technological prototypes alone. It
also involves the design, testing, and refinement of different business models (or
delivery models) for a technological solution. At this stage, it is useful to test
hypotheses about users’ willingness to pay or about how they access information.
This is a good time for using experimental methods that reveal the demand for a new
product or service, including pricing experiments as well as behavioral games (like
take-it-or-leave-it studies) that can reveal people’s preferences (Dupas et al., 2013).
At this stage, the development of sound partnerships also becomes paramount.
Innovating in a resource-constrained setting can be challenging because it often
requires coordination across multiple partners, each with differing standards, norms,
and incentives. One partner may support small-scale manufacturing, while another
carries out field testing. Still other partners may be needed to collect user feedback
or implement rigorous evaluations. The researcher is often reliant on local partners
to understand the local context and effectively implement studies, deployments, and
experiments. These partners may deprioritize the project or deviate from agreed
plans, because of internal challenges or as a response to the external environment.
The weakness of government or community institutions can also constrain the
ability to implement a project effectively. Piloting of new technologies may be
regulated by governments, and research involving humans is always overseen by
local review boards. Yet a lack of transparency can make it challenging to obtain the
necessary permissions for experimentation. Researchers must learn local processes
3 A Practical Framework for Research
75
and find ways to overcome institutional challenges. Iterative implementation allows
the researcher to discover the optimal implementation strategy over time, learning
how the solution will ultimately perform in the targeted setting.
Evaluation
The evaluation component of the development engineering framework focuses
on using scientific approaches (i.e., randomized controlled trials and quasiexperimental methods) to isolate the causal impacts of an innovation. We are
interested in understanding the effects of a new solution on human and economic
development; we also want to accumulate knowledge that can generalize to new
contexts. Evaluation plays a central role in development engineering, in part because
the field is in strong need of better evidence. If we fail to learn from our work, we
will perpetuate the “valley of death” between tech-for-good innovations and their
successful scale-up.
In this framework, we emphasize evaluations that test hypotheses and rigorously
investigate how a technology affects health, economic, and other outcomes in the
“real world.” We are also interested in exposing barriers to technology adoption,
and testing our theoretical models about the optimal delivery of a technology. In
some cases, we may want to measure spillovers (or unintended consequences) of an
innovation or to assess long-term effects. While a short-term evaluation might show
strong initial take-up, later follow-ups often expose disuse, environmental costs, and
other failures that dampen benefits.
We may use surveys to collect self-reported outcomes, or we may use sensors and
other networked devices to automate the monitoring of outcomes. We may choose to
instrument our solution, so that ongoing evaluation is incorporated into operations.
Regardless, by designing your evaluation carefully, you can investigate whether the
failure of a technological solution stems from technology design itself or from the
delivery model. If the failure is due to a flawed business model, evaluation results
can be used to modify pricing or design a new financing scheme. If the failure
has to do with technology design—for example, if the volume of human waste
collected from a community is too limited to support continuous urea extraction—
the results of evaluation can be used to refine design parameters and develop a
more appropriate solution. A good evaluation allows for design iteration—with
researchers incorporating the feedback into redesign—and also yields generalizable
knowledge that can be applied in new contexts.
While many researchers will evaluate their solution at pilot scale, with careful
control over implementation, there can also be value in deploying and evaluating
a technology at large scale (e.g., nationwide). This teaches us something about the
effectiveness of a solution at scale, when it is implemented under less controlled
conditions (see Chap. 20, on evaluation of Aadhaar, India’s national digital
authentication program). There is also value in evaluating a solution deployed
across multiple contexts, in tandem, through portfolios of field experiments that test
a shared hypothesis. This teaches us about the variations in effectiveness across
76
T. Madon et al.
conditions and can also reveal the sorts of adaptations that are required for an
innovation to succeed at large scale (ref meta-keta, WSH eval).
Adaptation
Scaling up involves taking an innovation from the evaluation stage (with evidence of
positive impact, albeit on a limited number of users) and adapting it to reach a larger
number of users and to reach users in new geographies. The process of maintaining
a technological solution at scale comes up with its own unique challenges. For
example, for scale-ups that rely on market processes, the business model becomes
a critical factor determining long-term sustainability. There will be challenges in
managing deep supply chains, which requires strategies for mitigating risks from the
market frictions commonly found in developing countries. Operations and maintenance, along with monitoring for quality assurance, will require critical attention. In
addition, customer “success” may require not only technical support but also costly
investments in user training or onboarding, particularly for communities that have
not interacted extensively with your class of technologies. Some innovations will
require intellectual property (IP) protections to ensure broader use and scale-up.
However, IP regimes in resource poor countries may be poorly designed or weakly
implemented, making IP protection a risky choice for researchers.
For scale-ups implemented in partnership with governments, it is key to navigate
the political economy of institutions (and the incentives of those with vested
interests) as well government regulation, legal challenges, and the role of civil
society in oversight. Further, public institutions responsible for implementing
or disseminating services may fail to adhere to the researcher’s well-defined
standards, which can compromise the fidelity of implementation. This is an issue
in many under-resourced communities, where there are high rates of absenteeism
among frontline workers who are also overburdened with administrative tasks and
responsibilities (Finan et al., 2017). The prevalence of corruption, along with weak
monitoring of government workers, can also make implementation of projects a
challenge.
The success of scale-up efforts is closely linked to the concepts of evaluation
and iterative implementation. Evaluations conducted as part of small-scale field
pilots allow the researcher to understand the challenges of implementation and
gather evidence of a solution’s impact. Ideally these evaluations also reveal the
mechanisms through which a product acts and expose any required or enabling
conditions. This generalizable knowledge enables scale. As we move from the pilot
context to a larger scale or from one country to another, we can then test whether
the conditions for intervention success are found in new target environments and
target scaling efforts where the innovation is most likely to achieve impact (Bates &
Glennerster 2017).
Several successful examples of scale-up, from chlorine dispensers to provide
clean water to deworming tablets, were first piloted at a smaller scale. There are
also examples where attempted scale-up without evaluation led to failure. For
example, the Embrace infant warmer developed to work in poor countries with
3 A Practical Framework for Research
77
Fig. 3.2 The path of development engineering
limited healthcare facilities (Pg 71, Jugaad) proved effective in pilots but failed to
find traction after initial adoption.
The case studies that follow are written to tie these processes—innovation,
iterative implementation, evaluation, and adaptation—together. They demonstrate
how feedback from one stage informs the next. The framework (and this textbook)
will also undergo iteration, as new ideas are incorporated over time (Fig. 3.2).
4 Additional Resources
In addition to this textbook, there is an expanding pool of resources available to
researchers in Dev Eng. These include the open access peer-reviewed journal Development Engineering: the Journal of Engineering in Economic Development. This
journal publishes original research across multiple areas of Dev Eng, including:
• Engineering research and innovations that respond to the unique constraints
imposed by poverty
• Assessment of pro-poor technology solutions, including field performance,
consumer adoption, and end-user impacts
• Novel technologies or tools for measuring behavioral, economic, and social
outcomes in low-resource settings
• Lessons from the field, especially null results from field trials and technical
failure analyses
• Rigorous analysis of existing development “solutions” through an engineering or
economic lens
References
Acemoglu, D., Ticchi, D., & Vindigni, A. (2011). Emergence and persistence of inefficient states.
Journal of the European economic association, 9(2), 177–208.
Afrobarometer Data. Available at http://www.afrobarometer.org.
Aiken, E. L., Bedoya, G., Coville, A, & Blumenstock, J. E. (2020) Targeting development aid
with machine learning and mobile phone data: Evidence from an anti-poverty intervention
78
T. Madon et al.
in Afghanistan. In Proceedings of the 3rd ACM SIGCAS Conference on Computing and
Sustainable Societies (COMPASS ‘20) (pp. 310–311). New York: Association for Computing
Machinery.
Alfredo, K. A., & O’Garra, T. (2020). Preferences for water treatment provision in rural India:
Comparing communal, pay-per-use, and labour-for-water schemes. Water International, 45(2),
91–111.
Bachas, P., Gertler, P., Higgins, S., & Seira, E. (2017). How debit cards enable the poor to save
more (No. w23252). National Bureau of Economic Research.
Badrinathan, S. (2021). Educative interventions to combat misinformation: Evidence from a field
experiment in India. American Political Science Review, 115(4), 1325–1341.
Banerjee, A. V., & Duflo, E. (2007). The economic lives of the poor. Journal of economic
perspectives, 21(1), 141–168.
Banerji, R., Bhattacharjea, S., & Wadhwa, W. (2013). The annual status of education report
(ASER). Research in Comparative and International Education, 8(3), 387–396.
Banerjee, A. V., & Duflo, E. (2011). Poor economics: Rethinking poverty & the ways to end it.
Random House India.
Bardhan, P. K., & Mookherjee, D. (2000). Capture and governance at local and national levels.
American Economic Review, 90(2), 135–139.
Bates, M. A., & Glennerster, R. (2017). The generalizability puzzle. Stanford Social Innovation
Review, 2017, 50–54.
Bertrand, M., et al. (2007). Obtaining a driver’s license in India: An experimental approach to
studying corruption. The Quarterly Journal of Economics, 122(4), 1639–1676.
BenYishay, A., & Mobarak, A. M. (2019). Social learning and incentives for experimentation and
communication. The Review of Economic Studies, 86(3), 976-1009.
Bernard, T., De Janvry, A., Mbaye, S., & Sadoulet, E. (2017). Expected product market reforms
and technology adoption by Senegalese onion producers. American Journal of Agricultural
Economics, 99(4), 1096–1115.
Björkegren, D., & Grissen, D. (2018). Behavior revealed in mobile phone usage predicts loan
repayment. Available at SSRN 2611775.
Blair, G., Coppock, A., & Moor, M. (2020). When to worry about sensitivity bias: A social
reference theory and evidence from 30 years of list experiments. American Political Science
Review, 114(4), 1297–1315.
Blattman, C., Jamison, J., Koroknay-Palicz, T., Rodrigues, K., & Sheridan, M. (2016). Measuring
the measurement error: A method to qualitatively validate survey data. Journal of Development
Economics, 120, 99–112.
Blumenstock, J., Cadamuro, G., & On, R. (2015). Predicting poverty and wealth from mobile
phone metadata. Science, 350(6264), 1073–1076.
Blumenstock, J. E., Eagle, N., & Fafchamps, M. (2016). Airtime transfers and mobile communications: Evidence in the aftermath of natural disasters. Journal of Development Economics, 120,
157–181.
Blumenstock, J., Ghani, T., Herskowitz, S., Kapstein, E. B., Scherer, T., & Toomet, O. (2018).
Insecurity and industrial organization: Evidence from Afghanistan. The World Bank.
Bridle, L., Magruder, J., McIntosh, C., & Suri, T. (2020). Experimental insights on the constraints
to agricultural technology adoption. Working paper, agricultural technology adoption initiative.
UC Berkeley: Center for Effective Global Action. Retrieved from https://escholarship.org/uc/
item/79w3t4ds
Caeyers, B., Chalmers, N., & De Weerdt, J. (2012). Improving consumption measurement
and other survey data through CAPI: Evidence from a randomized experiment. Journal of
Development Economics, 98(1), 19–33.
Calderon, N. A., Fisher, B., Hemsley, J., Ceskavich, B., Jansen, G., Marciano, R., & Lemieux, V.
L. (2015, October). Mixed-initiative social media analytics at the World Bank: Observations of
citizen sentiment in Twitter data to explore “trust” of political actors and state institutions and
its relationship to social protest. In 2015 IEEE International conference on big data (big data)
(pp. 1678–1687). IEEE.
3 A Practical Framework for Research
79
Chi, G., Lin, F., Chi, G., & Blumenstock, J. (2020). A general approach to detecting migration
events in digital trace data. PLoS ONE, 15(10), e0239408.
Cole, S. A., & Xiong, W. (2017). Agricultural insurance and economic development. Annual
Review of Economics, 9, 235–262.
Collins, D., Morduch, J., Rutherford, S., & Ruthven, O. (2009). Portfolios of the poor. Princeton
University Press.
Corsi, D. J., Neuman, M., Finlay, J. E., & Subramanian, S. V. (2012). Demographic and health
surveys: A profile. International Journal of Epidemiology, 41(6), 1602–1613.
De Weerdt, J., Gibson, J., & Beegle, K. (2020). What can we learn from experimenting with survey
methods? Annual Review of Resource Economics, 12, 431–447.
Dupas, P., Hoffmann, V., Kremer, M., & Zwane, A. P. (2013). Micro-Ordeals, Targeting and habit
formation. Unpublished manuscript.
Fabregas, R., Kremer, M., & Schilbach, F. (2019). Realizing the potential of digital development:
The case of agricultural advice. Science, 366(6471).
Fatehkia, M., Coles, B., Ofli, F., & Weber, I. (2020). The relative value of Facebook advertising
data for poverty mapping. Proceedings of the International AAAI Conference on Web and Social
Media, 14(1), 934–938.
Finan, F., Olken, B. A., & Pande, R. (2017). The personnel economics of the developing state. In
Handbook of economic field experiments (Vol. 2, pp. 467–514).
Fuchs, W., Green, B., & Levine, D. I. (2020). Optimal arrangements for distribution in developing
markets: Theory and evidence. Available at SSRN 2957288.
Fuglie, K., Gautam, M., Goyal, A., & Maloney, W. F. (2019). Harvesting prosperity: Technology
and productivity growth in agriculture. World Bank Publications.
Genicot, G., & Ray, D. (2020). Aspirations and economic behavior. Annual Review of Economics,
12, 715-746.
Glennerster, R., Walsh, C., & Diaz-Martin, L. (2018). A practical guide to measuring women’s and
girls’ empowerment in impact evaluations. Gender Sector, Abdul Latif Jameel Poverty Action
Lab.
Grosh, M. E., & Glewwe, P. (1995). A guide to living standards measurement study surveys and
their data sets (Vol. 120). World Bank Publications.
Goyal, A. (2010). Information, direct access to farmers, and rural market performance in central
India. American Economic Journal: Applied Economics, 2(3), 22–45.
Gupta, A. (2012). Red tape: Bureaucracy, structural violence, and poverty in India. Duke
University Press.
Hausmann, R., Rodrik, D., & Velasco, A. (2008). Growth diagnostics (pp. 324–355). Towards a
new global governance.
Habyarimana, J., Humphreys, M., Posner, D. N., & Weinstein, J. M. (2007). Why does ethnic
diversity undermine public goods provision? American Political Science Review, 101(4), 709–
725.
Helmke, G., & Levitsky, S. (Eds.). (2006). Informal institutions and democracy: Lessons from
Latin America. jhu Press.
Holeman, I., & Kane, D. (2020). Human-centered design for global health equity. Information
Technology for Development, 26(3), 477–505.
Iarossi, G. (2006). The power of survey design: A user’s guide for managing surveys, interpreting
results, and influencing respondents. The World Bank.
Jayne, T. S., Mather, D., Mason, N., & Ricker-Gilbert, J. (2013). How do fertilizer subsidy
programs affect total fertilizer use in sub-Saharan Africa? Crowding out, diversion, and
benefit/cost assessments. Agricultural economics, 44(6), 687–703.
Joshi, A., Malhotra, B., Amadi, C., Loomba, M., Misra, A., Sharma, S., . . . Amatya, J. (2020).
Gender and the digital divide across urban slums of New Delhi, India: Cross-sectional study.
Journal of Medical Internet Research, 22(6), e14714.
Kelley, T. (2005). The ten faces of innovation: IDEO’s strategies for beating the devil’s advocate
& driving creativity throughout your organization. Crown Business.
80
T. Madon et al.
Khan, N. I., Brouwer, R., & Yang, H. (2014). Household’s willingness to pay for arsenic safe
drinking water in Bangladesh. Journal of Environmental Management, 143, 151–161.
Kitschelt, H., & Wilkinson, S. I. (Eds.). (2007). Patrons, clients and policies: Patterns of
democratic accountability and political competition. Cambridge University Press.
Kremer, M., Rao, G., & Schilbach, F. (2019). Behavioral development economics. In Handbook of
Behavioral Economics: Applications and Foundations 1 (Vol. 2, pp. 345–458). North-Holland.
La Ferrara, E., Chong, A., & Duryea, S. (2012). Soap operas and fertility: Evidence from Brazil.
American Economic Journal: Applied Economics, 4(4), 1-31.
Lobell, D. B., Azzari, G., Burke, M., Gourlay, S., Jin, Z., Kilic, T., & Murray, S. (2020). Eyes in
the sky, boots on the ground: Assessing satellite-and ground-based approaches to crop yield
measurement and analysis. American Journal of Agricultural Economics, 102(1), 202–219.
Lupu, N., & Michelitch, K. (2018). Advances in survey methods for the developing world. Annual
Review of Political Science, 21, 195–214.
Lybbert, T. J. (2017). Perceived self-efficacy, poverty, and economic development. Annual Review
of Resource Economics, 9, 383–404.
Mani, A., Mullainathan, S., Shafir, E., & Zhao, J. (2013). Poverty impedes cognitive function.
Science, 341(6149), 976–980.
McKenzie, D. (2020). Small business training to improve management practices in developing
countries: Reassessing the evidence for “Training Doesn’T Work”. Policy Research Working
Papers. The World Bank.
Meyer, B. D., Mok, W. K., & Sullivan, J. X. (2015). Household surveys in crisis. Journal of
Economic Perspectives, 29(4), 199–226.
Mobarak, A. M., & Reimao, M. E. (2020). Seasonal poverty and seasonal migration in asia. Asian
Development Review, 37(1), 1–42.
Mugo, J. K., Ruto, S. J., Nakabugo, M. G., & Mgalla, Z. (2015). A call to learning focus in East
Africa: Uwezo’s measurement of learning in Kenya, Tanzania and Uganda. Africa Education
Review, 12(1), 48–66.
Mullainathan, S., & Shafir, E. (2013). Scarcity: Why having too little means so much. Macmillan.
Murray, C. J., Aravkin, A. Y., Zheng, P., Abbafati, C., Abbas, K. M., Abbasi-Kangevari, M.,
. . . Abegaz, K. H. (2020). Global burden of 87 risk factors in 204 countries and territories,
1990–2019: A systematic analysis for the Global Burden of Disease Study 2019. The Lancet,
396(10258), 1223–1249.
Nilsson, B. (2019). The school-to-work transition in developing countries. The Journal of
Development Studies, 55(5), 745–764.
Null, C., Kremer, M., Miguel, E., Hombrados, J. G., Meeks, R., & Zwane, A. P. (2012). Willingness
to pay for cleaner water in less developed countries: Systematic review of experimental
evidence. The International Initiative for Impact Evaluation (3iE).
Nunn, N., & Wantchekon, L. (2011). The slave trade and the origins of mistrust in Africa. American
Economic Review, 101(7), 3221–52.
Ostrom, E. (2010). Analyzing collective action. Agricultural Economics, 41, 155–166.
Pande, R. (2020). Can democracy work for the poor?. Science, 369(6508), 1188–1192.
Ridley, M., Rao, G., Schilbach, F., & Patel, V. (2020). Poverty, depression, and anxiety: Causal
evidence and mechanisms. Science, 370(6522), eaay0214.
Robertson, S., & Salehi, N. (2020). What if I don’t like any of the choices? The limits of preference
elicitation for participatory algorithm design. arXiv preprint arXiv:2007.06718.
Schneider, J. W. (2020). Future of business survey methodology note. Facebook, November 2,
2020.
Sloane, M., Moss, E., Awomolo, O., & Forlano, L. (2020). Participation is not a design fix for
machine learning. arXiv preprint arXiv:2007.02423.
Soss, J., Fording, R. C., & Schram, S. F. (2011). Disciplining the poor: Neoliberal paternalism and
the persistent power of race. University of Chicago Press.
Stevens, F. R., Reed, F., Gaughan, A. E., Sinha, P., Sorichetta, A., Yetman, G., & Tatem, A. J. (2019,
July). How remotely sensed built areas and their realizations inform and constrain gridded
3 A Practical Framework for Research
81
population models. In IGARSS 2019-2019 IEEE international geoscience and remote sensing
symposium (pp. 6364–6367). IEEE.
Stokes, S. C., et al. (2013). Brokers, voters, and clientelism: The puzzle of distributive politics.
Cambridge University Press.
Thomas, V., Remy, C., & Bates, O. (2017, June). The limits of HCD: Reimagining the anthropocentricity of ISO 9241-210. In Proceedings of the 2017 workshop on computing within limits (pp.
85–92).
West, B. T., & Blom, A. G. (2017). Explaining interviewer effects: A research synthesis. Journal
of Survey Statistics and Methodology, 5(2), 175–211.
Witsoe, J. (2012). Everyday corruption and the political mediation of the Indian state: An
ethnographic exploration of brokers in Bihar. Economic and Political Weekly, 47–54.
Women, G. C. (2018). The mobile gender gap report 2018.
Open Access This chapter is licensed under the terms of the Creative Commons Attribution 4.0
International License (http://creativecommons.org/licenses/by/4.0/), which permits use, sharing,
adaptation, distribution and reproduction in any medium or format, as long as you give appropriate
credit to the original author(s) and the source, provide a link to the Creative Commons license and
indicate if changes were made.
The images or other third party material in this chapter are included in the chapter’s Creative
Commons license, unless indicated otherwise in a credit line to the material. If material is not
included in the chapter’s Creative Commons license and your intended use is not permitted by
statutory regulation or exceeds the permitted use, you will need to obtain permission directly from
the copyright holder.
Chapter 4
Asking the “Right” Questions
Temina Madon
and Kentaro Toyama
1 The Paradox of the Development Engineer
In any problem-solving endeavor, identifying the right problem and asking the
right questions is at least half the challenge. A well-posed problem can suggest
an obvious, effective solution, while a poorly chosen problem can lead to deadend non-solutions that leave no one better off. In this chapter, we consider
important questions that should be asked with respect to potential beneficiaries or
collaborators, the larger context of a problem, the type of impact, approaches to
scale, and ethical considerations.
To begin with, it is worth recognizing that very few people involved with
development engineering are intentionally trying to do the wrong thing. If anything,
it is the opposite – we are involved because we hope to improve the world in some
way. But, international development and development engineering have plenty of
critics, too (Sainath, 1996; Collier, 2007; Easterly, 2007; Dambisa, 2009; Morozov,
2011; Toyama, 2015). After three quarters of a century and over $2 trillion dollars
of aid, few low-income countries have crossed the threshold into middle income
(Collier, 2007; Dambisa, 2009). Despite decades of innovation with cook stoves,
cold chains, and communication technology, many developing world communities
are not healthier, more empowered, or more informed as a result (Easterly, 2007;
Morozov, 2011; Toyama, 2015). Whether we agree with the critics or not (see, e.g.,
Kenny, 2012; Sachs, 2005), there can be value in engaging with their critique that
technological innovation has not always delivered on its socioeconomic promises.
T. Madon ()
Center for Effective Global Action, University of California, Berkeley, Berkeley, CA, USA
e-mail: temina@ocf.berkeley.edu
K. Toyama
University of Michigan School of Information, Ann Arbor, MI, USA
© The Author(s) 2023
T. Madon et al. (eds.), Introduction to Development Engineering,
https://doi.org/10.1007/978-3-030-86065-3_4
83
84
T. Madon and K. Toyama
If we accept this reality – if not as universal fact, then as possibility – then we
can move on to more productive questions: Why is it that, despite our consciously
positive intentions, development engineering often fails to meet its objectives? And,
what can we do to increase our chances of success? Since later chapters are devoted
to the second question, we focus in this chapter on the first.
If our conscious intentions are positive, but the outcomes fall short, there are only
four possibilities:
(1)
(2)
(3)
(4)
We have counterproductive unconscious intentions.
Our approach is flawed.
There was bad luck.
The problem admits no solution, at least not one that we, specifically, are able
to offer.
(Give it some thought – there really are no other possibilities.) Taken together, these
possibilities should instill in us a deep humility: Either we are at fault (possibilities
1 and 2), or the circumstances are beyond us (3 and 4).
And, that brings us to the development engineer’s paradox. All engineering,
indeed, all problem-solving, requires a certain confidence, even arrogance; we must
believe that we can improve on all prior attempts. Yet, development engineering also
requires profound humility. Humility in the face of difficult odds. Humility because
of our own deficiencies of skill, knowledge, or character. Humility in the presence
of communities, contexts, and constraints that are often not our own.
How can the development engineer’s paradox be mitigated? Confidence without
humility leads to overconfidence and arrogance, which in turn closes off our senses
to the full range of information that could be available in any creative endeavor:
What do potential beneficiaries think? How do our collaborators feel? Are we testing
a proposed solution in all of the ways it should be tested? Yet, humility without
confidence leads to paralysis and disengagement. The only viable path is one in
which we use our confidence as faith in our eventual ability to reach a solution,
while we apply our humility to temper every step along the way. We have to believe
a solution exists, while doubting – and therefore intensively seeking confirmation
for – each element of any proposed solutions. (The converse is a disaster – we would
doubt the possibility of a solution, while being blithely confident in whatever options
occur to us.)
2 Beneficiaries and Aspirations
So, humility is essential throughout any development engineering project, but
it is perhaps most important when it concerns our understanding of potential
beneficiaries and what is good for them. In fact, the very phrases “beneficiaries”
and “what is good for them” trigger unease among experienced development
practitioners. Of course, anyone who engages in development is seeking to do work
that is good for someone else, so we cannot fault the attempt. The problem lies,
4 Asking the “Right” Questions
85
rather, with the presumption that we know “what is good for them,” and even more
fundamentally, with the presumption that we could ever actually know.
Indeed, the most common, most accurate criticism leveled at international
development may be that of misguided paternalism: When someone who presumed
to know what was good for another person, another community, or another nation,
turned out to be wrong. The history of development is full of such examples,
large and small. For decades, Western nations pushed “Washington Consensus”
policies that encouraged low-income countries to lower trade barriers in the name
of economic growth (Williamson, 2011); with hindsight, we see that countries that
complied with the consensus opened themselves up to exploitation, while those that
strategically defied it, like China, protected their homegrown businesses and thrived
(Serra & Stiglitz, 2008).
Development engineering has its share of such failures, as well: The Play Pump
(Costello, 2010), the Soccket (Kenny & Sandefeur, 2013), One Laptop per Child
(Villanueva-Mansilla & Olivera, 2012; Beuermann et al., 2015), and many other
technologies have failed to deliver on grand promises, even as rich-world proponents
pushed them into low-income communities. There are also homegrown efforts, like
the Computador Popular and the Simputer (Fonseca & Pal, 2006), which have
disappointed.
The obvious way to avoid presumption is to engage deeply and continuously with
potential beneficiaries – to understand what they want, what they are constrained
by, what resources they have, what strengths they can build on, and what dreams
they have for the future. Development engineers and, sometimes, their critics
have therefore refined a host of approaches to the design of solutions informed
by beneficiaries: participatory design (Schuler & Namioka, 1993), cooperative
design (Bodker & King, 2018), co-design (David et al., 2013; Ramachandran et
al., 2007), participatory action research (Kemmis, 2006; Kemmis & Wilkinson,
1998), community-based participatory design (Braa, 1996), ethnographic design
(Blomberg et al., 2009), human-centered design (Putnam et al., 2016), user-centered
design (Putnam et al., 2009), asset-based community development (Kretzmann
& McKnight, 1996; Mathie & Cunningham, 2003), and so on. What underlies
all such approaches is a respect for potential beneficiaries as people who deeply
understand the problem context, who have their own creative talents, and whose
buy-in is required for uptake, impact, and sustainability of the solution. Partly for
this reason, many practitioners of these methodologies prefer to refer to beneficiaries
as “partners” or “collaborators.”
In earlier chapters, we briefly reviewed participatory and human-centered design
approaches, but here we mention a mindset that we have found useful in our own
work and which we find counters some of the worst pathologies of “traditional”
engineering: Instead of focusing solely on solving material needs, we should look
for ways to align solutions with beneficiary aspirations.
We define an aspiration as “a desire that is persistent and aiming for something
higher” (Toyama, 2018). It is useful to contrast aspirations with needs, the latter
a common focus of both engineering and international development, in which the
goal is to understand and address human needs through “needs assessments.” While
86
T. Madon and K. Toyama
needs are often defined in relation to negative experiences – such as pain, hunger,
illness, or poverty – aspirations are optimistic and forward-looking. Needs are also
highly volatile, intensely felt but tending to vanish upon being met; in contrast,
aspirations sustain over the longer term. Thus, when projects connect to beneficiary
aspirations, beneficiaries are more likely to engage productively and for the longer
term.
Among other things, being guided by beneficiary aspirations helps avoid the
presumptions of paternalism. For example, in some very low-income communities,
parents prioritize sons over daughters for food and education; they are betting
on their boy children for future income – unfortunate but sensible in patriarchal
societies. Of course, the girls need nutrition and school as much as the boys, but
few parents feel the tug of that need. Outside efforts to reprimand parents or to
otherwise push schooling rarely stick (Herz et al., 2004). In one Indian context,
however, it was found that the example of just a handful of women per village being
recruited to high-paying white-collar jobs caused improved schooling and nutrition
outcomes for other local girls (Jensen, 2012). In other words, when parents saw that
girls could also meet family aspirations for income security, they invested more in
their daughters.
Another example is encouraging the use of toilets. Some communities have
a cultural aversion to using toilets even when outsiders bother to build them in
their neighborhoods. The sanitary need is not felt. (Or perhaps, the modern ideal
of cloistering in a tiny room with one’s own waste is not as attractive compared
with going in the big outdoors!) In Haryana, India, however, great improvements
in toilet building were seen in response to the “no toilet, no bride” campaign, in
which women were encouraged not to marry men who did not have an indoor toilet
(Stopnitzky, 2017). Celebrities were recruited to endorse the idea, thereby aligning
aspirations for marriage and middle-class lifestyles with sanitation.
Finally, there is the option of addressing needs and aspirations simultaneously
through unconditional cash transfers, in which households are given cash to spend
as they see fit. It turns out that for a range of contexts, families – free of externally
imposed donor preferences or judgements – not only relieve short-term needs but
apply the funds toward longer-term aspirations (Weidel, 2016).
3 Framing the “Problem”
So far we have discussed the bottom-up approach to discovering development
challenges, by observing people’s daily lives and understanding their aspirations.
This clearly plays an important role in defining new questions and opportunities in
development engineering. Yet to holistically characterize a development challenge,
researchers must incorporate “top-down” insights as well, by exploring the market,
institutional, and social failures that create and reinforce poverty. These are often
complex, high-level challenges that communities deal with every day – from the
high costs of moving rural goods to urban markets to the hassles of accessing
4 Asking the “Right” Questions
87
healthcare from unreliable public clinics. Yet the forces underlying these failures
are not always evident to observers on the ground.
Nevertheless, their dynamics are first-order in defining the problem to be solved
and in finding a solution that scales. Fortunately, there are existing resources that
can help us understand the behavior of markets and institutions in many lowincome settings. These include national statistics and international surveys, as
well as quantitative academic research published in social science journals. When
we combine on-the-ground observations and anecdotes with “top-down” models
and insights, we can more thoroughly characterize the complex problems facing
communities.
Of course there is always the risk that we become too reductionist in our
definition of the problem. In trying to simplify a complex challenge, we may
over-rationalize, failing to notice the details that really matter (Scott, 2020). We
may design a solution so artificial that it spectacularly fails, resulting in great
calamity for the “beneficiaries” (Duflo, 2017). As it turns out, most development
problems are complicated, multifaceted, and interconnected. They can be framed
through multiple lenses. For example, in Chap. 16, Tarpeh and co-authors discuss
the challenge of urban sanitation in East Africa. It can be framed as a public
health problem, a food production puzzle, an issue of failed governance, or a matter
of planetary boundaries (Rockström et al., 2009). How you decide to frame the
problem is often a moral, political, or personal choice that cannot be reduced to
simple cost-benefit analysis. You may think of urban sanitation as an opportunity to
capture economic value from waste, or you may see it as part of a global strategy
to reduce human reliance on synthetic fertilizers. It is equally valid to view it as a
public health emergency, through the lens of health as a human right. Asking the
“right” question often depends on your personal values and motivations.
This, in turn, requires us to acknowledge our own identities and the privileges we
benefit from. Privilege is a sort of unearned power, and it often accrues to people
with higher education, many of whom will be engaged in research at some point
in their careers (Adhikari et al., 2018). If you are reading this book, you likely are
endowed with a privilege that creates blind spots. Privilege can make it difficult for
you to directly observe or experience a community’s preferences, because there is
a cultural distance that will always mark you as separate. You may get less direct
feedback, your ideas may be challenged or vetted less thoroughly, and your casual
requests may be prioritized over others’ substantive needs.
There are productive ways to navigate and mitigate these risks. One of the most
effective is to work with partners who have fewer blind spots than you. A useful
example is the model used by Digital Green, an NGO that advises small-scale
farmers on best practices using a combination of digital technology and grassroots
partnerships. The core insight of Digital Green is that smallholder farmers are
themselves great experimenters and teachers (Gandhi et al., 2016). The platform
enables farmers to teach each other about agricultural practices that boost income,
through local production and dissemination of video content. This model taps into
the credibility that local farmers carry within their communities; it also helps to
88
T. Madon and K. Toyama
overcome the blind spots of the engineers working on Digital Green’s backend
infrastructure.
Other strategies include working for or alongside community organizations
before engaging in research (which can improve the richness and relevance of your
research questions) and proactively discussing and addressing power imbalances
in research relationships. Researchers from elite, wealthy institutions often benefit
from greater financial resources and access to government leaders; this comes
with complex ethical obligations. Researchers in less resourced institutions may
have unique knowledge, perspectives, and community relationships (Naritomi et
al., 2020); at the same time, they often face difficult-to-navigate community
expectations. Each of these contributions (and accompanying constraints) must be
materially recognized, even when they are intangible or difficult to quantify.
If you are a researcher with privilege, it is useful to actively solicit feedback,
invite questions about your own contributions to a project, and look for opportunities
to understand and invest in your colleagues. There are also a range of professional
resources emerging over the last few years: the African Academy of Sciences,
Mwazo Institute, and EASST Collaborative are all developing models for crossnational research collaboration (Hoy, 2018; Naritomi et al., 2020), including tools
to more equitably control decisions about funding, co-authorship, and study design.
In summary, to define a problem well it is valuable to spend time on the ground,
connecting with the communities you seek to empower and participating in their
lived experiences. It is enriching to read deeply about the history, politics, and
markets of the countries and communities you work in (Adhikari et al., 2018)
and to form mutually respectful partnerships with local organizations (Tindana et
al., 2007). These experiences will shape your own framing of problems, even if
unconsciously. They may help you embrace complexity, avoiding the constraints of
the “rational.”
4 Conducting Ethical Research
Once a problem has been identified, how does one proceed ethically and responsibly
with research? What does “ethical research” mean for a development engineer? The
reality is that there is no consensus definition of ethics in research. More than
anything, it is a framework for examining trade-offs in the decisions we make.
First, we must recognize that engineers are interventionists: Just like economists
and clinicians, engineers intervene on people’s lives. Development engineers, in
particular, seek to solve human problems; this work necessarily involves interaction
with people and communities.
Here we will not address whether it is ethical for outsiders to conduct research
in low-resource countries; much has been written on this, particularly in the domain
of global health (Tindana et al., 2007). We simply note that there are compelling
opportunities to contribute in the sphere of economic and human development; and
4 Asking the “Right” Questions
89
while we will face ethical challenges whenever we intervene, we can engage with
humility.
This will require us to ask difficult questions, like:
• Do the benefits to participants in research outweigh potential harms? How are
benefits and risks being defined: by outsiders or by the participating community
itself?
• Will the benefits of research be distributed fairly to all parties, in accordance with
their risks and contributions?
• Will beneficial downstream products of research (including generalizable knowledge) be made accessible to people after the study is completed? What promises
are being made, either explicitly or implicitly, in this regard?
• Have human subjects provided locally meaningful and substantive “informed
consent” for their participation in research?
Asking questions like these can help minimize the risks of exploitation (El
Setouhy et al., 2004). But there are several other practical considerations when it
comes to responsible research. When conducting research in less developed environments – where legal and regulatory protections may be limited, opaque, or altogether
absent – the responsibility for oversight is often shifted to the researcher (Alper
& Sloan, 2014). For example, in the absence of a strong environmental regulator,
you may need to develop your own checklists and protocols for monitoring and
mitigating the potential environmental impacts of your study. You may need to
build the financial management practices of local partners, so that they can legally
accept research funding from external donors. You may even need to help establish
a local institutional review board (IRB). In all cases, it is essential to involve
(and compensate) local researchers, to ensure that your practices and protocols are
appropriate and adapted to local norms.
Research Involving People
Any research that involves human participants – for example in interviews, surveys,
or usability testing – must obtain prior approval from an IRB or Research Ethics
Committee (REC). In some cases, an expedited review may be possible, particularly
if the intervention poses little risk of harm to humans. Indeed some IRBs are
beginning to innovate, recognizing that the evaluation of social interventions
generally poses less risk of harm than the testing of novel clinical treatments
(Schopper et al., 2015). Still, the process of completing a submission to an IRB
is a valuable one and pushes the researcher to systematically evaluate whether a
project’s benefits to the community will actually outweigh its risks.
Engineers operating in areas of medicine and public health are advised to
follow practices developed and adopted by the global health community, which
draws from a rich body of scholarly work in international bioethics (Pinto et
al.). For development engineers operating outside health, an excellent resource on
running responsible research in low-income countries is the Oxford Handbook of
Professional Economic Ethics (2016). A chapter by Glennerster and Powers focuses
on the ethics of randomized evaluations; another chapter by Alderman, Das and Rao
90
T. Madon and K. Toyama
takes a broader view of field work, including issues related to trust, transparency, and
privacy.
Finally it is important to communicate ethically with partners and subjects
about your research interests and motivations. Creating hope around a promising
innovation – one that will not necessarily continue after the study ends – can
be harmful to communities. In many developing communities, outsiders are seen
as wealthy power brokers, and locals may be eager to comply and please (even
something as simple as serving tea and milk to researchers, with milk they would
otherwise give to their kids). Are we being sensitive to these power dynamics?
Taking a Broader View
Researchers often implement their studies in cooperation with relatively nimble,
efficient nongovernmental organizations. What is the obligation, then, to connect
with local government staff as you proceed? There may be little incentive to engage
with bureaucracies. Yet the eventual scale-up of any “proven” innovation will likely
require some government input – whether for the actual scaling of the intervention
(e.g., in the case of a novel public service) or in the form of approvals for the
authority to operate at scale.
In general, researchers also find it valuable to engage local government agencies
and even informal community institutions when implementing a research project.
These leaders can provide valuable insights and support that can promote the
success of research projects. It can also build the government’s capacity to
regulate new classes of technology, if required. The recent expansion of machine
learning algorithms (and their penetration into areas of consumer finance, retail,
and even government services) has broadened most governments’ understanding of
public safety and consumer protection. There is a rich literature on the fairness,
accountability, transparency, and ethics of machine learning in the “real world,” and
development engineers would benefit from exposure to these ideas (Abebe et al.,
2020).
Finally, maintaining a safe research environment must consider the risks experienced by students, enumerators, and other research staff. Research can introduce
risks to students, and the communities they engage with, and these should be
anticipated and managed (Pinto & Upshur, 2009).
The Money
As the saying goes, “money talks,” and in development engineering, whoever
provides the funding has significant, sometimes subtle, influence. Whether the
funding comes from a multilateral agency, a national government, a philanthropic
foundation, an individual donor, or a private enterprise, money almost always has
its own agenda, and that agenda may not fully align with the goal of altruistically
serving beneficiaries. That tension can be the cause of ethical challenges. Just to
provide some examples:
• Donors often want to take credit for large-scale impact. To this end, they may
prefer that millions of people are “reached” or “touched” by an intervention,
whether or not it has any positive impact.
4 Asking the “Right” Questions
91
• Governments are sometimes mired in politics, whereby projects underwritten by
one administration are redirected, canceled, or sabotaged by another administration.
• For-profit companies need to break even to survive. They may cut corners, seek
richer customers, or misrepresent impact in a bid to become viable.
These are just a few examples, but all of them have consequences for fund
recipients. The ethical development engineer will be forced to consider and make
difficult decisions. In the best of cases, a funder may be appeased with minor tweaks
to the optimal path for beneficiaries; in the worst, practitioners may feel they have
no choice but to end their involvement (only to see less ethical colleagues take up
the project). Sometimes, even the option to withdraw from a project may cause
additional ethical problems.
Like many ethical quandaries, there are no easy answers to these dilemmas, but
there are heuristics to minimize or mitigate them. First, many ethical issues can be
avoided through sufficient advance dialogue, planning, and transparency among key
stakeholders. If it is known up front what a donor most hopes for with their funds,
alternatives can be considered and expectations can be managed; and again, in the
worst case, it is possible to walk away from the funds without having engaged a
vulnerable community. If a donor agrees to a set of plans for a project, including
the expected trajectory after the period of funding, then they have little basis to
complain when the plan is carried out. (Of course, a thorough plan would also figure
in a range of contingencies.)
Next, ongoing transparency and honesty can also help. When unexpected
situations arise, communicating them to donors can avoid worse disappointments
down the line. Most donors engaged in development work genuinely care about
beneficiary communities – and even those who do not will still prefer to appear
to care. If a project cannot go as planned because it turns out it would harm
beneficiaries, a change of course can often be negotiated.
Finally, it is worth remembering that despite the inherent power imbalance
between funder and funded, sponsors of development engineering need the engineer.
When anything requiring an ethical breach is requested, the engineer has power
to push back, even if based on the threat of ceasing the work. Exercising that
power when necessary ensures that the development engineer is not complicit in
problematic action.
5 Impact and Scale, Take 2
At this point, we revisit the issues of impact and scale that were discussed in Chap. 3
but incorporating some of the discussion in this chapter. One critical skill for the
development engineer is the ability to make judicious trade-offs among ideals of
practice. Ultimately, that judgment comes from experience and reflection (another
reason for humility), but we offer some suggestions below.
92
T. Madon and K. Toyama
Scope
Few problems are purely technology problems, because technology does not work
itself – it depends on capable users as well as ongoing maintenance and upkeep,
all of which in turn requires favorable social, cultural, economic, institutional, and
political conditions. Human beings are creatures of habit, but any new technology
necessitates that someone do something differently, whether it is for homemakers
to adapt to a new type of cookstove, for healthcare workers to perform their rounds
in a new way, or for bank regulators to devise new policies for mobile payments.
All of these efforts are extra-technological and therefore require something beyond
technical engineering. Any engineering project in which these other efforts are not
addressed is bound to disappoint.
But, neither is it generally realistic to expect engineers of development to train
users, supervise healthcare workers, or affect policy. That brings us to a critical
question that we believe all development engineers should ask early in a project:
“Is there a potential organizational partner with shared impact goals, that has the
relationships, the capacity, and the commitment to address most extra-technological
challenges?” If not, it is worth reconsidering the project. If so, working with such
a partner is perhaps the most effective way to ensure meaningful impact. There are
many benefits to working with a capable partner aligned with one’s objectives: A
good partner will often have good insight into beneficiary context and aspirations;
they will serve as a sounding board; and they often have critical relationships
necessary for larger-scale impact. Perhaps most of all, partners free the development
engineer to focus on the technical, economic, and social innovations they are
best suited to contribute, while ensuring that implementation is of high quality.
The alternative is for the development engineer to establish such an organization
themselves, but that requires a skillset and level of commitment well beyond
development engineering.
External Validity and Scale
Do outcomes that hold for one community would hold for another? That is the
question of external validity (Cartwright, 2011; Banerjee et al., 2017), an issue
critical for development projects that seek impact beyond their pilot community.
Strictly speaking, even the most rigorously run evaluations cannot claim validity
beyond the group from which participants were sampled or the context in which
the trial was conducted (Toyama, 2015). Of course, some external validity can
be inferred based on hypothesized mechanisms (Pearl & Barenboim, 2014) – the
impact of a new medicine will likely transfer from one human group to another,
based on universally shared biology; behavioral interventions may transfer based on
shared psychology. But, little can be taken for granted (Gauri et al., 2019).
And, because context often changes with scale, external validity is also a concern
as projects scale up. To some extent, the computer software industry has internalized
this lesson. Large multinational companies routinely involve “growth” experts at
the earliest stages of engineering design, to ensure that new products incorporate
enough flexibility to operate within varied market conditions, supply chains, and
4 Asking the “Right” Questions
93
regulatory regimes. The problem to be solved by a product may be near-universal,
like paying for electricity using a mobile phone; but the underlying technology and
feature set will vary across geographies and cultures.
An entire profession – alternately called internationalization, localization, or
globalization – has emerged around the alignment of software designs with the
diverse social norms, business practices, laws, and technical constraints found in
different countries (Aykin, 2004). This aspect of product design is complementary
to user-centered design and equally important. For anyone who has worked in the
field, it is not simply a matter of translating product manuals into new languages.
It touches hardware design, database design, system architecture, algorithm development, service level agreements, and so much more (Jimenez-Crespo, 2013). The
upfront investment in flexibility allows companies to build for sustainability and
scale; it enables expansion to new markets and policy environments without a
complete re-engineering of the product.
Whether the goal is to transplant a solution to another setting or to scale up
a solution, the approach to external validity is theoretically simple, though often a
challenge in practice: Repeat the same innovate-implement-evaluate cycle discussed
in Chap. 3 for each new setting and as the intervention is scaled up. What works
in one village may need adaptation to work in another or at the district level;
what works at the district level will need tweaking for the state or province level;
what works for a state will need modification for national impact; what works
for one country may need adjustment for another country. And, the adaptations
are likely to require both technological and socio-political adaptation. What can
be handcrafted at one scale may need assembly line or factory production at
higher scales. User engagement that is ad hoc at one scale may need to become
systematized, institutionalized, and possibly legalized at higher scales. A useful rule
of thumb for development engineering projects is that new research is required at
every order of magnitude or two of scale.
Similarly, at each new context or level of scale, it is essential to ensure that
desired impacts are continuing, through additional evaluations. Many programs
succumb to sociologist Peter Rossi’s “Iron Law of Evaluation: The expected value
of any net impact assessment of any large scale social program is zero” (Rossi,
1987). Though perhaps overstated, the iron law points to the very real tendency for
project impact to dissipate with displacement or scale, as indifferent bureaucrats and
less-informed beneficiaries play a proportionally larger role in implementation.
Cost-Benefit Analysis
Assuming that evaluations demonstrate an intervention to be effective, another
important question is whether the intervention is cost-effective especially compared
with alternative solutions. Especially for well-focused goals such as increasing the
number of vaccinated children or improving educational test scores, it should be
possible to capture project effectiveness with a cost-benefit analysis. The underlying
idea is simple – compute the financial cost per unit of impact and compare it against
cost-benefit ratios of interventions with the same objective (Dhaliwal et al., 2013).
In practice, this can be somewhat difficult as cost data must be carefully gathered,
94
T. Madon and K. Toyama
and an honest accounting of fixed costs (that could be distributed over a large
program) and variable costs (that are incurred on a per-unit-of-impact basis) must
be made; any comparative analysis would also need this information for alternative
interventions (Levin & McEwan, 2000; Brown & Tanner, 2019).
What further complicates cost-benefit analyses is that an intervention’s sum total
benefits and side effects are rarely enumerable, not to mention measurable. Most
cost-benefit analysis requires some estimation of intangible factors, some of which
may outweigh tangible benefits in importance.
Even when imperfect, however, some rudimentary analysis is worthwhile to
gauge cost-effectiveness. One point of reference is that of the aforementioned
unconditional cash transfer, in which beneficiaries are given cash – typically about
$1000 – with no strings attached (Weidel, 2016). Evidence is accumulating that
such gifts have a range of long-term benefits for poor households, with little
negative effect. Proponents have begun to call for such transfers to be considered the
benchmark when evaluating development programs (Blattman & Niehaus, 2014) –
if a program’s cost-benefit profile does not at least match that of cash transfers, why
not just give the costs of the program directly to beneficiaries?
Unanticipated Negative Effects
Critics of development often note that projects have negative unintended consequences (Merton, 1936). Unintended consequences can arise for many reasons.
Sometimes, a technology or intervention may cause direct harm as a side effect,
as was the case of DDT, a powerful pesticide that turned out to be toxic to many
animal species (and humans, when used in large doses, see Carson, 1962). In some
cases, a technology can enable harmful forms of mass misuse, as with the global
spread of misinformation and extremism on social media (Singer & Brooking, 2018;
Fernández-Luque & Bau, 2015). In other cases, an intervention effective at the
small scale can backfire at larger scales, as occasionally happens with improvements
in agricultural productivity that lead to regional gluts and a subsequent decline in
prices (Burke et al., 2019).
Yet another class of unintended consequences occur when one person’s benefit
causes someone else harm or the perception of harm. Projects aimed at empowering
women or minority groups, for example, can backfire, by incurring hostility and
possibly violence from the oppressing group (Sultana et al., 2018). Similarly,
poverty alleviation efforts can elicit envy and resentment from neighbors who
might also be impoverished but unable to take part in an intervention. Especially
with technological interventions, which tend to amplify underlying human forces,
existing inequalities may be exacerbated (Toyama, 2015). The resentment that
results from growing inequality can provoke conflict, especially when layered on
existing divisions of caste, race, religion, or ethnicity.
These are just a few examples of unintended consequences. By definition, we
cannot know all of a project’s unanticipated effects in advance, so the best we can
do is to “stay with the trouble” (Haraway, 2016), to continue to engage and address
negative consequences. This, again, reinforces the need to engage with beneficiary
4 Asking the “Right” Questions
95
communities throughout, and possibly even beyond, the project lifecycle. Knowing
as we do now that there are always unintended consequences, not to do so is neglect
and indifference.
References
Abebe, R., Barocas, S., Kleinberg, J., Levy, K., Raghavan, M., & Robinson, D. G. (2020, January).
Roles for computing in social change. In Proceedings of the 2020 conference on fairness,
accountability, and transparency (pp. 252–260).
Adhikari, S., Elorrieta, J. I., & Pomeranz, D. (2018) Working in emerging markets: Opportunities
and blind spots.
Aker, J. C., Ghosh, I., & Burrell, J. (2016). The promise (and pitfalls) of ICT for agriculture
initiatives. Agricultural Economics, 47(S1), 35–48.
Alderman, H., Das, J., & Rao, V. (2016). Conducting ethical economic research: complications
from the field. In G. F. DeMartino & D. N. McCloskey (Eds.), The Oxford handbook of
professional economic ethics (pp. 402–422). Oxford University Press.
Alper, J., & Sloan, S. S. (Eds.). (2014). Culture matters: International research collaboration in a
changing world: Summary of a workshop. National Academies Press.
Aykin, N. (2004). Usability and internationalization of information technology. Lawrence Erlbaum
Associates.
Banerjee, A. V., Duflo, E., & Gueron, J. M. (2017). Handbook of field experiments. North-Holland.
Beuermann, D. W., Cristia, J., Cueto, S., Malamud, O., & Cruz-Aguayo, Y. (2015). One laptop per
child at home: Short-term impacts from a randomized experiment in Peru. American Economic
Journal: Applied Economics, 7(2), 53–80.
Blattman, C., & P. Niehaus. (2014). Show them the money: Why giving cash helps alleviate
poverty. Foreign Affairs, May/June 2004.
Blomberg, J., Burrell, M., & Guest, G. (2009). An ethnographic approach to design. HumanComputer Interaction, 71–94.
Bødker, S., & Kyng, M. (2018). Participatory design that matters – Facing the big issues. ACM
Transactions on Computer-Human Interaction (TOCHI), 25(1), 1–31.
Braa, J. (1996, November). Community-based participatory design in the Third World. In
Proceedings of the participatory design conference (Vol. 96).
Brown, E. D., & Tanner, J. C.. (2019, November). Integrating value for money and impact evaluations: Issues, institutions, and opportunities. World Bank Group, Policy research working
paper #9041.
Burke, M., Bergquist, L. F., & Miguel, E. (2019). Sell low and buy high: Arbitrage and local price
effects in Kenyan markets. The Quarterly Journal of Economics, 134(2), 785–842.
Carson, R. (1962). Silent spring. Houghton Mifflin Company.
Cartwright, N. (2011). Evidence, external validity and explanatory relevance. Philosophy of
Science Matters: The Philosophy of Peter Achinstein, 15–28.
Collier, P. (2007). The bottom billion: Why the poorest countries are failing and what can be done
about it. Oxford University Press.
Costello, A. (2010). Troubled water. Frontline/World. Available at: http://www.pbs.org/
frontlineworld/stories/southernafrica904/video_index.html.
Dambisa, M. (2009). Dead Aid: Why aid is not working and how there is a better way for Africa.
Farrar.
David, S., Sabiescu, A. G., & Cantoni, L. (2013, November). Co-design with communities. A
reflection on the literature. In Proceedings of the 7th International development Informatics
Association Conference (IDIA) (pp. 152–166).
96
T. Madon and K. Toyama
Dhaliwal, I., Duflo, E., Glennerster, R., & Tulloch, C. (2013). Comparative cost-effectiveness
analysis to inform policy in developing countries: A general framework with applications for
education. In Education policy in developing countries (pp. 285–338).
Duflo, E. (2017). The economist as plumber. American Economic Review, 107(5), 1–26.
Easterly, W. (2007). The white man’s burden. Oxford University Press.
El Setouhy, M., Agbenyega, T., Anto, F., Clerk, C. A., Koram, K. A., English, M., . . . MfutsoBengu, J. (2004). Moral standards for research in developing countries from “reasonable
availability” to “fair benefits”. The Hastings Center Report, 34(3), 17–27.
Fernández-Luque, L., & Bau, T. (2015). Health and social media: perfect storm of information.
Healthcare Informatics Research, 21(2), 67–73.
Fonseca, R., & Pal, J. (2006, May). Computing devices for all: Creating and selling the low-cost
computer. In 2006 international conference on information and communication technologies
and development (pp. 11–20). IEEE.
Gauri, V., Jamison, J. C., Mazar, N., & Ozier, O. (2019). Motivating bureaucrats through social
recognition: External validity – A tale of two states. Organizational Behavior and Human
Decision Processes.
Glennerster, R., & Powers, S. (2016). Balancing risk and benefit: ethical tradeoffs in running
randomized evaluations. In G. F. DeMartino & D. N. McCloskey (Eds.), The Oxford handbook
of professional economic ethics (pp. 402–422). Oxford University Press.
Haraway, D. J. (2016). Staying with the trouble: Making Kin in the Chthulucene. Duke University
Press.
Gandhi, et al. (2016). Digital green. In D. Hanks & R. Steiner (Eds.), Harnessing the power of
collective learning. Taylor & Francis.
Heeks, R. (2002). Information systems and developing countries: Failure, success, and local
improvisations.
Herz, B., Herz, B. K., & Sperling, G. B. (2004). What works in girls’ education: Evidence and
policies from the developing world. Council on Foreign Relations.
Hoy, A. Q. (2018). Africa cultivates innovation to boost global reach. Science, 360(6387), 391–
392.
Jensen, R. (2012). Do labor market opportunities affect young women’s work and family
decisions? Experimental evidence from India. The Quarterly Journal of Economics, 127(2),
753–792.
Jimenez-Crespo, M. A. (2013). Translation and web localization. Taylor & Francis.
Kemmis, S. (2006). Participatory action research and the public sphere. Educational Action
Research, 14(4), 459–476.
Kemmis, S., & Wilkinson, M. (1998). Participatory action research and the study of practice. In
Action research in practice: Partnerships for social justice in education (Vol. 1, pp. 21–36).
Kenny, C. (2012). Getting better: Why global development is succeeding – And how we can
improve the world even more. Basic Books.
Kenny, C., & Sandefur, J. (2013). Can Silicon Valley save the world? Foreign Policy, 201, 72.
Kretzmann, J., & McKnight, J. P. (1996). Assets-based community development. National Civic
Review, 85(4), 23–29.
Levin, H. M., & McEwan, P. J. (2000). Cost-effectiveness analysis: Methods and applications (Vol.
4). Sage.
Mathie, A., & Cunningham, G. (2003). From clients to citizens: Asset-based community development as a strategy for community-driven development. Development in Practice, 13(5),
474–486.
Merton, R. K. (1936). The unanticipated consequences of purposive social action. American
Sociological Review, 1(6), 894–904.
Morozov, E. (2011). The net delusion: How not to liberate the world. Perseus Books.
Moyo, D. (2009). Dead aid: Why aid is not working and how there is a better way for Africa.
Macmillan.
Namioka, A., & Schuler, D. (1993). Participatory design: Principles and practices. Taylor &
Francis.
4 Asking the “Right” Questions
97
Naritomi, J., Sequeira, S., Weigel, J., & Weinhold, D. (2020). RCTs as an opportunity to promote
interdisciplinary, inclusive, and diverse quantitative development research. World Development,
127, 104832.
Pearl, J., & Bareinboim, E. (2014). External validity: From do-calculus to transportability across
populations. Statistical Science, 579–595.
Pinto, A. D., & Upshur, R. E. (2009). Global health ethics for students. Developing World
Bioethics, 9(1), 1–10.
Putnam, C., Rose, E., Johnson, E. J., & Kolko, B. (2009). Adapting user-centered design methods
to design for diverse populations. Information Technologies & International Development, 5(4).
Putnam, C., Reiner, A., Ryou, E., Caputo, M., Cheng, J., Allen, M., & Singamaneni, R.
(2016). Human-centered design in practice: Roles, definitions, and communication. Journal
of Technical Writing and Communication, 46(4), 446–470.
Ramachandran, D., Kam, M., Chiu, J., Canny, J., & Frankel, J. F. (2007). Social dynamics of early
stage co-design in developing regions. In Proceedings of the SIGCHI conference on human
factors in computing systems (pp. 1087–1096).
Rockström, J., Steffen, W., Noone, K., Persson, Å., Chapin, F. S., III, Lambin, E., . . . Foley, J.
(2009). Planetary boundaries: Exploring the safe operating space for humanity. Ecology and
Society, 14(2).
Rossi, P. H. (1987). The Iron Law of evaluation and other metallic rules. In Research in social
problems and public policy (Vol. 4, pp. 3–20). JAI Press.
Sachs, J. (2005). The end of poverty: How we can make it happen in our lifetime. Penguin.
Sainath, P. (1996). Everybody loves a good drought: Stories from India’s poorest districts. Penguin
Books.
Schopper, D., Dawson, A., Upshur, R., Ahmad, A., Jesani, A., Ravinetto, R., . . . Singh, J. (2015).
Innovations in research ethics governance in humanitarian settings. BMC Medical Ethics, 16(1),
1–12.
Schuler, D., & Namioka, A. (Eds.). (1993). Participatory design: Principles and practices. CRC
Press.
Scott, J. C. (2020). Seeing like a state: How certain schemes to improve the human condition have
failed. Yale University Press.
Serra, N., & Stiglitz, J. (Eds.). (2008). The Washington consensus reconsidered: Towards a new
global governance. Oxford University Press.
Singer, P. W., & Brooking, E. T. (2018). LikeWar: The weaponization of social media. Eamon
Dolan Books.
Stopnitzky, Y. (2017). No toilet no bride? Intrahousehold bargaining in male-skewed marriage
markets in India. Journal of Development Economics, 127, 269–282.
Sultana, S., Guimbretière, F., Sengers, P., & Dell, N. (2018, April). Design within a patriarchal
society: Opportunities and challenges in designing for rural women in bangladesh. In
Proceedings of the 2018 CHI conference on human factors in computing systems (pp. 1–13).
Tindana, P. O., Singh, J. A., Tracy, C. S., Upshur, R. E., Daar, A. S., Singer, P. A., . . . Lavery, J. V.
(2007). Grand challenges in global health: community engagement in research in developing
countries. PLoS Medicine, 4(9), e273.
Toyama, K. (2015). Geek Heresy: Rescuing social change from the cult of technology. PublicAffairs.
Toyama, K. (2018). From needs to aspirations in information technology for development.
Information Technology for Development, 24(1), 15–36.
Villanueva-Mansilla, E., & Olivera, P. (2012). Institutional barriers to development innovation:
Assessing the implementation of XO-1 computers in two peri-urban schools in Peru. Information Technologies & International Development, 8(4), 177.
Weidel, T. (2016). Philanthropy, cosmopolitanism, and the benefits of giving directly. Journal of
Global Ethics, 12(2), 170–186.
Williamson, J. G. (2011). Trade and poverty: When the Third World fell behind. MIT Press.
98
T. Madon and K. Toyama
Open Access This chapter is licensed under the terms of the Creative Commons Attribution 4.0
International License (http://creativecommons.org/licenses/by/4.0/), which permits use, sharing,
adaptation, distribution and reproduction in any medium or format, as long as you give appropriate
credit to the original author(s) and the source, provide a link to the Creative Commons license and
indicate if changes were made.
The images or other third party material in this chapter are included in the chapter’s Creative
Commons license, unless indicated otherwise in a credit line to the material. If material is not
included in the chapter’s Creative Commons license and your intended use is not permitted by
statutory regulation or exceeds the permitted use, you will need to obtain permission directly from
the copyright holder.
Part I
Expanding Access to Affordable and
Reliable Energy, While Minimizing the
Environmental Impacts
Kenneth Lee
It is impossible to imagine modern life without access to affordable and reliable
electricity. Yet this is the reality for the roughly 800 million people living in energy
poverty today, the majority of whom are located in South Asia and sub-Saharan
Africa.1 As the economies in these regions grow, it is inevitable that demand for
energy will rise.
How will developing countries meet this growing demand for energy? If the
answer lies in conventional, highly polluting fossil fuel technologies – as has largely
been the case in the economic development of India and China – then the environmental consequences will be severe. At the local level, rapidly expanding the use
of fossil fuels for energy production, industrial manufacturing, and transportation,
among other activities, will result in higher levels of air pollution to the detriment
of public health. And at the global level, increasing energy demand will produce
a commensurate rise in carbon emissions, further accelerating climate change and
the impacts of global warming which are already being felt in greater frequencies
across the world. This is the fundamental dilemma. So many people still lack access
to basic energy services or require greater levels of energy consumption to support
a modern standard of living, yet the worst consequences of climate change are just
around the corner.
Recent advancements in technologies, especially those in the areas of clean
energy, remote sensing, and mobile payments, offer reasons for hope. Solar lanterns,
for instance, have never been more affordable and accessible than they are today.
This was made possible by a decline in the cost of photovoltaics, improvements
in batteries, and financial technology (“FinTech”) innovations that now allow poor
1 See:
IEA (International Energy Agency). 2019. World Energy Outlook 2019. Paris: IEA.
K. Lee
Chief Research and Evaluation Officer, The Pharo Foundation, Nairobi, Kenya
e-mail: klee@pharofoundation.org
100
I Expanding Access to Affordable and Reliable Energy, While Minimizing. . .
consumers to acquire new energy devices through “pay-as-you-go” programs,
thus alleviating the credit constraints that often limit the adoption of promising
technologies in rural settings. In Kenya, the use of solar lanterns and solar home
systems has become so widespread that kerosene lanterns – not long ago an essential
item in rural communities across the developing world – are now on track to finally
become obsolete.2
For development engineers, the energy and environment challenges are threefold.
First, we need strategies to deploy existing and emerging technologies to expand
access to electricity and then ensure that it remains reliable and affordable. Second,
we need strategies to limit the environmental impacts, like air pollution and carbon
emissions, that will be caused by this expanded access to energy. And third, as the
planet continues to warm, we require a host of solutions to help people adapt to
emerging and future climate-related threats, like extreme heat, flooding, and water
scarcity.
This section includes three case studies on recent or ongoing research projects in
Kenya, Ghana, and India. The first chapter, which covers the question of how best to
expand access to electricity in Kenya, narrates the story behind an interdisciplinary
project that began as a study on solar microgrids, but evolved into a study on the
economics of last-mile grid electrification. The second chapter, which focuses on
the frequent blackouts that have plagued the electricity grid in Ghana, describes a
project to design, deploy, and operate a large network of remote sensors to measure
power outages and quality at households and firms. Then, shifting to the problem
of air pollution in India, third chapter describes how the installation of continuous
emissions monitoring systems led to improvements in the government’s ability to
monitor and regulate the particulate matter emitted by local industries.
The chapters in this section share some common lessons and themes. First,
the case studies highlight the exciting opportunity that new technologies have in
developing countries to address market failures or imperfections (like information
asymmetry and credit constraints) and solve other issues related to the performance
of public institutions. Second, the case studies demonstrate how the initial beliefs we
may hold regarding the viability of (or even the demand for) a particular technology
may be drastically revised (or even discarded) following some critical piloting
experience in the field. Third, from these examples, we learn that the success of a
new technology is not tied solely to the ingenuity or technical quality of its design.
Rather, the overall impact of a new technology depends on what happens when
it is deployed at scale; how it interacts with the various economic, political, and
behavioral forces in play; and the motivations or incentives of key decision makers
and actors. Ultimately, what the case studies in this section reveal is that technology
cannot be separated from the underlying context – which is perhaps a lesson that
extends to the broader field of Development Engineering.
2 In the 2009 Kenya Population and Housing Census (KPHC), 75.7% of Kenyan households stated
that they were using kerosene or fuel wood as their main source of lighting. By the 2019 census,
only 19.3% of households were using these same sources. Over the period, usage of solar increased
from 1.6% to 19.3% of all households.
Chapter 5
Expanding Access to Electricity in Kenya
Kenneth Lee
1 The Development Challenge
In 2012, we began a study on solar microgrids in rural Kenya. Over time, it evolved
into an experiment that randomized the expansion of the national electricity grid
instead. In this chapter, I tell the story behind this project, focusing on the pivots
and iterations that shaped the path of our research on the economics of electrification
over nearly a decade.
When we started our project, access to electricity was widely seen as a major
driver of economic development, just as it remains today. Then-United Nations
Secretary General Ban Ki Moon famously referred to it as the “golden thread”
connecting economic growth, social equity, and an environment where people
could thrive. Supporting this outlook was the well-known, near-perfect correlation
between electricity consumption and GDP per capita, which is shown in Fig. 5.1.
The academic literature proposed many plausible channels through which electricity access could improve lives. Electric lighting, for instance, could extend
the workday, increasing labor supply and income. Since lighting would also give
children more time to do their homework, educational attainment might even
improve. Some pointed out the potential issues with rural electrification programs
as well. In a review of the history of electrification in sub-Saharan Africa, Bernard
(2012) emphasized the limited productive uses of electricity that had often been
For the full results of this study, see Lee et al. (2016a), and Lee, Miguel, and Wolfram (2016b,
2020a, b). I am grateful to Shipra Karan for excellent research assistance in preparing this chapter.
All errors are my own.
K. Lee ()
Chief Research and Evaluation Officer, The Pharo Foundation, Nairobi, Kenya
e-mail: klee@pharofoundation.org
© The Author(s) 2023
T. Madon et al. (eds.), Introduction to Development Engineering,
https://doi.org/10.1007/978-3-030-86065-3_5
101
102
K. Lee
Fig. 5.1 The positive correlation between electricity consumption and GDP per capita
Notes: Both variables are presented on a logarithmic scale. 2014 data obtained from the World
Bank DataBank Reprinted from Lee et al. (2020b)
observed across rural Africa. Although people seemed to use electricity for lighting
and communications, they were less likely to use it for agriculture, handicrafts,
and other activities that could be profitable. Khandker et al. (2014) proposed an
additional issue that the gains from rural electrification could be much greater for
wealthier households, which could exacerbate economic inequalities.
At the time, over a billion people still lacked access to electricity. The question
of how governments could best expand access to power remained front and center.
Moreover, developing countries were expected to drive a considerable amount of
growth in global energy consumption (Wolfram et al., 2012). As a result, expanding
access in these countries using conventional fossil fuel technologies would certainly
accelerate global warming. The development challenge was clear: In countries
with high rates of energy poverty, how could electricity access be expanded while
mitigating the consequences on the global environment?
In the spring of 2012, UC Berkeley’s Development Impact Lab brought together
a team of economists and engineers to work on this problem.1 The basic goal of
the collaboration was to improve the design of the solar microgrid technologies
1 The initial team included principal investigators Eric Brewer (Electrical Engineering and
Computer Science), Edward Miguel (Economics), and Catherine Wolfram (Business); researchers
Carson Christiano (Center for Effective Global Action), Matthew Podolsky (Technology and
Infrastructure for Emerging Regions), and Francis Meyo (Innovations for Poverty Action);
and graduate students Javier Rosa (Electrical Engineering and Computer Science) and myself
(Agricultural and Resource Economics).
5 Expanding Access to Electricity in Kenya
103
that were being developed for poor countries. By bringing together engineers
and economists, the iterative process of engineering design could be merged with
microeconomic survey data and evidence obtained using the randomized control
trial (RCT) approach that had become widespread in development economics. We
believed the results of such a collaboration could inform the design of technologies
and public policies in unique ways.
A couple aspects of the partnership generated a great deal of excitement. First,
the engineers had been working with start-up companies to design solar-powered
microgrids that featured novel, prepaid, smart metering technologies. These devices
offered a trove of high-frequency, electricity usage data. We thought about using
these data to predict the kinds of appliances people were using in their homes.
Combined with data collected through household surveys, we could perhaps unlock
the precise mechanisms through which electrification improved well-being. And in
places where electricity theft was an issue, we thought about measuring the impacts
of the smart metering technologies on monitoring and enforcement. There were
many possibilities for data science.
One of the start-up companies working on this technology was based nearby, in
Oakland. They had just built a pilot microgrid in Kenya and were looking to scale
up. After a series of meetings, we agreed to explore measuring the impacts of their
solar microgrids in an RCT. Kenya was a good fit, since it was a place where the
economists had extensive prior field experience. From the company’s perspective,
an independent team documenting the beneficial impacts of their product could be
useful in their public communications and marketing efforts, as well as in their
search for venture capital funds to propel their rapid expansion across Africa. Of
course, if they partnered with us, our research grant would pay for (or at least
subsidize) the cost of some of their microgrid installations.
Second, from a research standpoint, we were excited about measuring the
causal impacts of electrification in an experimental setting. Until then, the applied
microeconomics literature covering this topic was limited. Nearly all of the existing
work was nonexperimental and tended to rely on administrative or observational
data, which made it a challenge to distinguish causal effects from correlations. In
any situation, one could imagine a host of unobserved factors that could be correlated with someone’s access to electricity (the cause) and the changes they might
experience over time (the possible effects). An exception at the time was Dinkelman
(2011), which showed that rural electrification substantially improved female labor
supply in South Africa. The study had creatively, and quite convincingly, applied
an econometric technique to isolate a causal effect of electrification, using only
administrative data. Thus, in the early days of our study, there was growing scholarly
interest in building upon the evidence base on the impacts of electrification using
ever more rigorous approaches to estimation.
More broadly, it seemed just a matter of time before billions of dollars would
be directed towards electrification programs across the world. In the face of climate
change, solar microgrids had great potential. We thought about how an infrastructure
experiment could yield new benchmarks on the causal effects of electrification. Per-
104
K. Lee
haps these could serve as useful inputs in the large-scale, infrastructure investment
decisions that would surely be made in the future.
This case study chronicles our research timeline and how our views on the
development challenge evolved along the way. Initially, we set out to build solar
microgrids in off-grid villages in Kenya. But instead, we partnered with the Kenyan
government and connected hundreds of randomly selected rural households to
the national grid for the first time. We encountered a number of implementation
challenges, many of which played a role in shaping our eventual conclusions.
As it turned out, it was relatively expensive to build electricity network lines
to rural homes. And around 3 years later, we had found no evidence indicating
that household access to the grid had meaningfully changed a set of pre-defined
economic and noneconomic outcomes. The project spurred a number of follow-up
projects, which are still ongoing.
The bulk of our project was carried out between 2012 and 2017. Over this period,
major policies would be introduced to accelerate the rural electrification of Kenya.
In certain parts below, I bring up interactions we had with donors and policymakers
at various points in time. I share these stories for a few reasons. First, I think these
meetings imparted on us a number of timely perspectives that helped guide and
refine our research focus. Second, I think our experience in Kenya offers an example
of how the slow and deliberate process of academic research can sometimes be
outpaced by rapidly shifting policy priorities in developing countries. Finally, and
on a more personal note, I think the linkages between our research project and the
wider policy environment in Kenya encapsulate what makes this line of work so
exciting, and I hope some of this comes across in this chapter.
The remainder of this case study is organized as follows. The next section
discusses the technology choices available to policymakers at the start of our project.
Then, in the following sections, I describe the important decisions we needed to
make to set up an experiment; the things we learned that influenced our research
questions and intervention design; and how we made sense of our findings given the
evolving policy context. The final section offers a view on some of the important
research questions for the future.
2 Innovations in the Technology Landscape
There are several ways to address the development challenge of expanding access to
electricity. Traditionally, governments have addressed this challenge by investing in
expansions of their national grids. All developed countries have reached universal
rural electrification in this way. The issue moving forward, of course, is the extent
to which the grid can supply electricity from nonfossil fuel sources of energy.
The 2000s introduced various improvements to an array of decentralized,
renewable energy alternatives, including solar lanterns, solar home systems, and
renewable energy microgrids. There was hope that these novel technologies could
allow people living in the Global South to gain access to electricity, while
5 Expanding Access to Electricity in Kenya
105
minimizing the negative consequences on the environment. Across sub-Saharan
Africa, the rapid adoption of mobile phones had made landline telecommunications
infrastructure obsolete. By 2012, many entrepreneurs, donors, and observers were
talking about how this improved set of decentralized, renewable energy solutions
would allow off-grid households to similarly leapfrog the grid.
A couple trends seemed to be driving this growing level of enthusiasm. First,
it was becoming much cheaper to manufacture these products. With each passing
year, there were increases in appliance efficiencies, reductions in the cost of
photovoltaics, and improvements in battery capabilities. By around 2012, off-grid
solar began to be seen as a potential alternative to the grid. Second, in countries like
Kenya, rapid growth in mobile phone usage had been accompanied with widespread
adoption of mobile money platforms like M-PESA. Around 2010, new start-up
companies like M-KOPA began integrating pay-as-you-go technologies directly into
their solar lanterns and solar home systems. Poor, rural consumers could now buy
these products on credit, unlocking each day of usage with a small payment sent
over their mobile phones. This was seen as a gamechanger in rural settings, where
credit constraints had often limited the take-up of promising, new technologies.2
2.1 Prepaid, Smart Metered Solar Microgrids
Microgrids, which connect small networks of users to a centralized and stand-alone
source of power generation and storage, were also generating substantial interest.
Microgrids could provide longer hours of service and higher capacities than solar
lanterns and solar home systems, making it feasible to use power more productively.
Furthermore, they could be powered with clean energy sources, like solar, wind,
and hydro. Despite their potential, microgrids had not yet been deployed at scale
in developing countries. In fact, a number of early microgrid pilot deployments had
completely failed.
For example, in the early 2000s, dozens of microgrids had been set up in
rural villages across Rajasthan, India. The microgrids were built to connect rural
hamlets to a 10-kilowatt capacity solar panel system. After several years, many
of the microgrids had fallen into disrepair. There were a number of reasons why
this happened. For instance, the Rajasthani microgrids, which offered users just
enough electricity to power lighting and small appliances, did not meter households
individually. Instead, each grid would be switched on and off at certain hours of the
day. In return, each user needed to pay a monthly fixed fee. But when certain users
refused to pay, there was no way to terminate their service, leading to a downward
spiral in revenue collection. Making matters worse, the battery banks powering
the microgrids could not withstand the hot and humid environmental conditions
2 See
Lee, Miguel, and Wolfram (2020b) for a discussion of historical rural electrification
initiatives from around the world, as well as the current technology landscape.
106
K. Lee
of Rajasthan. When the batteries failed, the lack of payment enforcement meant
there was little to no cash reserve available to cover the cost of a replacement. The
primary culprit for the failure of the Rajasthani microgrids was not some electrical
engineering issue, but rather a misalignment of economic incentives. Simply put,
the early microgrids were in need of a better business model.3
In Kenya, our microgrid partner had taken advantage of the technological trends
to develop a next-generation, village-scale solar microgrid that allowed consumers
to pay-as-they-go using their mobile phones. They marketed their technology as
one that could empower consumers to make real-time decisions about their energy
consumption, while alleviating credit constraints. Importantly, each user had their
own smart meter that would send information about power consumption and credit
balances over text messages. Depending on how each system was sized, they
promised power that would be more reliable than the national grid.
In 2012, official estimates of the national household electrification rate in Kenya
ranged from 18 to 26%.4 We were intrigued by the potential market for this
microgrid. And as our discussions with our partner progressed, it became easy for
us to imagine the thousands of off-grid villages across Kenya where this technology
would thrive. We took it for granted that the people living in these off-grid villages
would be receptive to this novel technology. Soon, we would discover that we were
wrong.
3 Iterative Learning: A Major Pivot
In the summer of 2012, we traveled to Western Kenya to scope out a potential
research project. The experiment we envisioned was straightforward. First, we
would identify a hundred or so off-grid villages, randomly assigning half of them
into a treatment group. In these villages, our microgrid partner, with contributions
from the engineers on our team, would set up their prepaid, smart metered
microgrids. As an additional experimental feature, we thought about varying the
price of each connection in order to estimate a demand curve for electricity
access.5 Later on, a team of enumerators would administer detailed, household-level
microeconomic surveys. In theory, comparing survey data between households in
3 This account is based on my August 2012 interviews with former microgrid operators and
individuals living in several rural communities in Rajasthan, India, where these early microgrids
had been built.
4 In 2012, the World Bank Databank reported that Kenya’s electrification rate was 18%. That year,
Government of Kenya reported that the electrification rate was 26%. The information on the World
Bank Databank has since been updated. Currently, the 2012 and 2013 reported electrification rates
are much higher, at 40.8 and 43.0%, respectively.
5 In economics, the demand curve depicts the relationship between price and quantity. When
compared against a supply curve, policymakers can assess the welfare implications of different
policy decisions.
5 Expanding Access to Electricity in Kenya
107
the treatment communities and their counterparts in the control communities would
yield unbiased, causal estimates of the impacts of electrification.
Our microgrid partner suggested that we find communities with a couple important features. One, we needed villages with a high density of potential users. The
microgrids would be sized to supply power to roughly 50 customers. If customers
were clustered close together, the line losses on the microgrid’s low-voltage network
would be minimized. Two, we needed villages with many unelectrified businesses
since these were likely to use more electricity, thus increasing revenue to our partner.
From our standpoint, we also wanted villages that were far away from existing
national grid infrastructure. The last thing we wanted was to invest our resources
and time in villages that would soon receive grid electricity from Kenya Power, the
national electricity distribution utility.
This was no easy task. After visiting a local Kenya Power office in the Western
county of Busia, we learned that Kenya Power had yet to geotag the locations of
its infrastructure, meaning there was limited administrative data that could help us
locate a sample of off-grid villages. In lieu of actual data, we were given permission
to photograph the aging infrastructure maps that were displayed on the walls. In
addition, we were provided with an assortment of tips on where we could find the
distant yet densely populated communities that would meet our criteria.
3.1 On-grid, Off-Grid, or Under-Grid?
As we drove across Western Kenya searching for rural, off-grid villages, we noticed
something peculiar. Although the vast majority of rural homesteads lacked access
to electricity, nearly every off-grid village we visited seemed to have a power line
running nearby. Rather than being “off-grid,” much of what we observed appeared
to be underneath the grid.
Why were so many rural households left unconnected to these electricity lines?
We learned that a major barrier was the high cost of connection. In fact, during the
decade leading up to the start of our study, any household in Kenya within 600 m of
a low-voltage distribution transformer could apply for an electricity connection at a
fixed price of 35,000 Kenya shillings (KES), which was worth roughly $398 USD at
the time. This seemed far too expensive in Kenya, where annual per capita income
was below $1,000 for most rural households. At the same time, the cost to the utility
of supplying a single connection in an area with grid coverage was estimated to be
several multiples higher.
Our trip to Kenya that summer was not much of a success. Instead of finding a
hundred villages, we found just a handful. However, the experience triggered a shift
in the way we viewed the development challenge. Until then, we had been thinking
about electricity access as a binary variable. Households were either on-grid or offgrid. What naturally followed was an assumption that off-grid households were too
far away to connect to a national electricity network and therefore required novel
solutions. We wondered whether this assumption had played a role in the growing
108
K. Lee
enthusiasm among engineers, entrepreneurs, and donors for the new generation
of off-grid, distributed energy solutions, most of which were being designed and
manufactured outside of the Global South. The solar microgrids that were being
developed in Oakland, for instance, had essentially been designed with remote users
and communities in Africa in mind.
Suddenly, it seemed plausible that a substantial share of the 600 million people
lacking access to electricity were not off-grid but were instead “under-grid,” which
we defined as being close enough to connect to a low-voltage line at a relatively
low cost. This distinction seemed important because the policy implications for offgrid and under-grid communities were quite different. In under-grid communities, it
might be preferable to design policies that could leverage existing infrastructure, as
opposed to promoting an independent solution like a microgrid.
The argument against grid power seemed to hinge on the extent to which the
grid delivered dirty, fossil fuel power. But across sub-Saharan Africa, installed
generating capacities were still relatively low, and substantial capacity additions
were slated for the future. Importantly, a large share of these additions was expected
to feature nonfossil fuel technologies. In Kenya, where fossil fuels represented about
a third of installed capacity at the time, several major geothermal and wind projects
were already under development. Given the trends, why not focus on expanding
electricity access through a grid that might soon be channeling a higher share of
clean energy?6
3.2 Private Versus Public Infrastructure
Upon our return to Berkeley, we ran into problems agreeing on an acceptable
research design with our microgrid partner. From a research standpoint, we needed
to randomly select the villages where our partner would build their microgrids. In
addition, we required access to all of the data generated by their smart meters; we
needed to publish our findings, regardless of how favorable the conclusion; and of
course, we planned to make all of the data and analysis involved in our work freely
available to public.
All of this is highly undesirable for a start-up company. Our microgrid partner
needed to prove that it had a viable and scalable business model. There was
upside to having the benefits of their technology rigorously and independently
measured and published. But there were obvious downsides to giving up control
over consequential business decisions, like where they could build their microgrids.
We had other differences in opinion as well. For example, some of the communities that met our microgrid partner’s various criteria (e.g., density of structures,
6 See Lee, Miguel, and Wolfram (2016b) for a discussion of whether increases in energy access
should be driven by investments in electric grid infrastructure or small-scale “home solar” systems
(e.g., solar lanterns and solar home systems).
5 Expanding Access to Electricity in Kenya
109
number of small businesses, etc.) looked to be—at least from our perspective—
under grid. And while there may have been good business reasons for building a
private microgrid directly underneath the public grid, this did not make sense to
us. Moreover, to achieve a certain degree of statistical power in our experiment, we
needed our microgrid partner to rapidly scale up its operations. New systems needed
to be built in scores of villages, as soon as possible. But the difficulties we had faced
in locating suitable sites seemed to portend inevitable delays and slow progress.7
We began to consider whether it made more sense to study the economics of
expanding national grid access. After our summer travels, we had no doubt that
Kenya’s future would revolve around its grid. Although the cost of a Kenya Power
connection was exorbitantly high, it was roughly in line with the per household cost
of our microgrid partner’s technology. If we shifted our focus to the grid, we could
design a research study with a similar sample size, without requiring an increase to
our budget.
In early 2013, our collaboration with our microgrid partner began to taper off.
Fortunately, we had begun a promising round of discussions with Kenya’s Rural
Electrification Authority (REA). Created in 2007, REA was a government agency
that had been established to accelerate the pace of rural electrification. Using
funds from the central government, international development agencies, and a small
tax on every Kenya Power electricity bill, REA had been responsible for rapidly
electrifying the majority of the country’s rural secondary schools, markets, and
health clinics. It was the single reason why so many of the rural households we
had observed that previous summer looked to be under-grid.
We proposed an experiment to REA to randomly connect households to the
grid and then experimentally measure the impacts of electricity access on a variety
of social and economic outcomes. They were interested in the idea. As a public
infrastructure agency, REA could adopt a longer-term investment horizon, meaning
they did not face the same pressures as a start-up company. Moreover, our project fit
with their basic mandate to achieve universal rural electrification. In other words,
there was a clear path towards justifying the incremental costs that would be
incurred in order to participate in our research project. By the summer of 2013,
the CEO of REA had agreed in principle to explore the viability of a randomized
experiment.
4 Randomizing Access to Grid Electricity
Infrastructure investments tend to involve high fixed costs, relatively low marginal
costs, and long investment horizons. As a result, they tend to be owned and regulated
7 This turned out to be somewhat accurate. By 2017, roughly five years after we first began our
partnership discussions, our microgrid partner was operating just four systems, providing power to
300 households in total.
110
K. Lee
by the government. As mentioned earlier, it is difficult to measure the causal effects
of electrification. There are a number of factors that tend to be correlated with
the presence of electricity infrastructure (like the placement of roads), and many
of these factors could also contribute to changes in key economic outcomes, like
employment. In addition, it is only natural that governments would target expensive
infrastructure investments towards regions predicted to enjoy the greatest rates of
economic growth, or areas that were preferable to the ruling government party and
were thus in line to reap a number of other rewards. In these situations, there is a
problem of omitted variable bias (sometimes called confounding or selection bias).
Whatever we may believe to be the effects of electrification may actually be caused
by unobserved variables. If these are not addressed econometrically, the effects of
electrification can be overemphasized.
At the outset of our project, rigorous microeconomic evidence in this area was
limited. Two papers that caught our attention included the Dinkelman (2011) paper
mentioned above, as well as Lipscomb et al. (2013), which estimates the long-term
impacts of electrification in Brazil. Both studies relied on administrative data and
addressed the issue of omitted variable bias using a similar econometric approach.8
From a research standpoint, we thought about how a field experiment could remove
concerns about omitted variable bias entirely, yielding a new set of causal estimates
that developing country policymakers could use as they weighed the relative costs
and benefits of investments in health, education, energy, and other areas.
How could we randomly assign access to electricity, without forcing some people
to connect to the grid and others to remain in the dark? In a methodological
note that was greatly influential for our project, Bernard and Torero (2011)
offered a solution: By providing treatment households with a subsidized electricity
connection, we could randomly encourage them to connect to the grid. If many
people responded to these offers, there would be enough variation in electricity
access to measure impacts. On top of that, by offering different subsidy amounts to
different households, we could randomly assign the effective price of a connection,
allowing us to trace out a demand curve.9
4.1 Conducting a Census Across “Transformer Communities”
Now that we had an outline of our experimental intervention in place, several
additional decisions needed to be made. The first set of choices involved defining a
sample and a unit of randomization. We needed to consider the potential economic
8 See Lee, Miguel, and Wolfram (2020b) for a discussion of the different econometric approaches
that have been used to estimate the impacts of electrification
9 In our final experiment, we randomly assigned effective prices 0, 15,000, and 25,000 KES to
the treatment households, while the control households had the option to connect at the prevailing
price of 35,000 KES.
5 Expanding Access to Electricity in Kenya
111
spillovers of our treatment. For example, a family living in an electrified household
could easily share the benefits of their connection with some of their neighbors. In
this case, a direct comparison of living standards between the treated households and
neighboring control households would underestimate the size of impacts. To address
this issue, we decided to assign our treatment at the community level. This choice
would have the additional benefit of avoiding fairness concerns among neighbors,
given the high monetary value of the subsidized connection offers.
We also needed to avoid situations in which households applied for power but
were rejected for some technical reason, like being too far away from a transformer.
So instead of defining communities along the lines of village boundaries—which
is what most field experiments randomizing at a community level tended to
do—we defined them as “transformer communities,” encompassing the universe
of structures that were within 600 meters of a central, low-voltage distribution
transformer. This, of course, had the added bonus of being consistent with Kenya
Power’s existing fixed price connection policy.
Working with our partners at REA, we randomly drew a sample of 150 transformers, located at markets, secondary schools, and health clinics, spread across in
the counties of Busia and Siaya in Western Kenya. Some of the transformers had
been installed 4 to 5 years earlier, so they were not necessarily new.
The next step was to establish a sampling frame, or census, of all of the
unconnected and “under-grid” households that could potentially be enrolled into
our study. So, over the fall of 2013, a team of enumerators scouted the territory
surrounding each transformer on foot, documenting the GPS location, some basic
observable features (like the quality of roofs and walls), and the electrification status
of every structure they were able to find. A number of iterations were required
to establish a survey protocol that could produce maximum coverage of the area
inside each transformer community. Examples of various transformer communities
are provided in Fig. 5.2.
By December 2013, our field staff had geotagged over 20,000 structures,
including households, enterprises, public facilities, transportation hubs, and other
types of buildings. The data showed that electrification rates were extremely low,
averaging just 5% for households and 22% for businesses. In addition, half of the
unconnected households we observed were estimated to be within 200 m of a lowvoltage power line.10
At that point, REA estimated it had connected 90% of the country’s public
facilities to the grid. In the highly populated regions of Central and Western Kenya,
it was believed that the vast majority of households were within walking distance
of multiple public facilities. If true, then the under-grid pattern we documented
in Western Kenya could very well extend across vast swathes of the country. For
policymakers, connecting people to a network that was already in place seemed like
low-hanging fruit on the path towards universal electrification.
10 See Lee et al. (2016a) for a discussion of “under-grid” households and the implications for
electrification policies.
112
K. Lee
Fig. 5.2 Examples of transformer communities in Western Kenya
Notes: The white circle labeled “T” in the center of each transformer community identifies the
location of the REA transformer. The larger white outline demarcates the 600-m radius boundary.
Green circles represent unconnected households; purple squares represent unconnected businesses;
and blue triangles represent unconnected public facilities. Yellow circles, squares, and triangles
indicate households, businesses, and public facilities with visible electricity connections, respectively. Household markers are scaled by household size, with the largest indicating households with
more than 10 members and the smallest indicating single-member households. In each community,
roughly 15 households were randomly sampled and enrolled into the study. The average density of
a transformer community is 84.7 households per community, and the average minimum distance
between buildings (i.e., households, businesses, or public facilities) is 52.8 m. Reprinted from Lee
et al. (2016a, b)
We reached out to a number of organizations that were involved in rural
electrification efforts across Africa. It was an exciting moment in time. Earlier
that year, President Obama had launched Power Africa, a bold new initiative that
targeted, as one of its initial goals, 20 million new electricity connections in six
African countries including Kenya. We presented our findings to the coordinator
of Power Africa, who was based in Nairobi at the time. Perhaps our under-grid
narrative could be useful in shaping their overall strategy. They did not appear that
interested in our work. Later, we learned that Power Africa’s strategy to meeting its
short-term connection targets would be to support the distribution of decentralized
solar technologies (mainly solar lanterns and solar home systems) through its
Beyond the Grid initiative, as shown in Fig. 5.3.
We also presented our findings to the energy leads at the World Bank. From these
interactions, we learned that the World Bank was in the process of planning a major
5 Expanding Access to Electricity in Kenya
113
Fig. 5.3 How USAID Power Africa will meet its target of 60 million new connections
Notes: Based on USAID Power Africa Annual Reports
commitment to modernize Kenya’s electricity system. Over the following months,
we continued meeting with this team to share updates. As we later learned, this
commitment from the World Bank would enable the Kenyan government to launch
its transformative Last Mile Connectivity Project (LMCP), just a couple years later.
The initiative, which is briefly mentioned later in the chapter, has already gone on
to connect millions of people to the grid.
4.2 Binding Our Hands with a Pre-analysis Plan
In all of our discussions with potential donors, policymakers, and partners, there
was always a great deal of interest in discussing the impacts of rural electrification.
Everyone seemed to hold their own unique perspectives and predictions on what
would happen when rural households accessed electricity for the first time. Existing
academic studies tended to focus on the same major outcomes, like employment
and educational attainment. This was in part due to their reliance on administrative
records, as well as general household surveys, neither of which placed a large
emphasis on energy outcomes, like the types of electrical appliances that people
owned or wished to own. In our experiment, we would be free to draft our own
survey instruments, meaning we could measure anything we wanted. In sum, this
was a situation in which the conclusions of our experiment could seem arbitrary
since they depended on the outcomes we chose to emphasize. With so many
possibilities, how could we best assess the overall impacts of our electrification
program?
114
K. Lee
There was also another issue. With REA, we were collaborating with individuals
who had dedicated their entire working lives to expanding rural access to power.
Like our former microgrid partner, there was upside to having the benefits of their
work rigorously and independently evaluated. Yet in our interactions with REA
officials, we sensed a high degree of confidence that our study would point to
massive, positive effects. Furthermore, as a government agency, we could imagine
how there may have been underlying political pressures or incentives to report a
particular result. It was, after all, hard for any of us to picture rural life remaining
the same after the introduction of grid electricity. But what if we were wrong?
Around that time, the use of pre-analysis plans in development economics was
becoming increasingly common. The basic steps we followed were straightforward.
Prior to accessing data, we wrote down our hypotheses; the econometric regression
equations we planned to estimate; and the set of key outcomes we would consider.
In our initial plan, which was filed before we analyzed the first round of followup survey data, we identified 77 outcomes of interest overall, across 10 broad
families including energy consumption, productivity, education, and others. We
then narrowed this list down to the 10 primary outcomes, shown in Table 5.1, that
would guide our conclusions. We discussed these outcomes with our government
partners, which allowed us to manage their expectations. Finally, the plan was
registered online in order to be made accessible to future readers.11 The pre-analysis
plan disciplined our interpretations of impacts, limiting the scope for data mining
or a biased presentation of results. As we would later find, our pre-analysis plan
increased the space we had to draw our conclusions and made it easier to defend our
findings, given the lack of impacts we eventually found.
5 Iterative Learning: Unexpected Field Challenges
In December 2013, we signed a Memorandum of Understanding (MOU) with
REA’s Chief Executive Officer. REA agreed to honor the subsidized connection
prices in our experiment, giving us the green light to proceed with the main
component of our project. The MOU, which took 6 months to sign, was the result
of countless in-person visits to the REA headquarters in Nairobi. At each visit, we
would deliver a presentation to the CEO and other key managers at REA, updating
them on what we were learning from our activities in Western Kenya and slowly
building up our relationships with key individuals. At times, we would need to repitch the basic objectives of our experiment. At others, REA would provide helpful
feedback on the information that would be most useful to them in our research.
In many of these meetings, a sticking point was the cost of the connection.
We agreed to use a substantial amount of our research funds to cover the cost
11 The pre-analysis plans for this project can be accessed at https://www.socialscienceregistry.org/
trials/350
5 Expanding Access to Electricity in Kenya
115
Table 5.1 Defining ten primary outcomes of interest in a pre-analysis plan
ID
P.1
Outcome
Grid connected
Unit
HH
Type
Indicator
P.2
Grid electricity
spending
HH
Total
P.3
Employed or
own business –
Household
Total hours
worked
HH
Proportion
Resp.
Total
P.5
Total asset value
HH
Estimated value
P.6
Annual
consumption
Recent
symptoms index
HH
Value
Resp.
Index
P.8
Life satisfaction
Resp.
Scale
P.9
Average test
score
Political and
social awareness
index
Child
Z-score
Resp.
Index
P.4
P.7
P.10
Description
Indicator for main household
connection
Estimated prepaid top-up last
month or amount of last postpaid
bill
Proportion of household members
(18 and over) currently employed
or running their own business
Total hours worked in agriculture,
self-employment, employment,
and household chores in last 7
days
Estimated value of savings,
livestock, electrical appliances,
and other assets
Estimated value of annual
consumption of 23 goods
Index of symptoms experienced
by the respondent over the past 4
weeks
Life satisfaction based on a scale
of 1 to 10
Average of English reading test
result and Math test result
Index capturing the extent to
which the respondent correctly
answered a series of questions
about current events
Ref.
1.1
1.7
4.5
4.11
5.6
6.2
7.3
7.8
8.3
9.4
Notes: Following Casey et al. (2012), we registered pre-analysis plans for the experiment which are
available at http://www.socialscienceregistry.org/trials/350. This table summarizes the ten primary
outcomes of interest for analysis using the first two rounds of follow-up survey data
of subsidies, which guaranteed that REA would receive no less than 35,000 KES
per connection. In turn, REA would need to cover the difference between the
cost of construction and the 35,000 KES raised from each accepted offer. The
uncertainty came from the wide variance in the cost of supplying each connection,
since this depended on factors like the location, density, and terrain conditions of
each community. Although there were economies of scale in connecting multiple
households at the same time, it was difficult to predict how many households in each
community would accept the offers. Given the many fixed commitments in REA’s
organizational budget, there were understandable concerns about the total cost of
what many at REA viewed as just an academic exercise (which was not inaccurate).
Over time, we established a stronger relationship with our government partners.
Crucially, agreed on a compromise. Instead of offering a subsidized price to any
unconnected household within the boundaries of a transformer community, we
116
K. Lee
agreed to limit our sample to the households that were no more than 400 m away
from a low-voltage line, which worked out to 84.9% of all of the households
recorded in our census. According to REA’s estimates, this would substantially
reduce the construction costs, improving the financial viability of the project.
Our experiment would require contributions from a number of individuals
working out of REA’s offices in Nairobi and Kisumu at various levels of the
organizational hierarchy, each facing a different set of incentives. Given the innate
challenges of working in Western Kenya (e.g., travel distances, road conditions,
etc.), there were many potential bottlenecks that could delay our progress. Although
our MOU was not legally binding, it proved to be surprisingly effective as a
document that we could point to in the face of an unanticipated challenge. To our
luck, many of our interactions with REA would be facilitated by an ambitious,
data-driven, and public-minded bureaucrat with whom we would work closely. This
person not only took a keen interest in seeing the academic results of our study
through but also proved instrumental in clearing several administrative roadblocks
we faced. His involvement ensured that much of our work would be executed
smoothly. Still, we encountered a number of unexpected problems, some of which
required us to revise our intervention protocols and others that simply stalled our
progress. Throughout the process, we carefully documented each of these issues,
which helped us make sense of our eventual results.
5.1 Connecting Households in Areas with No Electricians
In the spring of 2014, our team of enumerators made rapid progress enrolling
households into our study and collecting baseline social and economic data.
Meanwhile, we worked out the details of our randomized pricing intervention,
which was scheduled to commence that summer. The process was as follows. After
completing the baseline survey, treatment households would receive a letter from
REA describing a time-limited opportunity to connect to the grid at a subsidized
price, which was randomly assigned at the transformer community level. At the
end of the offer period, our staff would verify payments and provide REA with the
list of households that needed to be connected. REA would then dispatch designers
to each community to sketch out the low-voltage network that needed to be built.
Based on these drawings, such as the one shown in Fig. 5.4, REA would earmark the
appropriate amount of materials, including wooden poles, low-voltage feeder lines,
and service drop lines. Next, a construction team would arrive on site to connect
households. Each household would then register an account with Kenya Power in
order to receive a prepaid meter. Once complete, households could use power.
There was one unanticipated problem. Although REA could attach a service line
to a building, households would still need outlets for plugging in their appliances,
sockets for light bulbs, fuses, and other internal wiring. But in rural areas with low
electrification rates, there were few electricians.
5 Expanding Access to Electricity in Kenya
117
Fig. 5.4 Example of a REA design drawing and the electrification of a treatment household
Notes: After receiving payment, REA designers visited each treatment community to design the
local low-voltage network. The designs were then used to estimate the required materials and
determine a budgeted estimates of the total construction cost. Materials (e.g., poles, electricity line,
service cables) represented 65.9% of total installation costs. Reprinted from Lee et al. (2020a)
118
K. Lee
To solve this problem, we located a manufacturer in Nairobi that could produce
a customized “ready-board,” an all-in-one household wiring solution. Each readyboard, which is shown in Fig. 5.5, featured a single light bulb socket, two power
outlets, and two miniature circuit breakers. The ready-board was designed to be
installed on the indoor side of an exterior wall, so that an outdoor service line could
pass through a hole in the wall and connect directly into the back of the ready-board.
The ready-boards were designed to be modular as well, thus providing households
with the option of installing additional boards as their consumption needs grew. As
it turned out, the wiring issue was a relatively easy challenge to address. However, it
illustrated how the success of a particular technology in a developing country could
be hindered by the lack of a key supporting service.
5.2 Major Supply-Side Issues: Blackouts and Construction
Delays
Blackouts were another issue. Most of the time, the blackouts in Western Kenya
would last just minutes or a few hours. But sometimes, a blackout would cut
power from an entire community for months. In 2014, as REA carried out its
connection work, we began noting the frequency, duration, and primary reason
for all of the long-term blackouts experienced in our sample. In total, 19% of
the transformers in our sample experienced at least one long-term blackout, which
lasted 4 months, on average. The transformers seemed prone to burnouts, and other
technical failures caused by severe weather conditions. In some cases, Kenya Power
would temporarily relocate a transformer to another community, unannounced.
There were also reports of vandalism, as well as theft due to the perceived value
of the copper and oil components inside the transformers.
Overall, it took an extraordinarily long time to connect households in our
experiment. The first household was metered in September 2014, just a couple
months after it had completed payment. The last household was metered over a
year later in October 2015. The average connection time was seven months.
Major delays arose at each stage of the process, as shown in Fig. 5.6. The
longest average delays occurred during the design phase (57 days) and the metering
phase (68 days). The design delays were caused in part by a sudden government
announcement in 2015 to provide free laptops to all Grade 1 students, nationwide.
A presidential election was on the horizon, and the incumbent would once again be
running for office. Since only half of Kenya’s primary schools were electrified at the
time, REA suddenly found itself under pressure to connect more primary schools.
As a result, there were less REA designers available to work on less-prioritized
projects, like ours.
The metering delays occurred because of unexpected issues at Kenya Power.
There were lost meter applications, shortages in prepaid meters, competing priorities
for Kenya Power staff, and in some cases, expectations that bribes would be paid.
5 Expanding Access to Electricity in Kenya
119
Fig. 5.5 Umeme Rahisi ready-board solution designed by Power Technics
Notes: Treatment households received an opportunity to install a certified household wiring
solution in their homes at no additional cost. Each ready-board, valued at roughly $34 per unit,
featured a single light bulb socket, two power outlets, and two miniature circuit breakers. The unit
is first mounted onto a wall and the electricity service line is directly connected to the back. The
hardware was designed and produced by Power Technics, an electronic supplies manufacturer in
Nairobi. Reprinted from Lee et al. (2020a)
120
K. Lee
Fig. 5.6 Timeline of the rural electrification process
Notes: Panel A summarizes the rural electrification process from the standpoint of the household,
divided into three key phases. Panel B summarizes the process from the standpoint of the supplier,
divided into four key phases. The numbers to the right of each bar report the average number of
days required to complete each phase (standard deviations in parantheses). Households were first
given 56 days (8 weeks) to complete their payments. Afterwards, it took on average 212 days (7
months) for households to be metered and electricity to flow to the household. Reprinted from Lee
et al. (2020a)
Other delays were caused by a general shortage in construction materials at REA
storehouses. Heavy rains made roads impassable in some communities. Difficulties
obtaining wayleaves, which permit electricity lines to pass through private property,
required drawings to be reworked, additional trips to the storehouse, and further
negotiations with contractors. In some cases, households that had initially declined
the ready-board changed their minds; in an unfortunate case lightning struck,
damaging a household’s electrical equipment; and so on.
Of course, these kinds of problems are not unusual in developing country
settings. As researchers, there was little we could do to address what were primarily
supply-side issues. So, we instructed our project staff to send weekly and persistent
reminders to REA and Kenya Power, and we took notes. It’s possible that without
these reminders, the delays could have been much worse.
5 Expanding Access to Electricity in Kenya
121
5.3 Discovering Cost Data and Investigating Potential Leakage
Issues
As we strove to better understand the root cause of each delay, we became deeply
familiar with REA’s internal administrative procedures. For instance, we learned
that once the design drawings were complete, the total cost of required materials
was tallied up in an official budgeted cost slip. Similarly, following the construction
work, a final invoiced cost slip was generated and stored in REA’s database. With
REA’s permission, we were able to access and integrate these data into our analysis,
which added an unexpected cost angle to our study.
Essentially, our intervention consisted of bundling electricity connection applications together. As a result, the pricing variation we had introduced at the community
level—in order to estimate a demand curve—had the bonus effect of creating local
construction projects at various scales. With REA’s cost data, we could now trace
out the average and marginal costs at different community coverage levels, allowing
us to study economies of scale. By combining the demand and cost data, we could
assess the social surplus effects of electrification, using the textbook framework of
electricity distribution as a natural monopoly.12
The cost data allowed us to think about another issue. Midway through our
intervention, we began hearing stories that some of the poles had gone missing.
There were rumors that a contractor had appropriated some of the assigned materials
and sold them back to REA’s suppliers. In the cost data, however, the budgeted and
invoiced cost slips reported nearly identical figures. So, to investigate, we asked our
field staff to return to each community to count the number of electricity poles in
the ground and compare these numbers with the budgeted and invoiced cost slips.
As it turned out, more than 20% of the poles were missing in the field.
In economic theory, it can be debated whether this type of leakage is economically harmful. REA’s loss, after all, might be offset by the contractor’s private gain.
However, we learned that using less poles could cause lines to sag, and this not
only lowered service quality but also increased the risk that poles fell over. Thus, it
seemed that leakage could be an important issue affecting the long-run reliability of
the grid and the overall economic returns to grid infrastructure.
5.4 The Gap Between Demand and Costs
By the end of 2014, we had collected enough data to trace out the demand curve and
plot a few points of the cost curve. In our pre-analysis plan, we had recorded our
12 In microeconomics, an industry is a natural monopoly if the production of a particular good
or service by a single firm minimizes cost. The classic microeconomic textbooks often mention
water, fixed line telecommunications, or electric power, all of which require physical distribution
networks, as real-world examples of natural monopolies (see Mankiw, 2011 for an example).
122
K. Lee
Fig. 5.7 Experimental evidence on the demand for and costs of rural electrification
Notes: The experimental demand curve is combined with the population-weighted average total
cost per connection (ATC) curve corresponding to the predicted cost of connecting various
population shares, based on the nonlinear estimation of ATC = b0 /M + b1 + b2 M. Each
point represents the community-level, budgeted estimate of ATC at a specific level of coverage.
Reprinted from Lee et al. (2020a)
own prior estimates of demand at various prices. In addition, REA had shared an
internal memo with us that included the government’s own predictions of demand.
By comparing our experimental estimates with these two sets of priors, we could
conclude that demand was much lower than expected. Our cost curve, which was
incomplete at the time, appeared to show substantial economies of scale from
connecting numerous households at the same time. The average cost of a connection
in our experiment was around $1,200. However, we did not yet have the data to
know that the economies of scale would quickly level off, and that at full community
coverage, the average connection cost would still be two to three times higher than
the status quo connection price of 35,000 KES. The final demand and costs curves
are shown in Fig. 5.7.13
13 See
Lee, Miguel, and Wolfram (2020a) for a full description of the experimental results.
5 Expanding Access to Electricity in Kenya
123
From our perspective, the gap between demand and cost, which we referred to
as social surplus, was important. In economics, the area under our demand curve
could be interpreted as the present value of all future benefits accruing from grid
access over the population. If the demand curve was much lower than the supply
curve, then this would suggest that the benefits of rural household grid access were
not high enough to offset the immediate cost of supply.
We needed time to process and debate these early results. But in March 2015,
we were encouraged to present our findings to a number of audiences in Nairobi,
including the recently assembled National Electrification Strategy committee. The
committee featured many familiar faces from REA and Kenya Power, as well as
representatives from various government departments. The purpose of the committee was to determine the specific details of the government’s rural electrification
plan, which included the work that would be supported by the World Bank. The
response to our presentation was positive. Soon afterwards, a committee member
shared with us a draft version of the national electrification strategy. The document
had been written around that time, with key contributions from our collaborators at
REA. It estimated the economies of scale from a mass connection program would
yield cost savings of 30%, in line with the early results we had shared with our
partners. It also recommended a reduction in the connection price from 35,000 to
15,000 KES, one of the experimental price points in our study. A couple months
later, President Kenyatta announced the Last Mile Connectivity Project (LMCP),
a $364 million program funded by the World Bank and the African Development
Bank. The connection price would soon be reduced for everyone.
In July 2015, we were invited to present our findings at a workshop organized
to launch the World Bank’s $458 million commitment to modernizing Kenya’s
electricity system, which would provide support for the LMCP, among other
investments. We pointed out the large and potentially problematic gap between
demand and cost, as well as some of the field challenges described above. The
response was again positive. Then, later in the year, additional details of the LMCP
were released to the public. It was made clear that unlike in the past, clusters
of potential customers would now be connected to the grid at the same time. In
addition, all customers requiring internal wiring would be provided with a free
ready-board.
In retrospect, 2015 introduced momentous changes to Kenya’s rural electrification outlook. And given the role of REA in drafting the national electrification
strategy—as well as our frequent presentations to Kenya Power, the World Bank,
and others—it is possible that our research influenced some of the assumptions and
decisions that were being made at the time. We will never know for sure, but the
timing of our discussions and the later policy decisions seems consistent with our
research exerting at least some level of influence during the key moments.
That said, in 2015, we could not answer any questions about the economic
impacts of our intervention. Due to the connection delays, which had been ongoing,
follow-up survey data remained months away. Moreover, we had not yet agreed on
a satisfying way to interpret the gap between demand and supply—an explanation
that factored in the potential budget and credit constraints at the consumer level,
124
K. Lee
as well as the organizational performance issues we were observing in the field.
And with each passing month, it began to feel as though our research progress was
falling more and more behind. We had been there in Kenya at the start of all of
these consequential policy choices. But by the time we had our survey evidence on
impacts a couple years later, the national electrification plan was set and the LMCP
was well under way.
6 No Meaningful and Statistically Significant Impacts
By November 2016, we had completed our first round of follow-up household
surveys, which took place 16 months after connection on average. With a preanalysis plan in place, it was fairly easy to calculate the impacts of our intervention
on our primary set of outcomes. As expected, energy consumption had increased
for treated households, but only by a miniscule amount. People had not really
acquired any new appliances either. In fact, there were no detectable effects on
assets, consumption, health, student test scores, and a host of other outcomes. After
nearly a year and a half, we had no evidence of any meaningful and statistically
significant impacts of electricity access, a result that differed from much of the
earlier literature on the topic. Although this was perhaps fascinating from a research
standpoint, it was a result that also felt depressing and demoralizing on a human
level.
In the spring of 2017, we met with the Principal Secretary of the Ministry of
Energy and Petroleum in Nairobi, as well as the heads of Kenya Power, REA,
and the other parastatals comprising Kenya’s electricity sector. We discussed tariff
reform, and in particular, the need to eliminate a monthly fixed charge that had made
the prepaid meters difficult for consumers to understand and use.
We wanted to know how the government planned to do to encourage productive
use, as it approached its goal of universal access. We presented our preliminary
impact results, which the secretary found convincing. He noted, quite memorably,
that the question of universal electricity access was not an economic one, but a
political one. It was an election year, and the LMCP was a daily topic in the
news. Our conversation highlighted the political economy considerations that often
determine which and when certain groups benefit from government programs.
By the end of the year, we completed a second round of household surveys,
which took place roughly 32 months post connection. The data revealed a similar
pattern of no meaningful and statistically significant impacts. The evidence was
consistent with the large gap between demand and cost that we had estimated in our
experiment, several years earlier.
We were challenged to consider what might happen to our demand and cost
analysis if the surrounding institutional and economic context was more favorable.
That is, how much higher would the demand curve be if we could eliminate the
credit constraints, blackouts and delays that may have suppressed demand? And
5 Expanding Access to Electricity in Kenya
125
what would happen to our estimate of social surplus if we eliminated leakage and
incorporated a moderate level of income growth?
To answer this question, we referred heavily to the notes we had kept during the
construction process, which provided us with the average duration of connection
delays, the average amount of time the transformers had blacked out, and other
statistics. Using this information, we projected the incremental effect on social
surplus of fixing each issue. For example, we estimated that reducing the waiting
period from 188 to 0 days would increase the consumer surplus by about 30%.
In our final calculation, we predicted that if a number of improvements were
simultaneously introduced, the area under the demand curve would finally exceed
total costs, reversing our conclusion. This was, of course, an ideal scenario. In
the real world, the LMCP was being rolled out across rural Kenya at one of our
subsidized price levels. Surely, the plethora of issues that had affected demand and
costs in Western Kenya existed elsewhere across rural Kenya.
The overall interpretation of our experimental results was that providing poor
households with electricity access alone was not enough to improve economic
and noneconomic outcomes. This stood in stark contrast to the previous, nonexperimental studies that had documented large and beneficial gains from electrification. Perhaps in those settings, there were other factors, either correlated with
or visibly part of the electrification efforts, that had influenced the direction of the
results.
7 Looking Ahead
Since 2000, there has been tremendous progress across the world in reducing the
number of people living without access to electricity. But nearly all of the global
gains have been achieved in India. By 2030, roughly 500 million people in subSaharan Africa will still be without power (IEA, 2019). It is likely that Kenya’s
model of mass electrification will serve as a blueprint for a number of African
countries in the years to come.
With our experiment largely complete, we began thinking about new areas that
seemed ripe for further research and that would have relevance to other settings in
sub-Saharan Africa. For example, there is the question of whether the impacts of
electrification are concentrated in certain types of individuals, like people who have
the means to make the most out of a new connection. There was some evidence
of this in our data. The impacts appeared larger for households that had a high
willingness to pay for a connection, which was positively correlated with income
and education at baseline. But due to limitations in our sample size, our results were
suggestive at best.
There are also questions about the interaction between a technology like
grid electrification and surrounding contextual factors. Would the impacts of our
experiment have been greater if electricity access were paired with some kind of
complementary input? What if the beneficiaries of Kenya’s LMCP also received
126
K. Lee
subsidies to purchase different kinds of electrical appliances? Would this encourage
people to experiment with new activities, thus paving the way towards greater levels
of consumption and impacts?
Moreover, there is the question of how to make it easier for new users to consume
and pay for electricity consumption. This is perhaps the most pressing challenge
facing Kenyan energy policymakers today. Consider for a moment that between
2012 and 2019, half of Kenya’s population gained access to grid electricity for the
first time. (More than three quarters of Kenyans are now connected to power.) This
is a historic achievement. Yet the meteoric rise in electricity connections (shown in
Panel A, Fig. 5.8) has been matched by a plunge in average electricity consumption
per connection (Panel B) as a greater share of poor, rural households are connected
to the grid (as is perhaps predicted in our research).
The problem is that each new connection requires a small expansion in the
national low-voltage network. But if the marginal customer is generating little to
no revenue, there is less money, on average, to maintain high-quality connections
across the expanded network. Panel C illustrates this point by plotting the recent,
sharp decline in gross profit per customer and gross profit per kilometer of lowvoltage network lines.14 Based on the reliability and leakage issues in our study,
it is easy to imagine this problem spiraling into the future, until the grid is
completely overrun with service quality issues. And as some have argued, poorquality electricity service can lower incentives to pay for consumption, leading to
a self-reinforcing, vicious circle of blackouts, and bankruptcies.15 How will Kenya
encourage greater rates of paid consumption in order to minimize the consequences
of electrifying too fast?
Finally, in the face of climate change, the development challenge looms ever as
large. How can developing countries expand access to energy while minimizing
the costs to the environment? As this case study describes, we initially set out
to build solar microgrids but ended up focusing on the grid instead. Thinking
back, I still believe this was the right move. But in a way, our conclusions on
the economics of rural electrification are less than satisfying. Not only was the
grid a costly intervention, but our experiment produced no evidence of meaningful
and statistically significant impacts, at least in the medium run. Meanwhile, new
innovations will continue pushing forward the technological frontier of decentralized, renewable energy alternatives. Did we turn away from solar microgrids too
soon? Or is the future calling for a more coordinated deployment of private and
public infrastructure? These are just a few of the questions that deserve further
consideration.
14 I use gross profit, which is defined as revenue minus energy power purchase costs, as a crude
proxy for the maximum amount of cashflow available for Kenya Power to pay annual maintenance
expenses. We do not see the same decline in gross profit per kilometer of 11 kVA lines, since
the LMCP targeted Kenya’s under-grid population and thus did not require new transformer
installations.
15 See Burgess et al. (2020) for an example of a vicious circle in the context of rural electrification.
5 Expanding Access to Electricity in Kenya
127
Fig. 5.8 Electricity access and consumption trends in Kenya
Notes: Based on Kenya Power annual reports and my own calculations. Panel A illustrates the
recent expansion of the Kenyan electricity grid, particularly across residential consumers. Panel B
shows how average consumption per customer is rapidly falling (since growth in the customer
base is coming from poor, rural households). Panel C plots gross profit—defined as revenue
minus power purchase costs—per customer, per kilometer of low-voltage network lines (data only
available from 2016 and beyond), and per kilometer of 11 kVA network lines. Panel C suggests
that the ability of Kenya Power to pay for line maintenance using operating revenue is declining
8 Discussion Questions
1. The researchers find no evidence of meaningful and statistically significant
impacts of household grid electrification in the short and medium run in rural
Kenya. What do you think are the implications of this result on the broader
United Nations Sustainable Development Goal (SDG7) of universal access to
affordable, reliable, sustainable, and modern energy for all by 2030?
2. The author hypothesizes that the impacts of grid electrification may have been
greater if electricity access had been paired with complementary inputs. What
complementary inputs could have the highest potential for impact? How would
you design a research study to measure the impacts of supplying these inputs?
Assuming that the provision of these inputs is effective, how would you revise
the design of a mass electrification policy, such as the LMCP, in Kenya?
3. The author suggests that making it easier, for new users to consume and pay for
electricity consumption may be the most pressing challenge for rapidly electrifying countries such as Kenya. Which interventions, policies, and technologies do
you think hold the greatest potential to address this challenge?
4. A recurring issue in this project was striking a balance between meeting the
goals of the infrastructure provider, while meeting the standards of academic
research in applied economics. What were the key decisions in designing and
implementing this study? And what changes do you think could have improved
128
K. Lee
the general study outcome, both in terms of the study results as well as the policy
impact?
5. Did the researchers pivot away from solar microgrids too soon?
References
Bernard, T. (2012). Impact analysis of rural electrification projects in Sub-Saharan Africa. World
Bank Research Observer, 27(1), 33–51.
Bernard, T., & Torero, M. (2011). Randomizing the “Last Mile”: A methodological note on using
a voucher-based approach to assess the impact of infrastructure projects. International Food
Policy Research Institute (IFPRI) discussion papers, 1078.
Burgess, R., Greenstone, M., Ryan, N., & Sudarshan, A. (2020). The consequences of treating
electricity as a right. Journal of Economic Perspectives, 34(1), 145–169.
Casey, K., Glennerster, R., & Miguel, E. (2012). Reshaping institutions: Evidence on aid impacts
using a preanalysis plan. Quarterly Journal of Economics, 127(4), 1755–1812.
Dinkelman, T. (2011). The effects of rural electrification on employment: New evidence from
South Africa. American Economic Review, 101(7), 3078–3108.
IEA (International Energy Agency). (2019). World Energy Outlook.
Khandker, S. R., Samad, H. A., Ali, R., & Barnes, D. F. (2014). Who benefits most from rural
electrification? Evidence in India. Energy Journal, 35(2), 75–96.
Lee, K., Brewer, E., Christiano, C., Meyo, F., Miguel, E., Podolsky, M., Rosa, J., & Wolfram, C.
(2016a). Electrification for ‘under grid’ households in Rural Kenya. Development Engineering,
1, 26–35.
Lee, K., Miguel, E., & Wolfram, C. (2016b). Appliance ownership and aspirations among electric
grid and home solar households in Rural Kenya. American Economic Review: Papers and
Proceedings, 106(5), 89–94.
Lee, K., Miguel, E., & Wolfram, C. (2020a). Experimental evidence on the economics of rural
electrification. Journal of Political Economy, 128(4), 1523–1565.
Lee, K., Miguel, E., & Wolfram, C. (2020b). Does household electrification supercharge economic
development? Journal of Economic Perspectives, 34(1), 122–144.
Lipscomb, M., Mushfiq Mobarak, A., & Barham, T. (2013). Development effects of electrification:
Evidence from the topographic placement of hydropower plants in Brazil. American Economic
Journal: Applied Economics, 5(2), 200–231.
Mankiw, N. G. (2011). Principles of economics (5th ed.). Cengage Learning.
Wolfram, C., Shelef, O., & Gertler, P. (2012). How will energy demand develop in the developing
world? Journal of Economic Perspectives, 26(1), 119–138.
Open Access This chapter is licensed under the terms of the Creative Commons Attribution 4.0
International License (http://creativecommons.org/licenses/by/4.0/), which permits use, sharing,
adaptation, distribution and reproduction in any medium or format, as long as you give appropriate
credit to the original author(s) and the source, provide a link to the Creative Commons license and
indicate if changes were made.
The images or other third party material in this chapter are included in the chapter’s Creative
Commons license, unless indicated otherwise in a credit line to the material. If material is not
included in the chapter’s Creative Commons license and your intended use is not permitted by
statutory regulation or exceeds the permitted use, you will need to obtain permission directly from
the copyright holder.
Chapter 6
Measuring Grid Reliability in Ghana
Noah Klugman, Joshua Adkins, Susanna Berkouwer, Kwame Abrokwah,
Matthew Podolsky, Pat Pannuto, Catherine Wolfram, Jay Taneja,
and Prabal Dutta
1 The Development Challenge
The power grid is arguably the most complicated machine humanity has built, and
the payoffs from this marvel have been transformative. No country has achieved
economic industrialization without significant increases in energy use. Hospitals,
schools, factories, and homes across the world depend on electricity for their daily
N. Klugman () · J. Adkins · P. Dutta
Electrical Engineering and Computer Science, University of California, CA, USA
nLine, Inc, Berkeley, CA, USA
e-mail: nklugman@berkeley.edu; adkins@berkeley.edu; prabal@berkeley.edu,
https://www.nline.io
S. Berkouwer
The Wharton School, University of Pennsylvania, Philadelphia, PA, USA
e-mail: sberkou@wharton.upenn.edu
K. Abrokwah
Brixels Company Limited, Accra, Ghana
M. Podolsky
Electrical Engineering and Computer Science, University of California, CA, USA
P. Pannuto
Computer Science and Engineering, University of California, San Diego, CA, USA
e-mail: ppannuto@ucsd.edu
C. Wolfram
Haas School of Business, University of California, Berkeley, CA, USA
e-mail: cwolfram@berkeley.edu
J. Taneja
Electrical and Computer Engineering, University of Massachusetts, Amherst, MA, USA
e-mail: jtaneja@umass.edu
© The Author(s) 2023
T. Madon et al. (eds.), Introduction to Development Engineering,
https://doi.org/10.1007/978-3-030-86065-3_6
129
130
N. Klugman et al.
operations. As such, the developing world has seen tremendous investments in the
electricity grid in recent years.
Investments in the electricity sector in the developing world have often focused
on increasing access to electricity by expanding the grid. There has been less focus
on increasing the quality of electricity provided by the existing grid. However, poor
reliability is often associated with a reduction in the demand, utilization, and social
benefit of electricity (Gertler et al., 2017). Reassuringly, the importance of grid
reliability is increasingly being recognized: the UN Sustainable Goals now specify
that access to electricity must also be reliable (McCollum et al., 2017).
Improvements in electricity reliability can be harder to achieve than improvements in access. Improving a grid’s reliability requires fine-grained information
about how different attributes of the grid perform. However, these data are historically expensive to collect and not prioritized (The GridWise Alliance, 2013;
Taneja, 2017). Many electrical utilities, investors, and energy regulators are underresourced for the enormously complex and expensive task of planning, extending,
and operating the grid at consistent reliability of service, especially in the presence
of rising consumption and increasingly adverse weather patterns. Thus, the development challenge is to reduce the economic and technical barriers to monitoring the
quality of existing electricity networks in the developing world, so that this data can
inform actions taken to improve grid reliability.
Developing a novel technology in an academic laboratory setting is not sufficient
for addressing critical information gaps: The widespread deployment of these
technologies brings a unique and unpredictable set of challenges. This chapter
describes a project that transferred research out of the academic laboratory and into
a field setting. Our interdisciplinary team of engineers and economists designed,
deployed, and continues to operate a large sensor network in Accra, Ghana, that
measures power outages and quality at households and firms. The deployment
began in June 2018 and consisted of 457 custom sensors, nearly 3500 mobile
app installations, and nearly 4000 participant surveys, as well as user-incentive
and deployment management meta-systems developed by our team, which will
continue collecting reliability data until at least September 2021.1 Grid reliability
data collected by our deployment in Accra will enable multiple impact evaluations
of investments in the grid that, in part, explore the effects of improvements in
reliability on socioeconomic well-being.
Entering the field, we anticipated we would have to pivot our technology
and deployment methodology, both initially designed in the lab, to respond to
unanticipated cultural, technological, and organizational requirements. This indeed
happened, as we describe throughout this case study. However, we also held
the incorrect assumption that the non-technology dimensions of this work would
stabilize over time and wouldn’t meaningfully contribute as a barrier to scale as
compared to overcoming engineering hurdles. However, in practice, we found that
1 This research has Institutional Review Board approval from the University of California at
Berkeley (CPHS 2017-12-10599).
6 Measuring Grid Reliability in Ghana
131
pain points experienced at each deployment scale were fundamentally interdisciplinary, often manifesting as new or more stringent cultural and organizational
requirements, each of which required innovation to overcome. This case study
therefore focuses mainly on the consequences of changing deployment context, in
this case by changing scale, and distilling lessons we wish we had learned before
forecasting budgets, human resource requirements, and project timelines. These
lessons remain critical for our team as we continue to scale our deployment beyond
the work described here. We hope that learning about our case study encourages
other researchers and helps them hit the ground running as they pursue highly
granular measurements of the world’s critical systems.
2 Context
We briefly introduce the context in our deployment site of Accra, Ghana, touching
on the local energy context and introducing our implementing partners. We then
introduce the research questions that data from our deployment was designed to
explore, providing further context for the design decisions described in the rest of
this case study.
2.1 Energy Environment in Ghana
Ghana’s electric grid has roughly 4.74 million connections and experiences a
peak load of 2881 MW, a supply capacity of 4695 MW, and an estimated 24.7%
distribution loss rate (Energy Commission Ghana, 2019). The distribution utility in
the capital city of Accra is the Electricity Company of Ghana (ECG).
Reliable electricity has the potential to provide huge social and economic benefits
(Bowers, 1988; McCollum et al., 2017; Hamidu & Sarbah, 2016) In Ghana,
however, the grid at times falls short of enabling these, causing frustration that has
even boiled over to civil unrest (Aidoo & Briggs, 2019; Ackah, 2015). From 2013
through 2015, the country experienced drastic electricity undersupply, culminating
in outages between 6 and 24 h during 159 days in 2015. This period is known as
“Dumsor,” the Twi word for “off-on.” While Dumsor has largely been remedied
with the introduction of new generation capacity (Clerici et al., 2016; Millennium
Challenge Corporation, 2008), Ghana still reports electricity reliability metrics that
underperform relative to countries with similar GDPs (Millennium Development
Authority, 2018).
132
N. Klugman et al.
2.2 Partners
Mirroring the increasingly global focus on energy reliability, current investments
in the Ghanaian electricity sector are primarily aimed at improving the reliability
of electricity distributed on the existing grid. Partially in response to the Dumsor
crisis, the Millennium Challenge Corporation (MCC) and the Government of Ghana
signed the Ghana Power Compact in 2014, a USD 308 million2 investment designed
to improve the grid generation, transmission, and distribution systems in Ghana, to
be implemented by the newly created Millennium Development Authority (MiDA)
(Millennium Development Authority, 2018). This investment has multiple goals,
including cutting operational costs, reducing transmission and distribution losses,
increasing affordable access to grid connections, and improving reliability. The
country’s current work to improve grid reliability motivated our selection of Ghana
as our deployment site (Millennium Challenge Corporation, 2008). One of the goals
of our deployment is to work with both MCC and MiDA to provide data to support
their monitoring and evaluation goals.
2.3 High-Level Goals
2.3.1
Improving Energy-Reliability Data Quality
SAIDI =
Total duration of sustained interruptions in unit time
Total number of consumers
(6.1)
SAIFI =
Total number of sustained interruptions in unit time
Total number of consumer
(6.2)
To improve reliability, it is important to measure it (McCollum et al., 2017;
Sustainable Energy for All, 2018). Two widely used key performance indicators that
capture the overall reliability of the grid are the system average interruption duration
index (SAIDI) and the system average interruption frequency index (SAIFI) (IEEE
Std 1366, 2001). The calculation of SAIDI and SAIFI is shown as Eqs. (6.1) and
(6.2). The monitoring and evaluation teams at MCC and MiDA consider changes
in SAIDI and SAIFI to be indicative of the impact of the Ghana Power Compact
(Millennium Development Authority, 2018).
2 When the Compact was first signed in 2014, it totalled USD 498 million – this amount was
lowered to USD 308 million in 2019 when a 20 year concession of the utility was cancelled.
6 Measuring Grid Reliability in Ghana
133
In Accra, the highest spatial and temporal resolution measurements of grid
interruptions are collected by the supervisory control and data acquisition (SCADA)
system operated by ECG. This SCADA system has limited reach, covering only
high-voltage transmission lines and some portion of the medium-voltage distribution network (Nunoo & Ofei, 2010). To improve monitoring, ECG has recently
deployed some smart meters, but economic and social challenges raise barriers to
achieving broad smart meter coverage in the short term (Acakpovi et al., 2019;
Millennium Development Authority, 2014; Banuenumah et al., 2017). ECG recently
completed a much larger effort to upgrade their prepaid meters; however, many of
the prepaid meters do not regularly communicate power quality measurements back
to the utility (Quayson-Dadzie, 2012; Electricity Company of Ghana., 2019).
Measurements of low-voltage outages come primarily from customer calls, yet
data collected from the national call center suggest that this data stream is imperfect.
Frequent outages may reduce willingness to report, as calling the utility to report
an outage can require significant effort without a guarantee that it will shorten
the duration of an outage: 90% of respondents to a survey we conducted had
not reported a single outage to ECG in the preceding 3 months, despite also
acknowledging in the same survey that they had experienced outages during that
time. There are few call center reports during the night while people are asleep,
and dips in reporting during the day while people are at work. While some of these
patterns may reflect reality (a grid will fail more often when it is hot and being used
at capacity, conditions more likely in the middle of the day (He et al., 2007)), these
data are likely not truly representative.
Therefore, our deployment aims to generate more accurate estimates of SAIDI
and SAIFI by placing sensors in the field that extend beyond the SCADA system
to automatically report the location and duration of power outages in the lowvoltage network, as well as further upstream. We also capture voltage fluctuations
and frequency instabilities at the low-voltage level, as these can have significant
impacts on the value of appliances and machinery.
2.3.2
Providing Utility-Independent Measurements
To understand how well infrastructure improvements impact reliability, it is important to have utility-independent measurements (Millennium Development Authority,
2018). Many widely used tools, including SCADA and smart meter technologies,
are dependent on utility participation, in part because they directly interface with
utility property. From an academic perspective, independence is important as it
allows for unbiased research output. Independence is often desired by regulators
as well, who may want to verify measurements provided by the utility, as the utility
has incentives to report favorable reliability metrics. Currently, no high-resolution
source of independent data about grid reliability in Accra exists. Our deployment
was designed to evaluate the feasibility and efficacy of a novel sensing methodology
for monitoring the reliability of the electricity grid while working independently of
the utility. Our physical sensor is designed to be installed at outlets in households
134
N. Klugman et al.
and business, and our sensing app personal smartphones, allowing us to choose
deployment sites and deploy sensors without utility involvement. The data returned
from our deployment is truly independent.
2.3.3
Exploring Impacts of Reliability
The causal relationship between electricity reliability and socioeconomic wellbeing is not well understood. Anecdotally, frequent outages constrain economic
well-being by reducing the benefits from welfare-improving appliances, such as
fans and refrigerators, or income-generating assets, such as welding, sewing, or
other productive machinery. Our deployment was designed in part to generate both
reliability and socioeconomic data to support an ongoing economic study that aims
to estimate the causal impact of power quality and reliability on socioeconomic
outcomes, such as productivity and health, for residents and firms in Accra.
3 Innovate, Implement, Evaluate, Adapt
Starting in May 2018, we conducted three deployments at three different scales: a
small-scale pilot, a medium-scale deployment, and a large-scale deployment.3 To
date, 3400 individuals in Accra downloaded our mobile app, called DumsorWatch;
457 people installed our plug-in sensor, called PowerWatch; and over 4000 surveys
were performed to directly measure socioeconomic outcomes. In December 2019,
we surveyed an additional 462 participants to understand their experiences and to
collect updated measures of time-varying socioeconomic outcomes.
We present the technology deployed, the design of our deployment, and where
our planning and assumptions failed or caused unexpected problems. While doing
so, we attempt to categorize our key challenges and describe the steps we have
taken to overcome each of these challenges, emphasizing issues that arose that were
more complex and/or costly than originally forecasted. We find that our experiences
differed depending on the scale of the deployment, each scale uncovering its own
complexities.
3.1 Innovation: Data Collection Instruments
We developed two types of data collection instruments – sensors and surveys – to
achieve the goals described in Sect. 2.3. These instruments collect the required data
to estimate SAIDI and SAIFI independently of utility participation.
3 As
of November 2020, we continue to expand with additional deployments.
6 Measuring Grid Reliability in Ghana
3.1.1
135
Sensors
We developed two different sensors that detect the presence and absence of grid
power: an app called DumsorWatch that is installed on a participant’s mobile phone
and a sensor called PowerWatch that is plugged into a power outlet at a household
or business.
DumsorWatch is an Android app installed on the everyday-use smartphone of a
participant who lives and/or works in Accra. “Dumsor,” the local word for power
outages, was used for branding and association with power outages in the Ghanaian
context. DumsorWatch automatically senses power outages and power restorations
through a combination of on-phone sensors and cloud services (Klugman et al.,
2014).
PowerWatch, our plug-in sensing technology, integrates power reliability sensors
with a GSM radio to send measurements in near-real time to a cloud database (Fig.
6.3). By designing PowerWatch to plug into a participant’s home or business, as
opposed to connecting directly to the electric grid, we avoid the need for prior
approval or cooperation to deploy the sensors and therefore maintain independence
from the utility, a primary goal of our deployment. PowerWatch senses power
outages and power restorations timestamped to the millisecond, as well as GPSbased location, voltage, and grid frequency.4 PowerWatch contains a battery to allow
for continuous reporting throughout a power outage and will queue data if there
are GSM-network-connectivity problems, to be uploaded once GSM connectivity is
restored.
How Do PowerWatch and DumsorWatch Work?
PowerWatch consists of an outage detection sensor that plugs into an outlet
and is installed in homes and businesses and reports the state of the grid over
a cellular backhaul to the cloud. Every minute, the sensor takes a reading
of power state, grid voltage, grid frequency, GPS, and cellular quality. It
also records the number of nearby Wi-Fi signals as secondary validation, as
wireless hotspots may be grid powered. In addition, upon changes in power
state, the device records the timestamp (from an on-board real-time clock)
and current acceleration. All these measurements are stored locally on an
SD card and transmitted to the cloud when a cellular connection is available.
Acceleration signals that a participant is interacting with the device, making it
likely that any charge-state change at that time is a false positive and allowing
us to more easily reject the data point. The sensor contains a 2000 mAh
battery, which can run the sensor for several days, longer than most outages
(continued)
4 PowerWatch internally records voltage measurements 150 times per AC cycle; then every 2 min,
it reports the RMS voltage and grid frequency averaged over 30 AC cycles.
136
N. Klugman et al.
in Accra. When the sensor is on battery power, it still reports data at the same
frequency to our servers, a feature necessary for calculating outage duration.
The primary sensors used by the DumsorWatch app are the phone’s
location sensors (GPS), the phone’s charging state which monitors if the
phone is connected to a power source or not (and notifies DumsorWatch
when that state changes), and the system clock to give the time of any
observed events. Secondary sensors in the app help refine the likelihood
that a change in charge state corresponds to a power outage or restoration.
For example, the accelerometer can measure if the phone was moving when
its charge state changed (as it would if a charging cable was inserted or
removed from the phone side), and the phone’s Wi-Fi radio can report the
presence or absence of wireless hotspots. On-phone processing and analysis
of microphone recordings may be able to detect the presence of a 50 Hz “hum”
of grid mains. Additionally, the users of the app can manually report a power
outage and power restoration by pressing a button in the app.
For both technologies, a cloud-based analytic system searches for outage
reports from multiple devices to ensure the validity of an outage. To perform
this search, we cluster outage reports into density-based clusters in both space
and time. This lets us reject noise from a single sensor (i.e., a single participant
unplugging a device or a pre-paid meter running out of credit) and ensures that
only true outages are reported by the system.
3.1.2
Surveys
A 60-min socioeconomic survey accompanied the deployment of each PowerWatch
device, and all participants who received a PowerWatch device also downloaded the
DumsorWatch app. A shorter survey was administered to participants who solely
downloaded the DumsorWatch app. All surveys were completed using SurveyCTO,
and all participants received an airtime transfer as a thank you for participation
(SurveyCTO, 2019). We conducted high-frequency checks to address any obvious
data quality issues. Example data collected includes:
1. Demographics: name, age, education, income.
2. Electricity attributes: appliance and surge protector ownership, usage of electricity and generators.
3. Recall of power quality in the past 2, 7, and 30 days.
4. Social media usage and perceptions of the energy crisis.
Along with providing data for the economic study, the survey was used to support
the development and deployment of the technology itself. For example, the survey
recorded a unique code for the PowerWatch device and DumsorWatch app and the
participant’s phone number and GPS location. To inform DumsorWatch debugging,
6 Measuring Grid Reliability in Ghana
137
we asked how they used their mobile phones, how many phones and SIM-cards
they use, and how frequently they upgrade their phones. To inform the PowerWatch
deployment, we asked whether the participant turns off their electricity mains at
night and whether they had any safety concerns about PowerWatch.
3.2 Innovation: Deployment Methodology
To support our deployment as scale increased, we designed and implemented a novel
set of deployment management tools. While our methodology evolved to support
each deployment scale, its general structure remained fairly consistent. First, we
developed criteria for site selection that allows us to answer specific socioeconomic
questions. Next, we devised a sampling procedure that gave sufficient coverage of
each chosen site, as well as sufficient redundancy to enable cross-validation of the
new measurement technology. Finally, we worked with a team of field officers to
deploy in the chosen sites, employing our deployment management tools to maintain
and monitor the system. The rest of this section considers each of these components
in detail.
3.2.1
Site Selection
We selected a subset of the sites where infrastructure upgrades are planned (“treatment sites”) and then quasi-randomly selected a set of sites that are comparable in
observable characteristics (“control sites”). For each site, we defined a geographic
surveying area that is the intersection of a 200-meter radius from the site centroid
and a 25-meter region extending from the low-voltage network being measured.
We wanted the area to be relatively small, so that we could have a high degree
of confidence that customers within the area were all connected to the same
infrastructure, but it needed to be large enough to have a sufficient number of
residents or firm owners for us to enroll into the study. We performed this analysis
using GIS tools operating on a newly created map of Accra’s grid constructed by
an independent firm that had been contracted by MiDA as part of the improvements
funded by the Ghana Power Compact. Using these GIS maps, we produce a series
of maps marking the geographic area bounding each site. Field officers used these
maps, along with the GPS coordinates for the sites, to identify the surveying area
and deploy sensors accordingly.
3.2.2
Sampling Strategy
We deployed our sensors at the home or place of work (or both, if these are colocated) of Accra residents, targeting a 50/50 split between households and firms.
Installing PowerWatch at consumer plugs and DumsorWatch on consumer phones
138
N. Klugman et al.
Fig. 6.1 Deployment overview
Notes: To support the goals of the deployment, our team selects sites that are being improved by
the Ghana Power Compact and control sites. The technology is deployed in both sites along with
surveys at the beginning and end of the deployment. This lets us meet our goals of evaluating the
impact of grid improvements to power reliability and the socioeconomic impact of that reliability
on consumers
allows us to not depend on direct access to utility infrastructure such as transformers
or lines and to measure power quality at the point where it is least understood: the
customer (Fig. 6.1).
We planned a deployment of three PowerWatch devices and 20 DumsorWatch
app downloads at each site. Our strategy is built around redundant sampling such
that multiple sensors are placed under a single transformer. When multiple sensors
in this group report an outage at the same time, we can be confident it was due to
an issue affecting the transformer rather than a single customer. Further, when we
observe sensors below multiple transformers reporting outages simultaneously, we
can infer the outage occurred at a higher level of the grid. This sampling strategy is
shown in Fig. 6.2.
3.2.3
Deployment and Surveying Team
We hired local staff who supported our continuously operating deployment. One
team member works full time as a field manager to oversee initial roll-out and
ongoing maintenance of the system and an auditor to follow up with participants
who report problems or whose sensors are no longer functioning.
To implement our medium- and large-scale deployments, we temporarily
employed a team of ten field officers and three team leads. Prior to the start of
the deployment, the field officers were trained extensively to ensure the correct
protocols were used to obtain consent, conduct surveys, plug in the power strip
and PowerWatch device at the respondent’s home, download the app onto the
respondent’s phone, and conduct any necessary troubleshooting related to the
6 Measuring Grid Reliability in Ghana
139
Fig. 6.2 Deployment methodology for sensors
Notes: Sensors, either the PowerWatch sensor or DumsorWatch app (both labeled S), monitor
power at homes and firms. By randomly sampling outlets at households and businesses, they
detect a significant portion of low-voltage (b), medium-voltage, (c) and high-voltage (d) outages.
In the aggregate this data can be used to estimate the average frequency and duration of outages,
including both single-phase and multi-phase outages, by looking at reports from sensors that are
close together in space and time. Additionally, this spatiotemporal analysis allows identification of
what voltage level experienced the fault. Undersampling can lead to missed outages when sensors
are not present in any of the affected units, shown in the bottom outage of (d)
technologies. Field officers find potential participants, get informed consent, and
screen their eligibility. They then conduct the survey, install the sensors, and
answer any participant questions. We conducted multiple training exercises where
each team member learned about the technologies being deployed and practiced
completing the survey and deploying the technologies.
140
N. Klugman et al.
Fig. 6.3 Evolution of PowerWatch with each deployment
Notes: PowerWatch revision A consisted of an off-the-shelf compute/communication module and
enclosure (A.1) and paired with a custom sensor front-end (A.2). Data from this revision informed
the need for a better enclosure and more casing in revision B, which consisted of a custom sensing
and communication board (B.1), enclosure with externally plugged power supply (B.2), and a
separate grid voltage and frequency sensor (B.3). While the separate grid voltage and frequency
sensor allowed for easier assembly, its complications led us to build revision C, a completely
encased custom sensor which plugs directly into the wall, to sense grid voltage and frequency
Fig. 6.4 Field officers in uniform
Notes: Providing consistent branding built trust in the community as field officers visited potential
participants. During the medium-scale deployment, choosing a color scheme inspired by our
university accidentally resulted in a color scheme similar to that of the local power utility, causing
some confusion. While we were easily able to choose new colors for the large-scale deployment,
we highlight that it is important to consult with local experts before making branding decisions
Field officers visited sites in groups of two to alleviate safety concerns. We
provided team uniforms, shown in Fig. 6.4, to make clear they are part of an official
project. We also provided backpacks to carry supplies, tablets to conduct the survey,
Wi-Fi hotspots to upload the survey and download the DumsorWatch app, flashlights
for safety, and feature phones to verify the phone numbers of participants to ensure
we know where to send the participation incentives.
6 Measuring Grid Reliability in Ghana
3.2.4
141
Dependence on Participants
The placement of PowerWatch sensors directly in homes and firms – where
participants may unplug them, run generators, or experience power shutoffs due
to nonpayment – increases the noise of our data relative to a deployment on
utility-owned equipment such as transformers. Similarly, the DumsorWatch app
may be uninstalled from respondents’ phones, reducing coverage and leading to
a potentially under-sampled signal. A key challenge was thus ensuring that we only
enrolled participants who had the ability and desire to participate for the full study
duration and then to minimize any cause for participants to choose to withdraw
consent from participation.
In a preemptive attempt to decrease the statistical noise caused by human factors,
we screen participants for specific criteria including owning a phone with Android
version 4.1–8.1 and being an active customer on the grid. In order to minimize
attrition, we explain the goals, risks, and benefits of the project, as part of the
consent process. Finally, we provide a phone number to call if participants have
any questions or concerns.
To further encourage continued participation, we compensate participants
monthly with airtime credits on their mobile phone. All participants whom we
recruited to download the DumsorWatch app received 5 Ghana Cedi (0.93 USD) of
airtime for initial recruitment and 4 Ghana Cedi (0.75 USD) monthly for keeping
DumsorWatch installed. Participants who also installed a PowerWatch device
received an additional 10 Ghana Cedi (1.86 USD) for installing the sensor and 5
Ghana Cedi (0.93 USD) monthly for keeping PowerWatch installed. Additionally,
participants who have a PowerWatch sensor placed at an outlet in their home receive
a power strip so that the sensor does not take up a needed outlet.
3.2.5
Deployment Management Tools
We developed three software subsystems to support the deployment: (1) an automated incentive system to transfer the airtime incentives; (2) a deployment management system to (a) track sensor and participant status and (b) display deployment
health to the field management team; and (3) a data visualization and analysis
system. We discuss these systems, and the experiences that led us to develop them
as the deployment scaled, in Sect. 3.5.
3.3 Evaluation: Overview
For each of the small-, medium-, and large- scale deployments, we report problems
that occurred, techniques used to mitigate their impacts, and the effectiveness
of the mitigation. To emphasize the parallels between challenges exposed at
142
N. Klugman et al.
different scales, we organize this discussion around four categories of challenges:
organizational, cultural, technical, and operational. Organizational challenges relate
to procurement, hiring, and finances; cultural challenges relate to how cultural
considerations impacted the deployment and operation of the technology; technical
challenges relate to the development, manufacturing, and functioning of the technology; and operational challenges relate to the successful deployment and operation
of the technology.
3.4 Evaluation: Small-Scale Pilot
The first activity we performed was a deployment of 15 PowerWatch sensors and
5 DumsorWatch app downloads. The goal of this deployment was to validate that
the technology can reliably sense power outages and transmit this information over
many weeks in the field. We performed no survey work and no site selection work
for the small-scale pilot: devices were not deployed with participants enrolled from
the public but in the private homes of our research partners. The primary challenges
were related to producing the technology, connecting the PowerWatch sensors to
the cellular network, and building enough local capacity to deploy PowerWatch and
DumsorWatch.
In addition to testing the technology, we worked to build relationships to support
future scaling. We reached out to local stakeholders for feedback on the assumptions
driving our sensor design, speaking with engineers and managers at ECG, MiDA,
and several independent contractors involved in the Ghana Power Compact. We
also received data from ECG that helped validate our hypothesis that their existing
estimates of SAIDI and SAIFI could benefit from higher-resolution measurements.
Even at a small scale, we experienced unanticipated technical challenges. To
connect the PowerWatch devices to the cellular network, we initially used SIM
cards sold by Particle, the US-based manufacturer of the cellular technology used
in PowerWatch, in part because these SIM cards had been advertised to work in
any country. But in practice, their ability to maintain a stable network connection
was worse than that of a local SIM. We therefore decided to use SIM cards from
the largest local carrier (MTN), but we encountered a three-SIM-card-per-person
limit upon purchase. Although we were able to circumvent this by visiting different
stores, purchasing SIM cards in stores was not an option for future scale.
Another challenge was keeping SIM cards functional over the full study period.
Prepaid SIM cards require data plans, which are purchased using an unstructured
supplementary service data (USSD) application that can only be run from within
Ghana; there is no web-based account management or top-up available. We initially
solved this problem by purchasing a 90-day data plan, the longest available.
This was sufficient for our small-scale pilot but would not be viable for future
deployments.
6 Measuring Grid Reliability in Ghana
143
Table 6.1 Pain points of different scales
Type
Organizational
Small scale
Local SIM
procurement
Technical
Global SIM
operation
Operational
SIM top-up
Cultural
Learning local
context
Medium scale
Hiring local staff
Contracting local companies
Paying outside free tier
Custom hardware
Firmware development
App development
SIM operation
Transportation
Field officers
Incentivizing participants
Data sharing
Local leader approval
Large scale
Assembly
Site selection
Deployment management
Unexpected phone usages
Survey design
Notes: At each deployment scale, we encountered pain points – complexities that were more
difficult than we expected from a simple increase in deployment size. Many occurred at the
transition to medium scale, when local capacity had to be built, expenses to operate the
technology increased, lack of technical reliability became more apparent, and systems that could
once be human-operated had to be automated. Large scale brought new problems, most notably
the need for automated deployment management tools to track deployment state
3.5 Adaptation from Small-Scale Pilot Experience
and Evaluation of Medium-Scale Deployment
In our medium-scale deployment, 1981 individuals downloaded the DumsorWatch
app, and 165 individuals installed PowerWatch sensors. After an initial 1-week
training, field officers first deployed the PowerWatch sensors, which included also
administering a detailed socioeconomic survey and installing the DumsorWatch
apps on the phones of PowerWatch recipients. Once the deployment of the
PowerWatch sensors was complete, field officers spent 3 weeks deploying the
DumsorWatch apps among an additional set of participants, which also included
a shorter socioeconomic survey. Once initial deployment was complete, the monitoring activity continued for 7 months.
Unlike the small-scale deployment, this scale required implementing our full
deployment design, including hiring a full local implementing team, recruiting and
incentivizing participants, choosing deployment sites, extracting value from the
data streams, and implementing the survey instruments. We enumerate the changes
experienced as we increased from small- to medium-scale in Table 6.1, paying
particular attention to the challenges extracted.
144
3.5.1
N. Klugman et al.
Organizational
The medium-scale deployment was large enough that the financial responsibilities
were significant. We had to start managing multiple monthly payments for cloud
services and payments to local companies for cell network connectivity and incentive transfers. Most of this increase in complexity was ultimately handled by staff
at the University of California, Berkeley, but establishing payment schedules took
a large effort from the research team. Bureaucratic requirements at the university
also caused frequent delays in payments, especially when payment was needed in a
short time frame (1–2 weeks). Increased flexibility, for example, at an independent
organization or private sector company, might better suit technological deployments
that have some complexity in administrative streams like finances and hiring.
Because prepaid SIM cards were not available at the quantities we now needed,
we had to enter into a contract with the cellular provider, MTN. To alleviate concerns
about whether our application was legitimate, we visited the MTN main office in
our university shirts, gave a technical demo, and answered questions about our
backgrounds and affiliations.
At medium scale, many of the cloud-based software services our systems were
built on were no longer eligible for free-tier usage. For one service, this meant that
we would be unable to continue without signing a multiyear contract that extended
beyond the length of the deployment. We found a workaround for this deployment
by applying to a special program within the company, but in future deployments we
would more carefully consider pricing models for ancillary services.
3.5.2
Cultural
Visiting households and firms requires permission from the relevant local district
assemblies. We wrote letters of introduction and visited these assemblies to receive
permission. Receiving this permission also increased participant trust.
We also worked with the field officers to refine our survey design. During
training activities, the field officers had the opportunity to react to questions and
provide suggestions for improvement. We used this feedback to make the survey as
culturally appropriate and in line with our research objectives as possible. As field
officers entered the field, we received continuous feedback on ways to improve our
survey and deployment procedures.
Finally, we learned that a uniform would be valuable for building participant
trust. We provided DumsorWatch-branded shirts and backpacks for the field officers,
so they would look official when approaching participants. These are shown in Fig.
6.4. Field officers also carried identification cards that they could show participants
in case of any questions.
6 Measuring Grid Reliability in Ghana
3.5.3
145
Technical
At medium scale, frequently visiting sensors for debugging was no longer feasible,
so we prioritized sensor stability and remote failure detection and mitigation. This
included developing a full custom embedded system for PowerWatch (shown in
Fig. 6.3 B.1) with built-in mechanisms to reset the device on failure. Additionally,
we spent considerable time implementing and testing more reliable firmware,
incorporating error collection libraries, and building dashboards displaying the
health of both PowerWatch and DumsorWatch. We assembled this version of
PowerWatch over 3 days with the help of fellow graduate students.
Another technical challenge concerned mobile phone heterogeneity. We had
little insight into what types of mobile phones and versions of Android were
most common in Accra. Thus, we implemented DumsorWatch to be backwards
compatible to 4.0.0, a version of Android no longer supported by Google (Google,
2018). Backward compatibility took considerable engineering effort and had side
effects such as making DumsorWatch incompatible with many modern Google
cloud services, including Google’s bug tracking tools, making app failures much
harder to correct. Further, we chose to support older versions of Android at the
expense of supporting the newest Android version at the time, Android 8.1, a
decision that made those with the newest phones no longer eligible for participation.
While this did not reject large numbers of participants during this deployment, as
more people moved to newer devices, it would have more impact on recruitment,
necessitating future engineering costs.
Finally, we experienced two challenges related to SIM card operations. First, we
could not identify a way to test PowerWatch sensors in the United States using MTN
postpaid SIM cards, which were not configured to allow PowerWatch to connect to
cellular networks outside of Ghana. We therefore built a US-based testbed for sensor
development that used US-based SIM Cards. However, to perform final assembly
and quality assurance, steps that require PowerWatch to be connected to the MTN
network, we needed to wait until the sensors were in Ghana for a deployment,
compressing the timeline of these tasks and increasing risk if quality assurance
failed. Second, MTN’s process for provisioning the SIM cards required additional
oversight and took much longer than expected, which delayed deployment and made
clear that a different partner would be required to manage large fleets of SIM cards
assigned to a single customer.
These problems led us to continue exploring global SIM card options, and we
tested a small number of Twilio SIM cards during this deployment. We found they
had similar problems to the Particle SIMs previously evaluated. We contacted Twilio
support and found their documented list of Ghanaian network operators was out of
date, making unlisted providers unavailable on the Twilio network and leading to a
drop in service quality. This theme of global solutions lacking local service quality
is explored further in Sect. 4.2.
146
3.5.4
N. Klugman et al.
Operational
The operational challenges started with transporting our equipment to Ghana.
We carried the PowerWatch sensors, power strips (handed out to participants
as incentives), and equipment for field officers into Ghana in suitcases over
multiple trips from the United States. PowerWatch sensors were carried on the
plane whenever possible to minimize their chance of being lost. This method of
transportation worked but led to multiple questions from airport security in the
United States and customs in Ghana. We were able to overcome these hurdles by
creating documentation about our project and providing this along with letters of
invitation from MiDA, but even still this transportation method depended on our
team being persistent and prepared with documentation, unwrapping all equipment
from its packaging to make it look less likely to be resold, labeling all equipment
with tags indicating it was property of the university and not for resale and only
traveling with a few suitcases at a time. More generally, ensuring safe and timely
transport of nonconsumer technology across borders will likely require additional
measures depending on the local context.
Implementation of our site selection methodology required GIS maps of the
electric grid. We worked with stakeholders to determine where the best maps of
the grid were maintained, a task made more complicated by maps being held by
multiple subcontractors of the Ghana Power Compact. With MiDA’s support we
were given access to maps that, while not perfect, included enough detail for our site
selection procedures. At this medium scale, which was also relatively concentrated
geographically, it was feasible for a member of the research team to study the
GIS maps visually, identify the proposed treatment sites, manually identify control
sites quasi-randomly to match treatment sites based on observable characteristics
such as grid characteristics and satellite imagery, and produce site maps that field
officers could use to identify potential respondents at each site. This process met the
requirements for this scale deployment but would prove exceedingly complicated
for a larger deployment.
At medium scale we felt it was not feasible to transfer recurring incentives to
participants by hand. We had anticipated this problem and designed an incentivemanagement system to support this goal. The system was designed to capture user
behavior (e.g., whether a participant completed a survey, installed DumsorWatch,
kept DumsorWatch installed, etc.) and to transfer airtime automatically. The actual
transfer of airtime took place through a third-party API. We developed and tested
the incentive transfer system alongside our deployment activities (Klugman et al.,
2019).
Finally, at medium scale, the data collected were significant enough that they
became valuable to stakeholders in the region. Because many of these stakeholders
would be responsible for helping the project achieve further scale, we made an effort
to develop and share anonymized visualizations and summary statistics.
6 Measuring Grid Reliability in Ghana
147
Fig. 6.5 Relative locations and number of Android app events over time
Notes: Starting in August 2018 (left), we were receiving events from 989 phones in our deployment
area; however, the number of participants fell to 573 by September (middle) and 310 by November
(right). Because of these deployment challenges, we were unable to fully longitudinally test the
app technology
3.5.5
Failures and Missteps
One class of failures experienced at medium scale is attributable to simple technical
immaturity. For example, we found (and are still finding today) bugs both in our
automated incentive-transfer system and in the third-party payment API used to
incentivize participants. This API is provided by a small company, but we believed
it to be the best option for transferring airtime in Ghana. Both technologies should
have been more aggressively tested prior to launch. There is a clear need for a
fleet of testing phones in Ghana for continuous integration and automated testing
of incentive transfers. However, as with most hardware-based testing systems, this
is difficult to implement in practice. As a result, most participants experienced late
payments, which we hypothesize caused the significant number of DumsorWatch
uninstalls shown in Fig. 6.5.
More fundamental were issues with effectively recording, connecting, and
correcting critical deployment metadata, such as the location and status of each
device and payment, which we collectively refer to as the state of the deployment.
We had not anticipated the complexity of managing data about participants, devices,
and app installs, each of which was collected by a different system and some of
which informed each other.
This led to an ad hoc sharing of information through our encrypted shared drive.
The field team uploaded surveys containing participant- and deployment-placement
information on a daily basis. The research team downloaded and cleaned these
periodically and provided the resulting CSV files to the individual engineer handling
either sensor management or the payment system. Errors in the surveys (common
due to typos in long unique IDs) were communicated back to the field team via
phone calls and emails, and the resultant corrections in the field were not always
communicated back to the research team. This process was ineffective while we
148
N. Klugman et al.
were in Ghana and completely collapsed after we returned to the United States and
could not focus full time on deployment upkeep. As devices moved, we received
multiple, conflicting reports about their current location. As a result, we permanently
lost the state of some devices; five devices are still unaccounted for. These issues
continue to make data analysis, sensor debugging, and correlation of problems with
specific participants difficult for the devices in this deployment.
3.6 Adaptation from Medium-Scale Deployment
and Evaluation of Large-Scale Deployment
Beginning in February 2019, we built upon our medium-scale deployment and
added 292 new PowerWatch devices and 1419 new app downloads in 3 districts of
Accra, resulting in a combined large-scale deployment of 457 PowerWatch devices
and 3400 DumsorWatch apps.
3.6.1
Organizational and Cultural
The organizational and cultural challenges did not change from the medium-scale
deployment. Existing service contracts were sufficient or easily renegotiated, and
the field team scaled linearly with the size of deployment.
3.6.2
Technical
The increased number and technical complexity of the new PowerWatch sensors
constructed for the large-scale deployment precluded relying on other graduate
students to help assemble devices as we did with the medium-scale deployment;
however, the scale was still too small to be cost- or time-effective for contracted
assembly. Our solution was to build our own assembly line and hire 10 undergraduates to assemble devices. This required us to develop discrete assembly steps,
a training guide, and quality assurance techniques. The PowerWatch assembly
line can be seen in Fig. 6.6. This assembly line produced the 295 PowerWatch
sensors over 4 weeks and 110 person-hours of total work, with a 2.4% error
rate, which was far below what we were anticipating. Although this activity was
successful, difficulties in recruiting and paying students hourly, and challenges with
the academic schedule, mean this model would not scale much beyond 400 units.
The larger number of sites meant site selection was no longer easy to do
manually. This led us to develop a GIS-based site selection system, which generates
sites based on our site selection rules, labels these sites, and creates site location
images for the field officers. This system requires cleaning the GIS maps of the grid
collected from the utility and was designed and maintained by a dedicated graduate
student.
6 Measuring Grid Reliability in Ghana
149
Fig. 6.6 PowerWatch assembly line
Notes: Over 4 weeks, 10 undergraduates worked 110 person-hours to assemble 295 PowerWatch
sensors. They were responsible for assembling the plug; screwing together the enclosure; attaching
the circuit board; connecting the battery, antenna, SIM card, and SD card; and provisioning
the device with base firmware. They worked from team-created assembly manuals and training
materials
We continued exploring global SIM card options, using Aeris SIM cards for
a subset of this deployment. We found that due to Aeris’ focus on global IoT
connectivity and the number of customers they have in sub-Saharan Africa, their
SIM cards work significantly better in Ghana than Particle or Twilio SIMs.
3.6.3
Operational
The largest operational change was addressing the issues described in Sect. 3.5 with
our custom deployment management software, described further in Sect. 4.1.
3.7 Adaptation from Large-Scale Deployment to Sustainable
Large-Scale Deployment
After the completion of our large-scale deployment, our team was asked by MiDA
to scale the deployment again, this time to over 1200 PowerWatch sensors, with the
continued goal of estimating SAIDI and SAIFI and providing this data to multiple
impact evaluations of the Ghana Power Compact.
Before scaling up further, a subset of our team’s engineers created a company.
This was not an easy decision. The academic research lab context afforded
space, materials, and access to other researchers. Building a new organization has
overhead, potentially taking resources away from solving deeper problems. Working
across disciplines lets our team address an important data gap for economists
with a new technology provided by engineers, and developing the technology as
150
N. Klugman et al.
researchers allowed us to be slow, make mistakes, iterate, and get to know the
stakeholders without the pressures placed on a subcontractor delivering a product.
Most importantly, freedoms enjoyed within the academy around transparency,
knowledge transfer, and independence contribute greatly to our personal drive to
perform this work, and the financial obligations that come with forming a company
often deprioritize these goals.
We recognized, however, that this project was no longer a good fit for the goals of
an academic research lab. We anticipated fewer innovations related to the sensor and
deployment methodology and thus less research suitable for academic publication,
while also anticipating the need to spend more time supporting the expanding
deployments. Further, we recognized the need to free the project from institutional
dependencies that had been too slow for the rapid pace of field work, a pace that
would only increase with scale.
Since starting the company, the overhead of establishing an organization –
including hiring employees, establishing accounting systems, navigating conflicts
of interest, and trying to package our measurements as a product – has been
significant. However, we have been more nimble and responsive when faced with
challenges, have successfully scaled our deployment again, and, most importantly,
have a structure in place to allow this work to exist for longer than just the length of
a PhD thesis.
Pivot: Mobile Phone Sensing to Plug-in Technologies?
One original research question tested during this project was whether we
could repurpose daily-use smartphones, already deployed in the hands of
billions of people, as low-resolution grid reliability sensors. Leveraging the
widespread ownership of cellphone devices in developing countries would
allow cash-constrained utilities to improve the accuracy of reliability measurements at lower cost than widespread smart meter deployment. In fact,
a primary objective of the deployment of PowerWatch, our plug-in sensor,
was to provide ground-truth outage data against which the DumsorWatch
app’s measurements could be compared! However, as we scaled up both
technologies, we saw PowerWatch succeed, and DumsorWatch underperform
in two unexpected ways, one due to unanticipated participant behavior and
the second due to a changing technical context. The combination of these
limitations led us to prioritize PowerWatch and put DumsorWatch on the
back-burner just as it was starting to return some positive results,
The first unanticipated result we observed is that DumsorWatch was
uninstalled from participant phones at a higher rate than originally anticipated,
even when participants were financially incentivized to keep the app installed.
Most frequently, this happened automatically – for example, because the
respondent reset, replaced, or lost their phone – and the respondent did not
(continued)
6 Measuring Grid Reliability in Ghana
151
reinstall the app. Many participants also uninstalled their apps intentionally,
for example, to save space on their phones or because they had privacy
concerns from having an unknown app installed on their private device. As
a result, just 3 months after the original deployment, DumsorWatch was only
detecting around 10% of the outages that it was at the start. On the flipside,
participants also expressed PowerWatch was less invasive than an app on the
phone, potentially explaining why it regularly remained plugged in over long
periods of time.
The second unanticipated action that impacted the performance of DumsorWatch was that the Android operating system changed to limit longrunning background services. DumsorWatch depended on a background
service that would wake the app up whenever the phone was plugged in or
unplugged. This function was eliminated mid-deployment by Google in an
effort to improve the user experience, since some long running apps have
an outsized impact on battery life or quietly collect large amounts of data on
users, burning data allocations and leaking privacy. We tried to get around this
by limiting the versions of Android we recruited participants for to those that
still supported background services. However, the new OS limitations ensured
the sunset of DumsorWatch as an application layer technology, which led to
us to reprioritize our engineering efforts to improve the PowerWatch system.
It is worth noting that our implementation of DumsorWatch successfully
detected power outages! For as long as it was operational, participant
phones running DumsorWatch demonstrated that uncoordinated smartphones
experiencing charge state changes at the same time correlate with ground truth
grid reliability measurements as provided by PowerWatch. However, based on
both factors explained above, we believe the best path forward for the ideas
captured in DumsorWatch is for these types of measurements to be taken as an
OS level service in Android and to be aggregated as a primary crowd-sourced
measurement (similar to how Google Maps captures and exposes traffic data
(Google, 2009)). This pivot was made easier by the presence of PowerWatch,
which could answer many of our remaining questions. While it remained a
hard choice, it lets us better prioritize our team’s and our funders’ resources.
4 Lessons Learned
Each level of scale brought unique complexities for both engineering and operational tasks. While some of these complexities were one-time costs, many can
be attributed to either the continuous nature of operating and managing a sensor
deployment at scale or a context in the local culture we were not anticipating.
This combination of scale and continuity stretched the administrative ability of the
152
N. Klugman et al.
university system; exploded the continuous data stream that must be maintained to
manage the sensors requiring automation; amplified errors in data collection; and
ultimately required us to develop automated tools to facilitate tasks that we and our
field team could not handle at scale. We hope these lessons will inform future efforts
to deploy continuous monitoring and evaluation systems in developing regions.
4.1 Continuous Monitoring Requires Continuous Upkeep
Continuous operation of a sensor network and phone application requires significant
metadata and upkeep not required for a large survey deployment. Sensor deployment
times and locations must be recorded and correlated with participant information.
Unique app identifiers need to be collected to ensure app installation compliance.
Participant phone numbers need to be stored so participants can be appropriately
incentivized. All of this information needs to be effectively communicated to the
field officers for debugging on an ongoing basis and updated over time because
participants and their devices are in constant flux. As we describe in Sect. 3.5,
maintaining a high quality of sensor deployment and implementation of our
experimental design requires a systematic approach to tracking these data at scale.
At a fundamental level, the introduction of continuous monitoring systems into
a deployment introduces feedback loops that are not present in a large surveying
effort. These feedback loops, shown in Fig. 6.7, have two major implications for a
deployment:
1. Errors introduced into the feedback loop by incorrect metadata from a survey are
important and often amplified if not addressed.
2. The deployment’s state (e.g., the location and status of each payment and device)
is kept across multiple systems and is likely to become inconsistent if feedback
is not automated.
For our large-scale deployment, we addressed these problems and have seen
major improvements in our deployment results. The first correction was to prevent
surveying errors on critical metadata. We implemented barcodes to record the
unique IDs of sensors and phone applications, and we equipped the field officers
with feature phones so they could text the participant to verify the participant’s
phone number and take a picture of the sent text message.
The second correction was to develop custom software responsible for automatically (1) keeping state consistent across all databases, (2) communicating errors to
the field team, and (3) implementing corrections to survey data when updates are
submitted by the field team. The field team completes a set of deployment, retrieval,
and debugging surveys in SurveyCTO, and the deployment management software
automatically consumes these surveys using the SurveyCTO API. The data from the
surveys is then verified and the information distributed to the appropriate databases.
Information about surveys with errors, along with a list of non-operational devices,
is available to the field team through a web interface, and field team error corrections
6 Measuring Grid Reliability in Ghana
153
Fig. 6.7 Deployment dataflow
Notes: While traditional surveying methods have a linear data flow where data is exported
for later analysis, the integration of continuous sensing in the deployment generates feedback
loops. This in turn creates more separate places where state is stored, creates more necessity to
communicate this state, and amplifies the problem of errors during surveying. We implemented a
deployment management system to alleviate these problems. Blue arrows represent data flows that
we automated from the beginning because we anticipated their complexity before the mediumscale deployment. Red arrows represent data flows that we originally attempted to perform
manually and that we now automate or facilitate with a deployment management tool
are communicated back to the software through a final correction survey. The
deployment management software is represented by the red arrows in Fig. 6.7.
This architecture makes the deployment significantly easier to manage. Systems
like these are necessary for both deploying and maintaining a continuously running
sensor network, especially one in which the state of the deployment is constantly
changing due to direct interaction with participants.
154
N. Klugman et al.
4.2 Global Solutions May Miss Local Context
Several times in our deployment we were forced to consider tradeoffs between
using technology and services developed and operated locally and similar solutions
developed by larger companies targeting global scale. Specifically, we made this
decision in both our choice of the cellular network provider and the service used
to send airtime incentives to participants. Unsurprisingly, we found local service
providers were more likely to provide high-quality service in Ghana compared to
US-based companies, which had only nominal ability to operate globally (and little
experience or market in doing so). Even our largest scale was not large enough to
get dedicated support contracts with these US-based companies.
At the same time, we found local providers did not handle our medium- or largescale deployments flawlessly. Our airtime top-up provider was not technically ready
for the scale of our medium and large deployments, and neither the airtime provider
nor MTN was prepared to bill and support our enterprise accounts. Therefore, to
continue to scale, we went back to evaluating mobile virtual network operators
(MVNO) and global airtime top-up providers, aiming to find companies with
demonstrated experience in Ghana and similar geographies. After evaluating several
MVNOs and airtime top-up firms, we found a set of global companies that provide
a good mix of technical maturity, experience in handling enterprise customers, and
reliable service in Ghana and other countries.
4.3 University Lacks Financial Agility
One of our primary organizational problems was the inability to pay for the various
services necessary to perform our deployment. This was not for the lack of available
funding but a mismatch with the administrative capacity in academia.
While our university policy dictates a single-day turnaround on wire transfers, in
practice this often took over 15 days. Setting up subcontracts with companies, especially companies with which the university had never contracted before, often took
months, and our deployment required numerous contracts because our technology
relies on external service providers. As a result, changes to our deployment plan –
even weeks in advance – would often cause major issues. Even if we thought there
was enough time for payment prior to a deployment, members of the research team
still frequently resorted to using private financial resources, maxing out personal
ATM limits in Ghana to support deployment activities.
Additionally, the university does not have good mechanisms for supporting
recurring but inconsistent costs (such as a pay-per-use cloud service) because every
change in cost requires approval. We found it significantly easier and more reliable
to front payments for these critical services via personal credit card.
If we were to plan for this deployment again, we would build in significantly
more time for delays and send more money than necessary to our stakeholders in
6 Measuring Grid Reliability in Ghana
155
Fig. 6.8 Participant perception of sensors (a) Was DumsorWatch or PowerWatch preferred? (b)
Are you likely to download DumsorWatch when . . . ?
Ghana early in the deployment so they could better handle later delays in payment
from the university. Even still, it would be difficult to imagine the deployment
running at its described pace without the research team extending personal credit.
4.4 Technology Usage Patterns Impact Design
Our system depends on participants to download apps and install sensors in
their homes or businesses. To validate our methodology in the local context,
we completed an endline survey with 462 participants from the medium-scale
deployment before launching the large-scale deployment. The results of this survey
proved surprising and critical for the design of the next level of scale.
We asked participants what they thought of the sensors. Figure 6.8a shows that
participants liked both PowerWatch and DumsorWatch, with a slight preference
for PowerWatch, challenging our assumption that the mobile app would seem less
invasive than a physical device. Better understanding this inversion remains future
work, but one hypothesis is that mobile phone resources are scarce and highly
valued.
We then explored how incentives influence participation. Figure 6.8b shows that
real-time information about local outages was valued highest, indicating a strong
156
N. Klugman et al.
Fig. 6.9 Participant-reported reasons why sensors were uninstalled (a) PowerWatch (b) DumsorWatch
local desire for energy-reliability data and suggesting data alone could be effective
in incentivizing participation.
Even so, many participants either uninstalled DumsorWatch from their phone
or unplugged PowerWatch from the wall. We asked participants about the root
cause of these behaviors. Figure 6.9a shows that people unplugged PowerWatch
for many different reasons, some of which could likely be addressed through better
information sharing (“to protect the device,” “during power outages,” “consuming
too much electricity”) or through more careful user interface design (“thought it was
plugged in”). These lessons will be incorporated in field officer training for future
deployments.
More challenging are the results from Fig. 6.9b, which indicate a high degree of
fluidity in mobile phone usage. In particular, formatting and “flashing” (resetting)
phones were significant user interactions that our team was not familiar with. Also,
large numbers of phones broke. Our methodology never asked a participant to
reinstall the app because we assumed it would stay installed, and this assumption
did not map to the local context.
The results of this survey were important for improving system performance
and would have been even more effective if we had run it earlier. The successful
deployment of any technology hinges on its suitability to the local context.
Developing an early understanding of the potential risks, for example, through
qualitative surveys or focus groups, can help inform the design of a technology
while there is still ample scope to do so.
5 Conclusion
When first approached with the opportunity to run a deployment at scale in Accra,
our team was naively confident. We were able to decompose the larger task of a
deployment into subsystems, each of which we could effectively engineer. However,
well-designed subsystems are not enough. Critically, we overlooked the human links
6 Measuring Grid Reliability in Ghana
157
between these systems, leading to problems not due to sensors malfunctioning but
instead from the complexities of sensor placement and upkeep. This meta-task of
deployment management was not forgotten but neglected for the more traditional
engineering tasks, like pushing for a more fully featured firmware in PowerWatch
or a better-tested implementation of DumsorWatch.
Despite these hurdles, we conducted a largely successful deployment that met all
of our design goals. This was only achieved through effort from a large and creative
team, a resource that many research groups cannot easily obtain.5 In reaction to
specific pain points at larger scales, we developed meta-tools, not to replace the
human links but to assist them.
We hope that by identifying and describing these meta-tools, as well as our
broader collection of lessons learned, we lower the barrier to entry for conducting
similar-scale deployments. This is a goal worth working towards. Insights gathered
from direct deployments of sensors around the world will be critical for achieving
deeper understanding how critical life sustaining systems operate and, eventually,
how they can be improved. To realize this, the development engineering community
will have to work to reduce the costs and complexities of performing deployments. Steps towards this may include continually sharing lessons learned, making
software meta-tools available and open-source and setting up incentive systems
within academia to help engineering researchers value innovation in methodology,
reliability, and scale-ability as highly as innovation in any other more traditional
high-order subsystems.
Discussion Questions
1. When planning an interdisciplinary project, how should you deal with differences in timelines, goals, or expectations between stakeholders from different
disciplines or with different incentives?
2. When planning a real-world deployment, how do you balance and prioritize your
expected contributions to science (direct professional benefit) and your expected
contributions to the population under study (direct societal benefit)?
3. What do you do when a project unexpectedly requires a skill you have not
received training in?
5 This work was supported in part by the Millennium Challenge Corporation through the Development Impact Lab (USAID Cooperative Agreement AID-OAA-A-13-00002), part of the USAID
Higher Education Solutions Network, in part by funding from the Department for International
Development Energy and Economic Growth initiative (DFID EEG Project A0534A), and in part by
the CONIX Research Center, one of six centers in JUMP, a Semiconductor Research Corporation
(SRC) program sponsored by DARPA. We additionally thank CEO Martin Eson-Benjamin, CFO
John Boakye, Director Dr. Kofi Marfo, Sharon Abena Parku, and the entire team at the Millenium
Development Authority (MiDA); Jeff Garnett, Hana Scheetz Freymiller, and the rest of our partners
at the Millennium Challenge Corporation (MCC); Karen Notsund; Nana Bonku Eshun; Kobina
Aidoo; Ivan Bobashev; Aldo Suseno; Revati Thatte; Lane Powell; and staff from the Electricity
Company of Ghana, SMEC Ghana, and ESB International. Finally, we thank the Field Supervisors
and Field Officers in Accra who put in many hours of hard work to implement, improve, and
maintain our deployment.
158
N. Klugman et al.
4. How do you assess the efficacy of a service provider when you will be the first
to empirically test their capacity to scale in a given market?
5. After your research study is complete, what stakeholders will manage your
deployment? How will you ensure the infrastructure is useful and usable for
them? What is your handoff plan, both for short-term management and long-term
maintenance?
6. Where is information stored in your system, what are the sources of this
information, and what other systems depend on this information? Are systems
in place to ensure that information is correct and consistent for different data
consumers?
References
Acakpovi, A., Abubakar, R., Asabere, N. Y., & Majeed, I. B. (2019). Barriers and Prospects of
Smart Grid Adoption in Ghana. Procedia Manufacturing. In 2nd International Conference on
Sustainable Materials Processing and Manufacturing.
Ackah, C. (2015). Electricity insecurity and its impact on micro and small businesses in Ghana.
In Study presented at Institute of Statistical, social and economic research (ISSER) workshop.
University of Ghana, Legon.
Aidoo, K., & Briggs, R. C. (2019). Underpowered: Rolling blackouts in Africa disproportionately
hurt the poor. African Studies Review, 62, 3.
Banuenumah, W., Sekyere, F., & Dotche, K. A. (2017). Field survey of smart metering implementation using a simple random method: A case study of new Juaben municipality in Ghana. IEEE
PES PowerAfrica.
Bowers, B. (1988). Social benefits of electricity. IEE Proceedings A (Physical Science, Measurement and Instrumentation, Management and Education, Reviews), 135, 5.
Clerici, C., Taylor, M. S., & Taylor, K. (2016). Dumsor: The electricity outages leaving Ghana in
the dark. Al Jazeera.
Electricity Company of Ghana. (2019). Prepayment Metering.
Energy Commission Ghana. (2019). National Energy Statistics 2000–2019.
Gertler, P. J., Lee, K., & Mobarak, A. M. (2017). Electricity reliability and economic development
in cities: A microeconomic perspective.
Google. (2009). The bright side of sitting in traffic: Crowdsourcing road congestion data. Official
Google Blog.
Google. (2018). Google Play services discontinuing updates for API levels 14 and 15. (Dec 2018).
https://android-developers.googleblog.com/2018/12/google-play-servicesdiscontinuing.html
Hamidu, M., & Sarbah, A. (2016). An assessment of the electrical energy needs of beauty saloon
industry in Ghana. American Journal of Management Science and Engineering, 1(2).
He, J., Cheng, L., & Sun, Y. (2007). Transformer real-time reliability model based on operating
conditions. Journal of Zhejiang University-Science A, 8(3).
IEEE Guide for Electric Power Distribution Reliability Indices. (2001). IEEE Std 1366, 2001
Edition (2001), i–. https://doi.org/10.1109/IEEESTD.2001.94438
Klugman, N., Rosa, J., Pannuto, P., Podolsky, M., Huang, W., & Dutta, P. (2014). Grid watch:
Mapping blackouts with smart phones. ACM HotMobile, 14.
Klugman, N., Correa, S., Pannuto, P., Podolsky, M., Taneja, J., & Dutta, P. (2019). The open
incentive kit (OINK): standardizing the generation, comparison, and deployment of incentive
systems. ACM ICTD ’17.
6 Measuring Grid Reliability in Ghana
159
McCollum, D., Gomez Echeverri, L., Riahi, K., & Parkinson, S. (2017). SDG7: Ensure access to
affordable, reliable, sustainable and modern energy for all (pp. 127–173). International Council
for Science. https://doi.org/10.24948/2017.01
Millennium Challenge Corporation. (2008). Guidance on Common Indicators.
Millennium Development Authority. (2014). Power distribution feasibility studies, Ghana Phase II
Feasibility Assessment.
Millennium Development Authority. (2018). Ghana monitoring and evaluation plan.
Nunoo, S., & Ofei, A. K. (2010). Distribution automation (DA) using supervisory control and
data acquisition (SCADA) with advanced metering infrastructure (AMI). IEEE Conference on
Innovative Technologies for an Efficient and Reliable Electricity Supply.
Quayson-Dadzie, J. (2012). Customer perception and acceptability on the use of prepaid metering
system in Accra west region of electricity company of Ghana. Ph.D. Dissertation.
SurveyCTO. (2019). Because your data is worth it. https://www.surveycto.com/. Accessed on
03/15/2019.
Sustainable Energy for All. (2018). Sustainable energy for all: Monitoring, evaluation, and
learning framework.
Taneja, J. (2017). Measuring electricity reliability in Kenya. Technical report. Working paper.
Available at http://blogs.umass.edu/jtaneja/files/2017/05/outages.pdf
The GridWise Alliance. (2013). Improving Grid Reliability and Resilience: Workshop Summary
and Key Recommendations. https://www.energy.gov/sites/prod/files/2015/03/f20/
Open Access This chapter is licensed under the terms of the Creative Commons Attribution 4.0
International License (http://creativecommons.org/licenses/by/4.0/), which permits use, sharing,
adaptation, distribution and reproduction in any medium or format, as long as you give appropriate
credit to the original author(s) and the source, provide a link to the Creative Commons license and
indicate if changes were made.
The images or other third party material in this chapter are included in the chapter’s Creative
Commons license, unless indicated otherwise in a credit line to the material. If material is not
included in the chapter’s Creative Commons license and your intended use is not permitted by
statutory regulation or exceeds the permitted use, you will need to obtain permission directly from
the copyright holder.
Chapter 7
Monitoring Industrial Pollution in India
Anant Sudarshan
1 The Development Challenge
As India has developed, so has her demand for energy. This demand has largely been
met with abundant, inexpensive, and highly polluting fossil fuels. These choices
have had fundamental environmental consequences, imposing costs that significantly threaten the country’s economic prospects. Perhaps the most significant of
these is the dangerously rapid deterioration in the quality of India’s air, with satellite
data suggesting an increase of over 70% in the concentration of particulate matter
2.5 (PM 2.5) between 1998 and 2016.1
Air pollution now poses one of the most severe public health challenges to the
country (Balakrishnan et al., 2019). Study after study has pointed to the general
health risks of air pollution, in terms of life expectancy for example, and additional
new research suggests that the effects of poor air quality may even extend to reduced
crop yields, lower labor productivity, and decreased cognitive skills (Chang et
al., 2019; Bharadwaj et al., 2017; Burney & Ramanathan, 2014). In other words,
the apparent trade-off between environmental protection and economic growth is
something of a Hobson’s choice—the Indian growth story cannot continue without
cleaning up the air.
Notwithstanding the poor quality of its environment, India has a fairly strong
and wide-ranging set of environmental laws. Nevertheless, these have not been
sufficient to effectively control industrial air pollution. Empirical evidence from the
1 Global time-series data of particulate air pollution concentrations is available as part of the Air
Quality Life Index, available at: https://aqli.epic.uchicago.edu/the-index.
A. Sudarshan ()
Energy Policy Institute at The University of Chicago, University of Chicago, Chicago, IL, USA
e-mail: anants@uchicago.edu
© The Author(s) 2023
T. Madon et al. (eds.), Introduction to Development Engineering,
https://doi.org/10.1007/978-3-030-86065-3_7
161
162
A. Sudarshan
highly industrialized Indian states of Maharashtra and Gujarat highlight the degree
to which factories have been found to be violating pollution norms. In the cities of
Surat and Ahmedabad in Gujarat, for instance, Duflo et al. (2013) collected data
from hundreds of industrial plants and found that about 35% were polluting above
the legally-prescribed limits. In Maharashtra, Greenstone et al. (2018) digitized
over 13,200 regulatory pollution tests, spanning the period from September 2012 to
February 2018, and found over half to reveal exceedances in the regulatory limits.
One reason why Indian manufacturing emissions pose a particularly thorny
challenge to understaffed environmental regulators is that it is difficult to monitor
a large number of highly polluting but relatively small factories.2 In the state of
Maharashtra, for instance, data collected between 2017 and 2020 showed that even
when considering only the largest plants, the frequency of pollution testing remained
well below once per year, on average.
The development challenge therefore has two parts. First, how can we reduce
industrial air pollution in an expansive and rapidly developing country like India?
And second, how can we improve the quality of air pollution data available to
regulators, and can these types of improvements help reduce air pollution?
One promising solution to this challenge is the use of Continuous Emissions
Monitoring Systems (CEMS). These instruments are installed in the smokestacks
of factories where they continuously measure the concentration (or mass) of the air
pollution that is being emitted. The data collected are then transmitted in real time
to a remotely located computer server, vastly improving the quality of information
available to the environmental regulators.3
This case study discusses a project that aimed to evaluate the impacts of CEMS
in a large-scale randomized control trial (RCT) conducted in partnership with the
Gujarat Pollution Control Board (GPCB), the environmental regulator in the state of
Gujarat in India. The goal of the project was to see whether the “big data” generated
through CEMS could spur improved regulatory actions, thus lowering air pollution.
While CEMS is not a new technology per se, its deployment in the Indian setting was
novel. As we learned from our experience, technology acts through the interaction
of human beings and hardware. As such, its effectiveness cannot be divorced from
the incentives and capabilities of the people using it. Consequently, a central theme
running through this chapter is the importance of evaluating a technology within the
specific institutional and economic context in which it will be used.
The remainder of this chapter is structured as follows. In Sect. 2, we provide
background information on the setting for the project, including how it was conceptualized and implemented, as well as findings from related research. In Sect. 3,
we describe the CEMS technology in more detail and how the pilot implementation
2 In India, 33% of manufacturing output comes from small-scale plants, located in about 6,000
clusters scattered across the country (Shah et al., 2015).
3 An analogous technology to CEMS is the smart-meter, which measures electricity consumption,
although the gap between CEMS and the status-quo of periodically manually sampling air pollution
emissions is greater than the gap between smart-meters and the older electromagnetic metering
technology.
7 Monitoring Industrial Pollution in India
163
was designed to enable rigorous measurement of its benefits. In Sect. 4, we provide
some novel results on the impacts of CEMS on industrial air pollution in India. In
addition, we discuss what it means for a technology intervention to “work” or to be
“successful” in a developing country context. Section 5 concludes.
2 Context
There is no single cause for the problem of excessive industrial air pollution in India.
As is mentioned above, the performance of India’s existing regulatory framework
has been far from perfect. Low institutional capacity and expertise, high transaction
costs in taking legal action, corruption, high compliance costs for industry, and poor
data have all contributed to this problem in varying degrees.
The starting point for this project is the ground-breaking RCT by Duflo et al.
(2013, 2018), which studied the role of information and monitoring in regulating
industrial air pollution in Gujarat. When Duflo et al. began this work in 2010, air
pollution levels were rising across industrial cities in Gujarat. When third-party
laboratories were used to audit the emissions of these factories, however, there
appeared to be widespread compliance with environmental standards. This was a
puzzling result. How could these test results be reconciled with the common sight
of black air rising out of hundreds of small chimneys in and around Gujarati cities?
To answer this question, Duflo et al. ran a 2-year RCT in partnership with
the Gujarat Pollution Control Board, the state environmental regulator. First, the
study shed light on how the regulator was crippled by a persistent culture of data
falsification. It documented collusion between the industrial plants and the auditors
that were supposed to report on their performance. Next, the study evaluated an
intervention designed to resolve this problem of collusion by severing the conflicts
of interest, namely, by shifting the auditor hiring and payment decisions away from
the individual plants and towards the government regulator.
Although the researchers were able to provide a partial solution to the monitoring
problem (by making the audit reports more accurate), manual testing remained an
infrequent and expensive method of gathering data. The regulators would still be
unaware of how much the industries were emitting on a regular basis. In addition,
the status quo emissions audits could not say anything about what the factories were
doing when they were not being actively tested. In consequence, they were perhaps
best viewed as simply an assessment of how industrial plants performed when on
their best behavior.4 Overall, Duflo et al. (2013, 2018) suggest that high-quality,
4 Differences between in-test and in-operation pollution levels have been found in other settings.
For instance, in 2015 the United States Environment Protection Agency uncovered systematic and
deliberate differences between on-road and in-test pollution from diesel Volkswagen cars, resulting
in worldwide fines and vehicle recalls.
164
A. Sudarshan
continuous information might be necessary to know which plants were polluting the
most and that these monitoring improvements could potentially reduce emissions.
2.1 How Was the Project Location Chosen?
Large field experiments involving partnerships between researchers and the government are often opportunistic, and a function of the initial interests of individual
politicians and bureaucrats. In this case, India’s Minister of Environment, Forest,
and Climate Change felt that CEMS might not only solve the information problem
but could also be a first step towards implementing market-based methods of
environmental regulation. The project described here was thus the first attempt in
India to carry out a systematic field evaluation of the effectiveness of CEMS. It also
became the precursor to India’s first cap-and-trade market for industrial particulate
pollution, which was launched in Surat in 2019.
The location of the CEMS pilot itself shines some light on the myriad forces
that determine how and where a policy innovation is first implemented. The project
initially involved the state governments of Gujarat, Maharashtra, and Tamil Nadu,
three of the largest industrial states in India. However, requiring industrial plants
to install CEMS proved to be politically and administratively difficult for a number
of reasons. For example, the technology was untested, and several implementation
challenges could be foreseen. For risk-averse regulators, there was a potential
downside to being the “first mover” on a project that might not end well. In addition,
the installation of CEMS devices would impose a significant cost on polluters—in
the order of several thousand dollars—and this would surely result in pushback and
reluctance on the part of the industrial factories.
Furthermore, up to that point, there was no precedent to using CEMS data as
the basis for prosecuting industrial polluters. Indian environmental law is built upon
criminal penalties. The basis upon which plants can be found to be in violation
of pollution limits is enshrined in the laws. New methods of monitoring cannot
be easily used as the legal basis for regulatory actions without evidence of their
reliability and accuracy. In sum, requiring plants to install equipment that had
not been granted legal status posed challenges that would understandably create
industry resistance.
Eventually, the government of Gujarat was able to prevail upon the industry
association of the city of Surat to support (or at least not oppose) the use of CEMS
devices. Surat is a hub for the textile industry and is the site of a dense manufacturing
cluster of hundreds of relatively small-scale plants that typically burn solid fuels.
One potential reason for their agreement is that the government informed them
that CEMS would later be used to introduce emissions markets. This acted as a powerful incentive for the manufacturing plants. It changed the impression surrounding
the equipment installation mandate from a pure negative (e.g., regulation would not
change, while monitoring would increase and expensive equipment would have to be
purchased) to a potential opportunity. Market-based regulation had been repeatedly
7 Monitoring Industrial Pollution in India
165
recommended in India as a potential solution to the inflexibility, uncertainty, and the
high costs associated with status-quo regulation.5
2.2 Identifying the Experimental Sample
Having identified Surat as a project site, a decision needed to be made on how to
select the initial sample of plants that would be transitioned to the new technology.
This filtering process was driven by the potential of a plant to harm people through
air pollution, as well as by the limitations of the technology itself. As a starting point,
the sample of eligible plants was first restricted to factories located within 30 km of
the city center, in order to focus attention to the plants that were located in the most
densely populated areas. For a sense of scale, the metropolitan population of Surat
was about 6.5 million, with a density of over 4000 people per square kilometer.
Conditional on being located within this radius, a factory needed to be burning
solid or liquid fossil fuels and needed to have a stack (i.e., chimney) large enough
to accommodate a CEMS device. This led to a sample of 373 plants. Most of these
plants were operating in the textile sector (over 94%) and were burning coal (37%)
or lignite (27%). Over the course of the multiyear project, 42 plants closed down
due to an economic downturn in Gujarat, which correspondingly reduced the pilot
sample size.
In the case of the other two states, Maharashtra and Tamil Nadu, there was no
suitable set of plants that could be transitioned to CEMS, despite multiple years of
efforts on our part. Thus, the geographic scope of our overall CEMS research effort
shrank from three states to one.
The point of recounting this history is to underscore that the location of
technology pilots, as well as the population involved, emerge through multiple
layers of deliberate or accidental selection. This means that it is worth paying
attention to the external validity concerns for any given technology deployment. In
this case, the impacts of rolling out CEMS in Gujarat may not apply in Maharashtra
or Tamil Nadu. For instance, if the plants that are successfully able to resist CEMS
also happen to be politically well-connected and more difficult to regulate, then
what we learn about the impacts of CEMS on our pilot population would not apply
to other populations.
5 For example, in the previous year, India’s Ministry of Environment, Forests, and Climate Change
had constituted a High Level Expert Committee to review environmental legislation and regulation
in the country. The committee had recommended a paradigm shift in the tenet of pollution control
from the existing “command and control” approach to a “market-based” approach that would
include innovations like “cap-and-trade” programs.
166
A. Sudarshan
2.3 How Does CEMS Work?
Continuous Emissions Monitoring Systems (CEMS) for particulate emissions
consist of a network of hardware devices and software programs that link monitored
industrial plants to the environmental regulator in a manner that allows emissions
data to be securely transmitted at regular intervals. The CEMS hardware components required at each industry site consist of the following:
1. Particulate matter (PM) CEMS analyzer and flow meters to measure the mass of
pollutants emitted.
2. Data logger unit for saving records on-site, in case of Internet failure.
3. Data acquisition system (DAS), normally consisting of an on-site computer and
a server at the site of the regulator.
4. Software to visualize and analyze CEMS emissions data.
The CEMS analyzer for particulates is a device that relates the physical properties
of emissions from a factory chimney to the concentration (or mass flowrate) of
suspended particles in the air. For example, optical devices measure the attenuation
in the intensity of a laser beam sent through smoke. An alternative technology
exploits the so called “triboelectric” effect and relies on measuring the electric
charge induced by the movement of particles near a probe.
These approaches to measurement are “indirect” since they measure a property of
the gas that is used as a proxy for the presence of solid particles. As a consequence,
these devices must first be calibrated against manual readings that directly measure
the weight of particles in a specified volume of exhaust. In other words, an electrical
signal generated by the analyzer must be mapped to a value of particulate emissions.
Typically, this mapping is obtained by fitting a linear model relating a set of manual
measurements taken at different levels of boiler loads (typically nine readings) to
the corresponding measures of current produced by the analyzer. This delivers an
equation y = a + bx where x is a current reading in amperes, y is an estimate of the
concentration of pollutants, and a and b are parameters estimated during an initial
calibration process.
3 Innovate, Evaluate, Adapt
There is a well-known management cliche that, “if you can’t measure it, you can’t
manage it.” There is some truth to this when it comes to regulating industrial
emissions. When the government is unaware of how plants are behaving most of
the time, they have little ability to target regulatory actions, and may have no legal
basis to penalize otherwise polluting factories who manage to pass the occasionally
scheduled tests. Furthermore, from the point of view of human health—the ultimate
motivation for environmental regulation in the first place—what matters is not how
much pollution a plant emits at any given point in time but the cumulative mass
7 Monitoring Industrial Pollution in India
167
released into the ambient air over a period of time. A highly polluting plant operating
for only a few days in the year might fare the worst on a one-off manual test. But it
may in fact be a lot less harmful than a “cleaner” plant that is operating 24 h a day,
365 days a year.
All of this suggests that if regulators are to do their job properly, they need
information that identifies which plants are polluting. Unfortunately, the standard
method for measuring factory air pollution, which is commonplace around the
world including in India, involves a painstakingly manual process. To measure
the concentration of suspended particulate emissions, a team of engineers must
extract a sample of air from the smokestack of a factory while carefully following
a prescribed protocol. This air sample must then be transferred to a laboratory
where solid particles are dried to remove moisture and then weighed. The mass
of these collected particles is then converted into a concentration measure after
“normalizing” the volume of air extracted by standardizing it to a particular
temperature and pressure. The whole procedure is labor- and time-intensive. The
CEMS technology improves matters by transmitting emissions data in real time,
directly from the chimney of a plant to the regulator. In comparison to the manual,
point-in-time, method of measurement, the CEMS technology offers a potentially
dramatic improvement.
There are a number of possible benefits from CEMS. Improving the information
available to environmental regulators could allow existing rules to work better,
for example, by allowing the government to target inspections and use calibrated
penalties on the worst offending plants. CEMS could also open up the possibility
of new forms of regulation that are made possible by higher quality and higher
frequency data. For instance, emissions trading schemes or pollution taxes can be
introduced only when there is an accurate count of the quantity being traded or
taxed. These policy tools may have important advantages over existing “command
and control” approaches to regulation but are feasible only if there is high-quality
of data. Thus, on the surface at least, the CEMS technology would seem to provide
everything needed to resolve the challenge of monitoring plants and, in so doing, to
reduce the pollutants they release.
3.1 Setting Up an Evaluation
The goal of our pilot was to understand the impact of mandating CEMS on plant
and regulator behavior. On the side of the plants, the primary outcomes of interest
were pollution and reporting quality. On the side of the regulator, we were interested
in whether the government interacted differently with these plants, enforcing more
penalties, for instance. We were able to do this by integrating an RCT into the
implementation of the pilot project.
The evaluation initially began with a small group of installations serving as
a technical dry run. The purpose was to field-test the CEMS installation and
calibration protocol stipulated in the Government of India’s Central Pollution
168
A. Sudarshan
Control Board (CPCB) specifications. We selected 11 industrial plants (which we
refer to collectively as “Phase I”) from a cluster of factories in Surat. Next, four
different vendors supplied these eleven plants with CEMS devices, consisting of
nine DC triboelectric-based devices (measuring particulate matter (PM) mass flow),
and two electrodynamic-based devices (measuring PM mass concentration). The 11
industries were chosen to represent the diversity of the full sample and to cover
a range of boiler sizes and types of installed air pollution control devices (e.g.,
numbers of cyclons, bag filters, etc.).
The field tests were important because they showed that the error associated with
a CEMS measurement taken at any point in time disappears as multiple observations
are added together. These sorts of tests provided confirmation that even if a device
noisily measured instantaneous levels of emissions, it could still provide valuable
information to determine long-run aggregate or average levels of emissions.
For the remainder of the sample, we used an RCT design to rigorously quantify
the impact of CEMS. The simplest possible design would have involved dividing
plants into a treatment group and a control group and then mandating that factories
in the former group install CEMS, while factories in the latter group are regulated
and monitored as usual. But this design would have required an enforced pause in
the rollout of CEMS, after the treatment group plants had installed their devices and
begun sending the regulator real-time data.
In our context, an enforced pause was not feasible for several reasons. First,
installing CEMS devices was a time-consuming affair because the devices were
not readily available in a still nascent market. Saturating the treatment group of
factories alone took several months due to delays in purchase orders being fulfilled,
delays in calibrating devices, and data connectivity problems that appeared at scale
(and were not encountered during implementation for the limited number of Phase
I industries.) Losing many more months of time in order to enforce a pause was
therefore unacceptable to the government. Also, it would have probably resulted in
the small number of CEMS vendors operating in the market to exit due to lack of
business, or declining to deploy the necessary staff to the field for required aftersales services.
Second, as we have mentioned, it was not easy to ensure that the industries in
Surat would comply with the new requirements to install hardware. It was believed
that the likelihood of smoothly saturating the entire population of industrial plants
would be significantly reduced if there was a long period of time during which half
of the plants in the sample were held off from placing new equipment orders.
Finally, as our work progressed, it became increasingly likely that the GPCB
would want to launch an emissions trading scheme in Surat. Thus, the effort to
set up these devices had the dual goals of understanding the impact of improved
data on environmental outcomes, and eventually measuring the impact of a marketbased approach, like cap-and-trade, to reducing industrial air pollution. All of these
considerations led both the government and the research team to want to avoid long
delays in implementation.
To meet these constraints and allow for a rigorous evaluation design, the
remaining plants were randomly assigned into three groups (Phases II, III, and IV).
Each group was mandated to install a CEMS and begin sending data to the regulator
7 Monitoring Industrial Pollution in India
169
Fig. 7.1 Timeline of CEMS rollout and data collection
Notes: Each survey was 3 months long
in a sequential manner. In this type of staggered, phased-in research design, the
plants that were mandated to install CEMS in the later phases could serve as a
comparison group for the plants that had installed CEMS earlier. For example,
once Phase II installations had begun sending data, and while Phase III plants were
installing and calibrating their devices, the Phase IV plants would still be continuing
business as usual. Thus, the outcomes for Phase II and Phase IV plants could be
compared against one another in order to estimate the causal effects of CEMS. This
was possible due to random assignment to each group.
3.2 Implementation Challenges in the Field
On paper, the experimental design was fairly straightforward. In practice, implementation was anything but simple. Figure 7.1 provides a timeline for the pilot as a
whole. The pilot began in early 2014 and ran until late 2018. From an experimental
research standpoint, the period between the second baseline survey (or midline
survey, carried out in 2016) and the endline survey (carried out in 2018) constitutes
the effective duration of the treatment. This is just a fraction of the overall duration
of the project. The 2-year period between the first baseline survey and the second
baseline survey represents a period of time in which a mature technology—that
had been readily deployed in large plants in developed countries—was effectively
unusable in Surat.
Why was this the case? The primary challenge was the interaction between the
technology and the institutions and systems around it. The most notable unexpected
challenges appeared in the process of installation and calibration of the CEMS
devices, which I now detail below.
3.2.1
Problems Encountered While Installing CEMS
The first step in setting up a functioning CEMS network is for plants to equip
themselves with the necessary hardware. This proved to be a rocky experience,
170
A. Sudarshan
in part because no well-functioning market in CEMS devices was in place when
the pilot started. This was not surprising, given that there was no demand for
CEMS before the equipment mandate. This posed several challenges to pilot
implementation.
The most important of these was the near complete absence of after-sales service
and trained personnel. Initially, the goal of the equipment vendors was to make
a one-time sale, under the assumption that the pilot was likely to be an isolated,
one-off experiment. Investing in trained staff to be based in Surat likely made little
business sense for many of these companies. High-quality service contracts were
likewise unavailable. The consequence was a host of equipment problems that could
not be properly addressed and industry dissatisfaction with the technology, creating
a fragile ecosystem prone to breakdowns. Only after several months of persuasion
and pressure by the government on the manufacturers and vendors of CEMS devices
did the situation improve.
A second area which proved to have several teething problems was the implementation of a robust data acquisition system to transfer emissions information
from industrial sites to the state regulator. Two aspects of the prevailing ecosystem
made this hard. First, different CEMS vendors used varying, proprietary data
storage formats, making it difficult to create a common platform that might be
able to read and transfer data. Second, industries in Surat frequently had poor
Internet connections, old computers, no dedicated IT staff, and faced occasional
power outages that would force a complete reset of the system. These issues
are commonplace in developing countries but are not necessarily the focus of
manufacturers of CEMS technology. Creating IT and data storage systems that were
robust to these weaknesses proved to be challenging and time-consuming.
Finally, since the equipment mandate merely required industrial polluters to
install a CEMS device, many industries chose the lowest price and lowest quality
option. This type of equipment choice enabled plants to initially meet the regulatory
requirement without incurring a large upfront payment but heightened the costs
associated with the lack of after-sales service. Thus, several months after initial
installation, some of these plants found their devices to be dysfunctional and new
purchases became necessary, which set back the overall timeline for the experiment.
3.2.2
Problems Encountered While Calibrating CEMS
CEMS devices also need to be calibrated before being used. If the initial calibration
parameters are misreported, the subsequent measurement of emissions will be
biased. The calibration step requires plants to work with equipment vendors and
environmental auditors to make manual measurements and then correlate these
with the electrical output from the CEMS analyzers. The calibration requirement
is crucial because it represents an important mechanism through which data can be
falsified, in a similar way to the corruption noted in Duflo et al. (2013).
Calibration will not cause problems in a laboratory environment. However, it
is exactly the sort of weakness that can render a technology unreliable in the
7 Monitoring Industrial Pollution in India
171
Fig. 7.2 Examples of potentially invalid CEMS data
Notes: Suspicious data transmitted by four CEMS devices during the month of December 2019.
Clockwise from top left. (1) Zero values indicate device disconnection in a Type-1 device; (2)
flatline values can result either from voltage top-censoring or a probe which has not been cleaned;
(3) abnormally low variance suggests wrongly calibrated device or voltage amplification settings;
(4) sudden decreases in overall emission levels are suspicious, and sudden changes in variance
suggest tampering of voltage amplification settings
field. Importantly, the calibration process requires information from outside the
CEMS itself, since CEMS must be used in conjunction with data from a different
method of measurement. This means that the issues that can affect the manual data
collection process can also affect CEMS. In sum, we cannot evaluate CEMS without
considering the underlying economic incentives of the calibration agents and the
institutions that influence them.
Early on in the project, there were several instances of CEMS transmitting
unreliable data, whether deliberately falsified or not. Figure 7.2 provides examples
of data that can be identified as unreliable through visual inspection or a series of
automated data checks. Mitigating these problems in the field was not easy and
required a combination of measures including: regular data validation; statistical
tests on the emissions time series; double-blind calibration, where the lab involved
in testing manual samples is separated from those collecting samples; encryption
of transmitted data; and regular spot-checks following calibration. All of these
measures needed to be developed from the ground up, significantly reducing the
degree to which these devices could be treated as a “plug-and-play” solution to the
information problem.
172
A. Sudarshan
Table 7.1 Regulatory actions tied to emission measurements with CEMS
Action
Send SMS warning
Send formal warning letter
In-person meeting with plant management
Regulator site visit and pollution test
Legal show-cause notice
3.2.3
Criteria
Among the five highest polluters in the last week
Among the five highest polluters in the last 2 weeks
Among the five highest polluters in the last 3 weeks
Among the five highest polluters in the last 4 weeks
Industry fails on-site pollution test
Linking Data to Regulatory Practice
The installation of a CEMS analyzer in a factory chimney is unlikely to be useful in
isolation. It is not uncommon for governments to accumulate large quantities of data
without using them to guide policy. In order for the CEMS technology to achieve
its potential, the environmental regulator needs to determine how the resulting data
will be analyzed and used. Defining data use protocols in advance would seem to be
an essential factor contributing to the success of this technology.
The GPCB chose to institute—but did not perfectly implement—a detailed
Action Matrix linking the data they received to regulatory action. Plants were
penalized if they did not transmit data regularly and if their pollution levels exceeded
the specified thresholds. Table 7.1 summarizes the key features of this protocol.
4 Did CEMS Work?
In a narrow sense, we might regard a technology as “working” if it delivers in the
field a performance that is very close to the design specifications determined in a
lab or via controlled engineering trials. This definition is not very useful from the
perspective of a policymaker. Thus, a slightly broader definition is to define CEMS
as “working” if it delivers useful data. The extent to which CEMS data is useful
depends on both its information content and its potential value to regulators.
Yet even this broader definition may also be inadequate. Even if CEMS delivered
valuable information, it might not result in lower levels of pollution. Changes in the
behavior of industrial plants are likely to occur only if the regulator uses the new
information to change the incentives for plants to pollute. Institutional weaknesses,
rent-seeking, political patronage, and other implementation failures could lead to
regulators ignoring to act upon these improved sources of information. In this
section, I report on some of the descriptive and experimental results from our
deployment, in order to assess the technical performance, usefulness, and impact
of CEMS in Gujarat.
7 Monitoring Industrial Pollution in India
173
4.1 Assessing the Technical Performance of CEMS
Suppose we define a working CEMS device as an instrument that reliably delivers a
signal that accurately represents plant emissions. An important insight from our
experiment was that the CEMS devices did not automatically work until they
were coupled with regulatory measures that appropriately aligned the incentives
of plants and vendors with those of the regulator. As discussed, the mandate to
install CEMS devices was followed by a host of implementation challenges. Some
of these reflected difficulties that are widespread in developing countries, including
poor infrastructure or the absence of trained staff in factories. Others, such as
the paucity of after-sales service, arose out of market weaknesses that were a
consequence of mandating purchases in a very nascent market. Still others arose
from the opportunity for data falsification created by the calibration requirement.
Although improper calibration does not reflect an engineering failure, the ease with
which regulatory devices can be gamed is quite fundamental to an assessment of the
technology’s effectiveness.
However, although the new monitoring system was not technically perfect at
the outset, it improved steadily and significantly until it reached a point where a
meaningful experimental evaluation could be conducted. Some of this improvement
occurred after the environmental regulator introduced the Action Matrix, shown in
Table 7.1. This is because this protocol created the first real set of consequences
for plants that did not maintain their devices, failed calibration audits, or did not
transmit data regularly. Statistical checks were later developed to automatically
identify plants whose data suggested the possibility of miscalibration or tampering,
further improving matters. Figure 7.3 shows that after the final calibration, a strong
relationship existed between CEMS readings and concurrently measured manual
measurements.
Figure 7.4 shows the history of CEMS uptime rates for 66 industrial plants, with
the regulatory measures taken by the Gujarat Pollution Control Board marked with
vertical lines. The performance of CEMS appears to improve with the introduction
of each measure. Eventually, a high level of data availability is achieved.6 This
evidence has important implications for how a new technology is introduced and
used. It seems intuitive that new regulation should be introduced only after the
underlying technology is working very well. However, our experience suggests that
the presence or absence of regulation cannot be disconnected from the performance
of the enabling technology. In other words, in order to achieve an equilibrium
involving a well-functioning CEMS network, it may be necessary to introduce
regulation that commits to using the data generated by CEMS, even before all of
the technical problems are resolved.
6 Data availability is only one aspect of a CEMS device working well, the other being the accuracy
of data which in turn requires high quality calibration.
174
A. Sudarshan
Fig. 7.3 Accuracy of CEMS data
Notes: Correlation between CEMS reading and PM sample. The figure shows data the data from
calibration of CEMS devices. The figure shows the normalized values of the PM samples and
CEMS readings per industry, and the red line shows the fitted values
Fig. 7.4 Average CEMS data availability at 66 industrial plants
Notes: Average percentage data availability from CEMS devices over time where periods of no
transmission from a plant are set as zero. The introduction of the action matrix in February 2018
was followed by a significant improvement in performance. The introduction of an emissions
trading scheme in July 2019 produced similar results
7 Monitoring Industrial Pollution in India
175
Fig. 7.5 CEMS data transmitted before, during, and after an in-person emission inspection
Notes: This plant appears to be strategically reducing emissions while being tested
4.2 Assessing the Usefulness of CEMS
CEMS are intended to augment an existing testing protocol in which the main
problem is that information is only collected at a single point in time. The case
for CEMS is based in part on the notion that continuous data is more useful as a
measure of environmental performance than a single snapshot.
To investigate this, we examined periods of time in which we could compare
readings from CEMS devices to manual samples collected by the GPCB. Recall
that these manual samples formed the basis of regulation in the status quo. There
are two potential sources of bias. First, there is the falsification of data identified
in Duflo et al. (2013). Second, there is possible bias stemming from the fact that
plants may behave differently when they are being tested to when they are operating
normally.
Figure 7.5 shows a comparison between manual and continuous data for a
plant in Surat. For this plant, it is striking how the period of time in which the
manual sampling takes place is entirely unrepresentative of pollution at all other
times. This suggests that relying on manual tests alone could result in significantly
underestimating how much a plant is contributing to air pollution. Furthermore, the
variation in emissions levels over time suggests that even if there were no systematic
bias associated with pollution performance during testing periods, it is unlikely that
extrapolations based on a single observation could reasonably approximate the true
levels of pollution released by the plant.
176
A. Sudarshan
4.3 Estimating the Impact of CEMS on Pollution Emissions
The third measure of success relates to whether or not CEMS reduced pollution
emissions, which is the ultimate goal of the policy intervention. According to this
measure, we found limited evidence that the technology worked.
The direct effect of requiring plants to install CEMS on subsequent pollution
levels can be estimated due to the RCT design we implemented. To rigorously
quantify the effects of CEMS, we need to not only measure what happened to
factories after installing these devices but also identify a counterfactual describing
what outcomes would have occurred absent CEMS. The phased rollout of the pilot,
combined with random assignment to different groups, meant that at the start of the
experiment, the plants that were asked to install CEMS early on (Phase 2) were on
average identical to those that were asked to install CEMS later on (Phase 4). For
this reason, any differences in pollution emissions that are observed between the two
groups after CEMS data is sent to the regulator can be attributed to the installation
of CEMS. All other factors unrelated to the technology mandate would affect both
groups equally, and thus would not bias any comparisons between the two groups.
Table 7.2 presents a comparison of baseline characteristics of treatment and
control plants in the study sample. The randomization check shows that plant
characteristics are balanced across treatment groups. Out of all of the baseline
measures reported, there are just two variables that show a statistically significant
difference between treatment groups, at the 10% level (these are the cost of recent
modifications and the number of inspections performed by the GPCB in 2014). In
Panel A we examine various costs associated with purchasing or using air pollution
control equipment. The variable costs from operations and maintenance associated
with using this equipment are significant, roughly 40% of capital costs on average.
This becomes important because the presence of equipment is easily observed
and enforceable when granting permissions for plants to begin manufacturing.
Accordingly, all these factories in our sample do possess pollution control devices
(Panel B), with cyclones being the most common. The high levels of pollution that
we observe are nevertheless influenced by the costs of operating equipment. Panel C
reports statistics on inputs and revenue from these plants and boiler and thermopack
capacities (which influence fuel use and pollution). Panel D shows that pollution
levels at baseline are remarkably high with mean levels of pollution concentration
above 300 mg/Nm3 . We also measure levels of regulatory engagement in terms of
the number of inspections conducted and legal actions required in the year of the
survey.
Table 7.3 reports the treatment effects of CEMS at endline, based on estimating
the following regression equation:
yi1 = α + βy i0 + γ T i + sit
7 Monitoring Industrial Pollution in India
177
Table 7.2 Differences in industrial plant characteristics at baseline
Treatment mean Obs Control mean Obs Difference
A
Operating cost
Maintenance cost
Capital cost
Cost of modifications
B
Number of cyclones
Number of bag filters
Number of electrostatic precipitators
Number of scrubbers
C
Asset value, Excl. Land
Yearly revenue
Number of employees
Boiler capacity (TPH)
Thermopack capacity (mKcal)
D
Ringelmann mean score
PM concentration (mg/Nm3)
Inspections
Legal
7.24
2.15
25.12
0.40
130
130
130
130
7.20
2.25
25.85
0.07
128
128
128
128
−0.056
0.200
1.337
−0.336*
2.12
0.99
0.02
1.01
130
130
130
130
2.14
0.86
0.09
1.12
128
128
128
128
0.053
−0.128
0.063
0.114
626.69
2933.72
235.21
6.17
32.81
107
123
126
130
130
802.81
4182.33
261.63
11.48
17.64
105
119
121
128
128
187.222
944.664
26.863
4.692
−16.432
1.72
368.10
2.39
0.68
130
123
130
130
1.62
335.10
2.70
0.67
128
128
128
128
−0.091
−37.536
0.332*
0.012
Notes: The column Difference is calculated from the difference of the means of both groups
controlling by cluster fix effects. Initial randomization assigned 141 industries to the treatment
group and 139 industries in the control group. The baseline includes 130 industries in the treatment
group and 128 in the control, because several plants closed between sample selection and surveying.
The variable In- spection reports the number of inspections done by GPCB the year of baseline
(2014), and the variable Legal reports the number of legal actions an industry has to comply with
during the year of baseline, 2014. All cost figures relate to the use (or purchase) of air pollution
control devices. All monetary variables are in 100,000 s INR. The Ringelmann score is on a 1–
5 scale of smoke opacity, where 1 is the least opaque (polluted). Asterisks indicate statistical
significance level (2-tailed) of difference between means: * p < 0.10, ** p < 0.05, *** p < 0.01
Here yi1 is the outcome variable for plant i measured during the endline survey,
yi0 is the baseline value, and T is a dummy indicating membership of the treatment
group. We use this model to examine changes in three outcomes: PM readings
from a manual sample taken at the plant; the logged value of the plant test result;
and a binary measure of compliance, indicating whether the test resulted in a PM
concentration reading below 150 mg/Nm3 . This value is the fixed regulatory limit
for the concentration of particulate emissions from an industry smokestack. Note
that since the treatment itself was the installation of CEMS, there was no continuous
data available for control plants.
In Column 4 of Table 7.3, we report changes in a fourth outcome variable, the
results of Ringelmann tests that we carried out at periodic intervals throughout the
178
A. Sudarshan
Table 7.3 Impact of CEMS on pollution and compliance
CEMS treatment
Baseline value
Weather controls
Ringelmann survey FE
No. of Obs.
R-squared
Mean outcome
(1) PM
−18.87
(28.65)
−0.04
(0.03)
No
No
241.00
0.05
184.53
(2) Log PM
0.06
(0.10)
−0.04
(0.06)
No
No
241.00
0.06
4.92
(3) Compliance
−0.05
(0.06)
−0.01
(0.04)
No
No
241.00
0.06
0.67
(4) Ringelmann
0.04
(0.06)
0.47***
(0.07)
Yes
Yes
1476.00
0.18
1.58
Notes: In column (1) the dependent variable is the endline PM sample. In column (2) the dependent
variable is the log of the PM samples at endline. In column (3) the dependent variable is a dummy
that takes the value of one if the firm is complying to the norm of PM of less than 150 mg/Nm3 . In
column (4) the dependent variable is the Ringelmann score for rounds after 2018. Standard errors
clustered at the plant level in parenthesis and all models include fixed effects for the industrial
region within Surat where the plant is located. Baseline value refers to the outcome variable for
each column as measured in the baseline survey. Model 4 uses panel data from three Ringelmann
surveys conducted in the year of the endline survey (2018). Models 1–3 use data measured during
the endline. Asterisks indicate coefficient statistical significance level (2 tailed): * p < 0.10, **
p < 0.05, *** p < 0.01
experiment. A Ringelmann test is a simple visual measure of the color of smoke in
the chimney stack, which is a crude proxy for the level of particulates in emissions.
These tests were repeated between the baseline and endline, providing a panel
dataset. To estimate the impacts of the treatment on this outcome, we estimate a
similar regression model to the one above, but with additional weather controls and
with multiple observations for each plant over time, rather than values captured only
at baseline and endline.
Across all specifications, we find no strong evidence that plants in the treatment
group polluted less than their counterparts in the control group. Between baseline
and endline, there was an overall reduction in both the level and variance of the
manual spot measurements of pollution. The average PM concentration at endline
was 185 mg/Nm3 with a standard deviation of 211. At baseline, the average
concentration was 338 mg/Nm3 with a standard deviation of 374. However, this
reduction occurred in both factories with and without CEMS making it difficult
to attribute the change to the new technology. This finding is a cautionary tale
underscoring why the use of a treatment and control group is so important. Had we
only looked at pollution changes in factories with CEMS, we might have noticed
they became cleaner and then credited this to the technological intervention. As it
happens, unless plants in later phases pre-emptively cut pollution in anticipation of a
future mandate (possible, but unverifiable), it may be the case that better monitoring
alone is not sufficient to solve the development challenge at hand.
Why was factory pollution unresponsive to the installation of CEMS? One
answer might lie in how the data was actually used, or not used, by the regulator.
7 Monitoring Industrial Pollution in India
179
Fig. 7.6 Probability of legal action
Notes: Conditional probability of legal action by the Gujarat Pollution Control Board as a function
of pollution measured by CEMS instruments and manual samples expressed as multiples of
regulatory standard. Dots represent mean values in bins and bars are 95% confidence intervals
Recall Table 7.1, which describes the protocol that the GPCB stated would
determine how it acted upon the continuous pollution data it received. The protocol
envisages actions of steadily increasing severity, rising to a legal notice. However,
upon examining the history of regulatory interactions at the end of the pilot, we
found that the regulators’ bark was worse than its bite. Although the first few actions
in the schedule (e.g., SMS messages, in-person meetings, and letters) were executed,
there was no significant difference between the treatment and control groups in the
probability that a plant received a legal notice or even an in-person pollution test. In
other words, when it came to taking actions that involved more than “cheap talk,”
the regulator blinked.
Interestingly, this lack of follow-through action in response to high CEMS
readings was not perfectly mirrored in the other data source available to the
regulator, namely, the results of traditional manual tests. This difference is clearly
visible in Fig. 7.6. The conditional probability of plants receiving a legal notice
significantly increases when their last manual test reveals very high readings, but
no such pattern exists when examining CEMS data. In other words, although the
continuous monitoring systems generate useful, even superior, information, the
regulator chose not to use it for targeting enforcement. If the plants understood that
this would be the case, it is unlikely that CEMS would have had an observable effect
on behavior.
180
A. Sudarshan
5 Conclusion
The experiences recounted in this case study underscore the complexity involved
in translating technology from a developed country to a developing country
context. The Surat experience with CEMS demonstrates how technical solutions
to development problems cannot be divorced from the institutional context in which
they are used. It is often impossible to identify the effect of these interactions either
in the lab or through iterative design processes in the field, because they are only
apparent in applications at scale.
In the present example, the technical pilots that preceded the RCT provided
an example of small-scale field trials based on which several technical tweaks
were made. Although this step was necessary for implementation, it was far from
sufficient. Other challenges such as calibration problems or staff capacity constraints
became apparent only when several hundred devices were deployed at once.
Development engineering requires a blend of the social sciences and engineering.
The Surat CEMS deployment was evaluated using an RCT design, drawing upon
the expertise of a team of economists. However, without continuous technical
innovations designed in situ, there would have been no intervention to test. The
eventual results were mixed, placing the spotlight on additional questions, some of
which have to do with the design of regulatory institutions and the legal framework
underlying environmental regulation in India.
In 2019, the Gujarat Pollution Control Board launched its Emissions Trading
Scheme (ETS) across a cluster of industrial plants in Surat. The Surat ETS is the
first cap-and-trade market in particulate emissions across in the world. The data
generated by the Continuous Emissions Monitoring Systems that were set up as a
part of the project we have described here went on to form the data foundation for
the ETS.
In the past, India’s environmental regulations have been criticized for being blunt
and inflexible, proving both costly for industry and difficult for the government
to implement and enforce. Market-based instruments, such as emissions trading
schemes, provide an alternative that could meet the dual challenge of economic
growth and environmental safety. Thus, the Surat ETS represents a paradigm shift
in Indian regulation, stemming in part from the recognition that no matter how well
these instruments worked, if they were used within an archaic regulatory framework,
pollution was unlikely to be reduced. In a sense, the most important impact of
these devices may have been to open up the option of using modern market-based
regulation in India, something that would have been completely impossible without
a transformation in how pollution from industry was monitored.
7 Monitoring Industrial Pollution in India
181
6 Discussion Questions
1. As a development engineer, what criteria would you apply before declaring
a technological solution a success? What types of disciplinary skills would
a research team need to possess to give them the best chance of meeting
these targets? What are the differences between the criteria for success that an
R&D lab, a venture capitalist in a startup, or a policymaker might apply when
evaluating a technology solution to a development problem?
2. The adoption of technology designed to solve development problems often
requires government support through tax-incentives, regulatory mandates, or
subsidies. On the one hand, if such policy assistance is to be entertained, then
rigorous evidence on effectiveness seems essential. On the other hand, it may
be difficult for any technology to improve without learning-by-doing and the
opportunity to iterate and improve given results in the field. Choose a technology
other than CEMS (perhaps from another chapter in the book) and discuss how
you would approach this balancing act? As policymakers, what strategies would
move us most quickly towards effective, cheap, reliable technology solutions,
and what do you think a phrase like “data-driven policy-making” should mean in
this context?
3. Can you think of ways to make it hard for plants to falsify data coming from
a CEMS device, holding the technology constant? Is there a new rule the
government might impose or additional data that could be used to cross-check
the validity of data? How would you judge the cost-effectiveness and feasibility
of these solutions in a developing country context?
References
Balakrishnan, K., et al. (2019). The impact of air pollution on deaths, disease burden, and life
expectancy across the states of India: The Global Burden of Disease Study 2017. Lancet Planet
Health, 3, e26–e39. https://doi.org/10.1016/S2542-5196(18)30261-4
Bharadwaj, P., Gibson, M., Zivin, J. G., & Neilson, C. (2017). Gray matters: Fetal pollution
exposure and human capital formation. Journal of the Association of Environmental and
Resource Economists, 4(2), 505–542. https://doi.org/10.1086/691591
Burney, J., & Ramanathan, V. (2014). Recent climate and air pollution impacts on Indian
agriculture. Proceedings of the National Academy of Sciences of the United States of America,
111(46), 16319–16324. https://doi.org/10.1073/pnas.1317275111
Chang, T. Y., Zivin, J. G., Gross, T., & Neidell, M. (2019). The effect of pollution on worker
productivity: Evidence from call Center Workers in China. American Economic Journal:
Applied Economics, 11(1), 151–172. https://doi.org/10.1257/app.20160436
Duflo, E., Greenstone, M., Pande, R., & Ryan, N. (2013). Truth-telling by third-party auditors and
the response of polluting firms: Experimental evidence from India. The Quarterly Journal of
Economics, 128(4), 1499–1545. https://doi.org/10.1093/qje/qjt024
Duflo, E., Greenstone, M., Pande, R., & Ryan, N. (2018). The value of regulatory discretion:
Estimates from environmental inspections in India. Econometrica, 86(6), 2123–2160. https:/
/doi.org/10.3982/ECTA12876
182
A. Sudarshan
Greenstone, M., Harish, S., Pande, R., & Sudarshan, A. (2018). The solvable challenge of air
pollution in India. Proceedings of the India Policy Forum, 14, 1–40.
Shah, R., Gao, Z., & Mittal, H. (2015). Innovation, entrepreneurship, and the economy in the US,
China, and India: Historical perspectives and future trends. Elsevier. https://doi.org/10.1016/
C2014-0-01381-0
Open Access This chapter is licensed under the terms of the Creative Commons Attribution 4.0
International License (http://creativecommons.org/licenses/by/4.0/), which permits use, sharing,
adaptation, distribution and reproduction in any medium or format, as long as you give appropriate
credit to the original author(s) and the source, provide a link to the Creative Commons license and
indicate if changes were made.
The images or other third party material in this chapter are included in the chapter’s Creative
Commons license, unless indicated otherwise in a credit line to the material. If material is not
included in the chapter’s Creative Commons license and your intended use is not permitted by
statutory regulation or exceeds the permitted use, you will need to obtain permission directly from
the copyright holder.
Part II
Market Performance: Technologies to
Improve Agricultural Market Performance
Lorenzo Casaburi
Introduction
This section focuses on applications of Development Engineering in agriculture,
with a geographic focus on sub-Saharan Africa. Agriculture employs a majority
of the population in most African countries. According to the recent World Bank
Development Indicators, in spite of the rapid urbanization, approximately 60% of
people in sub-Saharan Africa live in rural areas, and the agriculture employment
share is about 55%. Smallholders take a major part of the agricultural sector. Family
farms operate 75% of the world’s agricultural land. In poor countries, 60% of the
landholdings are below 2 ha, and average plot size has been decreasing over the last
few decades (Lowder et al., 2016).
Due to its centrality for economic development and poverty reduction, agriculture
has rapidly become an important focus area for Development Engineering. Innovating, implementing, and adapting in the context of smallholder agriculture present
very different challenges from the ones arising when working with larger farms. A
long tradition in development economics has emphasized the importance of market
constraints small farmers encounter in their production and marketing choices (Jack,
2013). In addition, at least since the seminal work by Bates (1981), scholars have
highlighted political economy factors and institutional constraints – e.g., inadequate
political representation of farmers’ interests, elite capture, and weak contracting
environments – as important obstacles to agricultural productivity growth. Finally,
some features of agricultural production, like marked seasonality and high exposure
to risk, imply that behavioral poverty traps may be particularly relevant for small
farmers (Mani et al., 2013). The taxonomy of constraints proposed in Chap. 2 of
this book thus provides a useful starting point to understand the domains for current
and future Development Engineering contributions.
L. Casaburi
Department of Economics, University of Zurich, Zurich, Switzerland
e-mail: lorenzo.casaburi@econ.uzh.ch
184
II
Market Performance: Technologies to Improve Agricultural Market. . .
The case studies in this section focus on some of the most pressing constraints
farmers face. In the first chapter, Fabregas, Kremer, Harigaya, and Ramrattan
discuss recent advances in digital agricultural extension in Kenya and Ethiopia.
Digital extension helps overcome not only informational barriers (e.g., on which
and how much fertilizer to apply) but also institutional constraints arising from
the high ratio of farmers to government extension workers and to the difficulty in
monitoring these workers. In the second chapter, Neza, Nyarko, and Orozco-Saenz
focus on access to crop markets in Ghana. They review several interventions that
aim at improving the prices farmers receive for their crops. After discussing an
early evaluation of including price information systems, they review the promise of
electronic trading platforms and commodity exchanges. In the third chapter, Aker
reviews the development of rural fintech in West Africa, including credit, saving,
and cash transfers. She then presents a case study from Niger on the potential of
mobile money to improve the distribution of cash transfers.
These case studies share a number of common themes. First, in each of them, the
innovations emerge from a strong collaboration between the academic researchers
and local stakeholders, including governments (in the chapter by Fabregas et al.),
private sector enterprises (in the chapter by Nyarko et al.), and NGOs (in the
chapter by Aker). Second, the case studies provide clear examples of iterative
implementation. Results from early-stage pilots informed the design of the next
stages, either through an improved design of the original intervention (e.g., Aker
describes how the results of a 2010 mobile cash transfer pilot shaped the design of
the 2018 program) or through the development of more sophisticated interventions
(e.g., Neza et al. describe the path from price information to trading platforms to
commodity exchanges in Ghana; Fabregas et al. discuss the evolution from simple
SMS-based digital extension to more complex formats). Third, the three chapters
build on randomized controlled trials that evaluate rigorously the impact of the
interventions on the outcomes of interest. They thus clearly describe on which
dimensions the reviewed interventions worked (and on which ones they did not).
Naturally, these case studies discuss only a small portion of the growing body
of Development Engineering research on agricultural markets. It is worthwhile
to mention three areas of ongoing development (among many others): product
traceability, land registration, and agricultural insurance for smallholders. Lack of
product traceability along the supply chain prevents many farmers from accessing
lucrative domestic markets and, especially, export markets. Foreign buyers often
require exporters to report the detailed origin of their product and to prove
compliance with sustainability standards. In highly fragmented value chains, this
can be very hard. A number of recent products aim at digitizing the early steps of
the value chain and thus reducing the cost of record-keeping and product-tracking.
Several pilots are also using blockchains to improve traceability. Some of these
products have reached a large number of farmers. However, more research is needed
to understand how these innovations affect farmers’ productivity and returns.
Another area of collaboration between government, private sector, and academics
concerns land registration and property rights. A large body of evidence suggests
that weak property rights on agricultural land hamper productive investments (e.g.,
II
Market Performance: Technologies to Improve Agricultural Market Performance
185
Goldstein & Udry, 2008; Besley & Ghatak, 2010). Technological advancements
are playing an important role on these issues. Recent experiences suggest that
satellite imagery can improve the quality of land maps or facilitate the creation of
new registries where they did not exist (see Ali et al., 2018, for an example from
Rwanda). Several African countries (e.g., Kenya and Uganda) are in the process
of digitizing their land registries, expecting that this will improve transparency
and reduce frauds. However, to ensure fair access to these new records and avoid
elite capture, it is important to complement these technological advancements with
improvements in management capacity of local ministries and in regulations on data
security and privacy protection (Deininger, 2018).
High transaction and claim verification costs represent important obstacles to the
diffusion of insurance markets for smallholders. Over the last decade, governments,
insurance companies, and academics have used remote sensing data to design
insurance products based on normalized difference vegetation indexes (NDVI).
These indexes predict quite well adverse events at the plot level. They thus provide
a valuable alternative measure to determine insurance payouts, potentially substituting for expensive plot-level claim verification and for area-level crop-cutting
exercises (see, e.g., Chantarat et al. (2013) for an early example of index-based
livestock insurance in Northern Kenya). Ongoing trials are also evaluating “picturebased insurance”; in these products, companies use pictures of the plots, which
farmers take with their phones, to verify claims (Ceballos et al. (2019) report results
from a pilot in India). Researchers have also made remarkable progress in the use
of remote sensing and machine learning algorithms to predict crop yields, even on
smallholder plots (Burke & Lobell, 2017; Lobell et al., 2018). These developments
are going to have important implications for poverty measurement, targeting of
relief interventions, and impact evaluations, among many other areas.
References
Ali, D. A., Deininger, K., & Wild, M. (2018). Using satellite imagery to revolutionize creation of tax maps and local revenue collection. The World Bank.
Bates, R. H. (1981). Markets and states in tropical Africa: The political basis of
agricultural policies. University of California Press.
Besley, T., & Ghatak, M. (2010). Property rights and economic development. In
Handbook of development economics (Vol. 5, pp. 4525–4595). Elsevier.
Burke, M., & Lobell, D. B. (2017). Satellite-based assessment of yield variation
and its determinants in smallholder African systems. Proceedings of the National
Academy of Sciences, 114(9), 2189–2194.
Ceballos, F., Kramer, B., & Robles, M. (2019). The feasibility of picture-based
insurance (PBI): Smartphone pictures for affordable crop insurance. Development Engineering, 4, 100042.
186
II
Market Performance: Technologies to Improve Agricultural Market. . .
Chantarat, S., Mude, A. G., Barrett, C. B., & Carter, M. R. (2013). Designing indexbased livestock insurance for managing asset risk in northern Kenya. Journal of
Risk and Insurance, 80(1), 205–237.
Deininger, K. (2018). For billions without formal land rights, the tech revolution offers new grounds for hope. https://blogs.worldbank.org/developmenttalk/
billions-without-formal-land-rights-tech-revolution-offers-new-grounds-hope
Goldstein, M., & Udry, C. (2008). The profits of power: Land rights and agricultural
investment in Ghana. Journal of political Economy, 116(6), 981–1022.
Jack, B. K. (2013). Market inefficiencies and the adoption of agricultural technologies in developing countries. eScholarship, University of California.
Lobell, D. B., Azzari, G., Burke, M., Gourlay, S., Jin, Z., Kilic, T., & Murray, S.
(2018). Eyes in the sky, boots on the ground: Assessing satellite-and groundbased approaches to crop yield measurement and analysis in Uganda. The World
Bank.
Lowder, S. K., Skoet, J., & Raney, T. (2016). The number, size, and distribution of
farms, smallholder farms, and family farms worldwide. World Development, 87,
16–29.
Mani, A., Mullainathan, S., Shafir, E., & Zhao, J. (2013). Poverty impedes cognitive
function. Science, 341(6149), 976–980.
Chapter 8
Digital Agricultural Extension
for Development
Raissa Fabregas, Tomoko Harigaya, Michael Kremer,
and Ravindra Ramrattan
1 The Challenge
More than two billion people globally live in smallholder farming households,
comprising a large proportion of the world’s poor. Smallholder farm yields are
estimated to reach only 25–50% of the potential in many parts of the world (Koo,
2014; Das, 2012). Increasing agricultural production is a necessity for meeting the
growing demand for food in decades to come (World Bank, 2007), but the scope
for expanding cropland is limited as ecological risks from deforestation and loss of
biodiversity loom large (Lambin et al., 2013; Zabel et al., 2019). Raising agricultural
productivity is, therefore, a critical component of improving the economic wellbeing of millions of people in developing countries. Simple technologies can
significantly increase yields, and an increasing body of evidence suggests that access
to agricultural advice can help farmers to improve their productivity. Yet, a vast
Ravindra Ramrattan lost his life in the 2013 attack on the Wastegate mall in Nairobi. During
his professional career he contributed to several projects related to digital agriculture and digital
finance for development. We remember him not only for his contributions in this area, but also for
his curiosity, humor and kindness, which are sorely missed.
R. Fabregas ()
School of Public Affairs, The University of Texas at Austin, Austin, TX, USA
e-mail: rfabregas@utexas.edu
T. Harigaya
Senior Researcher, Precision Agriculture for Development (PAD), Boston, MA, USA
M. Kremer
University Professor in Economics and the College and the Harris School of Public Policy
(Recipient of 2019 Nobel Prize for Economics), University of Chicago, Chicago, IL, USA
R. Ramrattan (deceased)
Ravindra Ramrattan wrote this book while at Kenya
© The Author(s) 2023
T. Madon et al. (eds.), Introduction to Development Engineering,
https://doi.org/10.1007/978-3-030-86065-3_8
187
188
R. Fabregas et al.
majority of smallholder farmers do not have access to science-based agricultural
information (Fabregas et al., 2019).
The rapid spread of mobile phones and other digital technologies present new
opportunities to make quality agricultural information accessible at scale to farmers
in developing countries (see Fig. 8.1). This chapter discusses why market failures
Fig. 8.1 Penetration of mobile phones in developing countries (a) Shows mobile cellular subscriptions in the developing world per 100 inhabitants (2001–2019). (b) Shows the share of population
who reports owning a smartphone. (Source: Financial Inclusion Insights, finclusion.org)
8 Digital Agricultural Extension for Development
189
Box 8.1: From Research to Practice at Scale: Precision Agriculture for
Development (https://precisionag.org)
Precision Development (PxD), a global nonprofit that provides actionable
information to enable smallholder farmers to improve their wellbeing, was
conceptualized and formed based on a series of research projects in India and
Kenya conducted by academic researchers. PxD continues to learn, innovate,
and scale its services, using technology, behavioral sciences, human-centered
design, and experimentation (Illustration 8.1).
Illustration 8.1
190
R. Fabregas et al.
and service delivery shortfalls undermine the creation and optimal flow of agricultural information and reviews ways in which digital innovations can overcome
these barriers. We draw insights from existing evidence and use illustrative examples
across geographies to highlight practical considerations and lessons learned through
the iteration of these services. Many of these lessons come from our experience with
Precision Development (PxD), a global nonprofit providing actionable information
to smallholder farmers via mobile phones (see Box 8.1).
1.1 What Limits Access to Agricultural Information?
Many farmers have vast amounts of agricultural knowledge that has been transmitted throughout generations. Yet, the existence of new agricultural technologies and
changes in farm conditions – from soil degradation, to market conditions – require
ongoing learning and experimentation to optimize productivity. Farmers in developed countries have access to a wide range of technological developments – from
high-density soil testing and moisture sensors to satellite and drone imagining –
capable of gathering precise information about their farms and which enable them
to apply inputs more efficiently. However, an overwhelming majority of smallholder
farmers in developing countries do not have access to these technologies, and many
would find it unprofitable to use them. Even relatively simple technologies, such as
soil chemistry analyses, are well beyond the means of many smallholders. Additionally, experimenting with inputs in isolation is complicated because individual
results are noisy and farmers may not know which dimensions to prioritize for
experimentation (Hanna et al., 2014).
Several factors explain why the private sector often lacks sufficient incentives to
create and offer appropriate information to farmers at the optimal scale. Information
is generally a non-rival and non-excludable good. Once information is created,
it can be easily shared with others at a very low cost. For example, a buyer of
agricultural advice could share this information with many other farmers. If sellers
of information cannot recover their investment costs, they will be unlikely to create
it. Moreover, uncertainty on the part of buyers regarding the value of a particular
piece of information may limit their demand.
Since many aspects of agricultural extension can be considered a public good,
public provision is common in many countries (Anderson & Feder, 2004). Governments in developing countries spend millions of dollars every year creating agricultural knowledge and delivering extension services. Typical delivery approaches
involve in-person visits and community events such as “farming workshops” and
“field days” where technologies and input use are demonstrated (BenYishay &
Mobarak, 2019; Emerick & Dar, 2020; Fabregas et al., 2017; Kondylis et al., 2017;
Mueller & Zhu, 2021). However, scaling these services effectively poses a number
of challenges. Foremost, in-person extension is often expensive, severely limiting
its reach. Developing country governments maintain networks of over one million
extension agents (Anderson & Feder, 2007), but ratios of farmers to extension agents
8 Digital Agricultural Extension for Development
191
generally remain high, leaving a majority of smallholders without adequate access
to their services and information. Public extension services may also be affected
by bureaucratic problems that limit the accountability of frontline information
providers. Moreover, there are concerns that the most disadvantaged, including the
poorest and women farmers, are often neglected (Saito et al., 1994; Cunguara &
Moder, 2011). Other oft-used technologies, like radio, can reach farmers at scale,
but these media make it difficult to tailor recommendations to local conditions.
In addition to service delivery challenges, generating agricultural content tailored
to local conditions and the specific needs of individual farmers can be costly to
produce (see Box 8.2). In many instances this leads to extension services providing
blanket recommendations across large geographic areas. Cost-related considerations
may also hamper the regular updating of dynamic conditions: in such cases advisory
content quickly becomes obsolete. Finally, many extension systems focus on
agronomic recommendations developed to maximize crop yields. However, farmers
may optimize adoption decisions to maximize returns to investment (ROI), rather
than crop yields, under real-world constraints, such as liquidity, transportation costs
and expected market conditions, In addition, farmer’s ROI calculation is influenced
by individual characteristics such as risk and taste preferences. These considerations
are rarely accounted for by traditional extension services.
Box 8.2: Why Do Smallholders Lack Weather Information?
Contributed by Hannah Timmis, Precision Development
Smallholders face substantial risk from fluctuations in the weather, and
climate change only increases this risk. Weather unpredictability affects
agricultural incomes directly, by varying the amount and quality of outputs
produced from a given bundle of inputs and, indirectly, by compelling farmers
to adopt costly risk mitigation strategies such as intercropping (Cole & Xiong,
2017). Accurate weather forecasts reduce this risk by enabling farmers to
optimize their production based on future meteorological conditions. In India,
for example, smallholders that live in areas with better seasonal forecasts
calibrate their planting-stage investments to predicted rainfall and have higher
profits on average (Rosenzweig & Udry, 2019). Despite these benefits,
accurate forecasts are frequently unavailable in developing countries due to
a combination of market and institutional failures. Producing a high-quality
forecast involves large fixed costs. Global weather prediction models, which
are operated by specialized meteorological centers, run many times a day and
generate vast quantities of data. Forecast providers must access, assimilate,
analyze, and disseminate this information, and some also deploy limited area
models. The process is capital-intensive: high-performance computing, rapid
data transmission systems, and highly skilled staff are all required. Yet, once
the forecast is created, anyone can access and use the information at nearzero marginal cost. These production characteristics mean that basic weather
forecasts are under-supplied by the market.
(continued)
192
R. Fabregas et al.
Box 8.2 (continued)
Hence, by international agreement, national governments are responsible
for weather forecasting. Members of the UN World Meteorological Organisation, which comprise 193 countries and territories, maintain dedicated
public providers called National Meteorological and Hydrological Services
(NMHS). The problem is that the capability of NMHS varies enormously.
Many public agencies in developing countries frequently suffer from underfunding, failing infrastructure, outdated equipment, and inadequate expertise
(Webster, 2013). The result is that valuable weather information does not
reach the right people at the right time.
A case study from Pakistan illustrates the issue. In 2010, northern Pakistan suffered devastating floods, which killed 2000 people and destroyed
$US500M in agricultural output. Researchers at Georgia Tech subsequently
showed that the floods were predictable 8–10 days in advance if available data
had been analyzed at the time (Webster et al., 2011). Yet, Pakistan’s NMHS
issued no warning.
1.2 The Potential of Digital Agriculture
The widespread adoption of mobile phones, combined with the advances in agricultural measurement and computational technologies presents new opportunities
to address the barriers to making relevant information available for smallholder
farmers. Information and communication technologies (ICT) and mobile phones, in
particular, allow for low-cost, timely, and customized information delivery at scale.
This medium can be particularly useful for the delivery of dynamic information
which requires continuous updates, for example, weather information and market
prices. Digital technologies also present comparative advantages for delivering
information to farmers in remote areas with poor infrastructure, conflict-affected
areas beyond the reach of in-person extension services, and in contexts affected by
natural disasters in which the delivery of time-sensitive information can be lifesaving.
Two features in particular make digital extension a promising area of innovation.
First, ICT and other digital technologies allow for two-way communication with
farmers. This can be leveraged to collect information about local conditions,
farmers’ backgrounds, and experiences with inputs. For most smallholder farmers, deploying hardware/sensor-based precision agriculture technologies would be
prohibitively expensive. Mobile phone communication can facilitate information
transmission in which farmers can ask specific questions and request information
valuable to them. Even with recent technological efforts to reduce the cost of
delivering precision agriculture in developing countries (Jain et al., 2019), there
are many potential gains from collecting information directly from farmers. For
8 Digital Agricultural Extension for Development
193
instance, if data is collected at sufficient scale, it would enable extension systems to
aggregate information more effectively, which in turn would allow for the generation
of better recommendations to be made available to everyone in the system. Once
aggregated, the information about individual’s farm conditions could also be used
to solve other informational frictions in supply markets. For example, it could be
used to identify pest-prone areas or improve understanding of demand for inputs.
Second, digital extension can exercise large economies of scale to generate
analytical insights and improve customization. In turn, the iteration of these insights
and improvements can progressively increase impacts over time. Digital platforms
generate large volumes of user data which can be utilized for constant experimentation and adjustments at low cost. The addition of more users and generation of
more data allow for faster experimentation and advanced analytics – for example,
through the use of machine learning – leading to faster improvements in the quality
of customization and the magnitude of potential impacts. The progressive increase
in returns to scale implicit in digital systems suggests that systems operating at scale,
and leveraging data for constant learning, will likely derive the largest impacts.
Despite the potential of digital extension services many implementation challenges remain. For instance, many existing agricultural mobile-based systems are
based on one-way, “push-only” approaches that focus on broadcasting one specific
type of information (e.g., prices, specific recommendations for a crop, etc.). Not all
information is useful, actionable, or accessible. The value of information depends on
context. For example, advice on basic agronomic techniques is likely to be irrelevant
for experienced farmers. Similarly, farmers who confront markets with constraints
in the supply of labor may not adopt labor-intensive technologies. Operationalizing
active two-way communication with farmers in a way that allows systems to learn
about their needs could vastly improve the usefulness of the recommendations
farmers receive. Moreover, relevant information uploaded to a digital platform may
still not reach many smallholder populations in the absence of a user-centered design
that facilitates access and comprehension for farmers across linguistic groups and
takes into account low levels of literacy.
Similarly, cheap information delivery tools do not solve constraints in creating
local and dynamic agricultural information. Few systems leverage experimentation
or information created by farmers themselves or have mechanisms capable of
facilitating local information creation. Finally, the current landscape of mobilebased agricultural information platforms is diverse, fragmented, and uneven in
quality. Most ICT-based services only reach a few thousand farmers, and there has
been little coordination to avoid duplication of information creation or to maximize
gains from sharing. There are high fixed costs in setting up these systems –
particularly with regard to information generation, software creation, establishing
trust with farmers – which suggests that small-scale approaches are likely to be
suboptimal.
Fully realizing the potential of digital agricultural extension will require addressing these issues through concerted efforts to develop and test a range of approaches.
Successfully addressing these challenges will require interdisciplinary collaboration
194
R. Fabregas et al.
that incorporates lessons and insights from behavioral and data sciences, agriculture,
economics, and engineering.
2 Implementing Mobile Phone-Based Agricultural Extension
Services
Mobile-phone based agricultural extension services vary in the complexity of the
design and the types of technologies used. In this section, we briefly discuss existing
evidence on the impacts of current ICT-based extension approaches (see existing
reviews for a more detailed scan of the literature, e.g., Aker, 2011; Nakasone et al.,
2014; Aker et al., 2016; Fabregas et al., 2019). We then discuss selected aspects of
implementation that are key to successful deployment.
2.1 Current Approaches via Mobile Devices
2.1.1
Services That Rely on Text Messages
Basic mobile devices with call and texting capabilities only are still the most
common type of phone handset used in developing countries, and text messaging is
still the cheapest way to reach people in many parts of the world. Text messages, or
short message services (SMS), allow for written messages of 160 characters, which
can be sent in bulk and broadcast in near real time to hundreds of thousands of
people. This ability to reach farmers in resource-poor areas at very low cost makes
text messaging an attractive option for closing information gaps.
This simple text messaging technology, however, has a number of limitations.
First, there is limited scope for communicating complex information sending too
many messages can annoy farmers (IDinsight, 2019) or overload cognitive capacity,
potentially leading farmers to pay little attention to message content. Even in
instances where farmers are eager to receive messages, illiteracy may limit the
effectiveness of written information. Second, poorer farmers with low mobile
literacy may find a significant barrier to direct two-way communication, especially
in contexts where users pay for outgoing text messages. In particular, collecting
accurate location data from farmers via text messaging, and tailoring information
accordingly, poses a big challenge (see Box 8.3).
Existing evidence suggests that text messages can have modest, but positive
effects on the likelihood of a farmer adopting recommended agricultural technologies. A text-message extension program offered to sugar cane farmers in Kenya
found positive yield impacts in one trial but no effects in a second trial (Casaburi
et al., 2019b). In Ecuador, text messages to potato farmers increased knowledge
and self-reported adoption of integrated soil management practices (Larochelle et
al., 2019). Similarly, delivering price information via SMS resulted in better farmer
8 Digital Agricultural Extension for Development
195
outcomes in Peru and India (Nakasone, 2013; Courtois & Subervie, 2015), but did
not affect average crop prices obtained by farmers in Colombia and India (Camacho
& Conover, 2011; Fafchamps & Minten, 2012). The existing evidence base offers
limited insights on the heterogeneity of treatment effects. Are effects sensitive to
the local conditions and the specific design features, or varying findings across
studies are merely driven by sampling variation and imprecise impact estimates due
to small samples? A meta-analysis of six experimental evaluations of text message
services encouraging farmers to adopt an input to reduce soil acidity, implemented
by three different organizations with thousands of smallholder maize farmers in
Kenya and Rwanda, found that farmers who received texts were 19% more likely to
follow the agricultural advice (Fabregas et al., 2021). While some of the individual
experiments had statistically significant impacts and others did not, one cannot
reject the hypothesis that the effects were the same across contexts. These results
also suggest that one needs to be cautious when interpreting sources of impact
heterogeneity across different studies.
Another key consideration for policy is how impacts compare to the costs of the
programs. Since the marginal costs of sending an SMS is extremely low, even small
effects can be cost-effective. While SMS is a well-known and simple technology
widely used for digital extension, there are a number of opportunities that deserve
further exploration. First, it is important to understand the extent to which more
effective message design can increase impacts. Here, insights from marketing and
behavioral economics could be useful. Second, when and how frequently messages
should be targeted. Third, how to develop systems to collect farmer information
through text message. All of these approaches require more experimentation.
Box 8.3: Customizing Advice to Farmers’ Location via Text Message
A group of researchers working in Kenya, including several of the authors of
this case study, partnered with a public entity, a social enterprise and an NGO
to evaluate SMS-based agricultural services that recommended a specific type
of input for acidic soils (Fabregas et al., 2021).
The government-run program recommended farmers first to test their soils
to learn about the soil acidity of their plot before following the advice.
However, individual soil testing can be prohibitively expensive for most
smallholder farmers (approximately $20USD at the time of the study). Even
though local recommendations could be generated using the available data on
local soil tests in the region and shared directly with farmers through their
phones, such customization required information about a farmer’s location.
Establishing user locations faced a number of challenges. First, most
smallholder farmers in rural Kenya do not have GPS-enabled smartphones.
Therefore, potential users had to be people for whom information on location
already existed (e.g., because they had already participated in other programs,
(continued)
196
R. Fabregas et al.
Box 8.3 (continued)
and this had already been collected), or information about their location
had to be collected through text message questionnaires. Second, many
developing countries lack precisely defined physical addresses (Union, 2012).
Collecting precise location information about specific farmers seemed almost
impossible. In this particular case, the smallest unit that farmers could
report uniformly was their village. However, village name spellings were not
consistent and user text entry was often error-prone. Moreover, no GIS maps
existed at the village level. At the end, data could only be reliably collected at
a higher level of aggregation like the ward or sublocation.
The research team experimented with a number of solutions. In one
project, farmers were recruited through partner organizations that already
had information about farmers’ locations. In a second project, participants
were recruited through agricultural shops. Clients of these shops were invited
to enroll into the agricultural extension program, and shopkeepers provided
support in filling out a text-message questionnaire that asked farmers about
their physical location.
These models have trade-offs. Recruiting through a partner organization
lowers the cost of user acquisition, but the scale and the target farmer
population are determined by the partner’s reach. In contrast, coordinating
a recruitment process through local agents can be costly and limited in
scalability. A more scalable approach may be to partner with mobile network
operators and use the data on cell tower locations. However, as discussed
in the next subsection, there is often a large fixed cost in negotiating
these agreements. As the adoption of GPS-enabled devices increases, more
opportunities to gather farmers’ locations at low cost and at scale will likely
emerge.
2.1.2
Services That Rely on Interactive Voice Responses (IVR)
A second technology operating in basic phones which we highlight is interactive
voice responses (IVR). This technology allows computers to interact with humans
through voice. Several developing countries, including India, Madagascar, and
Ethiopia already operate IVR phone-based government extension systems. These
systems usually allow farmers to listen to prerecorded information and to record
new questions (Fig. 8.2). This approach is likely to be more inclusive of users with
low levels of literacy, though it requires users to listen to audio-recorded messages.
It can also be more expensive to operate than text-based systems. Cole and Fernando
(2021) evaluate an IVR mobile advisory system that provides agricultural advice to
cotton and cumin farmers in India. The intervention increased self-reported adoption
8 Digital Agricultural Extension for Development
197
of recommended seeds, though it had no impact on the adoption of other inputs like
pesticides or fertilizers.
2.1.3
More Advanced Technologies: Smartphones and Tablets
Smartphones and tablets offer new possibilities for sharing information and learning. For example, farmers could watch videos demonstrating new agricultural
techniques or take pictures of pests affecting their crops and either request automatic
identification and recommendations or raise questions with agronomists (Olson,
2018). Farmers could play with apps to better understand the risks associated with
certain crops (Tjernström et al., 2019). However, access to smartphones and tablet
devices is still limited in some parts of the world, and it may require innovative
delivery approaches to reach scale, including engaging agricultural extension
officers, agrodealers, and other local agents with familiarity with smartphones.
To date, a number of video-based interventions for farmers have also been found
to have positive impacts at changing knowledge and self-reported farmer practices
(Gandhi et al., 2007; Fu & Akter, 2016; Van Campenhout et al., 2018). Measured
impacts on crop yields have been mixed, with some projects documenting null
effects (Udry, 2019; Van Campenhout et al., 2019) and others documenting positive
impacts (Van Campenhout et al., 2018; Arouna et al., 2019). However, a recent
meta-analysis combining the effects of these existing projects suggests that, on
average, yields increased by 4% as a result of these types of programs (Fabregas
et al., 2019).
2.2 Implementation: Technological Considerations
Deploying mobile phone-based solutions requires coordination with a number of
stakeholders including government, agricultural agencies, communications regulatory bodies, and local telco companies. In this section, we discuss key technological
considerations for setting up and scaling a digital agricultural extension service.
2.2.1
Technology Infrastructure
Several options for technology infrastructure are available in most countries. These
options include working directly with mobile network operators (MNOs), working
through a mobile aggregator, or working with an existing mobile solutions provider.
Negotiating individually with each MNO can be time-consuming and difficult. In
contrast, many aggregators have an infrastructure and partnerships that allow them
to send messages to subscribers across MNOs within a country, but regulations
on mobile communications and the nascent market environment for aggregators
vary across countries. Finally, mobile solutions providers may offer additional
198
R. Fabregas et al.
IVR System Call Flow
Start Call
Play Welcome Message in
Amharic language
First Time
Caller?
YES
NO
Play Welcome Message in
Language of Caller.
Language Menu
For
Press
For
Press 2
For Tigrigna Press 3
Other Keys
Play Error
Message
Caller
Registered?
To repeat menu options Press #
#
1, 2, 3
YES
Profile
Registration
Module
NO
*
For Rain Feed Content Press 1. For Irrigation Content Press 2. To reset profile Press *.
To repeat menu options Press #.
1
2
Rain Feed Content
Module
Irrigation Content
Module
Play Goodbye
Message
End Call
Fig. 8.2 An example call flow of an existing IVR-based agricultural information service. This
figure illustrates the IVR menu structure for an existing IVR-based agricultural information
service. A caller is first asked to select a language and answer a few profiling questions before
being taken to the menu of agricultural content organized by irrigation access. (Source: PxD)
8 Digital Agricultural Extension for Development
199
services such as dashboards for easy monitoring and a team of engineers to build
customized service features. Below are some key considerations when considering
these different options.
User Protection Mobile phone subscribers receive many spam messages and calls.
In some countries, unsolicited messaging in the absence of a user opting in to a
service is prohibited or regulated. Noncompliance can result in the service being
shut down or penalized. Even in the absence of such regulations, the opt-out right
needs be considered as part of the user protection measure. A simple process
that allows users to choose whether and when to opt out can reduce annoyance.
Telecommunications authorities can also decide whether certain emergencies – such
as severe pest outbreaks – warrant sending unsolicited messages.
Data Security and Privacy Two-way digital agricultural extension systems can
accumulate a large volume of private data about smallholder farmers. This often
includes phone numbers, as well as more detailed information about a farmer’s
location, crop selection, and input usage, and may include sensitive information
such as exact plot locations, agricultural sales, and credit history. Privacy protection
for service users needs to be handled carefully. Some countries have data protection
and security regulations that restrict how and where data about individual citizens
can be stored and accessed. One must also consider obtaining consent from farmers
to use their data for analysis or to share their information with third parties. It may
be practical in some cases to obtain consent from users as they register into the
service. However, with low mobile literacy among smallholder farmers, providing
sufficient information and obtaining informed consent via digital messages can be
difficult.
Access to Mobile Data Mobile communications data owned by MNOs contain
rich information about farmers, which can be used to improve the quality of
a digital advisory service. For example, cell tower data provides user location
information; call and message logs can be used to identify social networks or predict
mobile literacy (Björkegren, 2019); and user profile and phone settings reveal user
preference. Aggregators often do not have access to this kind of granular user-level
data. More importantly, when a digital agricultural extension service is launched,
usage data provides real-time feedback about demand for service and information.
Whether working with MNOs or through aggregators, access to the basic usage
data (e.g., whether the message was received, why it was not received, etc.) can
contribute to building a robust monitoring and evaluation system as well as capacity
to engage in rapid testing and iterative development.
2.2.2
Implementation Model: Product Considerations
A host of operational decisions need to be considered in setting up a digital
agricultural extension service. How does one optimally recruit farmers? What types
of implementing organizations make good partners? What are adequate revenue
200
R. Fabregas et al.
Fig. 8.3 Trends in access to a national agricultural hotline service. This graph illustrates how a
mass radio campaign generated spikes in calls to a large public agricultural hotline service, serving
as an effective tool to recruit farmers to digital agricultural advisory services. (Source: PxD)
models and financial paths to scale? Not all of these questions need to be answered
right away, and implementation models may evolve as questions are answered
through piloting and incremental scaling.
Customer Acquisition Farmer recruitment and partner selection are key design
elements in the implementation of a digital agricultural advisory service. These decisions will affect the scale, density, and target farmer population as well as the scope
of feasible customization and the cost of service delivery per farmer. Databases
of farmer phone numbers may be available through – among others – government
agencies, NGOs, and farmer associations. Some implementers already have valuable
and detailed information about farmers (e.g., location, gender, primary crops, etc.),
although they might work with a limited number of individuals. Alternatively, mass
campaigns via radio advertisements and posters in village centers may be feasible.
For example, a large public agricultural hotline service saw spikes in call volumes
immediately after hotline numbers were broadcast via radio programs (Fig. 8.3).
The cost per user acquisition through radio campaigns in this setting was $0.29/user
in 2019.
Agronomic Content A vast body of agronomic sciences research and crop modeling informs evolving insights on new productivity-enhancing technologies and
8 Digital Agricultural Extension for Development
201
practices. However, the rigor of evidence supporting the use and impact of new technologies varies widely. Institutional willingness to take risks with recommendations
and relative openness to incorporating new technologies into extension services
may vary widely by implementing agency. For instance, government agencies might
provide agricultural information that is agronomically correct but too technical to be
adequately used by target farmers (Cole & Sharma, 2017; Fabregas et al., 2021). In
vetting agricultural content, we emphasize the importance of considering farmer’s
profitability calculations in real-farm settings, and the potential risks associated with
any technology. For example, customized advice generated by complex crop models
may benefit from an empirical validation to corroborate whether customization, in
fact, improves profitability among targeted farmers.
Costs and Financing of Digital Agricultural Systems Mobile phones offer a lowcost means to reach smallholder farmers with information at scale. Moreover, the
low marginal costs of distribution suggest that there can be high returns to scale.
For instance, PxD’s average cost of service has dramatically decreased from $5.20
per farmer per year in 2017 (serving approximately 345 K farmers) to $1.55 in
2019 (serving 3.53 M farmers).1 Despite the very low marginal cost of scaling the
service, however, setting up a digital agricultural system in a new setting might
require nontrivial upfront capital.
There are several potential financing models for digital agricultural services.
Many for-profit service providers in digital agriculture charge farmers a subscription
fee. However, economic theory suggests that markets for information will often
perform poorly and, therefore, financing models that solely rely on charging fees
directly to farmers are likely to exclude a large proportion of smallholders who
might still find these services valuable (Fabregas et al., 2019). Market failures arise
because information differs from most other goods: it is non-rival (e.g., once created
many people can benefit from it at minimal marginal distribution costs), it is nonexcludable or partly excludable (e.g., once an individual has access they can share
with many others), and there often exists asymmetric information in the market
(e.g., buyers do not know the value of information sold to them). These features
might suppress farmers’ willingness to pay for information services and also make
it difficult for service providers to recoup their costs, limiting their incentives to
invest in generating informational products.
Limited empirical data suggests that farmer’s willingness to pay varies widely
across settings, but farmers are sensitive to prices. The IVR service in India studied
by Cole and Fernando (2021) found that, despite a high rate of engagement, the
average price which farmers were willing to pay was $2 when the cost of provision
for a 9-month subscription for that particular service was $7. The percentage of
farmers who took an offer at a randomly selected price varied from 6.7% at $4.13
to 85% at $0.68. In a study in rural Ghana, most farmers were willing to pay a low
1 These estimates are based on PAD’s total operating cost and the total number of farmers served
across all initiatives, and the initiative-specific cost per farmer varies widely by the design of the
service, partnership arrangement, and the scale at which it is operating.
202
R. Fabregas et al.
price for digital information service ($0.10/month), but they were highly sensitive to
price increases (Hidrobo et al., 2020). In a study of willingness to pay for local soil
information in western Kenya, farmers were not willing to pay the full cost of local
soil tests, but the aggregate valuation of all farmers for a given soil test in an area
exceeded the cost of soil testing and distributing this information. This potentially
makes investment in this information worthwhile from a social standpoint (Fabregas
et al., 2017).
Other commercial models might help address some of these issues. A freemium
model in which users receive free access to a basic service and pay for advanced
features may increase access while still generating revenues. Alternatively, revenues
may be raised from value-chain players with an aligned incentive to increase farmer
productivity (e.g., contract farming companies, large agricultural corporations
with corporate social responsibility). Overall, the above market failures provide
a rationale for some public sector involvement in financially supporting these
services.
Other Costs to Farmers Even in the absence of direct fees to use a digital
agricultural service, farmers may face indirect (pecuniary and nonpecuniary) costs
of accessing these services. For instance, phone signals can be weak and unreliable
in remote areas; farmers may incur transportation costs to access electricity for
charging phones; and some MNOs require a minimum phone credit to receive calls.
In addition, challenges with mobile phone access and digital literacy may present
greater barriers for marginalized populations, such as women and the poorest.
Expanding digital agricultural services among those who may face high costs and
barriers to access them will require a deliberate effort for the developer to address
their specific barriers and meet their specific needs.
3 Iterative Development
Developing a user-centered service requires an iterative process guided by frequent
user feedback. A variety of methods and approaches can be used to test, evaluate,
and iterate the design of digital agricultural extension services to improve service
delivery and impact (see Box 8.4).
3.1 Approaches
Human-Centered Design Approach Agricultural recommendations developed
by scientists and experts are often technical and difficult to understand. Given
the limited volume of content which a typical digital message can deliver at
one time, the comprehensibility and actionability of a message are likely to be
a critical driver of impact. The exact content of messages can be tested and
8 Digital Agricultural Extension for Development
203
iterated with target farmers through in-person or telephonic focus group discussions,
interviews, and observations, before launching rigorous testing. For instance, one
could share the messages with a small number of farmers and ask them to explain the
recommendation to ensure that agricultural words used in the message are locally
appropriate; farmers may be asked to call into an IVR service and interact with the
system so that the developer team can observe the pain points in the interface.
Monitoring Implementation quality can be assessed by monitoring key performance metrics, such as user engagement, user satisfaction, or perceptions.
Monitoring these outcomes can provide valuable information about program’s
aspects that may or may not be working well. For example, low user engagement
suggests that the system might be failing to deliver agricultural information to a large
number of farmers. Similarly, low user satisfaction can indicate that farmers are
unlikely to utilize the service and the agricultural information it provides. Obtaining
feedback from farmers and iterating on design may help identify and reduce any
potential barriers. However, merely monitoring engagement and satisfaction does
not tell us whether the service impacts farmer behavior and outcomes.
Box 8.4: Iterative Development of Customized Fertilizer Advice, PxD
India
The Government of India invests a large amount of resources in soil testing
of farmers’ fields and distributing Soil Health Cards (SHCs). SHCs are
physical soil report cards which provide detailed soil nutrient information and
customized fertilizer recommendations. However, information presented in
SHCs is highly technical and difficult for farmers to understand. For instance,
previous research in Bihar shows that nearly 70% of farmers with sufficiently
nutrient soils wrongly believed that SHCs recommended relevant fertilizer
application (Fishman et al., 2016).
To address this challenge, in 2017 a research team set out to develop a
digital support tool for SHCs. The team conducted a series of focus group
discussions in Gujarat, India, followed by a “lab-in-the-field” experiment to
develop and test supplemental materials including an audio aid for SHCs.
Approximately 600 farmers across 12 villages were randomly assigned to be
presented with (i) a (hypothetical) SHC only, (ii) a SHC with an audio aid,
(iii) a SHC with a video clip, or (iv) a SHC with an agronomist on hand to
explain the SHC. The SHC was presented as something for a farmer’s friend.
Farmers in groups (ii)–(iv) were also given a simplified SHC with fertilizer
recommendations converted into a familiar local unit. The field team visited
farmers door to door and administered short surveys at the beginning of the
visit, after the SHC was presented, and after the supplementary materials
were presented. The team found that all of the supplementary materials
dramatically increased the proportion of farmers who understood the SHC
(continued)
204
R. Fabregas et al.
Box 8.4 (continued)
content from 8 to over 40% and the level of trust in SHC recommendations
by 5–7 percentage points (Cole & Sharma, 2017).
In the following season, researchers evaluated the impact of customized
fertilizer recommendations on fertilizer application and yields among 1585
cotton farmers in Gujarat. Half of the farmers received a basic digital advisory
service with weekly push calls on topics including planting, weeding, and
pesticides, while the other half of treated farmers also received customized
fertilizer recommendations via visual aids and weekly push calls. At the
end of the first season, treated farmers reported more than two- to five-fold
increases in the likelihood of using profitability-enhancing fertilizers, when
compared to farmers in the control group (Cole et al., 2020). On aggregate,
this intervention narrowed the gap between recommended and actual fertilizer
use by 0.08 standard deviations.
The positive effects on fertilizer application, where previous efforts had
failed, attest to the importance of an iterative approach. Despite the large
impact on fertilizer adoption, the study observed no impact on self-reported
cotton yields or satellite-based yields. Unfortunately, in the year of the
trial, Gujarat had a historically low rainfall, potentially suppressing returns
to fertilizers. This confounding factor highlights challenges associated with
rigorously measuring agricultural impacts.
Continuous Experimentation Continuous A/B tests can be designed to answer
a range of operational and product design questions. For example, one can use
insights from behavioral sciences to experiment with different ways of framing a
particular message or message contents to test influences on farmer behavior or the
timing and frequency of messages to optimize user engagement (Fabregas et al.,
2021). These rapid experiments on systems and tweaks in message design often
focus on intermediate outcomes that are easy to measure: administrative data on
system usage or self-reported outcomes on adoption, knowledge, comprehension,
information sharing, and trust in the system. These outcomes can be used to
optimize user experience. Experimenting with large sample sizes is necessary for
detecting small effects and for harnessing the benefits of economies of scale in
learning. For example, one could compare several experimental arms at once or
use big data analysis to draw insights on heterogeneity or uncover other patterns
in the data to inform service design, impact, and scope for improvements. We
note that these design improvements may not add up linearly: user experience
may drastically improve and lead to better outcomes when a number of tweaks
remove major pain points at once. Therefore, testing the aggregate effect of many
design improvements together, rather than individually, can be an effective way to
approach product improvement. The effectiveness and targeting of messages might
be significantly improved over time, when feedback loops and iterative learning
8 Digital Agricultural Extension for Development
205
tools are integrated into operations at scale (see Box 8.5). Indeed, evaluating too
early may underestimate long-run impacts.
Impact Evaluations Because impact can vary significantly by context and product
design, building local evidence on the impact of a service can be important. However, implementing experimental evaluations to measure impact on downstream
outcomes, such as yields and profits, can be complex and costly. In many instances,
the effect sizes that would make these types of programs cost-effective are small,
and detecting these effects in a study might require large sample sizes. Evaluations
that have low statistical power are unlikely to detect effects that would still be
considered cost-effective. Hence, large-scale evaluations may be suited to settings
in which access to behavior and yield outcomes for a large number of farmers is
accessible at low cost. For instance, in Kenya and Mozambique researchers worked
with agribusinesses that regularly buy crops from farmers. Therefore, they could use
a large sample of size of administrative data on yields (crop sales collected by these
companies) to determine impacts on productivity (Axmann et al., 2018; Casaburi et
al., 2019b).
Localization vs. Generalizability Experiments designed to understand the impact
mechanism of an intervention – why the intervention works – can often generate
more generalizable insights than experiments that only assess whether or not an
intervention works. Understanding why helps us formulate a broader conceptual
model about conditions and constraints under which a particular intervention is
likely to be effective. We iterate and refine the conceptual model and our understanding about farmer behaviors as we gather observations from similar experiments
across multiple contexts with varying constraints. These broader lessons constitute
global public goods that can inform policy and practice. In this sense, there is likely
a large social value in experimenting and making results widely available.
3.2 Data and Measurement Issues
An effective feedback and iteration system leverages administrative outcome data
while supplementing it with additional data collection. In addition, available
advanced technologies, such as remote sensing, might be used to improve the costefficiency of outcome measurements over time.
Administrative Data on Usage System usage data can provide reliable information about user engagement: however, not all systems offer this option. Pickup and
listening rates for a push call service can offer insights on the amount of information
each user accessed. However, it is often difficult for a service provider to obtain data
on whether SMS advisory messages were opened by recipients.
206
R. Fabregas et al.
Measurement on Input Adoption and Agricultural Practices Phone surveys,
delivered via voice calls or text messages, allow for high-frequency data collection
at a much lower cost than traditional in-person methods. However, low response
rates and selection in attrition are common. For example, farmers who are more
satisfied with the service might be more likely to provide feedback or more likely to
respond to a phone survey. These biases in outcome data would make it difficult to
draw appropriate inferences in A/B tests.
Simply measuring increases in farmers’ knowledge or self-reported adoption
of inputs or practices has a number of limitations. For instance, knowledge may
not necessarily translate into any behavior change. Self-reports on whether farmers
followed recommendations could lead to a biased estimation of effects. For example,
farmers who received the service might overreport using suggested practices
because of experimenter demand effects, or farmers’ might fail to report using
inputs if they believe that it might make them more likely to receive a program.
A comparison of self-reported and administrative data use for four studies in Kenya
found that the measured impact of mobile phone messages using self-reported data
exceeded the impacts measured through administrative data (Fabregas et al., 2021).
To address concerns around experimenter demand effects, administrative data
on purchases from input sellers could be used to measure farmer behavior. For
instance, the text message program that encouraged farmers in East Africa to use
locally appropriate inputs used both administrative data from input sellers and data
from redemption of electronic discount coupons to understand whether farmers were
more likely to purchase recommended inputs (Fabregas et al., 2021).
Yield Measurement Researchers might be most interested in estimating effects
on farm profits or yields. However, the measurement of profits requires detailed
data and assumptions about input and labor use and costs. Impacts on yields are
often imprecisely estimated since it is often difficult for farmers to report yields
precisely, and yields are dependent on a number of other environmental factors,
such as seasonal rainfall. Moreover, small impacts on farmer behavior are likely to
translate to modest improvements in yields, which might be difficult to detect.
A potentially promising approach for obtaining multiple seasons of yield data at
limited cost (outside of contract farming settings) would be to obtain GPS location
information for farmers’ plots and then assess yields over multiple years using
satellite data. Recent studies demonstrate a strong correlation between satellite
yield measurements, crop cut data, and full plot harvests (Burke & Lobell, 2017;
Lambert et al., 2018). An ongoing evaluation in India suggests that satellite yield
measurements can reduce standard errors in estimates of treatment effects by
over 50% when compared to farmer-reported data (Cole et al., 2020). This can
substantially improve statistical power to detect impact (Fig. 8.4).
8 Digital Agricultural Extension for Development
207
Fig. 8.4 Satellite-based yield measurement (a) Plot boundary data collected via Garmin; (b)
Satellite-based (reNDVI) vs. self-reported yields. Cole et al. (2020) use satellite-based yield
measures to evaluate the effect of customized fertilizer recommendations among cotton farmers
in Gujarat, India. They collected plot boundary data using a Garmin GPS hand device (Panel
a). Panel b illustrates the positive correlation between vegetation index and self-reported yield
measurements. They calculate vegetation index values “by taking the median value of each VI pixel
contained in each sample plot for 5 Sentinel-2 images from 2018 . . . [and taking] the maximum
value across the 5 satellite images”
208
R. Fabregas et al.
Box 8.5: Learning Through Feedback and Experimentation in a Government Agency
The use of mobile technologies in the public sector is usually discussed in
the context of addressing traditional government failures, such as limited
accountability and incentives for public-sector workers (Dal Bó et al., 2021;
Callen et al., 2020; Muralidharan et al., 2020). To date, most mobile phonebased agricultural extension services rarely rely on public sector workers for
delivery. Instead, the potential of these services lies in the large volume of user
feedback data for rapid assessment, experimentation, and iterations. However,
the government may face a new type of capacity constraints in leveraging the
available data to monitor and improve the design of technology-based services. The example described in this box demonstrates that these constraints
exist, but that they can be overcome.
An (anonymous) government agency has been operating an IVR-based
agricultural information service for several years. When a farmer calls into the
system through a toll-free number, the automated hotline service starts with a
language selection and questions on farmer location and other characteristics
for the first-time users. Only after this is completed, it takes farmers to the
menu selection with a variety of agricultural topics for more than 20 crops.
The system had been accessed by nearly three million farmers by mid-2017,
but only a small fraction of farmers called back after the first try.
A research team conducted a diagnostic assessment of the system in 2017,
in which they analyzed the existing administrative data on system usage
to understand usage patterns and identify potential issues with the system
(PxD, 2018). This exercise was followed by a series of in-person design
sessions with farmers, where researchers observed farmers calling navigating
the system in real to identify pain points. Additionally, a phone survey of
users was conducted to assess the accuracy of farmer profiling data collected
by the IVR service. This assessment revealed that the service was losing a
nontrivial number of farmers in every required menu selection. The insights
from the diagnostic assessment led to a number of ideas for system design
improvements. The research team and the government agency started regular
meetings to brainstorm ideas and agreed to implement A/B tests to experiment
with different solutions. Over the following 2 years, 13 A/B tests were
implemented, 6 of which have shown to significantly increase the likelihood
of farmers successfully accessing agricultural content.
Selected insights from the diagnostic assessment and system tweaks for
A/B testing
(continued)
8 Digital Agricultural Extension for Development
209
Box 8.5 (continued)
Observation
Majority of first-time callers do not
complete the registration and drop
from the call
Majority of users select the menu
option by pressing #1 on the keypad
Recommended system tweaks
Remove registration questions for
the first-time callers and postpone
them to a later call
Rotate the menu option seasonally
to keep the most relevant topic as
the first option
Many users do not press any key
Add menu replay twice if no option
after a question; the system hangs up is selected, before the application
if no response
hangs up
Add pause in between options for
language menu
Slow down the speed of recording
Most farmers don’t access
Add push call explaining how to
agricultural content
use IVR service
4 Innovations to Improve Impacts
In this section, we discuss selected areas of innovation that offer significant potential
for improving impacts for farmers.
4.1 Customization
Agricultural information can be customized across a range of dimensions. First,
optimal agricultural practices vary widely in line with local conditions. For example,
several field experiments have demonstrated a large spatial variation in yields and
yield responses to inputs (Zingore et al., 2007; Seo et al., 2009; Suri, 2011; Tittonell
& Giller, 2013), and agronomic research provides strong evidence that the nutrient
composition in a particular soil informs which set of fertilizers, and quantities,
thereof, will be optimal for maximizing yields (Sapkota et al., 2014). Second,
the benefits farmers derive from advice are, in part, based on the applicability of
the advice relative to real-time changes in the local environment, such as weather
and pest outbreaks. Studies suggest that weather forecasts affect farmer investment
decisions (Pandey, 1998; Chisadza et al., 2020) and that accurate forecasts increase
farm profitability (Rosenzweig & Udry, 2019). Third, both the appropriateness of
agricultural content and optimal message design may vary by farmer characteristics,
210
R. Fabregas et al.
such as land size and access to storage, as well as gender, age, and other individual
characteristics.
The key challenge, across different types of customization, is to generate and
gather relevant local data at scale (see Box 8.6 for some resources). In some
cases, there is insufficient coordination and poor incentives among stakeholders to
direct resources toward data generation. In other cases, the cost of collecting and
aggregating local data and/or packaging it in a way that is accessible and easy to
understand may act as barriers to scaling up.
Box 8.6: Examples of Publicly Available Remote Sensing Data Sources
Global Precipitation Measurement (GPM) Data – https://gpm.nasa.gov/data
The global precipitation measurement (GPM) mission, initiated by NASA
and the Japan Aerospace Exploration Agency (JAXA), is an international
network of satellites that provide global data on rain and snow fall. In the
agricultural context, this data can be applied to analyze and forecast changes
in water resources and, thereby, food security.
Sentinel-2 – https://sentinel.esa.int/web/sentinel/missions/sentinel-2
Sentinel-2 is an imaging mission dedicated to Europe’s Copernicus program. The mission aims at monitoring variability in land surface conditions,
including vegetation and soil and water cover, while also observing inland
waterways and coastal areas. Publicly available data includes coverage of all
continental land surfaces (including inland waters) between latitudes 84◦ N
and 56◦ S, all coastal waters up to at least 20 km from the shore, all islands
greater than 100 km2 , all EU islands, the Mediterranean Sea, and all closed
seas (e.g., the Caspian Sea).
Google Earth Engine – https://developers.google.com/earth-engine/
datasets/
Google Earth Engine combines a massive catalog of more than 40 years of
historical imagery and scientific datasets with APIs and other analysis tools.
The data catalog is organized into three categories, each with their own subcategories: climate and weather (surface temperature, climate, atmospheric,
weather); imagery (Landsat, sentinel, MODIS, high-resolution imagery); and
geophysical (terrain, land cover, cropland, other geophysical data).
Landsat – https://landsat.gsfc.nasa.gov/
The Landsat series of earth observation satellites is a joint NASA/US
geological survey program that has continuously acquired images of the
Earth’s land surface since 1972. Landsat 8 is the latest mission with moderateresolution (15–100 m, depending on spectral frequency) measurements of the
Earth’s terrestrial and polar regions in the visible, near-infrared, short wave
infrared, and thermal infrared going back to 2013.
MODIS – https://modis.gsfc.nasa.gov/
(continued)
8 Digital Agricultural Extension for Development
211
Box 8.6 (continued)
MODIS (Moderate Resolution Imaging Spectroradiometer) is an instrument that has been launched on the Terra (1999) and Aqua (2002) NASA
satellites. It has a good temporal resolution, imaging the whole earth every
1 or 2 days. This makes it suitable to track large scale trends over time.
For agriculture in particular, NDVI (normalized difference vegetation index)
products can be useful, providing insight into vegetation changes over time.
One MODIS-based NDVI product is MOD13A1.
The European Centre for Medium-Range Weather Forecasts (ECMWF) –
https://www.ecmwf.int/en/forecasts/datasets
ECMWF is a European intergovernmental organization which generates
medium, extended, and long-range forecasts using its own comprehensive
earth system model and conducts research to improve forecasting skills.
Radiant MLHub – https://www.mlhub.earth/#home
Radiant MLHub is an open library for geospatial training data to advance
machine learning applications on earth observations. It aims to be a repository
of data and trained models for development. Currently, it has smallholder crop
classification data but plans to add global land cover in the future.
Consultative Group on International Agricultural Research (CGIAR) Data
Resources – https://bigdata.cgiar.org/wp-content/uploads/2020/05/WebinarSlides-_-Secondary-Data-for-Crop-Modeling-2020-_-Presented.pdf
These slides for the CGIAR webinar: Secondary data for crop modeling:
Filling data gaps under lockdowns include links to various data resources.
Dataset topics include weather, soil properties, cropping calendar, management practices, evaluation data, phone surveys, household surveys, and
satellite remote sensing.
Crowdsourcing The two-way nature of digital communication presents opportunities for aggregating relevant, real-time information through crowdsourcing. For
example, a pest hotline can be used to identify pest outbreaks at an early stage,
allowing faster detection of local outbreaks and alerting farmers in at-risk areas
about pest prevention and management recommendations. Moreover, a “Yelp”like system of customer service ratings could reduce information asymmetry in
input markets (Hasanain et al., 2019). A small but growing literature suggests that
crowdsourcing can be used successfully to reduce information scarcity in a variety
of settings (Bailard & Livingston, 2014; Jame et al., 2016). However, evidence of
its use and utility among smallholder farmer populations is scarce.
The relative advantage of using crowdsourcing to collect information is dependent in large part on whether a sufficiently large number of farmers contribute
information with sufficient accuracy. There is ample room for research in this space
to advance our understanding of technology design and (financial and nonfinancial)
incentives for farmers to contribute high-quality information. A risk linked to
212
R. Fabregas et al.
crowdsourcing that requires attention in the design process is a potential data gap for
less technology-adept farmers. If the needs and preferences of less technologically
proficient or literate farmers are different from those who contribute information
to the system, the resulting customization may result in making the information
provided less relevant.
Data-Driven Customization A key advantage of digital agriculture is its ability
to improve the quality of customized advice by using the data it generates. For
example, in settings in which extensive data on farmer characteristics is available,
analysis of large platform data may reveal differential patterns in system usage by
farmer characteristics. These patterns could then be tested in A/B tests to inform
systems and service iteration and improvements (see Box 8.5). Furthermore, when
agricultural outcome data is available at large scale, customized recommendations
based on agronomic trials or a crop model can be empirically validated in real farm
settings and improved through subsequent experiments.
4.2 Using Digital Technology to Facilitate Social Learning
A large volume of literature suggests that social learning – learning from the experience of other farmers – is key to facilitating optimal technology adoption among
farmers (Munshi, 2004; Bandiera & Rasul, 2006; Conley & Udry, 2010). Existing
evidence suggests that mobile phone-based agricultural information services can
generate information spillovers. For instance, in India, farmers who had not received
the piloted services in the trial increased interactions with, and learned from others,
who had (Cole & Fernando, 2021). Furthermore, directing the flow of information
via mobiles phones can also affect existing dynamics of information networks
(Fernando, 2021).
Beyond the diffusion of agricultural information through existing mechanisms,
advanced communications technologies offer scope for increasing and directing the
flow of information among farmers to facilitate more efficient learning. First, digital
messages can be designed to spur conversations about agricultural practices and
inputs within existing networks. Moreover, a farmer’s beliefs about a particular
input or practice may be influenced by the experience and beliefs of others. With
or without novel information, increasing conversations about a particular input
can potentially accelerate learning among farmers. Second, the two-way character
of digital communications technology allows farmers to exchange information
and learn from experts and other farmers beyond their networks of friends and
neighbors. It is common in a radio program to solicit questions from listeners and
broadcast responses as a way of facilitating learning. With digital technology, this
type of learning can happen much more locally and in real time.
An important consideration when using digital tools to accelerate learning among
farmers is the potential presence of behavioral factors in learning. Existing literature
suggests that individuals confront a range of barriers when communicating factual
8 Digital Agricultural Extension for Development
213
information, experience, and perceptions and in interpreting information shared by
others (e.g., Benjamin et al., 2016; Breza et al., 2018; Eyster et al., 2018). For
example, if farmers who have had a bad experience with a new input talk more about
their experience than those who had successful experiences with the same input,
there may be convergence on an inaccurate belief that the input is ineffective. Given
the nascent nature of these innovations, rigorous experimentation, assessment, and
iteration – as discussed in the earlier section – will be critical for advancing the
development of digital social learning tools capable of amplifying the impact of
digital agricultural extension.
4.3 Digital Support for Existing Extension Systems
Digital agricultural extension can complement traditional extension systems. While
many governments in developing countries maintain a network of extension workers, the evidence base on their impact on farmer outcomes is limited. (Anderson &
Feder, 2004). Agricultural extension workers are difficult to monitor and incentivize:
many tasks involve working independently, often in remote communities, with
limited supervision. In addition, a lack of resources and poor institutional capacity
limits the availability of training and technical support to extension workers. There
are three broad mechanisms through which digital technology can potentially
improve in-person extension services.
Extension for Extensionists Extension workers could be supported with better
resources made available through digital devices. For example, extension agents
could access detailed localized information through smartphones and could receive
reminders to use appropriate messages for farmers based on the stage of the
local agricultural season or to communicate important developments such as pest
outbreaks, adverse weather conditions, or market disruptions. In a recent metaanalysis which estimated a positive impact of digital agricultural extension on
farmer yields (Fabregas et al., 2019), four of the seven impact estimates were
derived from an “indirect” model in which digital advice was delivered to farmers
via extension agents or field officers.
Communication Between Farmers and Extension Workers Digital technology
can facilitate communication between farmers and extension workers. An IVR
system could aggregate local information to service commonly asked questions
and equip extension workers with relevant information and recommendations. This
could help extension workers determine which content is relevant for farmers in
their area. Extension workers could also notify farmers about activities such as
farmer field days or demonstration plots. Many extension workers already use digital
communication channels, such as WhatsApp, to exchange information among
themselves. However, these are nascent developments, and a dearth of rigorous
evidence makes this a fertile area for future research.
214
R. Fabregas et al.
Performance Management There is growing evidence on the use of mobile
phones to help improve motivation and accountability of public-sector workers
in developing countries, and a number of new initiatives have been successful at
scaling up (e.g., Dimagi’s CommCare, a data collection platform for frontline health
workers). A study in Paraguay showed that increased monitoring of agricultural
extension workers through the use of GPS-equipped mobile phones resulted in a
22% increase in the likelihood of visiting a given farmer over 7 days (Dal Bó et
al., 2021). Calling beneficiaries to verify the delivery of cash transfers to farmers in
Telangana, India, reduced nondelivery of the transfer by 8% (Muralidharan et al.,
2020). In Pakistan, a smart-phone app to track activities of health facility inspectors
increased the likelihood of rural health clinic inspection by 74% (Callen et al.,
2020). In addition to increasing the effectiveness of monitoring, a mobile phonebased app that allows self-tracking has been shown to harness intrinsic motivation,
and was associated with a 24% increase in performance (Lee, 2018).
5 Lessons Learned
In this chapter we discuss a number of issues that practitioners and researchers
would need to consider when working with digital agricultural extension technologies. We provided insights from our work with several initiatives, implemented in
different countries by a variety of organizations. While existing evidence suggests
that these approaches can have positive impacts, delivering on the full promise of
digital agriculture will require sustained iteration and testing. Moreover, as more
sophisticated mobile technologies improve and are adopted over time, several more
opportunities will open up.
While we identified a number of promising areas for future study throughout the
chapter, we failed to discuss other important topics in digital agricultural extension.
First, digital technologies can also help improve supply chains more widely. For
instance, a hotline offered by a sugar company that contracted with sugarcane
farmers led to an improvement in the delivery of inputs because farmers could
report problems (Casaburi et al., 2019a). A system for agricultural supply dealers
could be used to give better recommendations to farmers and gather data on which
items to stock while facilitating price comparisons for farmers. Second, digital
approaches might be particularly important during emergencies. Information could
quickly get out (e.g., pests or weather shocks), but they could also help governments
and other agencies gather information directly from farmers about critical needs.
Third, crowdsourced information can be useful for a variety of purposes beyond
agriculture. There might be complementarities with other sectors, or new ways of
generating impacts, where data are responsibly shared for a variety of purposes.
We conclude by encouraging readers to actively engage with user needs and the
constraints people face on the ground but also by having clear conceptual models or
8 Digital Agricultural Extension for Development
215
theories of change that can help guide the development and implementation of these
technologies.
Discussion Questions
1. What are the trade-offs between improving customization and reaching scale in
digital agricultural extension? What drives the trade-offs?
2. How could farmers who do not own a mobile device or do not own smartphones
benefit from digital extension approaches?
3. Many development interventions follow the three-stage process – pilot, evaluate,
and scale – but digital interventions may benefit from scaling quickly. What are
the potential benefits and costs of this strategy? How do you ensure that the
service delivers impacts to farmers?
4. Should digital agricultural extension services focus on solutions for basic phones
because they would generate large benefits for the majority of poor smallholder
farmers now or leverage the power of smartphones to create solutions that would
generate large benefits in the future?
5. What are the potential distributional implications of digital agricultural extension?
6. Oftentimes agricultural information requires sending information about probabilities (e.g., the likelihood of rainfall) or potential risks. What are strategies to
convey this information in an intuitive way to populations with low levels of
education?
Acknowledgements We thank all of our partner organizations for making this work possible and
the PAD team, especially Jonathan Faull, for valuable comments and support. Prankur Gupta and
Diana McLeod provided superb research assistance.
References
Aker, J. C. (2011). Dial “A” for agriculture: A review of information and communication
technologies for agricultural extension in developing countries. Agricultural Economics, 42(6),
631–647.
Aker, J. C., Ghosh, I., & Burrell, J. (2016). The promise (and pitfalls) of ICT for agriculture
initiatives. Agricultural Economics. Wiley Online Library, 47(S1), 35–48.
Anderson, J., & Feder, G. (2007). Agricultural extension. In R. E. Evenson (Ed.), Agricultural
development: Farmers, farm production and farm markets. Handbook of agricultural economics (pp. 2343–2378). Elsevier.
Anderson, J. R., & Feder, G. (2004). Agricultural extension: Good intentions and hard realities.
The World Bank Research Observer. Oxford University Press, 19(1), 41–60.
Arouna, A., et al. (2019). One size does not fit all: Experimental evidence on the digital delivery of
personalized extension advice in Nigeria. Available at: https://www.researchgate.net/publi
cation/336927609_One_Size_Does_Not_Fit_All_Experimental_Evidence_on_the_Digital_
Delivery_of_Personalized_Extension_Advice_in_Nigeria
Axmann, N., et al. (2018). Agricultural extension, mobile phones, and outgrowing: Is it a win-win
for farmers and companies? Available at: http://ageconsearch.umn.edu/record/274234/files/
Abstracts_18_05_23_08_25_40_08__172_16_20_153_0.pdf
216
R. Fabregas et al.
Bailard, C. S., & Livingston, S. (2014). Crowdsourcing accountability in a Nigerian election.
Journal of Information Technology & Politics. Routledge, 11(4), 349–367.
Bandiera, O., & Rasul, I. (2006). Social networks and technology adoption in northern Mozambique. The Economic Journal. Oxford Academic, 116(514), 869–902.
Benjamin, D. J., Rabin, M., & Raymond, C. (2016). A model of nonbelief in the law of large
numbers. Journal of the European Economic Association. Wiley/Blackwell, 14(2), 515–544.
https://doi.org/10.1111/jeea.12139
BenYishay, A., & Mobarak, A. M. (2019). Social learning and incentives for experimentation and
communication. The Review of Economic Studies. Oxford Academic, 86(3), 976–1009.
Björkegren, D. (2019). The adoption of network goods: Evidence from the spread of mobile phones
in Rwanda. The Review of Economic Studies. Oxford Academic, 86(3), 1033–1060.
Breza, E., et al. (2018) Seeing the forest for the trees? An investigation of network knowledge.
Available at: https://stanford.edu/~arungc/BCT.pdf
Burke, M., & Lobell, D. B. (2017). Satellite-based assessment of yield variation and its determinants in smallholder African systems. Proceedings of the National Academy of Sciences of the
United States of America, 114(9), 2189–2194.
Callen, M., et al. (2020). Data and policy decisions: Experimental evidence from Pakistan. Journal
of Development Economics, 146, 102523.
Camacho, A., & Conover, E. (2011). The impact of receiving price and climate information in
the agricultural sector. IDB working paper series. Available at: https://publications.iadb.org/
publications/english/document/The-Impact-of-Receiving-Price-and-Climate-Information-inthe-Agricultural-Sector.pdf
Casaburi, L., Kremer, M., & Ramrattan, R. (2019a) Crony capitalism, collective action, and ICT:
Evidence from Kenyan contract farming. Available at: http://econ.uzh.ch/dam/jcr:e2ffc4e5ab32-4405-bfa4-70b0e962aa81/hotline_paper_20191015_MERGED.pdf
Casaburi, L., et al. (2019b). Harnessing ICT to increase agricultural production: Evidence from
Kenya, Working paper. Available at: https://www.econ.uzh.ch/dam/jcr:873845ce-de4d-4366ba9a-d60accda577d/SMS_paper_with_tables_20190923_merged.pdf
Chisadza, B., et al. (2020). Opportunities and challenges for seasonal climate forecasts to more
effectively assist smallholder farming decisions. South African Journal of Science. Academy
of Science of South Africa, 116(1–2), 1–5.
Cole, S., & Sharma, G. (2017). The promise and challenges in implementing ICT for agriculture.
Working paper. Available at: https://precisionag.org/uploads/cole-sharma-july1-2017.pdf
Cole, S. et al. (2020). “Using satellites and phones to evaluate and promote agricultural
technology adoption: Evidence from smallholder farms in India”. Working Paper, September. https://2uy7xawu7lg2zqdax41x9oc1-wpengine.netdna-ssl.com/wp-content/uploads/2020/
09/ATAI_Paper.sep18.2020.pdf
Cole, S. A., & Nilesh Fernando, A. (2021). Mobile’izing agricultural advice technology adoption
diffusion and sustainability. The Economic Journal, 131(633), 192–219.
Cole, S. A., & Xiong, W. (2017). Agricultural insurance and economic development. Annual
Review of Economics. Annual Reviews, 9(1), 235–262.
Conley, T. G., & Udry, C. R. (2010). Learning about a new technology: Pineapple in Ghana. The
American Economic Review, 100(1), 35–69.
Courtois, P., & Subervie, J. (2015). Farmer bargaining power and market information services.
American Journal of Agricultural Economics. Oxford University Press, 97(3), 953–977.
Cunguara, B., & Moder, K. (2011). Is agricultural extension helping the poor? Evidence from rural
Mozambique. Journal of African Economies. Narnia, 20(4), 562–595.
Dal Bó, E., Finan, F., Li, N. Y., & Schechter, L. (2021). Information technology and government
decentralization: Experimental evidence from paraguay. Econometrica, 89(2), 677–701.
Das, S. R. (2012). Rice in Odisha. Available at: https://ageconsearch.umn.edu/record/287645/files/
TB16_content.pdf
Udry. (2019). Draft final report on disseminating innovative resource-based technologies for
small scale farmers in Ghana. Draft report. Available at: https://www.atai-research.org/
8 Digital Agricultural Extension for Development
217
informationmarket-access-and-risk-addressing-constraints-to-agricultural-transformation-innorthernghana/
Emerick, K., & Dar, M. H. (2020). Farmer field days and demonstrator selection for increasing
technology adoption. Review of Economics and Statistics, 1–41. https://doi.org/10.1162/
rest_a_00917
Eyster, E., Rabin, M., & Weizsäcker, G. (2018). An experiment on social mislearning. Available
at: http://ssrn.com/abstract=2704746
Fabregas, R., Kremer, M., Lowes, M., et al. (2021). “Digital information provision and behavior
change: Lessons from six experiments in East Africa”, Working Paper. Available at: https://
drive.google.com/file/d/1cDqxx-0RNf6GA2QIPq3pIdm5loAw6GP8/view
Fabregas, R., Kremer, M., Robinson, J., & Schilbach, F. (2017). Evaluating agricultural dissemination in Western Kenya, 3ie impact evaluation report 67. International Initiative for Impact
Evaluation (3ie).
Fabregas, R., Kremer, M., & Schilbach, F. (2019). Realizing the potential of digital development:
The case of agricultural advice. Science, 366(6471). https://doi.org/10.1126/science.aay3038
Fafchamps, M., & Minten, B. (2012). Impact of SMS-based agricultural information on Indian
farmers. The World Bank Economic Review. Oxford University Press, 26(3), 383–414.
Fernando, N. A. (2021). Seeking the treated: The impact of mobile extension on farmer information
exchange in India. Journal of Development Economics, 153, 102713, ISSN 0304–3878. https:/
/doi.org/10.1016/j.jdeveco.2021.102713
Fishman, R., et al. (2016). Can information help reduce imbalanced application of fertilizers in
India?: Experimental evidence from Bihar. International Food Policy Research Institute.
Fu, X., & Akter, S. (2016). The impact of mobile phone technology on agricultural extension
services delivery: Evidence from India. The Journal of Development Studies, 52(11), 1561–
1576.
Gandhi, R., et al. (2007). Digital green: Participatory video for agricultural extension. 2007
international conference on information and communication technologies and development.
https://doi.org/10.1109/ictd.2007.4937388.
Hanna, R., Mullainathan, S., & Schwartzstein, J. (2014). Learning through noticing: Theory and
evidence from a field experiment. The Quarterly Journal of Economics. MIT Press, 129(3),
1311–1353.
Hasanain, A., Khan, M. Y., & Rezaee, A. (2019). No bulls: Experimental evidence on the
impact of veterinarian ratings in Pakistan. Available at: https://armanrezaee.github.io/pdfs/
livestock_3sept2019.pdf
Hidrobo, M., et al. (2020). Paying for digital information: Assessing farmers’ willingness
to pay for a digital agriculture and nutrition service in Ghana. https://doi.org/10.2499/
p15738coll2.133591
IDinsight. (2019). IVR and text message interventions to provide fertilizer information to
farmers — Experiments from India. IDinsight Blog. Available at: https://medium.com/
idinsight-blog/ivr-and-text-message-interventions-to-provide-fertilizer-information-tofarmers-16e651402be6. Accessed: 26 May 2020.
Jain, A., et al. (2019). Low-cost aerial imaging for small holder farmers. In Proceedings of the
2nd ACM SIGCAS conference on computing and sustainable societies. New York, NY, USA:
Association for Computing Machinery (COMPASS ‘19), pp. 41–51.
Jame, R., Johnston, R., & Markov, S. (2016). The value of crowdsourced earnings forecasts.
Journal of Accounting Research. Wiley Online Library, 54(4), 1077–1110.
Kondylis, F., Mueller, V., & Zhu, J. (2017). Seeing is believing? Evidence from an extension
network experiment. Journal of Development Economics. Elsevier, 125, 1–20.
Koo, J. (2014). Maize yield potential. In Atlas of African agriculture research and development
(pp. 58–59). International Food Policy Research Institute.
Lambert, M.-J., et al. (2018). Estimating smallholder crops production at village level from
Sentinel-2 time series in Mali’s cotton belt. Remote Sensing of Environment, 216, 647–657.
Lambin, E. F., et al. (2013). Estimating the world’s potentially available cropland using a bottomup approach. Global Environmental Change: Human and Policy Dimensions, 23(5), 892–901.
218
R. Fabregas et al.
Larochelle, C., et al. (2019). Did you really get the message? Using text reminders to stimulate
adoption of agricultural technologies. The Journal of Development Studies, 548–564. https://
doi.org/10.1080/00220388.2017.1393522
Lee, S. (2018). Intrinsic incentives: A field experiment on leveraging intrinsic motivation in public
service delivery. SSRN Electronic Journal. https://doi.org/10.2139/ssrn.3537336
Munshi, K. (2004). Social learning in a heterogeneous population: Technology diffusion in the
Indian green revolution. Journal of Development Economics, 73(1), 185–213.
Muralidharan, K., et al. (2020). Improving last-mile service delivery using phone-based monitoring. https://doi.org/10.3386/w25298
Nakasone, E. (2013). The role of price information in agricultural markets: Experimental evidence
from rural Peru. Agricultural and Applied Economics Association. https://doi.org/10.22004/
ag.econ.150418
Nakasone, E., Torero, M., & Minten, B. (2014). The power of information: The ICT revolution
in agricultural development. Annual Review of Resource Economics. Annual Reviews, 6(1),
533–550.
Olson, P. (2018, 15 October). This startup built a treasure trove of crop data by putting a.I. in
the hands of Indian farmers. Forbes Magazine. Available at: https://www.forbes.com/sites/
parmyolson/2018/10/15/this-startupbuilt-a-treasure-trove-of-crop-data-by-putting-ai-in-thehands-of-indian-farmers/. Accessed: 27 May 2020.
PxD. (2018). Farmers listen to more advice when asked for call preference. Available
at:
https://precisionag.org/wp-content/uploads/2019/12/Call-frequency_Listeningrates_Gujarat_2.2019.pdf
Pandey, S. (1998). Risk and the value of rainfall forecast for rainfed rice in the Philippines.
Philippine Journal of Crop Science (Philippines). Available at: http://agris.fao.org/agris-search/
search.do?recordID=PH2001100781
Rosenzweig, M. R., & Udry, C. R. (2019). Assessing the benefits of long-run weather forecasting
for the rural poor: Farmer investments and worker migration in a dynamic equilibrium model.
National Bureau of Economic Research (Working Paper Series). https://doi.org/10.3386/
w25894.
Saito, K., Mekonnen, H., & Spurling, D. (1994). Raising the productivity of women farmers in
sub-Saharan Africa. World Bank.
Sapkota, T. B., et al. (2014). Precision nutrient management in conservation agriculture based
wheat production of Northwest India: Profitability, nutrient use efficiency and environmental
footprint. Field Crops Research, 155, 233–244.
Seo, S. N., et al. (2009). A Ricardian analysis of the distribution of climate change impacts On
agriculture across agro-ecological zones in Africa. Environmental and Resource Economics,
43(3), 313–332.
Suri, T. (2011). Selection and comparative advantage in technology adoption. Econometrica:
Journal of the Econometric Society, 79(1), 159–209.
Tittonell, P., & Giller, K. E. (2013). When yield gaps are poverty traps: The paradigm of ecological
intensification in African smallholder agriculture. Field Crops Research, 143, 76–90.
Tjernström, E., et al. (2019). Learning by (virtually) doing: Experimentation and belief updating in smallholder agriculture. Available at: https://www.lafollette.wisc.edu/sites/tjernstrom/
Learning_by_virtually_doing.pdf
Union, U. P. (2012). Addressing the world – An address for everyone. White paper.
Available at: http://www.upu.int/fileadmin/documentsFiles/activities/addressingAssistance/
whitePaperAddressingTheWorldEn.pdf
Van Campenhout, B., Spielman, D. J., & Lecoutere, E. (2018). Information and communication
technologies (ICTs) to provide agricultural advice to smallholder farmers experimental
evidence from Uganda. IFPRI Discussion Paper.
Van Campenhout, B., et al. (2019). The role of information in agricultural technology adoption:
Experimental evidence from rice farmers in Uganda. Economic Development And Cultural
Change. core.ac.uk. Available at: https://core.ac.uk/download/pdf/153429888.pdf
Webster, P. J. (2013). Improve the weather forecast for the developing world. Nature, 493, 17–19.
8 Digital Agricultural Extension for Development
219
Webster, P. J., Toma, V. E., & Kim, H.-M. (2011). Were the 2010 Pakistan floods predictable?
Geophysical Research Letters, 38(4). https://doi.org/10.1029/2010GL046346
World Bank. (2007). World development report 2008: Agriculture for development. World Bank.
Available at: https://openknowledge.worldbank.org/handle/10986/5990
Zabel, F., et al. (2019). Global impacts of future cropland expansion and intensification on
agricultural markets and biodiversity. Nature Communications, 10(1), 2844.
Zingore, S., et al. (2007). Soil type, management history and current resource allocation: Three
dimensions regulating variability in crop productivity on African smallholder farms. Field
Crops Research, 101(3), 296–305.
Open Access This chapter is licensed under the terms of the Creative Commons Attribution 4.0
International License (http://creativecommons.org/licenses/by/4.0/), which permits use, sharing,
adaptation, distribution and reproduction in any medium or format, as long as you give appropriate
credit to the original author(s) and the source, provide a link to the Creative Commons license and
indicate if changes were made.
The images or other third party material in this chapter are included in the chapter’s Creative
Commons license, unless indicated otherwise in a credit line to the material. If material is not
included in the chapter’s Creative Commons license and your intended use is not permitted by
statutory regulation or exceeds the permitted use, you will need to obtain permission directly from
the copyright holder.
Chapter 9
Digital Trading and Market Platforms:
Ghana Case Study
Keren Neza, Yaw Nyarko, and Angela Orozco
1 Development Challenge
In many poor nations and areas, the lack of markets is a major constraint to
economic development. We will focus in this paper on smallholder agriculture,
primarily in sub-Saharan Africa. In these areas, farmers would want to increase
their outputs but worry that they will not find buyers for their crops at a good
price. Buyers and traders similarly often have needs for agricultural goods and often
cannot find farmers to supply those goods at the right quality and consistency over
time. Potential agricultural food processing industrialists would want to set up their
factories but also fear that they will not be able to reliably and consistently obtain
the inputs for their goods.
In other words, in many poor nations, the lack of adequate markets is a big
constraint on economic progress and growth. In economics, we normally refer to
a market failure as a problem within economies which prevents Adam Smith’s
invisible hand to guide a nation or society to the optimum. Market failures are often
defined as situations where there are gains from trade among different economic
agents but where the markets are either nonexistent or have problems which prevent
those gains from trade from being realized. These are situations in which if the
market failure could be addressed there could be gains or benefits to the different
market participants collectively.
This paper makes the case for the role of technology in addressing issues related
to the lack of markets or the poor functioning of markets. We study how technology
K. Neza · A. Orozco
Center for Technology and Economic Development, New York University, New York, NY, USA
Y. Nyarko ()
Division of Social Science, New York University Abu Dhabi, New York University, New York,
NY, USA
e-mail: yaw.nyarko@nyu.edu
© The Author(s) 2023
T. Madon et al. (eds.), Introduction to Development Engineering,
https://doi.org/10.1007/978-3-030-86065-3_9
221
222
K. Neza et al.
could help engineer improvements in markets or the creation of markets where
none existed before. As we mentioned earlier, we focus on sub-Saharan agricultural
markets primarily, and that will be where we draw most of our examples. We believe,
however, that the work presented here also applies to many other smallholderdominated farming areas in developing countries.
So, in what precise forms does the inadequacy of markets take in our context of
small holder farmers? In what ways is the “market failure” manifested? We will list
a few of these now. The technological innovations we discuss in this chapter will
address many of these failures.
This chapter is of course not the place to provide a lengthy description of
agricultural markets in rural sub-Saharan Africa and similar emerging countries. For
what we study though, there are two main economic agents we will identify. The
first is the smallholder farmer. This farmer typically uses little machinery outside
of his or her cutlass and produces on small tracks of land typically one or two
acres. The other market participant is the trader or buyer. Most traders are small
and travel to a limited number of villages to look for farmers with crops to sell and
negotiate a price with them. The trader then takes the crops to bigger markets to sell.
Sometimes, there are slightly larger buyers working on behalf of agro-processors
or larger poultry companies who purchase crops from farmers in a manner similar
to the traders but with slightly higher volumes. Due to poor road infrastructure,
transportation by traders to farmers’ farms or villages is relatively expensive and
time-consuming for the trader.
With this brief picture of the context of the agricultural market structure we study,
we now list some of the precise development challenges inherent in this system.
1.1 Matching Supply and Demand
In many rural areas, farmers wait on their farms (technically their “farm gates”)
with their crops waiting for traders to pass by and negotiate terms for a sale (see,
e.g., Aker & Ksoll, 2016; Svensson & Yanagizawa, 2009; Drott & Svensson, 2010).
Alternatively, they may send their goods to very small nearby villages or smalltown markets again waiting for traders to show up. The traders in turn may live in
bigger towns or cities. There are a large number of different villages each trader
could visit to purchase crops. They may make the trek to one village, incurring the
transport cost, only to find that there is very little good quality crop to be picked up
there. There may be another village that the trader could have gone to with good
crops at a good price; however, the trader did not have that information and so did
not travel to that village. There is therefore a missing market or trades that should
have taken place but did not (see Fafchamps & Minten, 2012; Demise et al., 2017;
Ssekibuule et al., 2013). The farmer with the good crops and the trader with the
need for those crops could not meet and trade because they did not know each other
existed on that particular trading day. Some aspects of this interaction have been
modeled as a search process (see, e.g., Nyarko & Pellegrina, 2020) – farmers are
9 Digital Trading and Market Platforms: Ghana Case Study
223
searching for traders and traders are searching for farmers, and many times each
may fail to find the other. The lack of information on the existence or whereabouts
of the farmer and trader is a major source of the market failure in this case. That is,
when the farmer and trader do not succeed in finding each other, a “market” cannot
be formed for them to trade. The farmer would then be stuck with his/her unsold
produce (“postharvest losses”), and the trader may have incurred travel costs to a
village and will have to return empty-handed. This is a “market failure.”
In the literature, there is debate about the source of the market failure and even the
existence of the market failure (i.e., where the market fails to function properly and
enable people who want to trade to be able to find each other and be able to trade).
For instance, Dillon and Dambro (2017) suggest that in these agricultural settings,
there is no market failure and that the evidence has focused on measuring market
integration (prices being set correctly) rather than market failure per se. They argue
that there may be hidden risks or costs borne by traders which may cause markets
to appear inefficient with less than optimal trading but that they are efficient if these
risks and costs are factored into the analysis. For example, traders may have to
factor into their calculations the risk of losing their goods when trucks break down
on bad roads or if their goods are stolen. However, there is vast evidence that shows
otherwise – smallholder farmers face constraints on both the supply side (inputs
needed by farmers like fertilizers, seeds, and tractor services are in limited supply)
and the demand side (buyers of their farm produce do not show up or provide good
prices). On the supply side, some of the well-studied constraints faced by farmers
include credit access (Banerjee, 2013; Harrison & Rodríguez-Clare, 2009) and lack
of quality inputs (Bai, 2018). On the demand side, some of the constraining factors
studied in the literature include access to high-income and high-price markets (Atkin
et al., 2017; Verhoogen, 2008).
1.2 Price Information
There is a second aspect of lack of good markets which applies to smallholder
farming. Typically, one side of the market does not have full information to make the
appropriate economic decisions (see, e.g., Goyal, 2010; Allen, 2014; Startz, 2016).
In our case of smallholder agriculture, it is usually the farmer who is stuck on his
or her farm in a small village and has less information than the trader. The trader in
contrast is the one who is often in a bigger town or else travels to many markets and
so is up to date on the general trading conditions. When a trader goes to the farmer’s
farm to negotiate a trade, the trader usually has better information than the farmer.
This often means that the trader will be able to offer the farmer unreasonably low
prices because the farmer does not know that there are other markets where prices
are higher. The price of a crop could be commanding high prices in a city. The trader
who comes to visit the farmer may offer the farmer low prices for the farmer’s goods.
The farmer, not knowing that prices have recently risen in the cities, would accept
the lower price offered by the trader. If the farmer had known of the better prices,
224
K. Neza et al.
Fig. 9.1 Results of a survey of farmers on the question of knowledge of prices
the farmer would have bargained for a better price. Figure 9.1 shows the result of
a survey of farmers on the question of knowledge of prices from Hildebrandt et al.
(2020).
One could argue that, since both the farmer and the trader are poor, this is not a
major problem because all this means is that traders can get a better price relative
to farmers. In other words, what is the relative distribution of the gains from trade
among these two market participants? Of course, to us as researchers, there are two
responses to this. The first is that if the farmers could be guaranteed higher and
more consistent prices, then the farmers would respond by increasing their output
and perhaps investing more in their farms. That is, the lack of information on prices
could be introducing risk and uncertainty to farmers making them unwilling to
expand the scale of their operations. The second response is that we do often place
more weight on the welfare of farmers than on traders. The farmers are usually
poorer and have fewer alternative options for work in comparison with the traders
and buyers of produce. So, both government policy and researchers often seek ways
of improving the lot of farmers relative to the traders and buyers.
An important role of markets is what is often called “price discovery.” It is
meant to convey the belief that the markets communicate the “true” price of the
commodity – that which will clear the market so farmers sell all they want and
buyers buy all they want at the prevailing prices. In poorer communities and in
particular in many smallholder agricultural communities, the trading processes do
not result in the appropriate price discovery. The markets, to the extent that they
exist, do not perform adequately their price discovery function. Markets do not
inform the farmers of the potential true value of their crops, so they can make correct
9 Digital Trading and Market Platforms: Ghana Case Study
225
economic decisions. There could be high demand for a farmer’s goods in a city (high
prices), but nobody shows up to the farmer’s farm in the village to ask for his/her
goods. Alternatively, there could be abundant surpluses of a crop in one area or
village (low prices), which is needed in a town, but the trader does not know of this
so does not go to that area. The prices in the different areas are not transparent to (or
known by) the farmers and traders. Or, technically, there is little “price discovery.”
1.3 Information on the Quality of Crops
In many of the rural economies we study, there are typically complaints on both
sides of the market exchange, farmers and buyers, about quality issues. On the one
hand, buyers and traders complain that they do not get from farmers the quality
of goods that they would desire. They say that the farmers are always trying to
cheat them with inferior-quality goods. The prices traders pay to farmers, therefore,
have to take into account the possible low quality of the goods they receive. On the
other hand, many farmers do not believe that traders are honest in the assessment
of the quality of their produce. Many farmers, because of this, do not believe that
they receive the full benefits from improving the quality of their goods (Bagwell,
2007; Bai, 2018). Consider the example of smallholder transactions in maize (corn).
Traders or buyers would want dry and clean maize free of pests and diseases
like aflatoxins (a mold-like disease). Visual inspection of the maize is not always
sufficient to check for disease and pests, especially in large bags. Farmers in turn do
not believe that they will get better prices if they go through the work of properly
drying the maize and fully clearing it of dirt and pests. Even if they believe there is
some reward to this activity, they are not fully conversant with the price gradient –
how much additional money they receive for the additional increase in the quality
of their grains. Again, this is a failure of the market to adequately provide the price
signals, in this case, the price gradient for quality (see Saenger et al., 2014; Bernard
et al., 2017).
This market failure has important effects on the rural economy. Farmers often
complain that they are not getting enough for their crops. They often say that they
would put in more effort in their farming if they could be assured of a return on
that investment. If the markets could create the price gradient in quality, the farmers
would “climb” that gradient by producing better-quality goods, thereby increasing
the return from their efforts and their crops. Traders and buyers too would benefit
from the higher-quality goods. For example, many agro-processing industries
cannot function without the reliable supply of consistently high-quality grains. In
short, the economic development and transformation of the rural economies may be
stymied by the market failure in pricing for quality of the crops.
226
K. Neza et al.
1.4 Storage and Credit Market Failures
In rural economies, there is also often the failure of credit markets (World Food
Program, 2010; Svensson & Yanagizawa, 2009). One way in which this happens
and where there is the clearest manifestation of the market failure is in postharvest
credit (Kaminski & Christiaensen, 2014). This is the situation where a farmer has
successfully harvested the crop and has the crop bagged and ready to be sold. The
crop, however, is being harvested at a time when most of the other farmers are
storing their goods. If the crop is sold right after harvest, the farmer receives a low
price for their crop. Indeed, a lot of the crop may go unsold if traders, inundated
with many farmers all trying to sell their maize at the same time, do not come to
their farm gates to purchase the maize. Agro-industries may similarly not need the
produce of the farmers when there is a glut of crops in the market. Instead, they
would most probably prefer the smoothing of the availability of crops across the
year and seasons.
Both the farmers and the buyers would, therefore, wish for there to be a
mechanism for sale of the crops at a future date. For this to work though, credit
may be essential for the farmer. The farmer may need cash upfront to pay for
unavoidable bills. The farmer will have household expenses and school fees for
children, and they will need money to start planting for the next season. If the sale
of the newly harvested grain is to be postponed, the farmer will have a demand for
credit. Banks would want to supply that credit and to offer loans to such farmers.
Banks, however, need to get collateral from the farmer without which the farmer
may decide to default. There is the produce of the farmer which could be used
as collateral. However, there is no way of easily and cheaply verifying the quality
and hence value of the corn and also to verify that the corn will still be with the
farmer when it is time to repay the loan. The farmer could always decide not to
repay the loan, that is, to default. This is a classic credit market failure as both sides
would want to trade if there could be credible certification and collateralization of
the farmer’s produce. In a well-functioning market, the farmer would want to take a
loan from the bank, and the bank would want to offer the loan. However, the market
will fail to be formed.
A consequence of lack of storage and credit facilities is that when there is a
harvest, there may be a glut of food crops upon harvest which may not be sold and
go to waste. This is a part of the postharvest losses which plague these markets. FAO
(2019, page 32) estimates that in sub-Saharan Africa, 14% of food is lost between
postharvest and retail distribution along the supply chain.
2 The Ideation
One may ask how we, the researchers, noticed these issues faced by farmers and
came up with the idea of using technology to fix these problems. The answer of
course is straightforward. The farmers in the communities told us their problems and
9 Digital Trading and Market Platforms: Ghana Case Study
227
explained their concerns to us. Many years ago, one of the authors of this chapter
and his PhD students visited farmers in Ghana. Many of the farmers complained
about how they were being cheated by the traders who gave them low prices for
their goods. They spoke about not knowing what the prices in the big cities for
their goods were. They mentioned that they engage in one-on-one bargaining with
a trader who comes to their farm gate after they have completed harvesting or just
before. The farmers said that they are in a weak negotiating position at that time as
they have a perishable good, in addition to being the weaker informational position.
Similar evidence was found by Eggleston et al. (2002), Aker and Fafchamps (2015),
and Nakasone (2013).
All of that got our research team thinking about what is the best way of solving
these development challenges faced by these poor and rural smallholder farmers.
The team then started conversations with an African agricultural food services
company with a strong technology focus, Esoko. This chapter discusses a lot of
the initial work with Esoko on mobile phone-based price alerts. The chapter also
discusses our work on commodity exchanges which was inspired by the initial work
on price alerts. This chapter will not delve into the technological details per se.
Instead, we will describe the impacts of the technology on the smallholder farmers
and the lessons learned from various interventions, by the authors and many others.
3 Implementation Context
The research reported in this chapter took place primarily in Ghana although
a lot of the early work and insights came from Ethiopia (see Minten et al.,
2014). As mentioned earlier, the knowledge of the development challenges and
the appreciation of their importance came from the farmers and traders in these
countries when we undertook research visits to those nations over a number of years.
The first formal research conducted was with the company Esoko which provided
price alerts to farmers in Ghana (see Hildebrandt et al., 2020). Our team was
very bullish on the importance of the mobile phone in overcoming development
challenges in our research communities. The mobile phone is ubiquitous in rural
areas. Even in very small villages, we find farmers with mobile phones. When their
own villages have no electricity or cellular network signals, the farmers go to the
next small town near theirs on a regular basis to charge their phone or even make the
calls. The national governments are committed to increasing mobile phone signal
reception, so over time, access to mobile phones was expected to increase. By the
end of 2018, sub-Saharan Africa had a mobile subscriber penetration rate of 44%,
and 23% of the population used mobile Internet on a regular basis (GSMA Mobile,
2018). That explained our initial focus on mobile phones as a vehicle for addressing
some of the development challenges.
In both Ghana and Ethiopia, the government and policy leaders were all keenly
interested in improving the lot of the farmers in their countries. It was therefore easy
to get the attention and the support at the highest levels for our research activities.
228
K. Neza et al.
Our early research on mobile phones taught us the potential of technology could be
high in our communities. As we moved to working on commodity exchanges, the
personnel at the exchanges were enormously helpful to us. We had the support of the
leader of the Ethiopian Commodity Exchange (ECX), first with the inaugural Chief
Executive Officer (CEO) Eleni Gabre-Madhin through subsequent CEOs Anteneh
Assefa and Ermias Eshetu and their teams. In Ghana, we had the support of the
Ghana government (Ministry of Finance and Ministry of Trade and Industry), as
well as the initial project staff and current leadership of the Ghana Commodity
Exchange’s (GCX), CEO Dr. Kadri Alfah, Chief Operating Officer Robert Owoo,
and their teams.
4 Innovation
We divide our discussion on innovations into three sections: Sect. 4.1 Price Alerts
Services, Sect. 4.2 Mobile Phone-Based Trading Platforms, and Sect. 4.3 Commodity Exchanges. Here, we will discuss the innovations themselves. In subsequent
sections, we will discuss the implementation and evaluation of these interventions.
An even later section will describe the results and lessons learned.
4.1 Price Alerts Services
One of the earliest innovations we were engaged in and an early area of interest
in the academic literature is in mobile phone-based price alerts (see Hildebrandt et
al., 2020; and the literature mentioned there). We mentioned in the development
challenge in Sect. 1.2 that in many situations, smallholder farmers are at a price
disadvantage when it comes to knowledge of prices of their commodities. Traders
and buyers have more immediate knowledge of prices of foodstuff and crops across
a nation, while the farmer, holed up on his farm, does not. Many researchers were
therefore of the belief that mobile phone-based price alerts could either solve or
lessen the impact of this problem.
Esoko is an agricultural services company in Africa. They provide farmers the
prices of their commodities in different district, regional, and national markets (see
Fig. 9.2). The company was started in 2009 based on the belief that there are gaps
in the information flow for farmers, in particular on farmers getting access to price
information. It was a startup with individuals recognizing this market failure, who
formed a company to provide the information services. The Esoko business model,
at least at the time of this research, was as follows. Market surveyors in the various
district, regional, and national markets would collect on a weekly basis (or more
frequently as needed) the market prices of all of the major food crops. Farmers
who subscribe to the Esoko service would receive the prices of the crops they were
interested in from the markets they are interested in. For example, a farmer would
9 Digital Trading and Market Platforms: Ghana Case Study
229
Fig. 9.2 Left: Esoko text message weather alert. Right: Esoko text message price alert (Reproduced from Esoko, 2019)
tell Esoko that they are interested in the price of maize in both the regional market
and in the national capital. The farmer would want that information so as to be in
a better bargaining position when the traders show up on their farm gates or at the
local markets to purchase their crops.
After the farmer has subscribed to the service, Esoko would then text the farmer
the prices of the requested crops in the requested market on a monthly basis. They
are able to see these prices and presumably use this information when bargaining
with traders for their crops.
In the section on evaluation, we indicate how we evaluated this Esoko intervention. In Sect. 6, we review the results of the intervention and also indicate the results
obtained from other researchers on other related price alert interventions for similar
populations.
4.2 Mobile Phone-Based Trading Platforms
The next step in complexity but still using the mobile phone as the base is the use of
the mobile phone in trading. We mentioned in our development challenge in Sect.
1.1 that matching supply and demand is a big problem in smallholder agricultural
communities. Farmers often cannot find traders, and traders often cannot find
farmers with the right good of the right quality and quantity. Another innovation
in this space is the use of the mobile phone as a trading platform.
230
K. Neza et al.
These platforms connect buyers and sellers in rather geographically fragmented
markets and usually focus on a major cash crop of the selected region. In
contrast to the traditional markets, these structured platforms allow farmers, traders,
processors, and financial institutions to enter legally formalized trading and financial
arrangements (Ochieng et al., 2020). They operate by digitizing and automating
these price discovery mechanisms, which include detecting and declaring winners
in auctions, disseminating price information, and garnering farmers to access
alternative electronic markets. Consequently, these interventions and platforms
have the ability to inform farmers about prevailing market prices, increase market
competition, and enable transparency of the price search process. By rapidly
connecting disparate market agents, they reduce information costs at various stages
of the agricultural chain. This allows farmers to take advantage of previously
untapped trade opportunities and to learn about previously unknown innovative
practices. In consequence, the cost reductions yield welfare and income gains
(Nakasone et al., 2014).
An example of this is Kudu, an electronic market platform for agricultural trade
in Uganda (Newman et al., 2018). In this model, the farmers place their requests to
either buy or sell goods in a centralized national database; then, the app processes
to identify profitable traders, and the two sides are informed about it. Rather than
allowing the buyers and sellers to browse through a list of potential trading partners,
Kudu’s matching algorithm connects bids based on maximizing the gains from trade
that the platform can offer.
There are several features that make Kudu attractive to farmers. First, users not
only place the desired price and quantity of their bid but also are able to narrow the
options of their desired trade: this includes features of the grains such as shelled
versus unshelled grains and wet versus cleaned maize. Second, the platform allows
users to trade with anyone across the country, and the app’s algorithm will take
travel costs into account when proposing matches. The Kudu platform provides
users with in-village support service and a call center, which enhance its reliability.
Furthermore, Kudu does not charge for transactions, and while the creators have
considered monetization options such as charging commissions for each transaction,
they recognize that such changes are nontrivial. Finally, users can trade through
the Kudu platform in four different ways: through short message service (SMS),
using an Unstructured Supplementary Service Data (USSD) application, through
a website, or speaking through the call center. All of these options provide its
customers with the same features: buy, sell, and quote/request price information
(see Fig. 9.3) (see Ssekibuule et al., 2013; Reda et al., 2010; for other mobile-based
trading platforms in the context of development).
There are other mobile apps across sub-Saharan Africa that apply the same
principle: provide a virtual market where farmers and buyers can trade their
agricultural goods. Among those are M-Farm; DrumNet; and, more recently,
Twiga Foods in Kenya (Baumüller, 2013; Mire, 2019) and Agro-Hub in Cameroon
(Balashova & Sharipova, 2018). A variety of studies have confirmed the benefits, as
well as the limitations of mobile trading apps. A survey of M-Farm users confirmed
that receiving price information can help them plan for production; however, the
9 Digital Trading and Market Platforms: Ghana Case Study
231
Fig. 9.3 Top left: Kudu’s USSD interface running on a phone. Right: Sample USSD interaction
for selling groundnuts. Bottom left: A user placing an ask on Kudu’s web interface (Reproduced
from Newman et al. 2018)
survey also revealed that there was a limited impact on expanding market linkages.
This was driven by the fact that M-Farm could only provide single bilateral contracts
between a farmer and a buyer, rather than establishing a full network that allowed
for multiple connections (see Baumüller, 2013), where Agro-Hub is an agency that
connects smallholder farmers with sustainable markets. More than 700 farmers
reported an increase in productivity and income (Balashova & Sharipova, 2018).
Twiga Foods is a mobile-based food distribution platform for small- and medium-
232
K. Neza et al.
size fruit and vegetable farmers. After both farmers and vendors sign up through
the online and phone platform, the platform acts as a bridge between sellers (i.e.,
farmers) and buyers. It guarantees farmers a consistent market with higher prices,
and similarly, through its food safety standards, it ensures a reliable and high-quality
supply to vendors. It currently operates on a national scale and is the largest seller
of bananas in Kenya. As of 2020, the company sources 245 tons of bananas each
week from over 3000 farmers, which are distributed to over 14,000 vendors.
4.3 Commodity Exchanges
Ramping up the complexity of technological innovation, we move from the price
alerts in Sect. 4.1, through the mobile phone-based platforms in Sect. 4.2, to arrive at
the commodity exchange platforms. The commodity exchanges are usually national
government–run institutions. They serve as national centralized markets for crops.
Commodity exchanges have existed for many years in many countries. The
commodity exchanges in Africa and many areas with smallholder farmers are very
recent, and many countries still do not have them. The improved technology in
existence today has made modern commodity exchanges much easier to establish
and is now within the reach of many poor nations. While big telephone and
mainframe computer infrastructure would have been necessary in the past, today,
relatively lower footprint technologies and cloud-based systems are able to run the
exchanges in poorer nations at a fraction of the former cost.
The commodity exchanges work as follows. Farmers upon harvesting their crops
send them to a warehouse close to their farms. The warehouse then inspects the
grains and assigns a grade to them. The farmer then receives a receipt for the crops
(called a Grain Receipt Note and/or, in the more advanced version to be described
later, a warehouse receipt). The warehouses are usually owned or operated by the
commodity exchange. Each farmer chooses a broker or is assigned one. The farmer
gives instructions to the broker on when to sell their crops and at what price.
The buyers of grains also use brokers to purchase grains. The buyers and sellers
of grains make offers on the commodity market. In some exchanges, this is at a set
time during the day, while in others, it can occur at any time. Brokers look at the
offers, and at some point, a buy-side and a sell-side broker will decide to trade. The
price at which the broker trades will be entered onto the GCX platform for all to
see. The buyer then picks up the grain at the warehouse that the buyer’s broker has
just purchased. On the other side of the market, the seller will receive cash through
the seller’s broker who has just sold the grains to the buyer’s broker.
The commodity exchange is really nothing other than technology plus rules of
trading, plus government-backed standards and warehouses. Software engineers
write code that accepts bids from different market participants on their platform.
When two sides of the market agree to trade, then the trading engine software
matches them. Prior to the match, farmers would have deposited their produce at
the warehouse, and this would be recorded by the software. Farmers would have
9 Digital Trading and Market Platforms: Ghana Case Study
233
sell-side brokers who seek to sell their commodities on their behalf. On the other
side of the market are buyers working through buy-side brokers. All brokers are
registered on the software and are screened and licensed.
Just as with the mobile phone-based trading platforms, the commodity exchange
allows buyers and sellers to find each other. It therefore addresses the development
challenge set out earlier, by enhancing the matching of buyers and sellers. In
many of the commodity exchanges, rural farmers are able to access the commodity
exchange through their mobile phones or through calls on the mobile phone to their
brokers.
Since prices traded on the commodity exchange are made public, there is price
information, so in principle, the problem described in Sect. 1.2 is solved, especially
when the farmer has access to the prices either through price alerts issued by
the exchange or through a direct phone call the farmers make to their brokers.
Furthermore, the commodity exchange is a way of matching buyers and sellers.
Any farmer, for example, looking for buyers simply needs to be in touch with
his or her broker. The broker in turn has access to all the buyers on the exchange
platform. Similarly, a buyer looking for farmers with grains simply needs to contact
their broker who has access to all the farmers on the platform through the brokers
representing the farmers.
In addressing the development challenges, the commodity exchange is like the
price alerts and the mobile phone platforms. Where the commodity exchange has a
unique advantage is in addressing the development challenges explained in Sects.
1.3 and 1.4.
The commodity exchange grades the commodity when the farmer brings the
commodity into the exchange warehouse. The grading process ensures the grain is
free of diseases and pests. It ensures the moisture level of the grain meets a minimum
threshold, and as is, for example, maize, the drier grains receive a higher grade (the
maximum allowed moisture content is 14%, and 12% moisture content can help get
a grade I as opposed to a grade II or III or IV designation). The commodity exchange
sales, or contracts as they are called, are all based on the grade. For example, there
will be a price and trading day for grade I white maize contracts and a different price
and trading day for the grade II white maize contract. In this manner, a market for
different grades of the crop is created.
There will be a price gradient for quality, and farmers will know that when they
invest their effort in producing better higher-grade maize, they will be rewarded for
their effort. Traders will similarly know what the quality of their grain is and will
know that they can pay more for better-quality grain. They will appreciate having
the price gradient for different grades, so they can choose what grade to purchase
rather than paying one price and not knowing the grade and therefore having the
price according to a perceived average of many possible grades.
Finally, the commodity market is unique in its ability to address the market failure
issues in Sect. 1.4 – storage and in particular credit market failures. The storage is
straightforward – being a larger and national institution, the exchange is able to
establish warehouses at strategic locations across the country. More importantly, the
warehouse receipts the farmers receive upon depositing their grain at the warehouse
234
K. Neza et al.
can be used as collateral at a bank to obtain a loan. This will address the potential
credit crunch that farmers face when they harvest their crops and prices fall with
the glut of food in the market. The farmers are able to store their crops at the
exchange warehouses to await a time when the prices improve. They are able to do
that because they are able to take a loan from banks, collateralized by the warehouse
receipts. Banks are willing to offer the loans because the warehouse receipt states
the quality of the goods, as certified by the exchange, and there is a ready market for
that collateral at the exchange. Historical prices give some indication of the value
of the collateral. Höllinger et al. (2009) provide a description of the mechanics
and structures required for a warehouse receipt system (WRS) with an emphasis
on emerging and transition economies of Eastern Europe. Other studies on WRS
include Miranda et al. (2019), Adjognon et al. (2019), and Katunze et al. (2017).
5 Evaluation
Most of the technological innovations mentioned in this chapter are evaluated using
randomized control trial methodologies (Duflo et al., 2007). The basic idea can
be illustrated in the intervention described by Hildebrandt et al. (2020) which
we use here as our principal example. A number of communities were chosen,
approximately 100. Through randomization, one-half of them, in this case 50, would
be treatment communities with the other half (50) being the control communities.
Farmers will be chosen as subjects in each of the 100 communities. The farmers
in the randomly chosen treatment communities will be given the technology to be
evaluated. In the work of Hildebrandt et al. (2020), it is the price alerts. In the
current research of the authors of this chapter with other co-authors, it will be access
to the services of a commodity exchange. Outcomes of interest of the subjects in
all communities will be measured. These would be things like prices obtained for
farmers’ goods, production levels, and sales. Statistical techniques will then be used
to determine whether there are observable differences in the treatment communities
relative to the control communities. If there is, then we would have evaluated the
technology and will record an impact.
Of course, what is described above is the very simple skeletal structure for the
evaluation. In many of the experiments, there are two principal problems that need
to be addressed. The first is spillover effects. For example, if there is a mobile
phone price alert that is being evaluated, there need to be safeguards against one
subject in a treatment community showing the price information to a subject in a
control community. This problem of spillovers is typically addressed by clustering
communities so that, for example, those which are geographically close to each
other, other those with many farmers who are friends across communities, are
pooled together and considered as one larger community. Again, one can see work
of Hildebrandt et al. (2020) for ways of creating a connectivity measure between
communities which was used to cluster those communities that were too close to
each other by this metric.
9 Digital Trading and Market Platforms: Ghana Case Study
235
The second big problem that comes up is one of balance. Since the communities
are chosen randomly, it is possible that most of the treatment communities by
chance happen to be in, say, the more prosperous part of the wider study area. In
this example, the effects of the technology may be hard to disentangle from the
effects of being in a more prosperous region. This problem of balance is solved
using stratification. The wider area is divided into strata where issues like wealth
levels and other characteristics are held fixed, and within those fixed areas, the
randomization takes place. As an example, in the Hildebrandt et al. (2020) paper,
there was concern that geography could play a role (you could be in one of four
quadrants of our area, each with different climate and suitability to agriculture),
and you could also be in a yam- or non-yam-producing area (yam being the major
cash crop in the area). So instead of simply dividing the 100 communities into
50 treatment and 50 control, eight strata were created (each being in one of four
geographic quadrants and being in majority yam or not majority yam community).
Each of the strata would have approximately 100 communities divided by eight
strata so 100/ε or 1/2 or so communities. The randomization into approximately
50% treatment and 50% control would then take place within each strata. Each
strata would then have, by construction, a similar number of treatment and control
communities. We show the treatment and control villages in our Esoko price alert
intervention in Fig. 9.4. The cluster and strata formation is shown in Fig. 9.5.
Fig. 9.4 Treatment and control villages in the Esoko price alert intervention
236
K. Neza et al.
Step 1:
Create community
clusters
100 villages 90 clusters
Total farmers = 991
Step 2:
Stratification
Step 3: Randomization
45 Treated Clusters
507 Treated Farmers
KE, yam
Clusters: 7
Farmers: 70
NS, yam
Clusters: 23
Farmers: 235
NS, yam
Clusters: 15
Farmers: 190
NS, yam
Clusters: 6
Farmers: 80
KE, not yam
Clusters: 17
Farmers: 170
NS, not yam
Clusters: 2
Farmers: 15
NN, not yam
Clusters: 6
Farmers: 70
NS, not yam
Clusters: 14
Farmers: 161
T
T
T
T
C
C
C
C
Fig. 9.5 Formation of clusters and strata
The basic econometric model is easily explained as below:
piit = λ + κTi + ψXii + ωk + ωt + eiit
(9.1)
In this equation, here, piit represents the variable of interest (here, the producer price
outcome for farmer λ living in community λ selling in month t). The variable Ti is
the treatment size indicator (one if treatment and zero if control), Xii denotes a
set of additional covariates, and ωi and ωt denote randomization strata fixed effects
(whether or not it is in the kth strata) and time period fixed effects, respectively. (The
λ and eiit are of course the constant and the error terms.)
Equation 9.1 measures the price alert intervention. One can imagine similar
evaluation techniques being used for both the mobile phone trading platforms and
the commodity exchange platforms (innovations in Sect. 4.2 and 4.3). For example,
in rural areas, some communities could be exposed to the commodity exchange
services where others would not be. Assuming lack of communication between
the communities (the spillover problem) and either general lack of knowledge of
the existence of the commodity exchange or difficulty in accessing it, it would be
possible to target the services of the commodity exchange to some communities and
not others. The randomized control techniques just described for the price alerts
could then be applied to the commodity exchange intervention.1
1 The authors, with co-researchers Chris Udry, Lauren Bergquist-Falcao, and Lorenzo Casaburi,
are engaged in one such evaluation.
9 Digital Trading and Market Platforms: Ghana Case Study
237
6 Results and Lessons
6.1 Price Alerts Services
Hildebrandt et al. (2020) show that Esoko price alerts had a positive effect on yam
prices received by farmers in their study. The initial results of the paper show that
there was an increase of 8.73 Ghana cedis (GHC|) per 100 tubers of yam relative
to those farmers who had received no Esoko price alerts. This was equivalent to
a 5% increase in prices. This initial peak declines steadily over time, making the
effect small in magnitude and statistically insignificant; there was a price decline
of 0.01 GHC| per 100 tubers of yam, leading to a 0.8% decrease. This decline is
due to a mechanism the paper called “bargaining spillover.” In such a landscape,
middlemen cannot distinguish between those farmers with price knowledge and
those without. So, the whole pool of farmers ends up adjusting their bargaining
strategies. Similarly, the traders have to decide if each farmer is an informed or
uninformed one. Since traders know that informed farmers will reject low prices,
they have to estimate how high they can push the offer without getting a rejection.
Therefore, the trader’s strategy depends both on the farmer’s actual price knowledge
but also on how well the trader assesses this. As such, providing information has
positive effects even on farmers that did not access price information directly. Prior
to the price alert intervention, maize prices were homogenous because bargaining
was less prevalent and farmers had a reference “market price.” In other words, this
study finds positive price effects – obvious effects in the short run and more subtle
effects (because all farmers benefit) in the long run. Such results are supported by
a similar study by Courtois and Subervie (2015) who found that Ghanaian farmers
received about 10% higher prices for maize and groundnuts when they had access to
the market information system (MIS). Furthermore, this is consistent with previous
evidence which shows that the introduction of information and communication
technologies (ICT) reduced price dispersion as agents were able to bargain for better
prices, Jensen (2007) being one of the first and classic papers in this recent line of
literature and also of Aker (2008). This is further supported by a more recent study
on maize farmers in Mozambique, for whom the introduction of mobile phones led
them to experience a statistically significant decrease in maize price differentials of
10–13% (Zant, 2019).
The Hildebrandt et al. (2020) paper shows that there could be a big difference
between short-run and long-run effects. In the short run, some market participants
adjust their behavior (farmers in that paper), while others (traders) adjust their
behavior only in the long run. In the long run, all market participants get to adjust
their behavior upon introduction of an innovation, which could change the outcomes
relative to the short-run effects.
The long-term implications of better access to market price data are not fully
clear. Mitra et al. (2018) use an asymmetric bargaining model to study a market
price information intervention among potato farmers in West Bengal, India. The
authors concluded that access to better price information does not necessarily
238
K. Neza et al.
benefit farmers in their negotiations with middlemen because they don’t have
access to alternative markets. In Karnataka, India, Levi et al. (2020) evaluated
the implementation of the Unified Market Platform (UMP) on market prices and
farmers’ profitability. They found that the UMP had generated a greater benefit
for farmers with high-quality produce, increasing, on average, the prices of maize,
groundnuts, and paddy by 5.1%, 3.6%, and 3.5%, respectively. The provision
of price information alone might not be enough to facilitate trade among small
farmers. While such interventions reduce information asymmetries between traders
and farmers, if the market agents do not have outside options for their sales,
information will do little to improve their marketing outcomes. On the other hand,
if farmers have access to larger markets and have increased bargaining power, more
information may represent potential gains, as farmers could potentially access the
traders who are ready to pay the higher prices.
While most studies that evaluate the impact of ICT diffusion in the agricultural
sector find significant results, a few of them find no evidence of an effect. Futch
and McIntosh (2009) investigated the introduction of village phones in Rwanda
and found that while the technology did increase the proportion of farmers
arranging their own transport to markets, there was no significant increase in the
commodity prices that those farmers received. Similarly, Fafchamps and Minten
(2012) evaluated the impact of Reuters Market Light (RML), a service that provided
farmers with agricultural information through mobile phones in Maharashtra, India.
Ultimately, the authors found no differences in average prices for farmers with RML
subscriptions. Aker and Fafchamps (2015) analyze the expansion of mobile phones
in Niger and find no evidence of increases in farm gate prices as well.
When farmers’ knowledge of prices increases, the research has found an effect
on both the farmers’ production and postharvest decisions. Hildebrandt et al. (2020)
show that there is a significant impact on produce prices and production decisions
in Ghana. The authors notice that by providing price information of a certain crop,
farmers are incentivized to produce more of a particular crop (in this case, yam).
They find farmers report growing a new crop or growing more of an existing crop.
In addition, price alerts also caused fewer farmers to sell in the local markets and
induced them to sell at the farm gate.
In similar studies, Baulch et al. (2018) argue that some price discovery mechanisms might target large traders who are able to sell in large volumes. Thus,
only a few small farmers can access these market options through their farming
associations. In Central Malawi, Ochieng et al. (2020) find that greater efforts are
needed to sensitize the farmers and traders on the quality and quantity requirements
of such structured markets, which could result in an increase in the farmer’s level of
commercialization in such markets. Mitchell (2017) in a study conducted in Gujarat,
India, shows that there is an implicit increase in producer prices, leading to an
increase in the amount of crops produced.
Additionally, market information systems allow farmers to decrease their
postharvest losses. Jensen (2007) finds that the introduction of phones in fisheries
in Kerala reduces waste by 4.8%. Fafchamps and Minten (2012) argue that for
Indian farmers in the Maharashtra state, the price improvement generated through
9 Digital Trading and Market Platforms: Ghana Case Study
239
the price alerts leads them to better agricultural practices and postharvest handling.
Finally, Dixie and Jayaraman (2011) show that to avoid postharvest losses, farmers
in Zambia used SMS text messages to coordinate among local truckers and enhance
product transportation.
6.2 Commodity Exchanges
While price alerts and mobile phone-based trading provide farmers with a market,
these solutions present some constraints. Even though farmers are informed about
prices – which earns them bargaining power, this does not necessarily translate into
better bids: middlemen still have direct access to the markets that the farmers,
many times, do not (see Mitra et al., 2018; Mitchell, 2017). Furthermore, most
mobile applications for trading, if not all, do not include an algorithm that can
account for the difference in crop quality that is offered and demanded by farmers.
Including this within the mobile app will present two challenges: comprehensive
enforcement and inconsistency in the farmers’ ability to grade crops correctly and
effectively (see Newman et al., 2018; Levi et al., 2020). Lastly, many of the studies
on mobile applications notice that few farmers have smartphones and that many
are illiterate, forcing these projects to rely on human interaction (see Aker et al.,
2016). As we will see below, a commodity exchange addresses and overcomes
these problems by altering the agricultural landscape in multiple fronts: bargaining
dynamics, production decisions, and household dynamics.
Commodity exchanges are modern marketing systems based on warehouse
receipts, allowing small farmers to store their surplus safely while they wait for
prices to increase. Furthermore, these stored commodities serve as a collateral to
secure loans to finance household consumption and investment in the meantime
(see Miranda et al., 2019). The effects of using warehouses go beyond the immediate
storage facilities and financing opportunities for farmers. For instance, ECX reduced
price dispersion between export prices and retail prices and facilitated the tendency
of prices of the same commodity to move together (see Andersson et al., 2017).
It also led to an increase in the quantity of coffee exported; Minten et al. (2014)
showed that exported quantities from Ethiopia were 50% higher in 2012 than
10 years earlier.
Exchanges have the potential to change farmers’ production decisions, as grading
systems reveal high- and low-quality grains. Prior to a commodity exchange, almost
all crops from the production areas are physically transported to a regional or
national central market, usually outdoors, for auction. Without formal regulation,
a significant volume of the crops can be adulterated by mixing high-quality grains
with low-quality ones. This, in addition to information friction and scattered
markets, leads to under-provision of quality crops (Bai, 2018). A commodity
exchange allows differentiating between a crop’s quality, usually through sorting
and inspecting grains, and consequently, the transactions cover every class of the
grading given by the commodity exchange warehouses, otherwise a limitation that
240
K. Neza et al.
most mobile trading applications face (Demise et al., 2017). This, in consequence,
has the potential to encourage farmers to produce higher-quality products.
7 Conclusion
In this chapter, we have described a development problem facing smallholder
farmers in places like sub-Saharan Africa and other similar regions. The problem
can be summarized as a lack of effective markets for their goods. We described
innovations which have the potential to address parts of this problem. We discussed
three innovations, which, in order of increasing complexity, are the mobile phonebased price alerts, electronic trading platforms, and national commodity markets.
The three are all similar in the sense that at their core, they are technologies which
allow the transmission of information to farmers and those who trade with farmers.
We described briefly these innovations and sketched the basic randomized control
trial methodology for their evaluation. We indicated the results and lessons learned
from these evaluations – both from the authors’ own work and from work in the
academic literature.
Discussion Questions
Are experiments needed to rigorously test some of the conjectures of this chapter?
There are a number of discussion questions this chapter suggests. The first
set of questions have to do with formally proving a number of the conjectures
of this chapter. Although there is some current ongoing research, the impacts
and benefits attributed to commodity exchanges in the earlier section need to be
verified with rigorous field experiments. Designing a nationwide experiment for the
commodity exchange intervention has a number of difficulties, which of course are
not surmountable.
Could the innovation be harmful? Is price information potentially harmful to
farmers?
We need to be mindful of whether the new technologies introduced could
inadvertently harm those the innovation is meant to help. One can imagine a
situation where the introduction of price information to some farmers could actually
hurt those farmers. It is possible that when traders realize that some farmers have
superior information, they will shun those farmers and go to other farmers. The
farmers with the superior information may then find themselves in the situation
where they no longer have any (or as many) traders coming to their farms to trade.
In the extreme case where they have no traders coming to them, they may therefore
be much worse off than if they did not have the price alerts. So, general equilibrium
effects could cause farmers to be hurt. In the Hildebrandt et al. (2020) paper, the
authors find that the farmers are not hurt. This potential for harm is not realized
9 Digital Trading and Market Platforms: Ghana Case Study
241
in that case. There are, however, at least conceivable situations where technology
could be harmful to the intended recipients of that technology.
Can technology cause increased inequality among farmers?
Next, even as we introduce innovations to help farmers, those innovations may
increase inequality among the farmers. If the price alerts or the commodity exchange
innovations are more likely to help the farmers who are already better off, then
inequality may increase among the farmers. In the work of Hildebrandt et al. (2020),
for example, it is found that the price alerts benefit primarily those who produce the
cash crop yam. If those farmers are also those who are richer to begin with, as
it is reasonable to suppose, then the innovation would help the better-off farmers
more than the less well-off farmers. It is an open question how much of a concern
that should be to us. On the one hand, all of the farmers are poor, so helping some
of them via technology, even if only the relatively better-off ones, should be a good
thing. On the other hand, our intent may be to help the poorest of the poor, so we may
be worried if those farmers are not reached by our technological innovation. This
question of course requires more data and more study. We also mentioned earlier
the commodity market innovation. One could similarly imagine that the better-off
farmers are the ones more likely to engage with the commodity exchange. In that
case again, the introduction of the innovation could lead to increased inequality.
With all technological innovations, this leads to a pair of discussion questions: will
the innovation result in more inequality, and is that inequality harmful (e.g., it does
not help those we really care about, like the poorest of the poor), or is it benign (e.g.,
enough of the farmers benefit that the inequality is unimportant relative to the wider
gains the technology enables)?
Building Capacity Through Research
With both the price alert intervention with Esoko and the commodity
exchange intervention with GCX, the researchers worked extremely closely
with host institutions. After the research, both institutions emerge stronger
with greater capacity. With Esoko, insights from the field were transmitted
immediately. In one example, researchers noticed that farmers on the Esoko
app preferred using local traditional units (bowls or what is called locally
“Olonka”) rather than the standardized units, which was duly and immediately
communicated to Esoko for action. With GCX, our earlier work with farmers
encouraged the government to make the final steps in the establishment of
the exchange. The earlier work gave the researchers credibility in front of the
government when pushing for the exchange.
242
K. Neza et al.
Mitigating Climate Change
One can think of two reasons why the innovations in technology discussed
here would be essential as climate change begins to take its toll and agricultural systems begin to change:
I. As climate changes, supply will inevitably change in unpredictable ways.
The need for speedy price discovery and extensive knowledge of prices
would therefore be needed for farmers to react to the changes. Markets
would become more and not less important in these more volatile climate
change-induced environments.
II. As evidenced by the responses to the Covid-19 lockdowns, technology
may be important for staying connected and working when there are
difficult environmental conditions in existence. There is a slight advantage
in not having to travel so much to find market partners when there are
environmental challenges. The technological innovations mentioned here
enable markets to form with much less physical movement of people.
Role of Gender in Agriculture Markets
While women account for almost 50% of the agricultural labor force in subSaharan Africa, they are often constrained in their access to markets and
price information, especially where engagement in markets involves travel
and searching for customers in faraway villages, often with the risk of crime.
Hence, if women themselves were able to access market knowledge through
mobile phones and commodity exchanges, they would possibly benefit even
more than men would. Hildebrandt et al. (2020), Aker and Ksoll (2016), and
Gomez and Vossenberg (2018) focus on gender and show positive impacts
on women, for the reasons just mentioned. There are also factors related to
within-household bargaining and dynamics which yield benefits to women
from technology. One can imagine more peace in the household as the price
alerts provide proof of the sales one household member is able to obtain at
the market from the household farm. Indeed, some farmers in the Hildebrandt
et al. (2020) study mentioned that the Esoko price alerts were useful because
with it, they said, “my wife will not cheat me.” This was probably a situation
where the man worked on the farm, the women did the selling, and there was
little trust between the two. As a second example, after the integration of the
Agricultural Commodity Exchange for Africa (ACE) in Malawi, 75% of the
women interviewed by Gomez and Vossenberg (2018) started keeping books
and carrying out some financial planning or budgeting. The warehouse receipt
system allowed women to earn more bargaining power, which then benefited
their farming opportunities. One of the quotes from that paper is as follows:
“ACE helps me to make informed business decisions which are atypical for a
woman.”
9 Digital Trading and Market Platforms: Ghana Case Study
243
References
Adjognon, G. S., Gassama, A., Guthoff, J. C., et al. (2019). Implementing effective warehouse
receipt financing systems: Lessons from a pilot WRS project in the Senegal River valley. The
World Bank, 139445, 1–28.
Aker, J.C. (2008). Does digital divide or provide? The impact of cell phones on grain markets in
Niger. Center for Global Development Working Paper 154.
Aker, J. C., & Fafchamps, M. (2015). Mobile phone coverage and producer markets: Evidence
from West Africa. The World Bank Economic Review, 29(2), 262–292.
Aker, J. C., & Ksoll, C. (2016). Can mobile phones improve agricultural outcomes? Evidence from
a randomized experiment in Niger. Food Policy, 60, 44–51.
Aker, J. C., Ghosh, I., & Burrell, J. (2016). The promise (and pitfalls) of ICT for agriculture
initiatives. Agricultural Economics, 47(S1), 35–48.
Allen, T. (2014). Information frictions in trade. Econometrica, 82(6), 2041–2083
Andersson, C., Bezabih, M., & Mannberg, A. (2017). The Ethiopian commodity exchange and
spatial price dispersion. Food Policy, 66, 1–11.
Atkin, D., Khandelwal, A. K., & Osman, A. (2017). Exporting and firm performance: Evidence
from a randomized experiment. The Quarterly Journal of Economics, 132(2), 551–615.
Bagwell, K. (2007). The economic analysis of advertising. Handbook of Industrial Organization,
3, 1701–1844.
Bai, J. (2018). Melons as lemons: Asymmetric information, consumer learning and quality
provision. Working paper.
Balashova, E., & Sharipova, S. (2018). Impact of ecosystem services on a sustainable business
strategy in urban conditions. In MATEC web of conferences 170:01012/.
Banerjee, A. V. (2013). Microcredit under the microscope: What have we learned in the past two
decades, and what do we need to know? Annual Review of Economics, 5(1), 487–519.
Baulch, B., Gross, A., Nkhoma, J.C., et al. (2018). Commodity exchanges and warehouse receipts
in Malawi: Current status and their implications for the development of structured markets.
International Food Policy Research Institute Working Paper 25.
Baumüller, H. (2013). Enhancing smallholder market participation through mobile phone-enabled
services: The case of M-Farm in Kenya. INFORMATIK 2013–Informatik angepasst an Mensch,
Organisation und Umwelt. Bonn.
Bernard, T., de Janvry, A., Mbaye, S., et al. (2017). Expected product market reforms and technology adoption by Senegalese onion producers. American Journal of Agricultural Economics,
99(4), 1096–1115.
Courtois, P., & Subervie, J. (2015). Farmer bargaining power and market information services.
American Journal of Agricultural Economics, 97(3), 953–977.
Demise, T., Natanelov, V., Verbeke, W., et al. (2017). Empirical investigation into spatial
integration without direct trade: Comparative analysis before and after the establishment of
the Ethiopian commodity exchange. The Journal of Development Studies, 53(4), 565–583.
Dillon, B., & Dambro, C. (2017). How competitive are crop markets in sub-Saharan Africa?
American Journal of Agricultural Economics, 99(5), 1344–1361.
Dixie, G., & Jayaraman, N. (2011). Strengthening agricultural marketing with ICT. The World
Bank Module, 9, 205–237.
Drott, D.Y., & Svensson, J. (2010). Tuning in the market signal: The impact of market price
information on agricultural outcomes. Working Paper.
Duflo, E., Glennerster, R., & Kremer, M. (2007). Using randomization in development economics
research: A toolkit. Handbook of Development Economics, 4, 3895–3962.
Eggleston, K., Jensen, R., Zeckhauser, R. (2002). Information and communication technologies,
markets, and economic development. The global information technology report 2001–2002:
Readiness for the networked world, pp. 62–74.
Esoko (2019). Deliver Information At The Right Time. https://esoko.com/messaging/
244
K. Neza et al.
Fafchamps, M., & Minten, B. (2012). Impact of SMS-based agricultural information on Indian
farmers. The World Bank Economic Review, 26(3), 383–414.
FAO. (2019). The State of Food and Agriculture: Moving forward on food loss and waste reduction.
http://www.fao.org/3/ca6030en/CA6030EN.pdf. Accessed 15 May 2020.
Futch, M. D., & McIntosh, C. T. (2009). Tracking the introduction of the village phone product in
Rwanda. Information Technologies & International Development, 5(3), 54–81.
Gomez, G., & Vossenberg, S. (2018). Identifying ripple effects from new market institutions to
household rules-Malawi’s agricultural commodity exchange. NJAS-Wageningen Journal of Life
Sciences, 84, 41–50.
GSMA Mobile. (2018). The Mobile Economy-Sub-Saharan Africa 2018. https://www.gsma.com/
mobileeconomy/sub-saharan-africa/. Accessed 15 May 2020.
Goyal, A. (2010). Information, direct access to farmers, and rural market performance in central
India. American Economic Journal: Applied Economics, 2(3), 22–45.
Harrison, A., & Rodríguez-Clare, A. (2009). Trade, foreign investment, and industrial policy. In
D. Rodrik & M. Rosenzweig (Eds.), Handbook of development economics (Vol. 5, pp. 4039–
4214). Elsevier.
Hildebrandt, N., Nyarko, Y., Romagnoli, G. et al. (2020). Price information, inter-village networks,
and bargaining spillovers: Experimental evidence from Ghana. https://papers.ssrn.com/sol3/
papers.cfm?abstract_id=3694558
Höllinger, F., Rutten, L., Kiriakov, K. (2009). The use of warehouse receipt finance in agriculture
in ECA countries. Paper presented at the World Grain Forum, St. Petersburg 6–7 June 2009.
Jensen, R. (2007). The digital provide: Information (technology), market performance, and welfare
in the South Indian fisheries sector. The Quarterly Journal of Economics, 122(3), 879–924.
Kaminski, J., & Christiaensen, L. (2014). Post-harvest loss in sub-Saharan Africa—What do
farmers say? The World Bank Policy Research Working Paper 6831.
Katunze, M., Kuteesa, A., Mijumbi, T., & Mahebe, D. (2017). Uganda warehousing receipt system:
Improving market performance and productivity. African Development Review, 29(S2), 135–
146.
Levi, R., Rajan, M., Singhvi, S., et al. (2020). The impact of unifying agricultural wholesale
markets on prices and farmers’ profitability. Proceedings of the National Academy of Sciences,
117(5), 2366–2371.
Minten, B., Tamru, S., Kuma, T., Nyarko, Y. (2014). Structure and performance of Ethiopia s coffee
export sector. Paper presented at the international agricultural trade research Consortium’s
(IATRC’s) 2014 annual meeting: Food, resources and conflict, San Diego, 7–9 December 2014.
Miranda, M. J., Mulangu, F. M., & Kemeze, F. H. (2019). Warehouse receipt financing for
smallholders in developing countries: Challenges and limitations. Agricultural Economics,
50(5), 629–641.
Mire, M.M. (2019). Effect of E-commerce on performance in agricultural sector in Kenya: A
case of Twiga foods limited. Dissertation, Doctoral dissertation, United States International
University Africa.
Mitchell, T. (2017). Is knowledge power? Information and switching costs in agricultural markets.
American Journal of Agricultural Economics, 99(5), 1307–1326.
Mitra, S., Mookherjee, D., Torero, M., et al. (2018). Asymmetric information and middleman
margins: An experiment with Indian potato farmers. Review of Economics and Statistics,
100(1), 1–13.
Nakasone, E. (2013) The role of price information in agricultural markets: Experimental evidence
from rural Peru. Paper presented at the Northeastern Universities Development Consortium,
Boston University, Boston, November 2014.
Nakasone, E., Torero, M., & Minten, B. (2014). The power of information: The ICT revolution in
agricultural development. Annual Review of Resource Economics, 6(1), 533–550.
Newman, N., Bergquist, L.F., Immorlica, N., Leyton Brown, K., et al. (2018). Designing and
evolving an electronic agricultural marketplace in Uganda. In: Proceedings of the 1st ACM
SIGCAS conference on computing and sustainable societies, Menlo Park and San Jose, June
2018.
9 Digital Trading and Market Platforms: Ghana Case Study
245
Nyarko, Y., Pellegrina, H. (2020). Commodity exchange markets in Africa. Working Paper.
Ochieng, D.O., Botha, R., Baulch, B. (2020). Market information and access to structured markets
by small farmers and traders: Evidence from an action research experiment in Central Malawi.
International Food Policy Research Institute Working Paper.
Reda, A., Duong, Q., Alperovich, T., Noble, B., et al. (2010). Robit: An extensible auctionbased market platform for challenged environments. In: Proceedings of the 4th ACM/IEEE
international conference on information and communication technologies and development,
London, 13–16 December 2010.
Saenger, C., Torero, M., & Qaim, M. (2014). Impact of third-party contract enforcement in
agricultural markets – A field experiment in Vietnam. American Journal of Agricultural
Economics, 96(4), 1220–1238.
Ssekibuule, R., Quinn, J.A., Leyton-Brown, K. (2013). A mobile market for agricultural trade
in Uganda. In: Proceedings of the 4th annual symposium on computing for development,
University of Cape Town, Cape Town, 6–7 December 2013.
Startz, M. (2016). The value of face-to-face: Search and contracting problems in Nigerian trade.
Available at SSRN 3096685.
Svensson, J., & Yanagizawa, D. (2009). Getting prices right: The impact of the market information
service in Uganda. Journal of the European Economic Association, 7(2–3), 435–445.
Verhoogen, E. A. (2008). Trade, quality upgrading, and wage inequality in the Mexican manufacturing sector. The Quarterly Journal of Economics, 123(2), 489–530.
World Food Program. (2010). Cambodia food market analysis and survey report. https://
www.wfp.org/countries/cambodia. Accessed May 15 2020.
Zant, W. (2019). Mobile phones and Mozambique traders: What is the size of reduced search costs
and who benefits? Tinbergen Institute working paper TI 19-047/V.
Open Access This chapter is licensed under the terms of the Creative Commons Attribution 4.0
International License (http://creativecommons.org/licenses/by/4.0/), which permits use, sharing,
adaptation, distribution and reproduction in any medium or format, as long as you give appropriate
credit to the original author(s) and the source, provide a link to the Creative Commons license and
indicate if changes were made.
The images or other third party material in this chapter are included in the chapter’s Creative
Commons license, unless indicated otherwise in a credit line to the material. If material is not
included in the chapter’s Creative Commons license and your intended use is not permitted by
statutory regulation or exceeds the permitted use, you will need to obtain permission directly from
the copyright holder.
Chapter 10
Fintech for Rural Markets
in Sub-Saharan Africa
Jenny C. Aker
1 Development Challenge
Since the 1990s, cash transfer programs have been an important part of social
protection policies in low-income countries. As of May 2020, approximately 159
countries had 700 types of social protection programs in place, over 200 of
which were cash-based measures (Gentilini et al., 2020). While implementing such
programs raises numerous challenges, from targeting, to funding, to choosing the
modality, one key issue is distribution. In higher- and middle-income countries, such
programs are often implemented electronically, via either bank transfers or prepaid
debit cards. Yet in lower-income countries with limited financial infrastructure,
social programs often require physically distributing cash in small denominations
to remote rural areas. Globally, 1.7 billion adults remain unbanked, without an
account at a financial institution or through a mobile money provider (DemirgucKunt et al., 2017). This lack of access to financial services not only increases the
logistical challenges associated with implementing cash transfer programs but also
potentially creates substantial direct and indirect costs for program recipients. This
is especially the case in sub-Saharan Africa, where money transfer costs are among
the highest in the world (World Bank, 2017). In such an environment, how can
cash transfers or salaries be distributed more efficiently using digital technologies?
In addition to efficiency, can digital transfer mechanisms improve the welfare
of program recipients along other dimensions? Could it benefit or disadvantage
particular subgroups? And could public investments in transfer infrastructure lead
to spillovers for person-to-person (P2P) transfers, especially in an area of the world
where remittances represent 2.5% of GDP (World Bank, 2018)?
J. C. Aker ()
Tufts University, Medford, MA, USA
© The Author(s) 2023
T. Madon et al. (eds.), Introduction to Development Engineering,
https://doi.org/10.1007/978-3-030-86065-3_10
247
248
J. C. Aker
These questions are at the heart of this case study on Niger, a landlocked country
in the Sahelian zone of West Africa and one of the poorest countries in the world.
The Sahel is the transition area between the Sahara Desert to the north and the
tropical zones to the south, receiving approximately 200–800 millimeters of rainfall
per year. The region has witnessed some of its most serious climate-induced food
shortages in the 1970s and 1980s, with approximately 250,000 drought-related
human fatalities occurring in the 1960s, 1970s, and 1980s. Since that time, Niger
has been subject to frequent droughts, the most recent of which occurred in 2018
(OCHA, 2018).
Given that agricultural production in Niger is primarily rainfed, with a unimodal
distribution, inter-annual deviations in rainfall are strongly correlated with fluctuations in agricultural output, income, and food security. If financial markets are
performing optimally, then households could save or borrow to cope with such
shocks. Yet, given the limited access to financial services – in fact, Niger is one
of the most financially excluded countries in the world – such strategies are difficult
to implement, especially for the rural poor (Collins et al., 2009; Karlan & Morduch,
2010; Dupas & Robinson, 2013; Rutherford, 2000). As a result, rural households
often rely upon external assistance – whether remittances or external aid – to cope
with idiosyncratic and covariate shocks, both of which require money transfers.
This case study focuses on a particular crisis in Niger, the 2009/2010 drought
and corresponding harvest failure, which affected more than 2.7 million people
(FEWS NET, 2010). In response to this crisis, governmental and nongovernmental
organizations (NGOs) implemented a series of social protection programs, including
food aid, vouchers, and cash transfers. While seemingly simple, the context was not:
At the time, Niger had one bank for every 100,000 people (Demirguc-Kunt et al.,
2017), few paved roads, and small-scale conflicts along the Niger-Mali and NigerNigeria borders. Thus, the Nigerien government and NGOs typically distributed
cash transfers manually, placing cash into individual envelopes and transporting it
with armed security forces into remote rural areas (Aker et al., 2016).
In January 2010, a relatively new technology – mobile money – was introduced
into the country by one mobile network operator (MNO), known as “Zap.” Similar
to M-PESA in Kenya, the mobile money product allowed users to transfer money
via a text-based system on their phone and pick up their cash at a local agent. In
the context of the food crisis, the technology offered a unique opportunity: Rather
than physically distributing cash to thousands of beneficiaries, the government and
NGOs could disburse cash transfers electronically via the mobile money system.
This digital transfer system could potentially (1) reduce the transfer costs for the
implementing agency and program recipients, thereby improving program coverage
and outreach; (2) lead to other improvements in program recipients’ well-being,
primarily due to time savings; and (3) allow program recipients to use mobile money
for remittances, an important income source in Niger (Aker et al., 2020a, b; Jack
& Suri, 2014). To explore the feasibility, cost, and impact of using mobile money
for cash transfer programs, researchers collaborated closely with an NGO, Concern
Worldwide, to design and implement a randomized control trial (RCT) across 96
villages in one region of Niger.
10 Fintech for Rural Markets in Sub-Saharan Africa
249
Between 2010 and 2020, many of the conditions under which this case study
took place have not significantly changed in Niger. Niger is still one of the most
financially excluded countries in the world (Demirguc-Kunt et al., 2017), and
climate-related shocks and food crises are relatively common. These shocks have
been further aggravated by the escalation of armed conflict: As of 2019, there were
4.5 million people displaced and 12.2 million people suffering from food insecurity
within the West Africa region. While mobile money exists in Niger, with products
offered by three different MNOs, its adoption has not taken off as predicted. Mmoney adoption was estimated at 9% as of 2017 (Demirguc-Kunt et al., 2017), with
relatively lower rates in rural areas, despite mobile ownership rates of over 80%
(Aker et al., 2020a, b). Thus, similar challenges as those encountered in 2020 were
also apparent in 2018, during a second cash transfer program.
It is easy to dismiss the low rates of mobile money adoption as specific to Niger,
with limited relevance to other contexts. Yet, many of these statistics are mirrored
in the West Africa region. While average mobile phone adoption in the region is
67% and there are 59 mobile money deployments, mobile money has been slower
to take off as compared with East and Southern Africa. For example, despite the
fact that there were 163 million accounts in 2019, there is significant heterogeneity
in adoption across and within countries (GSMA, 2019). In addition, there is a stark
contrast between adoption and usage; out of the total number of registered accounts,
34.6% have shown some activity, with the number of active users ranging from
1% in Niger to 20% in Ivory Coast (Fig. 10.1). This appears to be due, in part,
to the limited mobile money agent infrastructure, limited interoperability between
MNOs within and across countries, and regulatory frameworks in place (Aker et
al. 2020a, b; CGAP, 2016). As a result, mobile money has not yet become the
transformative technology in countries such as Niger, nor for some of its neighbors,
despite potentially high demand for the service.
Despite these caveats, digital financial services may still offer significant potential for small-scale farmers to save, invest, and smooth consumption in West Africa.
Since 2012, a number of “second-generation” digital financial services – namely,
digital credit, savings, and insurance – have proliferated in East and Southern
Africa. As of 2015, 20% of Kenyans were using Safaricom’s M-Shwari digital
credit and savings product (Cook & McKay, 2015). There are numerous concerns
that have been raised with digital credit products, such as high effective interest
rates (CGAP, 2016), as well as high delinquency and default rates. While rigorous
evidence of their impact is nascent, early studies in this area suggest that such
digital products enabled households to smooth consumption in the face of shocks
and encourage short-term savings, although they have not specifically studied
agricultural outcomes (Bharadwaj & Suri, 2020; Bharadwaj et al., 2019). While
MNOs in West Africa primarily offer first-generation digital financial services – i.e.,
mobile money – there have been more recent digital credit deployments in countries
such as Benin, Ghana, Ivory Coast, and Nigeria. Existing studies in this area promise
to shed new light on their impacts in the years to come.
250
J. C. Aker
Fig. 10.1 Number of accounts and active accounts per population per country
2 Implementation Context
Niger is one of the largest countries in sub-Saharan Africa, with relatively limited
access to roads, financial infrastructure, or electricity. The first mobile money
system in Niger was introduced in January 2010. Known as “Zap,” the product was
developed by one of the MNOs, Zain (later Bharti Airtel). Like most mobile money
systems, Zap allowed users to store value in the mobile money account, convert
cash in and out of the account, and make transfers by using a set of text messages
personal identification numbers (PINs) (Aker & Mbiti, 2010). The cost of making a
US$ 45 transfer using Zap was US$ 3 in 2010. Initial coverage, usage, and growth
of Zap were limited and geographically focused in the capital city (Niamey) and
regional capitals.
Given the context, there were a number of challenges to designing, implementing, and evaluating a mobile money cash transfer program. The first of these was
mobile phone ownership: While mobile phones were initially introduced in Niger
in 2000 and had grown substantially between 2000 and 2010, adoption rates were
at 30% by 2010. Although there were high rates of phone sharing within and across
households, the nature of the cash transfer program – which targeted vulnerable
households within villages and targeted women within the household – meant that
mobile phone ownership was a potential constraint to implementation.
10 Fintech for Rural Markets in Sub-Saharan Africa
251
Second, beyond the issue of mobile phone ownership, few households in Niger –
and specifically in the study region – knew about (or had used) mobile money. Since
mobile money had only been introduced in January 2010 and the first transfer was
scheduled to take place in May 2010, adoption in remote rural areas was less than
1%. This not only meant that households were not registered for mobile money – a
process that required some type identification – but they also did not have the special
SIM required for the platform.
Third, the mobile money platform was text- and number-based: The program
recipient would receive a text notifying her of the transfer with the amount and was
required to remember a four-digit PIN number in order to pick up the transfer from
the agent. This was therefore the fourth challenge: Niger had, and still has, some of
the lowest literacy rates in the world, with an average literacy rate of less than 30%
and an average of 2 years of completed schooling (Aker & Ksoll, 2019). In our study
area, 58% of women had attended some school, but literacy rates among women
were less than 15%. This led to challenges in manipulating the mobile phones, as
well as recalling PIN codes.
The final challenge was related to the density of mobile money agents: As a new
product, there were few agents located outside of the capital city, and there were no
mobile money agents in the study area. Thus, while the mobile money product had
the potential to reduce the costs associated with distributing the cash transfer for
the NGO, it also had the potential to increase the costs for the program recipients,
essentially shifting the risk to the private sector: the MNOs and the agents.
Designing and implementing the program and corresponding research required
close consultation and collaboration with a diverse set of stakeholders: (1) the
NGO, Concern Worldwide, who was the implementing agency for the cash transfer
program; (2) the 116 villages who were part of the cash transfer program and were
responsible for identifying vulnerable households within the community; (3) Zain,
the MNO, who was the only mobile money operator at the time; (4) local traders
and retailers, who were the primary mobile money agents in the region; (5) the
local data collection firm, Sahel Consulting, and Tufts University, who were jointly
responsible for designing the research and data collection during the evaluation;
and (6) the Ministry of Social Protection, who was responsible for overseeing and
coordinating diverse cash transfer interventions during the food crisis of 2009–2010.
Close collaboration among these different sets of stakeholders allowed for
creative resolution of the four challenges identified above. In order to address the
issue of low mobile phone ownership, it was decided to purchase simple mobile
phones for program recipients. The team also discussed how the provision of mobile
phones might affect program recipients’ behavior and hence the research results,
which led to the modification of the original research.
In order to address the challenges related to mobile money awareness and
literacy, Concern Worldwide, the MNO, and researchers collaborated along two
key dimensions. First, in addition to the mobile phones, program recipients also
received SIM cards that were “Zap-enabled,” meaning that that could be registered
for (and use) the Zap product, and second, Tufts University and Concern Worldwide
developed a training manual and corresponding trainings on how to use mobile
252
J. C. Aker
Fig. 10.2 Placeholder
money in a low-literate environment (Fig. 10.2). Building upon research done by
Tufts University on a mobile phone literacy project in Niger, Concern Worldwide
also distributed a mobile phone poster, which allowed program recipients to find
their PIN code on the handset, as well as memorize the number (Fig. 10.3).
Finally, in order to address the issue of agent network, Concern Worldwide
worked closely with Zain to identify potential agents in the region, in particular
by informing Zain of the location of the cash transfer villages. In addition, Concern
Worldwide notified Zain of the timing of the cash transfers in advance, so that agents
would have sufficient liquidity for program recipients to cash out.
3 Innovate, Implement, and Evaluate
3.1 Innovation
In light of the high costs involved in distributing cash transfers in Niger, the
introduction of mobile money offered a new mechanism for disbursing cash
transfers to food-insecure households. The starting point for the intervention was
10 Fintech for Rural Markets in Sub-Saharan Africa
253
Fig. 10.3 Mobile phone
poster
therefore two models of distributing cash transfers – manual and electronic cash
(in-person) – and adapting this to the particular context.
The cash transfer intervention in this context was relatively simple: Program
recipients among 116 food-insecure villages of the Tahoua region of were provided
with a monthly transfer of US$ 45 over a 5-month period, for a total of US$
225. The transfer was provided on the hungry season (from May to September),
in the hopes that this would reduce the likelihood of more severe food insecurity,
malnutrition, and the distress sale of assets. While 116 villages were eligible for cash
transfers, based upon drought and production data, 20 villages were removed from
the evaluation sample, as they either did not have mobile phone coverage (and hence
were not eligible for cash transfers via mobile money) or were in highly insecure
areas (and hence were not eligible for cash transfers in person). This therefore left a
sample of 96 villages for the evaluation.
Eligible households within each village were identified by a village-level vulnerability exercise. Using indicators such as livestock ownership, landholdings, and the
254
J. C. Aker
number of household members, households were classified into four vulnerability
categories (A, B, C, and D), with C and D households selected for participation
in the cash transfer program (Aker et al. 2016). The number of program recipient
households per village ranged from 12 to 90% of the village population, with an
average of 45% (Aker et al., 2016). All targeted households were scheduled to
receive the same amount, at about the same time, each month.
Villages were assigned to one of three innovation models:
1. Manual cash, whereby program recipients in a given village received the cash
transfer in the village or via a nearby village, using the standard model of cash
delivery. Program recipients thus received a beneficiary card and were required
to travel to the cash delivery point on a specific day of each month. At the cash
delivery point, program recipients had to wait in line and have their identity
verified before receiving their cash in an envelope.
2. Manual cash with a Zap-enabled mobile phone, whereby the program recipients
received their cash in a similar mechanism as above but also received a Zapenabled mobile phone, worth approximately US$ 5. The mobile phone had a Zain
SIM, and program recipients could use mobile money if they wished, but they did
not receive their transfer via mobile money. They also received the training on
how mobile money worked, as explained below.
3. Zap transfer, whereby program recipients received the Zap-enabled mobile
phone (as was the case in the second model) but received their transfer via the
mobile phone. This involved not only distributing the phone to households (with
the Zain SIM) but also conducting an interactive training with households to
explain how mobile money worked and what they could expect. This model also
required collaboration between Concern Worldwide and Zain to create a webbased, password-protected interface with program recipients’ phone numbers,
transferring money to a bank account connected to the Zap account, identifying
and verifying program recipients, uploading an encrypted file onto Zain’s
system (so that they would not have program recipients’ personal identifying
information), and sending the cash transfer via SMS to program recipients’ Zap
accounts.
Among these three models, the primary innovation of interest was the third one.
While mobile money could have affected household outcomes in a variety of ways,
the primary hypothesis behind this research was related to transfer costs. In other
words, by providing the cash transfer via mobile money, it was hypothesized that
this would reduce program recipients’ costs in obtaining the transfer, in terms of
both transport and waiting time. It was further hypothesized that mobile money
would affect household outcomes in the following ways:
• The reduction in transfer costs would allow program recipients to invest time
in other productive activities during the planting period, as well as change the
timing and location of purchases, particularly if they were able to purchase food
and nonfood items from agents.
10 Fintech for Rural Markets in Sub-Saharan Africa
255
• The introduction of mobile money would allow program recipients to use mobile
money for private (person-to-person) transfers, therefore increasing the amount
of remittances available from migrants, as well as allowing remittances to arrive
when they were needed the most (Jack & Suri, 2014).
• Because the mobile money cash transfer mechanism was more private than the
manual cash transfer (as program recipients only received a discreet “beep”
letting them know that the transfer had arrived), this could have allowed program
recipients – all of whom were women – to have more control over the cash
transfer resources.
3.2 Implementation
The design and implementation of the above interventions were developed collaboratively between Concern Worldwide and Tufts University. Initially, Concern
Worldwide only wanted to compare two interventions: the manual cash group and
the mobile money cash transfer group. When it was realized that mobile phone
ownership was only 30% among the target population and that mobile money
adoption was essentially zero, the teams quickly realized that improving program
recipients’ access to mobile phone technology (by providing mobile phones), as
well as the mobile money technology (by facilitating registration, SIM cards, and
trainings), was required.
The provision of Zap-enabled mobile phones to the mobile money cash transfer
recipients therefore required one primary modification to the initial interventions.
The first was the addition of the “cash transfer plus mobile phone” intervention
group (model no. 2). Since the Zap program recipients were supposed to receive
the mobile phone plus the cash transfer via the mobile phone, this would imply
that there were two differences with the manual cash transfer approach: the mobile
phone and the use of mobile money for the cash transfer. If the mobile phone on its
own improved program recipients’ welfare – either by improving communication on
agricultural prices or allowing households to increase access to private transfers –
then it would be difficult to disentangle the impacts of the mobile phone from the
impacts of the mobile money product. By comparing the manual cash group with
the manual cash plus mobile phone group, we were able to answer the question
“Conditional on receiving a manual cash transfer, what is the additional impact of
the mobile phone?” Then, by comparing the second intervention group with the
third, we were able answer the question “What is the additional impact of receiving
cash via mobile money?” The addition of the second intervention group created
numerous discussions, as this required additional resources (cash to purchase the
mobile phones) and trainings. The researchers and Concern Worldwide decided, in
consultation, that the primary objective of the research was to measure the impact of
the new mobile money transfer technology and that the impact of the mobile phone
needed to be netted out.
256
J. C. Aker
The second modification was related to the availability of agents in the targeted
region. Despite intense work with Zain to encourage them to register agents in the
region, the MNO was unable to register a sufficient number of agents by the time
of the first cash transfer. As a result, one agent distributed cash to 32 mobile money
villages for the first transfer. After additional discussions with Zain, the company
was able to register more agents in the region, based upon their own criteria
for choosing suitable agents. One key concern, however, was that these agents
were equitably distributed across all 96 villages in the evaluation sample, rather
than simply focusing on mobile money villages, in order to minimize differences
between the mobile money group and the manual cash transfer groups. This was
verified during the evaluation stage; the number and density of Zap agents was
similar across all groups, without a statistically significant difference between the
two. This implied, therefore, that any differences observed between Zap and manual
cash villages would not be driven by the differential presence of mobile money
agents.
3.3 Evaluation
In order to measure the impact of the mobile money cash transfer innovation on
outcomes of interest, we used an RCT at the village level. The 96 evaluation villages
were first stratified by administrative division and randomly assigned to one of
the three cash transfer innovations, with 32 villages in each group. The primary
outcomes measured were those in the original theory of change: (1) transfer costs,
both for the implementing agency and for program recipients, including when,
where, and how they obtained their cash; (2) uses of the cash transfer, including
the different categories; (3) welfare measures associated with the cash transfer,
including food security, diet diversity, and nutritional outcomes; and (4) indicators
related to mechanisms, in particular related to access to remittances, as well as intraand inter-household sharing of transfers.
The evaluation collected a wealth of data, including a baseline (May 2010), a
midline soon after the transfers (December 2010), and a final round 1 year later
(May 2011). The data were a panel dataset, with the primary program recipient as
the survey respondent. For each survey found, intensive survey piloting was done;
the survey was first written, with the team trained, and then piloted in the field at
least three times before being deployed. In addition, before the midline and final
survey rounds, qualitative data were also collected before the quantitative surveys,
in order to gain insights into impacts that were not initially expected in the initial
theory of change. This led to some useful insights about the observability of the
transfer within the household (as women wore the mobile phones around their necks
and reported that only they knew of its arrival) and a module on intra-household
decision-making. In the current context of using pre-analysis plans (PAPs) for
rigorous evaluations, these findings may not have been fully integrated into the study
or made it into the final paper.
10 Fintech for Rural Markets in Sub-Saharan Africa
257
Overall, the evaluation had six key findings:
• The marginal costs of the mobile money cash transfer were 20% lower than
the costs of distributing the cash transfer manually, but the fixed costs were
substantially higher, primarily due to the purchase of the mobile phones. Unlike
other studies on digital transfers, we do not find evidence that the m-transfer
mechanism had any impacts on leakage (Muralidharan et al., 2016).
• Mobile money program recipients traveled shorter distances to obtain their
transfer as compared with their manual cash counterparts (both cash only and
cash plus mobile). While the manual cash and mobile program recipients traveled
an average of 4 km (round-trip) from their village to obtain the transfer, Zap
program recipients traveled 2 km to the nearest agent. This is equivalent to a
travel time savings of approximately 1 h for each cash transfer or 5 h over the
entire program. However, this analysis excludes the cash program recipients’
waiting time, which averaged 4 hours per cash transfer, as compared with 30
minutes for Zap recipients, equivalent to a savings of 2.5 days (Fig. 10.4).
• Mobile money cash transfer recipients that used their cash transfer to buy more
diverse types of goods were more likely to purchase protein- and energy-rich
foods. These diverse uses of the transfer resulted in a 9–16% improvement in
diet diversity as compared to the cash and mobile groups, primarily associated
with the increased consumption of beans and fats. In addition, children in the
Zap group consumed an additional one-third of a meal per day (Aker et al.,
2016). Yet, Zap households did not reduce their ownership of other durable and
Fig. 10.4 Travel cost by treatment group Source: Aker et al. (2016)
258
J. C. Aker
nondurable goods, suggesting that other household members were not decreasing
their contribution to household goods as a result of the transfer.
• These results can be partially explained by two factors: 1) Zap program
recipients spent less time on obtaining the transfer (Fig. 10.4), and 2) female
program recipients in Zap villages had increased bargaining power within the
household. In terms of time savings: While the magnitude was relatively small –
approximately 2.5 days over a 5-month period – this is a probably lower bound on
actual time savings. In addition, the savings occurred during the planting season,
a time when opportunity costs were high, implying that the time savings could
have enabled Zap program recipients to engage in other productive activities or
invest more time in childcare. There was some suggestive evidence in support
of the former channel: m-transfer households were more likely to cultivate
marginal cash crops primarily grown by women (Aker et al., 2016). In terms of
intra-household decision-making, program recipient reported that mobile money
was less observable to other household members, thereby allowing them to
temporarily conceal the arrival of the transfer (Aker et al., 2016). This was
supported by proxy measures of intra-household decision-making: Zap program
recipients were more likely to travel to weekly markets, spend more on children’s
clothing, and maintain the improved diet diversity results 6 months after the
program, well after the cash transfer had been spent (Aker et al., 2016).
• While program recipient households used mobile money to receive their transfer,
they did not use it to receive remittances or to save, and there were no significant
differences in the frequency or amount of remittances received. These results
were perhaps not surprising, as the agent network was not widespread at the
time, and the mobile money system could not be used for transfers to Nigeria,
the destination for a majority of migrants.
• There were no differences in costs, expenditures, or other measures of well-being
between the cash transfer or mobile phone plus cash transfer groups, suggesting
that the mobile phone (on its own) had no additional effect on household welfare.
While these results are promising, there are several limits to the generalizability
of these results. First, our case study studied the impact of different transfer
mechanisms during a food crisis, when the marginal utility of income can be high.
And as a result, uses of the cash transfer could be more diverse and less focused on
food items in other contexts. And second, since Niger is one of the poorest countries
in the world, with low rates of literacy, financial inclusion, and mobile money
adoption, the context might be different from other countries with higher rates of
financial inclusion and a more thoroughly developed mobile money infrastructure,
especially those in East Africa. Nevertheless, Niger’s educational, financial, and
mobile money indicators are not vastly different from other Sahelian countries in
West Africa, including Burkina Faso, Mali, northern Ghana and northern Ivory
Coast, suggesting that these results might be informative for those contexts (GSMA,
2019; Findex, 2017).
10 Fintech for Rural Markets in Sub-Saharan Africa
259
3.4 Adaptation
In 2018, the question of how to safely and efficiently distribute cash transfers
arose in the context of another project in Niger, one which studied the impact of
training and cash transfers on the adoption of an environmental technology (Aker
& Jack, 2020). The study took place across 180 villages in the Zinder Region, with
110 villages assigned to receive either conditional or unconditional cash transfers.
Overall, 1750 program recipients were supposed to receive a one-time cash transfer
between April and June 2018. Located in the far east of the country, the villages were
relatively close to the Nigerian border and had relatively high rates of migration and
mobile phone ownership (over 60%). The project was a collaborative effort between
Tufts University (the research lead), Sahel Consulting (the data collection firm), and
the Ministry of Environment, neither of whom had the capacity to distribute cash
transfers manually.
Based upon the Zap research in 2010, the team understood that distributing
cash transfers via mobile money required substantial investment and that several
preconditions were necessary: mobile phone ownership, mobile money usage, and a
mobile money agent. Despite high rates of migration and intense demand for money
transfers, fewer than 3% of households had used mobile money as of 2017 (Aker
et al., 2020c). In addition, there were only four mobile money agents in the entire
region. This suggested that neither mobile money infrastructure nor adoption had
changed significantly since 2010.
In light of these conditions, the stakeholders generated four options for distributing the cash transfers: (1) the manual distribution of cash transfers by Sahel
Consulting, similar to the role of Concern Worldwide in 2010; (2) the electronic
distribution of cash transfers via local money transfer providers, similar to Western
Union and MoneyGram; (3) the electronic distribution of cash transfers as airtime
credit, which program recipients could then convert into cash; or (4) the electronic
distribution of cash transfers via mobile money.
Options no. 1 and no. 2 were rejected by the implementation partners. The
first option (manual distribution) was rejected as too risky, as it would require
transporting US$ 35,000 in cash to remote rural areas, and security would be needed
to reduce the likelihood of theft. The second option (electronic distribution via local
money transfer companies) was rejected because it was not a relative improvement
over mobile money: The location of the money transfer agents was similar to the
location of mobile money agents, and the money transfer agents could not guarantee
that they would have sufficient liquidity on hand.
As a result, the stakeholders focused their discussion on options no. 3 and no. 4,
each of which had advantages and disadvantages. As each stakeholder had different
opinions on the relative merits of each option, the team used a technique called
“Analytical Hierarchical Process” (AHP) to weight the options and make a decision
(Saaty, 1980; Leal, 2020). In essence, this approach involved stating the goal of the
exercise (finding the best cash transfer mechanism) and the criteria as to how this
decision would be made (viz., the costs to the program recipients, the number of
260
J. C. Aker
agents, the knowledge of the technology, and the risks to the implementing agency).
Each individual on the team assessed each option along each criteria and used
this to come up with a ranking. The rankings are all compared, and weights were
developed.
Based upon this exercise, option no. 4 scored relatively higher on a number of
criteria, in particular the lower risk to the Ministry and Sahel Consulting, as well
as the program recipients. As a result, the team decided to implement option no. 4
but with a slight modification. In essence, this involved sending the money via the
mobile money to the program recipient’s mobile phone number, as this did not need
to have a mobile money account (called “envoie code”). The recipient received a
code and was able to take this code to the nearest mobile money agent to pick up the
money. If the program recipient did not have a mobile phone, then they were asked
to provide the number of someone whom they trusted. This modification did not
require providing mobile phones, nor registering program recipients on the mobile
money platform, as was necessary in 2010. With some additional monitoring –
namely, by calling program recipients and the village chief and working closely
with the MNO – over 98% of program recipients received their cash transfer and
received the full amount of the cash transfer.
4 Results and Lessons Learned
Overall, this case study shows how the introduction of a new digital technology
could be harnessed to quickly distribute cash transfers in the context of a slow-onset
emergency, where access to financial institutions and money transfer providers is
limited. While the original case study took place in 2010, given the fact that over
100 million adults received their cash transfers manually as of 2017 – as well as the
growth in cash transfer programs in response to the COVID-19 crisis – the results
provide a number of lessons learned for cash transfer programs for the unbanked in
urban and remote rural areas. In the 10 years since this study has taken place, there
have been a number of other studies using digital platforms to provide cash transfers
(Muralidharan et al., 2016; Haushofer & Shapiro, 2016), showing reductions in
transfer costs, leakage, and improvements in other welfare measures. Many, yet not
all, of these studies have taken place in certain contexts, such as Kenya and India,
which have robust and well-developed digital technology systems.
Outside of these areas, several things are clear. First, mobile money offers
significant opportunities to distribute cash transfer programs at scale, especially
among the poor, who tend to be less likely to have a bank account. Nevertheless,
it requires significant increases in the density of mobile money agents, as well
as increases in mobile money adoption among the unbanked, which has been a
constraint in many countries, especially in West Africa. Increasing the density of
mobile money agent may require some innovation on behalf of regulators, banks,
and mobile phone operators to register different entities as mobile money agents.
If the number of agents cannot be increased in the short term, then distributing
10 Fintech for Rural Markets in Sub-Saharan Africa
261
such transfers can impose higher costs on cash transfer recipients, as well as added
risks associated with a “rush” on mobile money agents. Beyond increasing the
number of agents, creative solutions may also be required to encourage mobile
money adoption, especially among the urban poor, either by having a more flexible
approach to registration or by using a technology that allows a user to send money
to a nonmobile money user, similar to our work in 2018. These issues, of course,
will need to be balanced with concerns regarding corruption and leakage.
There is significant room for more research on the constraints to the growth
of digital financial services (Fintech) in many countries in sub-Saharan Africa,
especially in West Africa. While digital credit, savings, and insurance have taken
off in countries such as Kenya, Uganda, Rwanda, and Tanzania, many of the digital
financial services (DFS) products are still “first generation” in West Africa. This
could be due to four related and interconnected issues: (1) the regulatory framework
in West Africa, which leads to competition between the “bank-led” and “MNO-led”
models of mobile money; (2) the effect of the regulatory framework on MNOs’
interest in, and profits from, mobile money; (3) the incentives provided to mobile
money agents, which therefore reduces their number and activity; and (4) the lack of
interoperability of mobile money products within and across West African countries,
which affects the potential for its use for remittances, the main driver of demand in
the region.
5 Summary and Interpretive Text Boxes
262
J. C. Aker
10 Fintech for Rural Markets in Sub-Saharan Africa
263
6 Discussion Questions
• Did you think that the current model of distributing cash was a problem in Niger
prior to the program? If so, why? If not, why not?
• Do you think that providing mobile phones was necessary in this context?
• What other factors might have been taken into consideration to increase the
sustainability of the adoption and usage of mobile money in the medium and
long term?
• Should the identification and registration of mobile money agents be left solely
to the responsibility of the MNO or in collaboration with the public sector? What
is the best way to ensure collaboration?
References
Aker, J. C., & Jack, B. K. (2020). Harvesting the rain: The adoption of environmental technologies
in the Sahel. Unpublished working paper.
Aker, J. C., & Ksoll, C. J. (2019). Call me educated: Evidence from a mobile phone experiment in
Niger. Economics of Education Review, 72(2019), 239–257.
Aker, J. C., & Mbiti, I. M. (2010). Mobile phones and economic development in Africa. Journal
of Economic Perspectives, 24(3), 207–232.
Aker, J. C., Boumnijel, R., McClelland, A., & Tierney, N. (2016). Payment mechanisms and antipoverty programs: Evidence from a mobile money cash transfer experiment in Niger. Economic
Development and Cultural Change, 65(1).
Aker, J. C., Prina, S., & Welch, J. (2020a, May). Migration, money transfers and mobile money.
AEA Papers and Proceedings, 110, 589–593.
Aker, J. C., Sawyer, M., Goldstein, M., O’Sullivan, M., & McConnell, M. (2020b, April). Just a
bit of cushion: The role of a simple savings device in planned and unplanned expense events in
Rural Niger. World Development, 128
Aker, J. C., Prina, S., & Welch, J. (2020c). Migration, money transfers and mobile money: Evidence
from Niger. AEA Papers and Proceedings, 110, 589–593.
Bharadwaj, P., & Suri, T. (2020). Improving financial inclusion through digital savings and credit.
American Economic Review Papers and Proceedings.
Bharadwaj, P., Jack, W., & Suri, T. (2019). Fintech and household resilience to shocks: Evidence
from digital loans in Kenya. Working paper.
CGAP. (2016). Market system assessment of digital financial services in WAEMU. World Bank.
Collins, D., Morduch, J., Rutherford, S., & Ruthven, O. (2009). Portfolios of the poor: How the
world’s poor live on two dollars a day. Princeton University Press.
Cook, T., & McKay, C. (2015, April). How M-Shwari works: The story so far. Access to Finance
Forum, 10.
Demirguc-Kunt, A., Klapper, L., Singer, D., Ansar, S., & Hess, J., (2017). The Global Findex
database 2017: Measuring financial inclusion and the Fintech revolution. The World Bank.
Dupas, P., & Robinson, J. (2013, June). Why don’t the poor save more? Evidence from health
savings experiments. American Economic Review, 103(4), 1138–1171.
Famine Early Warning Systems Network (FEWS NET). (2010). Niger Food Security Outlook 2010.
FEWS NET.
Gentilini, U., Almenfi, M., & Dale, P., Demarco, G., & Santos, I. (2020). Social protection and
jobs responses to COVID-19: A real-time review of country measures. World Bank working
paper.
264
J. C. Aker
GSM Association. (2019). State of industry report on mobile money: 2019.
Haushofer, J., & Shapiro, J. (2016, November). The Quarterly Journal of Economics, 131(4),
1973–1204.
Jack, W., & Suri, T. (2014). Risk sharing and transactions costs: evidence from Kenya’s mobile
money revolution. American Economic Review, 104(1), 183–223.
Karlan, D., & Morduch, J. (2010). Access to finance. In Handbook of development economics.
Elsevier.
Leal, J. E. (2020). A simplified version of the analytical hierarchy method. Computer Science.
Muralidharan, K., Niehaus, P., & Sukhtankar, S. (2016). Building state capacity: Evidence from
biometric smartcards in India. American Economic Review, 106(10), 2895–2929.
OCHA. (2018). Niger: Food assistance fact sheet. Washington, D.C..
Rutherford, S. (2000). The poor and their money. Oxford University Press.
Saaty, T. L. (1980). Decision-making, scaling and number crunching. Decision Sciences, 20(2),
404–409.
World Bank Group. (2017). Remittance prices worldwide. Issue 21.
World Bank. (2018). Migration and remittances: Recent developments and outlook. Migration and
development brief 29.
Open Access This chapter is licensed under the terms of the Creative Commons Attribution 4.0
International License (http://creativecommons.org/licenses/by/4.0/), which permits use, sharing,
adaptation, distribution and reproduction in any medium or format, as long as you give appropriate
credit to the original author(s) and the source, provide a link to the Creative Commons license and
indicate if changes were made.
The images or other third party material in this chapter are included in the chapter’s Creative
Commons license, unless indicated otherwise in a credit line to the material. If material is not
included in the chapter’s Creative Commons license and your intended use is not permitted by
statutory regulation or exceeds the permitted use, you will need to obtain permission directly from
the copyright holder.
Part III
Expanding Human Potential:
Technology-Based Solutions for Education
and Labor
Temina Madon
Introduction
For many people, our time (or labor) is the greatest asset we have to invest. We may
operate in informal markets, working as self-employed micro-entrepreneurs, or we
may hold jobs in the formal sector. But if we live in poverty, we likely consume
whatever we earn, leaving little for savings or household investment.
One path to a better life is social protection: the government policies and
programs that address poverty by ensuring a basic standard of living for all. But
in countries without the resources to finance safety nets, the most common path
out of poverty is to boost human potential, equipping people with the skills to
participate in a global, market-based economy. It is therefore unsurprising that
many economic development initiatives have focused on education and skills
development, alongside job creation and entrepreneurship (World Bank, 2019).
Yet this raises several fundamental questions. What are the most cost-effective
ways to invest in people’s potential—both during youth and after they have
transitioned into adulthood? What tools are needed to connect people with the
jobs or enterprises they are prepared for and passionate about, so that society can
make productive use of their available labor? And once people have found jobs or
entrepreneurial opportunities, how can we ensure the safety and dignity of their
work? The case studies in this section will address each of these questions, in turn.
Improving the quality of education is a clear opportunity for innovation. Education is often viewed as a human right; as a result, spending on schooling is
a large share of total government expenditure, particularly in low- and middleincome countries. An extreme example is Sierra Leone, which since 2018 has spent
a third of total public sector expenditure on education (UNESCO). Despite these
investments, classroom resources in the poorest regions are still limited, with policy
T. Madon
Center for Effective Global Action, University of California, Berkeley, Berkeley, CA, USA
e-mail: temina@ocf.berkeley.edu
266
III
Expanding Human Potential: Technology-Based Solutions for Education. . .
makers struggling to identify the most cost-effective ways to improve learning
outcomes. Public schools are often poorly managed, with limited investment in
teacher supervision and professional development, and teachers often fail to instruct
students at the right level (Angrist et al., 2020). Yet, it is these government-run
schools that serve the most disadvantaged youth.
In spite of these challenges, engineers have made substantive advances in
education, through both hardware and software innovations. Indeed “edtech” has
grown into a profitable sector in some developing countries. However, the products
with greatest adoption (and benefits) often target upper-middle and upper class
households. There are fewer solutions tailored for use by teachers within school
settings, and where they have been deployed, classroom technologies have a mixed
record. There are numerous examples of computer-based learning exacerbating gaps
in learning among the poorest children (Evans & Popova, 2016).
In Chap. “Customized E-Learning Platforms,” Nicola Pitchford describes an
ongoing effort to integrate tablet-based e-learning into classroom instruction in
Malawi, operating initially as a pilot and then scaling over time. She finds that
integrating the technology into primary school education can significantly improve
numeracy, if it is embedded within a country’s infrastructure for the delivery of
education. There are also important lessons from scaling this class of technologies:
how do you move from proof of concept to efficacy trials, and on to effectiveness
at scale? Pitchford argues that researchers must not simply test hypotheses, but
rather they should participate longer term in the production of education within a
country. Ultimately, any researcher’s exit from that country should leave capacity
for ongoing implementation (with fidelity) as well as ongoing experimentation.
Learning assessment remains a critical issue: how to measure educational
outcomes from a cognitive development perspective, particularly when using digital
technology? Do current learning metrics focus enough on social and emotional
outcomes, and on mental health, or do we need more expansive models of
learning and capacity building? How might technology play a role in measurement
innovation?
Of course investment in education and improved learning outcomes does not
necessarily translate to productive employment. In many countries, there are high
rates of unemployment, particularly among young workers and migrant populations.
A lack of employment opportunities in the formal sector, accompanied by the
youth bulge found in many developing countries (also known as the “demographic
dividend”), threatens political instability in many countries. One recent trend
in economic development has been to train unemployed youth in business and
entrepreneurship (McKenzie, 2021). Yet, small-scale entrepreneurship, on its own,
is unlikely to fuel equitable economic growth. Countries must build institutions that
support the growth of existing firms, as well as the transition from informal labor and
self-employment to employment by growth-oriented firms (Goswami et al., 2019).
A potential solution is the emergence of digital jobs platforms, which address
frictions in labor markets by matching employees and firms and reducing search
costs in the informal sector. Labor markets in many developing countries suffer
from asymmetric and missing information—for example, lack of certification for
III
Expanding Human Potential: Technology-Based Solutions for Education. . .
267
a job candidate’s skills. Is it possible to eliminate some of these market failures,
especially in countries with large unemployed youth populations? In Chap. “Digital
Networking and the Case of Youth Unemployment in South Africa,” Shaw and
Wheeler evaluate an intervention to increase use of LinkedIn in South Africa,
revealing that users of the platform are indeed more likely to access jobs.
Once workers find profitable employment, are there technologies that can support
their safety, welfare, and productivity? In Chap. “Amplifying Worker Voice with
Technology and Organizational Incentives”, we explore approaches that enhance
firm efficiency through improved management practices— namely through worker
feedback, incentives for responsive managers, and improvements in workplace
environments. The chapter’s authors find that capturing workers’ voices using
technology, and providing confidential feedback to employers, can improve a firms’
productivity, through reductions in absenteeism and attrition. The existing systems
for this, such as a “suggestions box” on the factory floor, are antiquated and cannot
deliver the scale or accountability required for impact. So the researchers have
developed, through sequential randomized trials, a set of apps that can help resolve
employee grievances across the factory floor.
There is still the larger question of how to grow firms—how to increase the
number of jobs available, and improve the profitability of self-employment. Some
of these questions are addressed in Part II of this book. In this section, we instead
focus on innovations deployed along the arc of a human’s development, from
the cultivation of abilities (via education and skills development) to the efficient
allocation of labor across markets to the creation of safe and meaningful work
conditions across local and global supply chains. In each of these areas, there is
promise for further innovation to unleash human potential.
References
Angrist, N., Evans, D. K., Filmer, D., Glennerster, R., Rogers, F. H., & Sabarwal, S. (2020). How
to improve education outcomes most efficiently? World Bank Policy Research WP 9450. World
Bank.
Evans, D. K., & Popova, A. (2016). What really works to improve learning in developing countries?
An analysis of divergent findings in systematic reviews. The World Bank Research Observer,
31(2), 242−270.
Goswami, A. G., Medvedev, D., & Olafsen, E. (2019). High-growth firms: Facts, fiction, and policy
options for emerging economies. World Bank Publications.
McKenzie, D. (2021). Small business training to improve management practices in developing
countries: re-assessing the evidence for ‘training doesn’t work’. Oxford Review of Economic
Policy, 37(2), 276−301.
UNESCO Institute for Statistics (UIS) database, http://data.uis.unesco.org, June 29, 2022.
World Bank. (2019). World development report 2019: The changing nature of work. Washington,
DC: World Bank. https://doi.org/10.1596/978-1-4648-1328-3.
Chapter 11
Customised E-Learning Platforms
Nicola Pitchford
1 Development Challenge
More than 617 million children and adolescents worldwide do not possess the
basic reading and mathematics skills required to live a healthy and productive life
and contribute towards economic growth (UNESCO, 2017; see Text Box 11.1).
This global learning crisis is particularly acute in sub-Saharan countries, where
minimal proficiency levels are not being met by 88% of children and adolescents
in reading and 84% in mathematics. Across the region, education reform is required
to address significant disparities in access, quality and equity. Children living in
challenging contexts, such as remote rural locations, urban slums and border cities,
are particularly vulnerable, and certain groups of children are disproportionately
affected – especially girls, children living in extreme poverty and children at risk of,
or diagnosed with, special educational needs and disabilities.
Text Box 11.1: How the Global Learning Crisis Affects Capacity
UNESCO (2018) report that the global learning crisis is costing $129
billion a year.
‘Ten per cent of global spending on primary education is being lost on poor
quality education that is failing to ensure that children learn. This situation
(continued)
N. Pitchford ()
School of Psychology, University of Nottingham, Nottingham, UK
e-mail: nicola.pitchford@nottingham.ac.uk
© The Author(s) 2023
T. Madon et al. (eds.), Introduction to Development Engineering,
https://doi.org/10.1007/978-3-030-86065-3_11
269
270
N. Pitchford
Text Box 11.1 (continued)
leaves one in four young people in poor countries unable to read a single
sentence and perform basic mathematics’.
UNESCO (2019) warn that the world is off track in achieving the global
education goal, SDG 4.
‘Even though more and more children are starting school, one in six aged
6–17 will still be excluded by 2030. And of those who are enrolled, many are
not learning or will drop out early. By 2030, when all children should be in
school, four in ten young people will still not complete secondary education.
The European Commission highlighted that by the end of the Agenda for
Sustainable Development, about 800 million young people, half of them girls,
will not possess basic skills. This is a critical global issue, as many adolescents
and young people will not move into the job market with the right skills
needed for relevant employment that responds to the challenges faced by
their countries. Exacerbated by complex global threats like climate change,
the situation is most acute in low-income countries and holds back economic
growth and political stability, which would help bring people out of poverty
and foster economic growth and social wellbeing’.
The United Nations has recognised the significance of this global crisis in
education in the 2030 Sustainable Development Goals (SDGs). All member states
have agreed to work towards addressing SDG 4: Quality Education, which aims
to ensure inclusive and equitable quality education and promote lifelong learning
opportunities for all.
Radical solutions are required to eliminate existing barriers to quality education
for all children, anywhere in the world. Whilst the vast majority of children are
now in primary school globally, their learning attainment is highly uneven and often
persistently low (Hubber et al., 2016). This is not simply a matter of efficiency but
one of human rights and social justice (Barrett et al., 2015).
SDG4 has focused attention on the quality of learning outcomes. Evidence
suggests that technology-enhanced learning materials could be utilised by developing countries to promote significant and cost-effective improvements in learning
(e.g. Mitra et al., 2005). However, realising these benefits across different school
contexts remains a major challenge. For example, the One Laptop Per Child project
had limited success in the United States, Peru, Rwanda and Tanzania, mainly
due to poor implementation (e.g. limited Internet access in schools, poor support
for repairs, non-child-directed delivery) and lack of teacher training (see Hubber
et al., 2016). Evidence from the Second Information Technology in Education
Study (SITES) indicates that significant investment has been made in technologyenhanced learning initiatives across the developing world, but this investment has
not yet resulted in learning gains (Law et al., 2008). One reason may be that teachers
and schools implement such initiatives in ways that reinforce rather than transform
existing practice (Ruthven, 2009). This suggests there may be considerable potential
11 Customised E-Learning Platforms
271
in initiatives that improve learning but which have a close match to existing
pedagogical practice.
Unlocking Talent The initiative described in this case study, Unlocking Talent, was
established in 2013 to address the global learning crisis by harnessing technology to
deliver high-quality education. It takes an inclusive system approach to embedding
evidence-based e-Learning platforms within schools, with the aim of improving
early-grade learning outcomes in reading and mathematics. Unlocking Talent is a
growing, global initiative made up of an alliance of partners that focus on putting
children and their educational needs first. At its core, the project uses e-Learning
to help overcome the challenges that hold learners back. These include, but are
not limited to, lack of trained teachers, overcrowded classrooms, lack of learning
resources and high dropout rates. For context, in Malawi, where Unlocking Talent
began, the pupil to teacher ratio is 77:1, and the dropout rate at primary age is over
50% (UNICEF Malawi, 2019).
Whilst e-Learning platforms alone will not solve these problems, good educational technology is key to raising learning standards and could complement other
anti-poverty interventions, such as cash transfers. For example, a study by Kilburn et
al. (2017) showed that financial constraints are a major barrier to school attendance
in Malawi, because the cost of uniforms and books is beyond what many families
can afford. Cash transfers can increase attendance and reduce dropout, but this
does not change learning outcomes. High-quality e-Learning platforms can increase
learning outcomes, although children need to attend school on a regular basis to
benefit from this technology. Hence, to raise learning outcomes in low-income
contexts, such as Malawi, multiple synergistic interventions are required.
Why Malawi?
In 2013, the Unlocking Talent alliance started to introduce a customised e-Learning
platform within state primary schools in Malawi, to explore if technology could
provide a means of delivering high-quality education to marginalised children and
raising learning outcomes. Malawi was chosen because of the extreme challenges
facing education within the country. Whilst most innovators pilot their education
technology in small private schools, the Unlocking Talent alliance focused on state
schools from the onset, so as to reach the most marginalised children.
Malawi is one of the poorest countries in Africa (UNESCO-IBE, 2010) and
has some of the largest educational challenges globally, ranking second lowest in
the Southern and Eastern Africa Consortium for Monitoring Educational Quality
(SACMEQ) III report (Hungi et al., 2010). Whilst primary education is free for all
children aged 6–13 years, the education system is in poor condition, fraught with
chronic overcrowding, limited resources and inadequately trained teachers (Milner
et al., 2011). As a consequence, many of Malawi’s children do not attend or fail to
complete primary education.
Allied to very poor retention rates, very few pupils meet minimum learning
standards. Less than 10% of poor rural girls meet such standards, and attainment
of basic reading and mathematics is among the lowest in the region (World Bank,
2010). As a result, adult (15+) rates of reading and mathematics proficiency are just
66% (UNESCO Institute for Statistics, 2016).
272
N. Pitchford
Additionally, structural inequalities exist that disadvantage certain groups (Yates,
2008; see Text Box 11.2). This has significant consequences for Malawi’s potential
for long-term economic growth. Poor reading and mathematics skills mean many
people in Malawi struggle with basic day-to-day tasks, such as being able to read the
newspaper, understand forms and buy and sell goods at the local market, resulting in
long-term dependency and inability to secure and sustain employment and actively
participate in society. As discussed by our research team (Pitchford et al., 2019),
levels of reading attainment are linked to a country’s economic growth and to an
individual’s health, nutrition, rate of fertility and mortality and income potential
(Verner, 2005); however, mathematics attainment has been shown to have a stronger
link to an individual’s income potential (Crawford & Cribb, 2013; Dickerson et al.,
2015; Geary, 2004). Findings from several African countries indicate an increase
in mathematics test scores of only 0.1 standard deviations is associated with an
increase in income of between 2% and 6.5% (Dickerson et al., 2015).
Text Box 11.2: How Structural Inequalities Within Malawi Education
Affect Gender and Other Vulnerable Groups
There has been strong international focus on disparities in learning attainment
within countries. To illustrate how particular groups of children are disproportionately affected by education in Malawi, data on numeracy levels are
summarised below from the SACMEQ-III report (Spaull, 2012).
Gender: 64% of grade 6 girls were classified as functionally innumerate
compared to 56% of boys.
Wealth: 61% of pupils from the poorest 25% of society were classified as
functionally innumerate compared to 58% of pupils from the richest 25%
of society.
Location: Higher functional innumeracy rates were reported for grade 6
pupils in rural (63%) than urban (51%) regions.
Disability: 98% of children with special education needs and disabilities
in Malawi are excluded from quality education (MacDonnell Chilemba,
2013).
Wealth and location interact as, in general, poverty is higher in rural than
urban regions, but within urban regions, there are pockets of extreme poverty.
Rapid urbanisation has resulted in large informal settlements in major cities,
often with very poor education facilities, which can overturn the general urban
advantage (Chimombo, 2009).
In addition, children with home languages other than Chichewa, such
as those residing in the north of Malawi, can be further disadvantaged by
receiving instruction in school in a language (Chichewa) other than their home
language (Essien et al., 2016).
11 Customised E-Learning Platforms
273
2 Implementation Context
The context in which we have implemented a customised e-Learning platform
in Malawi is extremely challenging, due to limitations in key components of the
country’s integrated system of learning attainment. These include challenges with
school infrastructure (e.g. space, grid supply of electricity, Internet connectivity),
capacity and capability of teachers (most of whom have limited digital literacy
skills and little time for learning new skills), short school days (restricting available
time to introduce a new intervention without missing out on other key areas of the
curriculum) and overcrowded and mixed-ability classes. With an average of 77+
children in a class and often more, all of different abilities, it is difficult to ensure
all children have sufficient access to the technology at the required dosage to be
effective.
In addition, there are concerns about theft of technology and the greater impact
this has on school security and community beliefs about the value of technology
for learning. Malawi has a seriously underfunded education sector that struggles to
provide even the most basic learning materials, let alone expensive technology. This
all adds to the complexity of implementing an e-Learning platform in a low-income
country such as Malawi.
With these challenges, it was necessary to work with many stakeholders to
introduce an e-Learning platform within the Malawi primary education system,
with the view to scale nationally (see Fig. 11.1). Every country and context are
different, so having partners with the right skills, processes and support needed to
implement education technology is vital for success. From the outset, the Unlocking
Talent alliance has been partnering with the Government of Malawi to ensure the
project is fully embedded within the Ministry of Education, Science and Technology
(MoEST) and aligns with the national primary education strategy. Voluntary Service
Overseas (VSO), an international development organisation, leads the Unlocking
Talent initiative and is responsible for implementing the project in Malawian
primary schools. VSO has developed a close working relationship with the MoEST
in Malawi over the last 50 years, which has enabled them to have an active project
management unit working with all relevant departments and the senior management
team in the MoEST. The other core partners of the Unlocking Talent project are
the software developer – onebillion – and our research team at the University of
Nottingham.
Innovative, interactive, child-centred apps, designed and developed by onebillion, are the centre of this e-Learning platform, which is delivered through handheld
tablets. This case study describes nearly a decade of research evaluating the
effectiveness of the onebillion apps – and VSO’s implementation of the platform –
within Malawian primary schools, providing the critical evidence base for scaling
the initiative.
To ensure the research is culturally sensitive and to draw on specialist incountry knowledge of education practice and policy, the research team has partnered
with academics at the University of Malawi. The in-country academic partners
274
N. Pitchford
Funders
Including Royal Norwegian Embassy, KFW, DfID, UNICEF,
Comic Relief, Cisco, Airtel
Publish
Practice
Policy
Research & Evaluation
University of Nottingham & University of Malawi
Postdoctoral researchers, doctoral researchers, Master’s students
Fig. 11.1 Partnerships for scaling a customised e-Learning platform in Malawi adopted by the
Unlocking Talent alliance
operationalise the research by assembling, training and managing teams of local
evaluators who carry out assessments with children and schools in the local
language. This partnership also builds research capacity through supervision of
doctoral and masters students and early career researchers at the University of
Malawi. To promote scaling of the project, in line with the research evidence, the
alliance has engaged funding partners including the Norwegian Embassy; Kreditanstalt für Wiederaufbau (KFW); Comic Relief; the UK Foreign, Commonwealth
and Development Office; UNICEF; Cisco; and Airtel.
Other critical stakeholders are end users of the technology, including teachers,
school leaders, primary education advisors, community leaders, parents and children
themselves. In developing their customised e-Learning apps, onebillion has gone to
lengths to ensure that they meet the needs of children, through rigorous piloting of
their software and hardware with children in different settings. When implementing
the technology, VSO engages with parents, community leaders, teachers and
school leaders, to promote cultural acceptance and sensitisation and to address any
concerns they might have, by holding sensitisation meetings at local schools. In
addition, there is a steering committee for the Unlocking Talent project in Malawi,
comprising the national secretary for education, district-level education officers,
representatives from school management (head teachers) and class teachers, to
11 Customised E-Learning Platforms
275
ensure their voices are heard and inform contextually sensitive shaping of the project
as it scales.
3 Innovate, Implement, Evaluate and Adapt
3.1 Innovation: Customised E-Learning Platforms
Customised e-Learning platforms have potential to address some of the major
challenges related to the global learning crisis facing many low-income countries
in sub-Saharan Africa and elsewhere around the world, especially when based on
the seven principles of universal design: (1) equitable use, (2) flexibility in use,
(3) simple and intuitive use, (4) perceptible information, (5) tolerance for error, (6)
low physical effort and (7) size and space for approach and use (The Center for
Universal Design, 1997). Key software features include a wide array of multisensory
representations of information (such as pictures, sound, video and animation),
interactive tasks of varying degrees of difficulty, clear goals and rules, learner
control, response feedback and repetition. These features promote an individualised
learning environment that places the child in active control of their learning, with
little or no adult support (Condie & Munro, 2007; Rose et al., 2005). The apps are
delivered through touch-screen tablets, which are mobile and lightweight, eliminate
the need for extra dexterity-reliant devices (e.g. keyboard and mouse) and have the
capacity to store multiple child-friendly apps (Kucirkova, 2014).
We have found that customised e-Learning platforms have potential for widereaching acceptance and uptake by primary school teachers. The platforms can
address the broad range of individual abilities typically represented within a large
class and provide high-quality tailored instruction that is consistent for all children.
However, certain alignments at a country level, such as language of instruction, are
required for e-Learning platforms to be optimally effective. For example, Outhwaite
et al. (2020) have shown that proficiency in language of instruction correlates
positively with progress through the onebillion software. In addition, teachers are
more likely to adopt e-Learning platforms that align closely with existing curriculum
and pedagogical practice, as they supplement what is being taught in class and
therefore can be used as a remedial resource for children that are struggling to learn
with standard classroom instruction (Pitchford et al., 2018).
E-Learning Platform Used in the Unlocking Talent Project
As noted earlier, the software adopted by the Unlocking Talent initiative has been
developed by onebillion – joint winners of the Global Learning XPRIZE. The
software provides a comprehensive course of hundreds of learning units designed to
support the acquisition of basic reading and mathematics from scratch, with little or
no adult support. The course content is grounded in the national primary curriculum
of Malawi and covers topics that are essential for the development of basic reading
and mathematics, such as identification of letter sounds, syllable and phonological
276
N. Pitchford
Fig. 11.2 Examples of activities within the interactive apps developed by onebillion to support
acquisition of basic reading and mathematics
awareness, reading aloud, comprehending single words and sentences, counting to
100, adding, subtracting and telling the time (see Fig. 11.2).
The course content is modular, guiding children through a series of learning
units, and is delivered in their local language, Chichewa, by a friendly virtual
teacher. The software offers child-centred tuition through interactive picture, audio
and animation formats with clear objectives, instructions and immediate formative
feedback, consistent for all users. These app features align with the principles of
active, engaged, meaningful and socially interactive learning (Hirsh-Pasek et al.,
2015) and are characteristic of direct instruction and retrieval-based learning, within
a self-paced, individualised and inclusive learning environment, all of which are
known to be important for raising learning outcomes (Grimaldi & Karpicke, 2014;
Kirschner et al., 2006; Slavin & Lake, 2008). For example, the onebillion software
enables individualised reward and feedback on each interaction with the software.
Children are rewarded with a bright yellow tick and a high-pitched sound when
completing a task successfully, but if they perform an inappropriate action, the
software alerts this incorrect response by giving a low-pitched sound. Individualised
immediate feedback is known to motivate children to stay on task, especially
children with attention difficulties (e.g. Marx et al., 2018), yet this is scarcely
available from teachers in a crowded classroom (see also Hirshleifer (2017) for
another example of how educational technology can increase student rewards).
When used in formal education settings, such as primary schools, a remote
monitoring feature within the software records when children are using the apps
and logs their progress through the app content. This information is fed back to
teachers, which enables teachers to direct attention to children that become halted
on a particular topic and assist children who are making slow progress. Other
stakeholders can access this information at a school level, so they can monitor how
frequently schools are using the technology and how fast children are progressing.
The latest version of the software includes a customisation algorithm which
is designed to rapidly assess a child’s skill level each time they open the app.
The software then places the child at an appropriate skill level within the app
content. This adaptive learning feature has been designed especially for non-formal
education contexts, such as out-of-school outreach programmes, refugee settings
and direct-to-community approaches for children living in remote contexts where
access to formal education settings is scarce.
11 Customised E-Learning Platforms
277
Whilst onebillion designs and develops the software content and features, VSO
and the research team provide feedback on usability within schools, which can
be used to enhance the software through an ongoing iterative redesign process.
Likewise, class observations by the research team of the intervention’s delivery
by teachers in schools are fed back to VSO to improve ease and fidelity of
implementation.
3.2 Implementation Approach
The main approach for implementing the e-Learning platform that is currently being
used in Malawian primary schools involves small groups of children (typically 30–
60 children depending on the size of the school) attending a 40-minute session
at a learning centre, a specially designed classroom equipped with solar power
to enable use throughout the day, even in remote rural regions that are off-grid
(see Fig. 11.3a). Individual children use a handheld tablet connected to a set of
headphones to access the interactive, child-centred apps developed by onebillion
(see Fig. 11.3b). Teachers help, guide and praise children as they learn with the
app. They also use a dedicated teacher tablet to run the session. One teacher, who is
selected as the learning centre coordinator, is responsible for the proper functioning
and effective use of the learning centre. VSO members train teachers in how to use
the technology and how to lead sessions using the software. This in-service training
involves two 4-hour sessions which are delivered by VSO to teachers in the school.
This implementation approach has been subjected to formal evaluation and has been
shown to be effective at raising learning outcomes (Pitchford, 2015; Pitchford et
al., 2019). It does, however, pose some challenges for schools, as it involves small
groups of children leaving their class at any one time throughout the school day to
(a) A Learning Centre in
Malawi where the onebillion
software is delivered to small
groups of children facilitated
by a class teacher.
(b) Individualised learning
approach with the onebillion
software by a child in Malawi.
(c) Whole class implementation approach of
the onebillion software by a class teacher in
Malawi using a solar-powered projector.
Fig. 11.3 Illustration of different implementation approaches of the onebillion e-Learning platform in Malawian primary schools: (a) and (b) show the main implementation approach for
individualised learning within a learning centre, whereas (c) shows a whole class implementation
approach using a solar-powered projector facilitated by the class teacher
278
N. Pitchford
attend a session in the learning centre, which can be disruptive. In addition, with
large class sizes and short school days, it is often difficult to provide all children
with access to the learning centre on a regular basis.
To address these issues, VSO is currently exploring other implementation
methods, such as paired learning using headphone splitters, to increase regular usage
of the technology within primary schools. An alternative implementation approach,
which could have potential to reach all children within a targeted ability group,
involves connecting a tablet to a solar-powered projector which beams the onebillion
app content to a large screen (e.g. a white sheet) attached to the classroom wall (see
Fig. 11.3c). In this dynamic classroom environment, the teacher is able to guide
learning of the whole class simultaneously, actively engaging children with the
visual and audio content in the software. The teacher actively scaffolds learning
by navigating the digital content, moving around the class and selecting individual
children to complete in-app tasks, either by responding directly on the tablet or
by indicating their response on the large screen. Class teachers are equipped with
a rich source of high-quality learning materials and a large suite of interactive
activities that they can utilise to support their pedagogical practice. However, these
alternative approaches do not capitalise on the customised learning features that are
key to the original e-Learning platform and, to date, have not been subjected to
formal evaluation, so it is currently unknown if they will be effective at accelerating
learning.
3.3 Evaluation: Research Approach
Since 2013, a research team from the University of Nottingham has been evaluating
the effectiveness of the Unlocking Talent project at raising basic reading and
mathematics of primary school children in Malawi and other countries, including
the United Kingdom, Brazil, South Africa, Tanzania, Kenya and Ethiopia. Other
independent evaluations have also taken place by Imagine Worldwide in Malawi
and the Education Endowment Foundation in the United Kingdom.
This case study describes a staged and systematic approach to evaluating the
effectiveness of the Unlocking Talent project in different countries, as illustrated
in Fig. 11.4. This starts with piloting the technology within a particular context to
assess its feasibility at raising learning outcomes and then builds evidence across
increasingly large-scale randomised control trials (RCTs) which compare groups
of children either learning with the customised e-Learning platform (intervention
group) or learning through standard classroom instruction (control group). Performance of individual children is measured at baseline, prior to the delivery of the
intervention, then again at endline, after the intervention has ceased, and differences
in attainment over time are compared between groups. This measures the impact
of the intervention in terms of learning gains. In addition, process evaluations
are conducted to assess the fidelity of the intervention’s implementation against
intended use. A process evaluation involves conducting class observations with a
11 Customised E-Learning Platforms
Pilot
Small-scale study
(1 school)
assessing
feasibility of
intervention at
improving learning
Proof of Concept
Small-scale RCT
(2+ schools) to
establish if
intervention
significantly
improves learning
279
Efficacy
Medium-scale RCT
(10-50+ schools)
to see if
intervention effects
are maintained
with scaling
Effectiveness
Large scale RCT
(200+ schools) to
test significance of
final model of
intervention to be
scaled
Low
Strength of Evidence
High
High
Modification of Intervention
Low
Fig. 11.4 Staged and systematic research approach to evaluating the effectiveness of the customised e-Learning platform adopted by the Unlocking Talent project. A series of successfully
larger RCTs helps to de-risk the intervention, effectively creating ‘checkpoints’ as the project
scales
structured checklist, interviewing teachers and surveying school and district education managers on the drivers thought to influence the fidelity of the intervention.
Drivers of implementation fidelity in this context include child-level features (e.g.
engagement with task), class-level features (e.g. trained teaching staff, dedicated
space, calm environment), facilitator features (e.g. technical support, pedagogical
support, behaviour management) and school leadership features (e.g. support for
the intervention, provision of time within a daily regime to deliver the intervention).
This combination of quantitative and qualitative research methodologies provides
rich contextual information about the extent to which the intervention is effective
at accelerating learning and how modifications might improve its effectiveness. In
scaling the project, the strength of evidence accumulates, and the scope for modifying the intervention reduces, such that by the end of a large-scale effectiveness trial,
the final model of the intervention – one that will be scaled nationally – should be
identified.
Given the multisector approach to implementing a customised e-Learning platform within primary schools across Malawi, a holistic research approach is warranted that investigates different components of an integrated system that influences
educational attainment. Key components of this integrated system include the
technology (e.g. software and hardware), schools (e.g. teachers’ capacity and
capabilities, school leadership, availability of time within the school day, class
size), communities (e.g. parent and community attitudes and support towards the
introduction of technology in primary schools) and government commendation and
advocacy for the project, as well as what the child brings to the learning task
(e.g. prior ability in reading and mathematics, attendance at school, development
of associated cognitive and motor skills and any associated health issues that may
impact propensity to learn). All of these components have potential to influence how
well children engage, interact and learn with this technology-based intervention to
require investigation.
280
N. Pitchford
Developmental Psychology
THEORY
How does learning occur? Who benefits the most? What
prevents learning?
Mixed Methodology
RESEARCH
RCTs, case-control ability-matched designs, predictor studies,
questionnaires, focus groups, interviews, observations
ASSESSMENT
International comparators (EGMA, EGRA), core cognitive and
motor skills, teacher rating scale
COMPARISON
Low-income vs high-income countries, maths vs reading, low vs
high achievers
Standardized & Experimental Measures
Cross-Cultural, Cross-Domain, Cross-Ability
Summative & Integrative
EVIDENCE
Evolving evidence base combining systematic reviews with
empirical research to form a new theoretical framework
Fig. 11.5 Summary of the TRACE research framework for evaluating technology-based education
interventions
This holistic approach to evaluating the Unlocking Talent project is captured
in the Theory, Research, Assessment, Comparison, Evidence (TRACE) research
framework, summarised in Fig. 11.5. It is grounded within the theoretical framework of developmental psychology, especially theories of reading and mathematics
acquisition. It involves examining how children acquire these foundational skills
with the assistance of this customised e-Learning platform, establishing which children benefit from this intervention and identifying factors that prevent or facilitate
learning. The breadth of the research questions necessitates mixed-method research,
involving both quantitative and qualitative methodologies, including RCTs, casecontrol ability-matched designs, predictor studies, questionnaires, focus groups,
interviews and observations.
Reliable and valid assessment of children’s abilities is a critical aspect of this
research. Yet typically, assessment is inadequate in low-income countries, such as
Malawi, due to (1) a paucity of sensitive tools, normed for a particular country,
that can measure different aspects of child development and scholastic attainment;
(2) a scarcity of trained evaluators that speak the local language; and (3) the
poor quality of national- or school-level tests, which renders them unsuitable as
outcome variables. Governments and funders often require programmes to utilise
tests of attainment that allow for international comparisons to be made, such
as the Early Grade Reading Assessment (EGRA; USAID, 2010) and the Early
Grade Mathematics Assessment (EGMA; USAID, 2011), yet these are often crude
measures of attainment as they typically span a large age range. Measures of
core cognitive and motor skills that are associated with reading and mathematics
attainment, which are suitable for use in the early primary years, are sparse in
Malawi, to say the least.
11 Customised E-Learning Platforms
281
To address this lack of suitable measures, a digital assessment was developed by
the Nottingham research team that can be administered to groups of children, thus
increasing efficiency in the assessment process, and has been shown to be a reliable
and valid cross-cultural measure of core abilities (Pitchford & Outhwaite, 2016b).
Paucity of suitable measurement tools is particularly problematic when assessing
the extent of functionality in children with special educational needs and disabilities
across domains that may impact their ability to interact with digital technologies.
Again, to address this need, a teacher-rating scale was developed by the Nottingham
research team for measuring teacher perceptions of extent of difficulty in individual
children across five key areas of functioning: mobility, hearing, vision, language
and learning. This enabled a quantitative measure of extent of disability; this was
shown to be predictive of children’s progress in mathematics with the onebillion
app (Pitchford et al., 2018).
To gain a comprehensive understanding of the potential reach of the Unlocking Talent project, different comparisons must be conducted. For example, the
onebillion software covers content in reading and mathematics, so comparing
learning gains (i.e. difference in performance at baseline and endline on measures
of attainment) across these domains highlights weaknesses in the software at
supporting acquisition of particular skills. These can then be addressed by the
developers. Similarly, comparisons of learning gains between low-achieving and
high-achieving children at baseline indicate the scope of the software at supporting
learning for all children. In addition, profiling different groups of learners in terms of
their cognitive and motor skills can provide insight into why some children struggle
to learn whilst others excel at learning with this technology. This can inform whether
the intervention should be targeted towards particular groups of children.
Furthermore, comparisons of learning reading and mathematics with this technology across primary school children in low-income and high-income countries,
such as Malawi and the United Kingdom, enhance understanding of the universality
of this customised e-Learning platform, which is important when considering where
and how to scale to other countries.
Synthesising evidence from empirical research and systematic literature reviews
of other technology-based learning programmes produces an evolving evidence
base, which can be augmented over time. This generates new theoretical and
implementation frameworks on which informed practice and policy decisions can
be based.
3.4 Adaptation: Scaling Approach
Within Malawi, the scaling approach for the Unlocking Talent project currently
focuses on key areas of activity.
Teacher Training In preparation for scaling the Unlocking Talent project nationally across Malawi and fully embedding it within the primary education sector, VSO
282
N. Pitchford
is working alongside the MoEST to incorporate use of digital education technology
into the training courses delivered at government-owned teacher training colleges.
This builds capacity within the teaching profession to maintain effective use of
technology-based education interventions as they are introduced within primary
schools and supplements the in-service teacher training that VSO delivers as part
of their current implementation process.
Direct-to-Community Approaches To increase the reach of the Unlocking Talent
project to the many children in Malawi that do not attend primary schools, directto-community approaches are being piloted. To address the learning needs of
out-of-school children, onebillion has developed ‘onetab’ – a robust, solar-charged,
low-cost tablet pre-installed with their adaptive reading and mathematics software.
The onetab device has been designed to work in challenging environments, with a
protective bumper, bright screen, loudspeaker and strong solar-charging connector
to ensure it can stand up to daily use by children in the home. The adaptive learning
algorithm that onebillion has incorporated into their latest version of the software,
which is installed on the onetab device, enables a direct-to-community approach,
as children can access reading and mathematics instruction at an appropriate level
for their ability, independently of a class teacher. This innovative adaptation extends
the current implementation approach of the Unlocking Talent project within formal
education settings to non-formal education settings, such as out-of-school outreach
programmes and refugee camps in Malawi. It can also provide uninterrupted
education during unexpected school closures, for example, in response to global
pandemics such as COVID-19, as learning can continue to take place within the
home.
Implementation Toolkits As the Unlocking Talent project scales within Malawi
and to other countries, it is critical to maintain a high level of implementation
fidelity, to ensure that the customised e-Learning platform used in the project continues to be implemented as intended. A common consequence of scaling innovative
education initiatives is ‘pollution’ of implementation, as different organisations
take on delivery in other contexts and make alterations to the programme, which
can lead to dilution of previously observed intervention effects (Mihalic, 2009;
Samara & Clements, 2017). In an attempt to prevent wash-out and maintain high
implementation fidelity of the Unlocking Project as it scales, VSO, the University of
Nottingham and Imagine Worldwide have recently produced and published a series
of toolkits that provide guidance to organisations on designing, planning, launching
and monitoring an education technology-based project. The toolkits are designed for
non-governmental organisations (NGOs) and governments that are thinking about
designing and implementing tablet-based learning programmes. They are targeted
at programme directors, project managers, software developers, site leaders, staff
and facilitators, including teachers, parents and community leaders. The toolkits are
modular, so organisations can pick and choose sections depending on their needs.
To date, the toolkits have not been rigorously tested, but were designed to reinforce
fidelity across implementation contexts (see also Outhwaite et al., 2019).
11 Customised E-Learning Platforms
283
Localisation The Unlocking Talent alliance is also being scaled by introducing
this customised e-Learning platform to other countries that are in need of education
reform. Localising the software is an important step in this process, and onebillion
is responsible for this. For each new language they introduce, onebillion works
with universities, linguists, authors, book editors, teachers, parents, children and
pedagogy experts to ensure the software is localised appropriately to the needs of the
child. Further information on how onebillion localise their software is summarised
in Text Box 11.3.
Text Box 11.3: Process of Localising the Onebillion Software to Different
Languages
When introducing the onebillion software to different communities, it is
important to localise the software to ensure it meets the language needs
of children. The process adopted by onebillion to localise their software to
different languages involves the following:
1. Partners. onebillion works with partners to discuss when to localise their
software into target language(s). This is a complex task that needs to be
adopted comprehensively, so it is important that partners understand what
is involved.
2. Scoping. onebillion works with local linguistic experts to (i) build a
description of the culture and language, including phonetic structure and
high-frequency words; (ii) determine the order that letters should be introduced to the child in order to meet syllables and words as soon as possible;
(iii) identify, create and test any new learning units needed; (iv) check the
bank of words and images against the language and culture, working with
graphic artists, to ensure they further the child’s understanding; and (v)
creatively translate all stories, keeping them relevant and engaging for the
child.
3. Recording. onebillion works with voice-over actors who are native speakers in the new language area, to ensure a familiar accent for the child. They
record everything in-house to ensure their high standard is maintained –
this involves approximately 160 stories; 185,000 words; and 32,000 audio
files.
4. Sequencing. Course designers at onebillion sequence the course, combining existing curricula and their own experience and carefully selecting
a variety of activities for the child. This is an iterative process based
on feedback from children in the new context that the software is being
localised for.
5. Quality assurance. Onebillion fully test all 4000+ units, multiple times,
for functionality and language. This happens both in-house and with native
speakers, in the target countries. Only then is the course ready for the child
to start learning.
(continued)
284
N. Pitchford
Text Box 11.3 (continued)
6. Tools. The localisation process is supported by onebillion’s in-house
software and the structure of their software, which enable them to work
with experts all over the world and to tailor the course for each new
language.
Funding Model Scaling requires funding from a diverse portfolio of donors. The
funding approach is agile, with the Unlocking Talent alliance responding to opportunities as they arise, as well as being proactive in seeking funding from donors
operating in countries where the alliance wishes to expand. As VSO is committed
to evidence-based practice, evaluation research is cost into their implementation
proposals to donors. Dedicated funding is also available for global challenges
and education research from some organisations. For example, the Education
Endowment Foundation funded a large-scale efficacy trial of the onebillion software
with young children in the United Kingdom who were struggling to learn basic
mathematics.
4 Results/Lessons Learned
Evaluation Findings
Using a mixed-method approach, as outlined above, our research team has demonstrated that children and teachers enjoy using the customised e-Learning platform
with onebillion software adopted by the Unlocking Talent project and that this
technology significantly raises learning outcomes compared to standard classroom
practice (Pitchford, 2015). The randomised evaluation incorporated a placebo group
that used the handheld tablets in the learning centre to engage with a simple design
software that required similar drag and drop movements as the onebillion maths
software. This group did not show significantly enhanced learning in maths above
the level shown by the control group. As a result, the observed learning gains can be
attributed to the software’s implementation, rather than novelty effects arising from
interacting with a new technology (see Table 11.1).
Furthermore, the benefits of learning with this customised e-Learning platform
are sustained even as the programme scales (Pitchford et al., 2019). When learning
with the onebillion software, gains in ability have been shown to be consistent
over time, across different cohorts of children, between different countries, and
assessed by different groups of researchers. This demonstrates that consistent and
reliable learning gains can be achieved with this education technology regardless
of context. In general, this amounts to a 3+ month advantage for children learning
basic mathematics and a 4+ month advantage for children learning basic reading
with the onebillion software compared to standard classroom instruction (Education
11 Customised E-Learning Platforms
285
Table 11.1 From Pitchford (2015): group performance (mean (SD), min–max) at pretest and posttest and percentage gain for the tests of mathematical concepts (MC; maximum score 48) and maths
curriculum knowledge (CK; maximum score 50)
Assessment
Standard 1
MC pretest
MC post-test
% gain
CK pretest
CK post-test
% gain
Standard 2
MC pretest
MC post-test
% gain
CK pretest
CK post-test
% gain
Standard 3
MC pretest
MC post-test
% gain
CK pretest
CK post-test
% gain
Intervention group
(maths tablet)
n = 22
2.0 (1.7), 0–5
5.1 (4.6), 0–17
6.5
2.4 (2.7), 0–12
7.7 (6.3), 0–24
10.6
n = 38
8.6 (6.5), 0–20
14.6 (6.6), 0–24
12.5
6.4 (6.3), 0–24
20.7 (10.3), 0–37
28.6
n = 44
14.9 (5.7), 0–23
19.5 (5.2), 5–27
9.6
13.5 (9.3), 0–34
35.2 (7.0), 19–46
43.4
Placebo group
(non-maths tablet)
NA
3.4 (4.3), 0–13
4.5 (4.3), 0–13
2.3
2.7 (1.7), 0–6
5.9 (5.3), 0–20
6.4
n = 35
10.1 (5.7), 0–21
12.5 (7.3), 0–23
5.0
8.3 (8.1), 0–28
15.1 (8.5), 2–31
13.6
n = 44
15.4 (5.6), 0–22
19.3 (5.1), 4–26
8.1
14.8 (10.1), 1–37
24.9 (8.0), 3–36
20.2
Control group
(standard practice)
n = 20
n = 37
8.4 (6.3), 0–19
10.5 (6.5), 0–19
4.4
5.5 (5.3), 0–21
10.8 (7.4), 0–26
10.6
n = 43
14.9 (5.2), 0–22
18.6 (6.0), 0–26
7.7
11.0 (10.3), 0–33
23.4 (6.9), 7–36
24.8
Endowment Foundation, 2019; Imagine Worldwide, 2020; Outhwaite et al., 2020;
Pitchford et al., 2019).
Our research in Malawi, in particular, shows that after interacting with the
onebillion software on a daily basis at primary school for eight consecutive weeks,
additional benefits are observed: children’s attentional skills improved, enabling
them to concentrate better in class (Pitchford & Outhwaite, 2019). Importantly, as
shown in Table 11.2, girls learn just as well as boys with this technology, and when
implemented at the start of primary education, the Unlocking Talent intervention can
prevent gender-based attainment gaps in mathematics that typically emerge over the
first year of schooling in Malawi through standard classroom instruction (Pitchford
et al., 2019).
The ease of use and flexible structure of this customised e-Learning platform
make it suitable for all children, including those with special educational needs
and disabilities. We have shown that a group of children attending a special needs
unit attached to two Malawian state primary schools, who presented with a diverse
range of difficulties across the group, could interact and engage with the onebillion
software and made progress through the app, albeit at a slower pace than mainstream
286
N. Pitchford
Table 11.2 From Pitchford et al. (2019): learning gains (mean %) and effect sizes (Cohen’s d) for
boys and girls in mathematics (EGMA) and reading (EGRA) after intervention with the customised
onebillion e-Learning platform compared to standard practice. For mathematics, standard practice
promotes a gender advantage for boys over girls, whereas girls learn just as well as boys with the
technology-based intervention
Assessment
EGMA % gain M (SD)
Cohen’s d
EGRA % gain M (SD)
Cohen’s d
Intervention group
Boys
Girls
19.95 (15.11)
20.86 (16.14)
0.06
8.32 (15.74)
10.64 (15.11)
0.15
Control group
Boys
17.05 (16.12)
0.36
4.29 (7.73)
0.11
Girls
11.90 (12.61)
5.09 (7.33)
peers (Pitchford et al., 2018). However, extent of disability, as measured by teacher
ratings, correlated negatively with progress through the app, indicating that children
with profound difficulties struggled to learn with this technology. Our research
suggests that whilst customised e-Learning platforms might be suitable for some
children with mild-to-moderate special educational needs and disabilities, children
with profound difficulties require a different type of educational support.
Similar learning gains with this customised e-Learning platform have also been
shown in the United Kingdom, demonstrating this technology is equally effective
across countries differing vastly in income status and primary education provision
(Education Endowment Foundation, 2019; Outhwaite et al., 2017; Outhwaite et al.,
2018; Pitchford & Outhwaite, 2016a). Furthermore, our research in UK primary
schools has highlighted the importance of implementation in securing improved
learning outcomes for basic mathematics with the onebillion app (Outhwaite et al.,
2019). Qualitative research conducted through a process evaluation of using the
onebillion software showed that when schools established a consistent routine for
embedding the apps into their daily classroom schedule, children learnt more basic
mathematics than when schools varied the implementation routine. Results showed
that ‘established routine’ predicted 41% of the variance in children’s learning
outcomes with the apps. Established routine involved schools implementing the
intervention at a consistent time each day, having a dedicated member of staff
whose responsibility it was to implement the intervention, having well-organised
equipment (e.g. colour coding the tablet devices so that they were easily identifiable
by children) and having a dedicated space within the classroom and having a seating
plan where children used the onebillion apps. In another study, the effectiveness of
the onebillion software in supporting acquisition of basic mathematics by earlygrade children attending a bilingual immersion school in Brazil was evaluated, and
proficiency in language of instruction was shown to be positively associated with
progress through the apps (Outhwaite et al., 2020). These findings are important
as they show that factors related to the implementation of this intervention in
primary schools are critical for securing improved learning outcomes – seemingly,
the customised e-Learning platform and interactive apps alone are not the only
factors driving success.
11 Customised E-Learning Platforms
287
Overall, this emerging evidence base, built upon a robust scientific methodology
and psychological theories of reading and mathematics development, has generated
confidence that the Unlocking Talent project can be implemented successfully at
scale in Malawi. The solution significantly raises attainment of core foundational
skills, and it can address some of the structural inequalities that are inherent to the
country’s education system.
Challenges and benefits of working with partners.
Global challenges, such as providing quality education for all, require genuine
cooperation and collaboration from multiple sectors to enable policy-makers to
make informed decisions on the best available evidence. This is a difficult landscape
to navigate and one that a traditional academic career does not necessarily prepare
you for. Working with partners across a range of sectors has its challenges, but these
are often offset by the benefits it affords. External partners can bring insights into
the research design and process, based on their wealth of knowledge from working
on the ground. This adds value to the quality of the research and provides a direct
pathway to apply the research findings to people that matter.
When initiating global challenges research, it is useful to map who the partner
organisations are at the outset of the design process (e.g. Fig. 11.1) as this will be
critical to the sustained success of the project. Partnerships take time to build and
require constant nurturing to maintain engagement and foster trust. This is easier to
achieve when partners share a mutual goal and appreciation of the varying demands
that different organisations may have, which at times might clash with what you are
trying to achieve. If difficulties arise, it is best to focus on the overarching goal you
and your partners are trying to achieve and move towards a way of working that will
facilitate you reaching this.
Working in partnership with other sectors also requires a flexible and fast
way of operating which is not aligned to the academic year. This is especially
relevant to technology-based fields, where adaptations and innovations are rapid
and frequently precede the evidence base. There is often an urgency in addressing
global challenges. Yet, despite the time it takes to accrue a strong evidence base, we
need to know that what we are doing is going to be effective and of benefit to the
end users – without incurring harm. Forging ahead with adaptations and innovations
to a product that has preliminary evidence of being effective, before developing a
full understanding of factors that determine its effectiveness, can result in product
developers altering the components that make it a success.
In addition, the language used by different groups of partners can often hold
distinct meanings, so clarity of expression is key to successful communication.
An example is the term ‘significance’. When researchers use this term, they are
referring to statistical significance – the probability that a given result occurs by
chance – however, partners from other sectors frequently use this term to imply
importance. This can change the interpretation of research results when partners
are communicating research findings, so it is important to engender a mutual
understanding of shared terminology.
Addressing global challenges also requires large-scale investment. Academics
that are new to this field may underestimate the resources needed to be able to
288
N. Pitchford
conduct high-quality research at a level that will have global impact. It is also a
competitive field in which the funding structures supporting this work are often
short-lived, requiring a quick turnaround of activities, which does not promote longterm understanding of the impact the work can have. Funding opportunities that
are supported through the government can change rapidly in a volatile political
environment. This makes planning for long-term projects difficult. Whilst agile
funding streams can address global challenges as they happen, such as in response
to the COVID-19 pandemic, it can make it difficult to sustain funding for largescale projects that require long-term impact evaluations, such as the effectiveness of
technology-based education programmes on improving learning outcomes.
Despite the challenges of working in this field, the rewards can substantially outweigh the difficulties. Working collaboratively with the Unlocking Talent alliance
towards a shared goal and working with humility are what makes for long-term
sustainable change.
Implications for practice and policy. To support future work by practitioners,
education software developers and policy-makers, here, we provide several key
implications of the implementation and evaluations of the Unlocking Talent project
in Malawi and other countries.
Practitioners
• Schools should look for customised e-Learning platforms that are localised to the
language of instruction, are easy to use and have a flexible structure, as these are
accessible to learners of varying abilities, even children with special educational
needs and disabilities.
• For children with special educational needs and disabilities, teachers and parents
should assess the extent of disability before using interactive educational apps,
as this type of technology might not be suitable for children with profound
difficulties.
• When implementing customised e-Learning platforms within formal education
settings, teachers should maintain a well-established classroom routine to optimise effectiveness.
• School leadership should monitor implementation fidelity of customised eLearning platforms within classrooms on a regular basis, to ensure teachers are
using the technology as intended.
• Teachers and parents wishing to use interactive apps with their children should
consider children’s proficiency in the languages spoken within the software, as
children need to have a sufficient language proficiency to access curriculum
content and to respond to instruction given in educational apps. Look for apps
that have been carefully localised to the language of instruction.
Software Developers
• Software developers should consider accessibility of their apps for different
groups of children, especially those with special educational needs and disabilities, and build in adaptations to maximise accessibility for all learners.
• Software developers need to consider the role of children’s language development in their app design features and content and ensure that the language used
in their apps is appropriate for the age of the intended users.
11 Customised E-Learning Platforms
289
• Software developers should consider adapting their technology on the basis of
user feedback and research findings to increase uptake and improve quality of
their products.
• Building assessment features into software could facilitate monitoring of children’s progress by teachers and researchers. This might involve in-app assessment of skills to be taught in a learning activity prior to app-based instruction,
followed by an end-of-activity in-app quiz which requires children to apply
the knowledge learnt to new materials. Progress charts built into software can
display this graphically over time, providing information on the rate of learning
by individual children.
• Monitoring of time on task, number of correct and incorrect responses per
learning activity, sequence of responses per learning activity and time to complete
a learning activity can also be valuable information to teachers and researchers;
developers can consider how to build these metrics into their software. This
instrumentation can provide rich information as to how children are interacting
with the software content.
Policy-Makers
• Governments should consider introducing customised e-Learning platforms that
encompass features of universal design into their primary education sector, as this
technology has been shown to significantly raise learning outcomes compared to
standard classroom practice across a range of low-, medium-, and high-income
contexts.
• Governments considering introducing customised e-Learning platforms within
their education system should assess the country’s readiness to implement this
technology effectively, including scoping the infrastructure, teacher capacity and
capabilities and availability of time within the school day required to support
successful implementation.
• When introducing e-Learning platforms within an education system with the
view to scale, key partners (especially within government) need to be engaged
from the outset to ensure sustainability, cultural sensitivity and accountability.
Maintaining budget lines for e-Learning within the education budget will also
foster commitment to long-term sustainability.
• Interactive apps that have been shown to mitigate gender differences should be
implemented at the start of formal education to enable girls and boys to learn at
a similar rate before gender disparities become entrenched.
• Governments could consider introducing customised e-Learning platforms direct
to communities, to reach children who cannot attend school and to provide
continued education during unexpected periods of school closures, such as in
response to the COVID-19 pandemic.
• Governments, schools and parents should seek professional guidance in choosing
customised e-Learning platforms to improve children’s learning outcomes, to
ensure selected technologies are supported by a rigorous scientific evidence base
demonstrating effectiveness.
290
N. Pitchford
Discussion Questions
1. Within limited funds, which children should be prioritised to receive the customised e-Learning platform currently being used by the Unlocking Talent
project in Malawi? Provide a rationale for your answer.
2. How might the e-Learning platform currently used by the Unlocking Talent
project in Malawi be adapted to enable more children to access the technology
on a regular basis?
3. What adaptations could be made to e-Learning platforms to increase accessibility
and learning for children with special educational needs and disabilities?
4. Which factors might influence learning outcomes with customised e-Learning
platforms when implemented outside the school system, such as through directto-community approaches? How might these be addressed through policy,
practice or technological advances?
5. How might other educational technologies, such as radio or TV programmes, be
used in low-income contexts to provide high-quality education for children not
attending school? What features would need to be incorporated into these types
of technologies to maximise learning in non-formal education settings?
References
Barrett, A., Sayed, Y., Schweisfurth, M., & Tikly, L. (2015). Learning, pedagogy and the post2015 education and development agenda. International Journal of Educational Development,
40, 231–236.
Chimombo, J. (2009). Changing patterns of access to basic education in Malawi: A story of a
mixed bag? Comparative Education, 45(2), 297–312.
Condie, R., & Munro, B. (2007). The impact of ICT in schools – A landscape review. Retrieved 19
9 2013, from http://dera.ioe.ac.uk/1627/
Crawford, C., & Cribb, J. (2013). Reading and maths skills at age 10 and earnings in later life: A
brief analysis using the British Cohort Study. Centre for Analysis of Youth Transitions. 2013.
Report No. 3.
Dickerson, A., McIntosh, S., & Valente, C. (2015). Do the maths: An analysis of the gender gap in
mathematics in Africa. Economics of Education Review, 46, 1–22.
Education Endowment Foundation. (2019). onebillion: App-based maths learning.https://
educationendowmentfoundation.org.uk/projects-and-evaluation/projects/onebillion-appbased-maths-learning/
Essien, A. A., Chitera, N., & Planas, N. (2016). Language diversity in mathematics teacher
education: Challenges across three countries. In R. Barwell, P. Clarkson, A. Halai, M. Kazima,
J. N. Moschkovich, N. Planas, M. Phakeng, P. Valero, & M. Villavicencio Ubillús (Eds.),
Mathematics education and language diversity (pp. 103–119). Springer.
Geary, D. C. (2004). Mathematics and learning disabilities. Journal of Learning Disabilities, 37(1),
4–15. https://doi.org/10.1177/00222194040370010201
Grimaldi, P. J., & Karpicke, J. D. (2014). Guided retrieval practice of educational materials using
automated scoring. Journal of Educational Psychology, 106, 58–68.
Hirshleifer, S.R. (2017). Incentives for effort or outputs? A field experiment to improve student performance. Unpublished manuscript available at https://economics.ucr.edu/repec/ucr/wpaper/
201701.pdf
Hirsh-Pasek, K., Zosh, J. M., Golinkoff, R. M., Gray, J. H., Robb, M. B., & Kaufman, J. (2015).
Putting education in “educational” apps: Lessons from the science of learning. Psychological
Science, 16(1), 3–34.
11 Customised E-Learning Platforms
291
Hubber, P., Outhwaite, L. A., Chigeda, A., McGrath, S., Hodgen, J., & Pitchford, N. J. (2016).
Should touch screen tablets be used to improve educational outcomes in primary school
children in developing countries? Frontiers in Psychology, 7, 839.
Hungi, N., Makuwa, D., Ross, K., Saito, M., Dolata, S., van Cappelle, F., Paviot, L., & Vellien,
J. (2010). SACMEQ III project results: Pupil achievement levels in reading and mathematics.
Southern and Eastern Africa consortium for monitoring educational quality, working document,
number 1.
Imagine Worldwide. (2020). Tablet-based Learning for Foundational Literacy and Math: An 8month RCT in Malawi.https://www.imagineworldwide.org/resource/tablet-based-learning-forfoundational-literacy-and-math-an-8-month-rct-in-malawi-executive-su
Kilburn, K., Handa, S., Angeles, G., Mvula, P., & Tsoka, M. (2017). Short-term impacts of an
unconditional cash transfer program on child schooling: Experimental evidence from Malawi.
Economics of Education Review, 59, 63–80.
Kirschner, P. A., Sweller, J., & Clark, R. E. (2006). Why minimal guidance during instruction does
not work: An analysis of the failure of constructivist, discovery, problem-based, experiential,
and inquiry-based teaching. Educational Psychologist, 41(2), 75–86.
Kucirkova, N. (2014). iPads in early education: Separating assumptions and evidence. Frontiers in
Psychology, 5(715), 1e3.
Law, N., Pelgrum, W. J., & Plomp, T. (2008). Pedagogy and ICT use in schools around the world:
Findings from the IEA SITES 2006 study. CERC-Springer.
MacDonnell Chilemba, E. (2013). The right to primary education of children with disabilities in
Malawi: A diagnosis of the conceptual approach and implementation. The African Disability
Rights Yearbook, 1(1).
Marx, I., Hacker, T., Yu, X., Cortese, S., & Sonuga-Barke, E. (2018). ADHD and the choice of
small immediate over larger delayed rewards: A comparative meta-analysis of performance
on simple choice-delay and temporal discounting paradigms. Journal of Attention Disorders.
https://doi.org/10.1177/1087054718772138
Mihalic, S. (2009). Implementation fidelity. Unpublished manuscript available from http://
citeseerx.ist.psu.edu/viewdoc/download?doi=10.1.1.180.9133&rep=rep1&type=pdf
Milner, G., Mulera, D., Banda, T., Matale, E., & Chimombo, J. (2011). Trends in achievement
levels of grade 6 learners in Malawi. SACMEQ.
Mitra, S., Dangwal, R., Chatterjee, S., Jha, S., Bisht, R. S., & Kapur, P. (2005). Acquisition
of computing literacy on shared public computers: Children and the “hole in the wall”.
Australasian Journal of Educational Technology, 21, 407–426.
Outhwaite, L. A., Gulliford, A., & Pitchford, N. J. (2017). Closing the gap: Efficacy of a tablet
intervention to support the development of early mathematical skills in UK primary school
children. Computers and Education, 108, 43–58.
Outhwaite, L. A., Faulder, M., Gulliford, A., & Pitchford, N. J. (2018). Raising early achievement
in math with interactive apps: A randomized control trial. Journal of Educational Psychology.
https://doi.org/10.1037/edu0000286
Outhwaite, L. A., Gulliford, A., & Pitchford, N. J. (2019). A new methodological approach
for evaluating the impact of educational intervention implementation on learning outcomes. International Journal of Research and Method in Education. https://doi.org/10.1080/
1743727X.2019.1657081
Outhwaite, L. A., Gulliford, A., & Pitchford, N. J. (2020). Language counts when learning
mathematics with interactive apps. British Journal of Educational Technology. https://doi.org/
10.1111/bjet.12912
Pitchford, N. J. (2015). Development of early mathematical skills with a tablet intervention: A
randomized control trial in Malawi. Frontiers in Psychology, 6, 485.
Pitchford, N. J., & Outhwaite, L. (2016a). Apps teaching early maths skills. In N. Kucirkova &
G. Falloon (Eds.), Apps, technology and younger learners: International evidence for teaching.
Routledge Press.
Pitchford, N. J., & Outhwaite, L. A. (2016b). Can touch screen tablets be used to assess cognitive
and motor skills in early years primary school children? A cross-cultural study. Frontiers in
Psychology, 7, 1666.
292
N. Pitchford
Pitchford, N. J., & Outhwaite, L. A. (2019). Secondary benefits to attentional processing through
intervention with an interactive maths app. Frontiers in Psychology. https://doi.org/10.3389/
fpsyg.2019.02633
Pitchford, N. J., Kamchedzera, E., Hubber, P. J., & Chigeda, A. (2018). Interactive apps promote
learning in children with special educational needs. Frontiers in Psychology, 9, 262.
Pitchford, N. J., Chigeda, A., & Hubber, P. J. (2019). Interactive apps prevent gender discrepancies
in early grade mathematics in a low-income country in sub-Sahara Africa. Developmental
Science, 22, e12864. https://doi.org/10.1111/desc.12864
Rose, D. H., Meyer, A., & Hitchcock, C. (2005). The universally designed classroom: Accessible
curriculum and digital technologies. Harvard University Press.
Ruthven, K. (2009). Towards a naturalistic conceptualisation of technology integration in classroom practice: The example of school mathematics. Education & Didactique, 3(1), 131–152.
Samara, J., & Clements, D. H. (2017). Interventions in early mathematics: Avoiding pollution and
dilution. Advances in Child Development and Behavior, 53, 95–126.
Slavin, R. E., & Lake, C. (2008). Effective programs in elementary mathematics: A best-evidence
synthesis. Review of Educational Research, 78(3), 427–515.
Spaull, N. (2012). Malawi at a glance. SACMEQ at a glance series. Research on Socio-economic
Policy (RESEP). Available http://resep.sun.ac.za/index.php/projects/
The Center for Universal Design. (1997). The principles of universal design, version 2.0. North
Carolina State University.
UNESCO. (2017). More than More Than One-Half of Children and Adolescents Are Not Learning
Worldwide. Fact Sheet No. 46, September 2017 UIS/FS/2017/ED/46. UNESCO Institute for
Statistics.
UNESCO. (2018). Global education monitoring report 2019: Migration, displacement and
education – Building bridges, not walls. UNESCO.
UNESCO (2019). https://en.unesco.org/sites/default/files/the_world_is_off_track_in_reaching_the
_global_education_goal.pdf
UNESCO Institute for Statistics. (2016). Results of the 2016 UIS education survey. http://
uis.unesco.org/en/news/results-2016-uis-education-survey-now-available
UNESCO-IBE. (2010). World data on education report. Paris, France.
UNICEF Malawi. (2019). 2018/2019 education budget brief.
USAID. (2010). Malawi 2010 early grade reading assessment: National baseline report.
USAID. (2011). Malawi early grade mathematics assessment: National baseline report 2010.
Verner, D. (2005). What factors influence world literacy? Is Africa different? (Policy research
working paper no. 3496). World Bank. https://doi.org/10.1596/1813-9450-3496
World Bank. (2010). The education system in Malawi (World Bank working paper 182). World
Bank.
Yates, C. (2008). Keeping children in school: A review of open education policies in Lesotho and
Malawi (SOFIE opening up access series no. 5). Institute of Education, University of London.
Open Access This chapter is licensed under the terms of the Creative Commons Attribution 4.0
International License (http://creativecommons.org/licenses/by/4.0/), which permits use, sharing,
adaptation, distribution and reproduction in any medium or format, as long as you give appropriate
credit to the original author(s) and the source, provide a link to the Creative Commons license and
indicate if changes were made.
The images or other third party material in this chapter are included in the chapter’s Creative
Commons license, unless indicated otherwise in a credit line to the material. If material is not
included in the chapter’s Creative Commons license and your intended use is not permitted by
statutory regulation or exceeds the permitted use, you will need to obtain permission directly from
the copyright holder.
Chapter 12
Digital Networking and the Case of Youth
Unemployment in South Africa
Patrick Shaw and Laurel Wheeler
1 Development Challenge
In developing countries, the system of paid labor is characterized by a duality of
informal and formal jobs. Work in the formal sector is tied to employers that are
registered with the government and pay taxes. In contrast, work in the largely
unregulated informal sector often involves self-employment or employment with
family-owned enterprises. For example, small-scale street vendors, taxi drivers, and
freelancers are typically part of the informal economy. Although wages tend to be
higher and less volatile in the formal sector, the informal sector comprises 60% of
all nonagricultural employment in most countries in the Middle East, North Africa,
Latin America, Asia, and sub-Saharan Africa (ILO, 2018; Kingdon & Knight,
2001). Relative to other developing countries, South Africa has a large formal sector
and a high rate of unemployment (Statistics South Africa, 2019).1 This case study
examines the application of existing technology to mitigate barriers between young
South African workseekers and formal employment opportunities with governmentregistered enterprises.
1 According
to Statistics South Africa (2019), the informal sector comprises only 20% of total
nonagricultural employment in South Africa.
P. Shaw ()
Brown University, Providence, RI, USA
RTI International, Research Triangle Park, NC, USA
e-mail: patrick_shaw@brown.edu
L. Wheeler ()
Department of Economics, University of Alberta, Edmonton, AB, Canada
e-mail: lewheele@ualberta.ca
© The Author(s) 2023
T. Madon et al. (eds.), Introduction to Development Engineering,
https://doi.org/10.1007/978-3-030-86065-3_12
293
294
P. Shaw and L. Wheeler
In the first quarter of 2019, approximately 28% of South Africans were unemployed (Statistics SA, 2019). South Africa’s high aggregate unemployment is due
to a combination of factors, including spatial segregation between workers and
firms, labor regulations, a weak education system, racial discrimination due to the
legacy of apartheid, and restrictions on informal enterprises (Banerjee et al., 2008).
The spatial mismatch between where jobs are located and where workseekers live
increases the time and monetary cost of submitting applications in person. These
costs are high enough to impede the job search process of some workseekers (Kerr,
2017). Employment regulations in South Africa are unusually difficult to navigate,
making legal disputes in hiring commonplace (Magruder, 2010; Rankin & Roberts,
2011). As a result, employers are often reluctant to hire someone without referrals or
significant work experience. And South African schools assess student achievement
inaccurately and inconsistently, which limits employers’ ability to use educational
qualifications to differentiate between job candidates (Lam et al., 2011; Taylor et
al., 2011).
In this context, transitions into formal employment have been particularly
difficult for young workseekers. South Africa currently has one of the highest rates
of youth unemployment in the world, with more than 55% of South Africans aged
15–24 years not in employment, education, or training (Statistics SA, 2019). This is
twice the unemployment rate of adults aged 25–64 in the same time period. Figure
12.1 shows that the youth-adult unemployment gap has been high and relatively
stable for many years (Mosomi & Wittenberg, 2020). Furthermore, large numbers
of young people in South Africa – particularly young men – have stopped searching
Unemployment rate (%)
80
60
40
20
2001
2004
2007
2010
2013
Financial crisis
Female 15–24
Male 15–24
Total (15–65)
Female 25–65
Male 25–65
2016
Fig. 12.1 South African unemployment by age and gender
Note: This figure is reproduced from page 4 of Mosomi and Wittenberg (2020). Mosomi and
Wittenberg generated the figure using data from Post-Apartheid Labour Market Surveys (PALMS)
In the real world…
In the frictionless world…
12 Digital Networking and the Case of Youth Unemployment in South Africa
For work-seekers…
For employers…
Young people have no obstacles to education.
They receive the optimal level of education
based on their skills and their expectations
about future wages. Their educational
certifications accurately reflect their potential
productivity.
Employers widely advertise job openings,
reaching all work-seekers.
Work-seekers have full information about all job
openings.
Employers have full information on all workseekers, based on educational certificates,
resumes, and interviews.
Applying to jobs is costless.
Interviewing job candidates is costless.
Young people may have limited opportunities to
develop skills or experiences, either due to cost
or due to their age.
Employers may be more inclined to higher older
workseekers who have had more on-the-job work
experience or more educational opportunities.
In countries like South Africa, oftentimes
educational certifications are weak signals of
ability.
Employers may not perceive certifications to be
valuable information about worker productivity,
making them rely more heavily on other means
of getting information about workseekers.
Due to their age and relative lack of work
experience, young people tend to have smaller
professional networks, meaning that they have
less information about job openings and their fit
for different types of jobs.
When prospective employers lack credible
information about worker productivity, they often
rely on referrals based on professional networks,
disadvantaging young workseekers.
295
What is the result?
Employers hire the most qualified workseekers
out of the pool of prospective workseekers.
Unemployment duration is short and retention is
high.
Employers are more likely to hire older
workseekers than younger workseekers with the
same skills and qualifications. Unemployment
durations for young workseekers may be high
and match quality may be low.
Fig. 12.2 Youth employment frictions
for work altogether, likely due to discouragement resulting from persistent high
unemployment.
Although youth unemployment is particularly stark in South Africa, young
people in many parts of the world contend with high rates of unemployment,
underemployment, and unstable employment (ILO, 2017). More than 70 million
people between the ages of 15 and 24 are unemployed worldwide, representing a
youth unemployment rate three times the adult unemployment rate (ILO, 2017).
Young workseekers tend to have less formal education and on-the-job training than
adults, which could suggest to prospective employers that they are less qualified.
Youth with limited prior work experience may also be disadvantaged by their lack
of references from past employers and the small size of their professional networks.
As outlined in Fig. 12.2, these “frictions” that interfere with the hiring process
could explain the disproportionately negative employment and earnings outcomes
of young people.
Past research has established that pervasive youth unemployment has wideranging and long-lasting implications for out-of-work young people and for the
countries where they live. Long unemployment spells in youth increase the probability of unemployment into adulthood and may have lasting effects on a range
of other schooling and economic outcomes (Schmillen & Umkehrer, 2017; Mroz
& Savage, 2006; Bell & Blanchflower, 2011). Research out of Europe suggests
that, in the absence of early policy interventions, even short periods of high youth
unemployment may become a regular feature of a country’s economy (Caporale &
Gil-Alana, 2014). Entrenched youth unemployment is associated with economic
296
P. Shaw and L. Wheeler
instability, crime, and political unrest in many countries (Fougere et al., 2009;
Okafor, 2011; Ajaegbu, 2012).
This case study describes how researchers adapted an existing technology
to target the disconnect between young workseekers and employers in South
Africa. While young people in South Africa experience particularly high rates of
unemployment, they also demonstrate relatively high levels of digital proficiency
(Pew Research Center, 2018), suggesting they may constitute a demographic likely
to benefit from technological solutions to formal sector employment challenges.
Researchers taught groups of young workseekers to use the world’s largest online
professional networking platform, LinkedIn. In principle, there are many reasons
why an online networking tool such as LinkedIn could increase employment
in South Africa. The South African workforce ranks among the highest and
most diversified digital skills of any developing country, and digital proficiency
continues to improve with Internet infrastructure improvements (Choi et al., 2020).
Workseekers can use the online platform to acquire information about job openings,
to apply for jobs, or to elicit referrals from other users. At the same time, employers
can use the platform to acquire information about applicants or to post job openings.
Results of the evaluation suggest that training young workseekers to use LinkedIn
speeds up their transition into formal employment.
Addressing the youth unemployment crisis is imperative to South Africa’s
continued development as an economic leader in sub-Saharan Africa. Today, the
nonprofit, private, and public sectors in South Africa each play a role in the removal
of barriers to youth employment. The public sector has led the way, devoting myriad
resources to aiding workers and employers in the job search process. Shortly after
becoming a democracy in 1994, the Government of South Africa developed a
multipronged strategy for improving young workseekers’ access to jobs, focusing on
improving formal education and expanding vocational training opportunities, creating public employment programs, and funding job placement programs. Especially
since the mid-2000s, skills and training programs have proliferated in a variety of
forms throughout the country. One of the most high-profile initiatives targeted at
employers is the Employment Tax Initiative (ETI), a wage subsidy launched by the
South African government in 2014 that effectively reduces the cost of hiring young
South African workseekers. Despite evidence that many of these interventions have
had some success (e.g., Ebrahim et al., 2017), levels of youth unemployment remain
high, which has spurred the growth of private and nonprofit solutions. This case
study suggests an important role for software development in tackling the challenge
of youth unemployment.
2 Project Formation
This case study details how an international team of researchers from Duke
University and RTI International, in partnership with a local nonprofit organization
and a leading professional networking service, set out to tackle the problem of youth
unemployment in South Africa. Between 2015 and 2019, the project team adapted
12 Digital Networking and the Case of Youth Unemployment in South Africa
297
an existing technological solution to job search barriers, introduced the innovation
to young South African workseekers, and conducted an evaluation to assess the
effectiveness of the innovation. Specifically, the team studied whether the online
digital professional networking platform, LinkedIn, could be used to improve the
employment outcomes of young, economically disadvantaged workseekers in South
Africa. The evaluation was a randomized control trial (RCT) that randomly assigned
some job training cohorts to receive training on LinkedIn platform use. Wheeler
et al. (2019) detail the results of the evaluation.2 This section of the case study
describes how the research team devised the study with several practical factors in
mind, including the existence of a reliable implementation partner and high levels
of digital connectivity in the South African population.
2.1 Tailoring a Solution to the Local Context
LinkedIn is a social media site built to facilitate professional networking and
development. Users of the site create public profiles containing information
about their skills, qualifications, and employment experience. Profiles may also
include endorsements written by former supervisors or colleagues. Workseekers
and prospective employers engage with LinkedIn in several ways that may help
connect workseekers to jobs. To name a few, workseekers can use LinkedIn to learn
about job openings, to form virtual professional networks by adding other users as
connections, and to submit job applications costlessly online. Employers can use
LinkedIn to advertise job openings and to screen applicants based on information
contained in their LinkedIn profiles. Survey data suggest that both workers and
firms commonly use LinkedIn to find jobs (Collmus et al., 2016). Hiring managers
reportedly use LinkedIn at both the recruitment stage and the interview stage to
fill in information gaps about workseekers (Caers & Castelyns, 2010; Roulin &
Levashina, 2018). Other types of digital networking have been proven effective in
connecting local employers, mostly in high-income contexts, to nonlocal contract
workers, mostly in low-income contexts (Agrawal et al., 2015). But research into
the effectiveness of digital technologies as employment solutions remains thin. The
study conducted by the research team is the first to experimentally evaluate the
employment effects of training workseekers to join and use an online professional
networking platform.
More than 75% of LinkedIn users come from outside the United States, including
more than 7 million users based in South Africa (LinkedIn, 2020). South Africa
is LinkedIn’s largest market in Africa. But only approximately 20% of LinkedIn
users in South Africa are between 18 and 24, reportedly due to the perception that
2 Since the time of writing, the paper has been published in the American Economic Journal:
Applied Economics. It can be located using the following citation: Wheeler et al. (2022).
LinkedIn(to) Job Opportunities: Experimental Evidence from Job Readiness Training. American
Economic Journal: Applied Economics, 14(2), 101–25.
298
P. Shaw and L. Wheeler
professional networking platforms are geared toward workers with more experience
(Barbarasa et al., 2017). The underrepresentation of the South African youth population on the platform may represent an opportunity for growth. Once they sign up to
join LinkedIn, young people in low- and middle-income countries like South Africa
engage with the platform more actively and add connections faster than their older
counterparts. LinkedIn is widely used by South African firms as well.3 Although
LinkedIn may be particularly relevant for high-skilled positions in the labor market,
firms in South Africa also actively use LinkedIn to recruit workseekers for the types
of entry-level positions that most economically disadvantaged youth would occupy.
Approximately 50% of positions advertised in South Africa are entry level.
Relative to other developing countries – especially other countries in sub-Saharan
Africa – digital connectivity in South Africa is high. More than 50% of South
Africans own a mobile device that can connect to the Internet and applications,
and nearly 60% of the population is able to access the Internet by any means (Pew
Research Center, 2018). Smartphone ownership among South Africans aged 18–
29 is at least ten percentage points higher than the overall mean in South Africa.
With the caveat that Internet access is not uniform across the entire South African
youth population (Oyedemi, 2015), these statistics suggest that there may be scope
to expand the use of digital professional networking platforms like LinkedIn within
the population of unemployed South African youths.4 At baseline, 89% of the
participants in this case study reported having an account on at least one of the
following social media platforms: Facebook, Twitter, LinkedIn, or Mxit.
2.2 Identifying a Local Partner
The Harambee Youth Employment Accelerator (Harambee) is perhaps one of the
most well-known nonprofit organizations focused on helping young people find jobs
in South Africa. Harambee provides job training and matching services to thousands
of economically disadvantaged young workseekers in South Africa every year,
and their organization continues to grow. As of 2018, they also operate in Kigali,
Rwanda. Harambee offers several different training programs ranging in duration
from 3 days to 8 weeks. The programs are designed to help workseekers acquire
the skills needed to be successful in jobs in financial services, sales, logistics,
and operations. At the end of some of the training programs for high performers,
3 There were more than 250,000 active job postings on the LinkedIn platform at the end of the
intervention.
4 A study of students at a South African university found that students were online for 16 hours
of the day (Uys et al., 2012). Only a small minority of the participants in the case study have
a college degree, suggesting that the samples are not entirely comparable. Income inequality is
one factor that seems to determine inequality in Internet access. Individuals living in rural South
African communities may be significantly less likely to have and use a smartphone than those in
urban areas (Dalvit et al., 2014).
12 Digital Networking and the Case of Youth Unemployment in South Africa
299
Harambee also arranges interviews between workseekers and prospective employers
belonging to the network of firms Harambee has built over the years.5 In its
first 9 years of operation, more than 700,000 workseekers completed Harambee’s
training programs, materializing into more than 160,000 jobs and work experiences
with more than 500 employers.
Harambee admits workseekers aged 18–29 from low-income households with little to no work experience. Only a small minority possesses more than a high school
education. The research team identified LinkedIn as a possible tool to overcome the
specific set of constraints facing the workseekers participating in Harambee’s job
training programs. For many of the reasons listed in the introduction, traditional job
search strategies are often unsuccessful for this sample of workseekers. The young
people eligible for Harambee’s services tend to be those who lack professional
referrals, know relatively little about specific job vacancies, and struggle to afford
job application costs and fees. Harambee job training participants belong to a
demographic that may be particularly likely to see returns to nontraditional job
search strategies. Among the top 20 firms with a history of interviewing and hiring
Harambee workseekers, at least 12 had active job postings on LinkedIn for positions
that require only high school education at the time of the intervention. Firms using
LinkedIn to recruit for entry-level positions report high demand for many of the
skills Harambee seeks to hone during their training programs, including sales,
marketing, and soft skills (Barbarasa et al., 2017).
Participants in the research study included 1,638 Harambee “candidates”
enrolled in 30 of Harambee’s “bridging programs” across South Africa. The
research team was able to involve Harambee candidates in the study due to a longstanding partnership between Harambee and several of the scholars on the research
team. Investments in relationships with implementation partners or government
agencies are often important inputs into the research process. In this case, the
success of the research project hinged on the opportunity to partner with Harambee.
The research team capitalized on Harambee’s job readiness training model as well
as on their experience with research.
Harambee attributes its success in large part to its reliance on research. The
organization administers a series of longitudinal surveys to the workseekers who
go through their training program, both at the start of the program, when the
trainees are “candidates,” and years after the completion of the program, when
they are “graduates.” With a data store of millions of psychometric and nonpsychometric assessments as well as longer-term employment outcomes, Harambee
draws on rich analytics to make adjustments to their training programs over time.
In addition, Harambee has a history of partnering with researchers from academic
institutions to evaluate the efficacy of various employment interventions. Due to
5 Although workseekers eligible for Harambee’s services tend to face less promising job prospects
than the average South African workseeker, the individuals invited to join the “bridging programs”
are those receiving the highest scores on the cognitive, communication, and numeracy assessments
administered by Harambee.
300
P. Shaw and L. Wheeler
past involvement in large-scale randomized experiments, Harambee possesses a
great deal of institutional knowledge about how to conduct rigorous experimental
research. With Harambee as a partner, the intervention would be led on the ground
by those with an understanding of important elements of the research design. For
instance, Harambee training managers understood the need to keep control and
treatment cohorts uninformed of their treatment status, also known as blinding, to
mitigate bias that may result from participants behaving differently or reporting their
outcomes differently based on knowledge of being treated.
Perspectives on the Researcher-Implementation Partner Relationship
Patrick Shaw and Laurel Wheeler: “Developing a good relationship with
implementation partners is essential. Without the perspective and experience
of researchers in the project space, the study is limited to second-hand expertise. Edwin Lehoahoa, a Harambee manager in public/private partnerships and
burgeoning South African researcher, was particularly integral to the success
of the research project. Edwin helped lead the implementation of the study and
provided invaluable insights at several stages of the project. Case in point, we
consulted with Edwin on a weekly basis during the writing process for this
case study.”
Edwin Lehoahoa: “Our journey towards making professional social networks more widely accessible and engaging depends on not only our ability to
design them to attract the younger generation but our ability to break the data
cost barrier. Being an organization that is demand-led, when Harambee was
afforded the opportunity to learn about the linkages that platforms in general
can create between workseekers and opportunity holders, we were thrilled.
Especially the idea of learning how LinkedIn, a platform traditionally used
as a networking platform by professionals and highly experienced individuals
can be evolved in order to attract and link more marginalised entry level work
seekers with opportunities that are less formal and require lower experience
and qualification levels. Data is our biggest asset at Harambee and this study
afforded us the ability to use some of the outcomes to shape our journey
towards becoming a platform organization that promotes inclusion and drives
social change at scale.”
Best practices for conducting research in developing countries point to the
importance of relying on the knowledge and experience of local implementation partners. The most productive relationships are built on the foundation of
mutual respect for the other party’s expertise.
To select the sample for the study, the research team relied on Harambee’s
existing process of recruiting and vetting workseekers. Harambee provided their
administrative data on workseeker characteristics, including the data from cognitive
and noncognitive assessments administered during the onboarding process. After
sample recruitment, Harambee’s 6- to 8-week job training programs for high-
12 Digital Networking and the Case of Youth Unemployment in South Africa
301
performing workseekers, known within the organization as “bridging programs,”
constituted the perfect environment within which to randomly introduce a curriculum based on LinkedIn.
For the most part, the incentives of the research team aligned with the incentives
of the organization. From Harambee’s perspective, the intervention would be low
cost and potentially high reward. Time spent on the intervention would displace only
4 hours of the standard 6- to 8-week job training programs. Recruitment, screening,
and other activities off of which the research study piggybacked were already taking
place, thereby representing zero additional cost. The organization’s familiarity with
research and randomized experimentation also minimized the cost of educating the
job readiness trainers responsible for implementation. At the same time, Harambee
was invested in learning the outcome of the research. As an organization devoted
to understanding the youth unemployment crisis in South Africa, the results of the
research could be invaluable in terms of the design of future training programs or in
terms of advocacy work between Harambee and the government and private sectors.
2.3 Defining and Refining the Problem Boundary
The research team cemented their interest in studying digital networking technologies as solutions to youth unemployment when they answered a call for proposals
issued by LinkedIn’s social impact sector. Before finalizing the research design,
however, researchers iterated through multiple sets of research questions in the early
phases of the project. The original proposal focused on the power of networking
technology to elevate workseeker expectations and aspirations. The underlying theory was that young workseekers may hold inaccurate and pessimistic beliefs about
their interconnectedness to prospective employers and other workers. The research
team hypothesized that providing young workseekers with a visual mapping of their
professional connections would improve their employment outcomes.
Ultimately, the set of research questions addressed by the intervention did not
include questions related to data visualization. In practice, the research evolved
largely with the team’s understanding of data availability. For reasons discussed
in subsequent sections, LinkedIn did not provide the research team with access
to all the data collected and maintained by their organization. While LinkedIn
shared coarse measures of user network size, they did not share detailed data
on the connections themselves. For example, the provided data would indicate
that workseeker A had N LinkedIn connections 6 months after the Harambee
training program, but not that workseeker A connected to workseeker B on date
T. The lack of granularity in the networks data forced researchers to redefine the
problem boundary. In addition to information about the number and type of network
connections, LinkedIn shared data on account opening, profile completion, and
search activity such as how often participants used LinkedIn to view and apply
for jobs. These measures enabled the research team to assess whether introducing
302
P. Shaw and L. Wheeler
young workseekers to LinkedIn increases the probability of opening an account (the
extensive margin) and increases account usage (the intensive margin).
Data limitations also precluded researchers from conducting an in-depth exploration into the ways in which employers engage with LinkedIn in hiring. Job search
is a two-way street. Just as workseekers may use the platform to collect information
about job openings and prospective employers, employers may use the platform to
collect information about job candidates. LinkedIn provided data on the number
of times a study participant’s LinkedIn profile was viewed in the final month of
the Harambee training program; however, LinkedIn did not provide detailed data
linking employer views to candidate profiles. To help contextualize and interpret
the results of the evaluation and to fill in the gaps created by data availability,
the research team administered a short end-of-evaluation survey to hiring managers
affiliated with employers that regularly partner with Harambee.6
The final problem boundary was also shaped by the backgrounds and incentives of the research team, made up of a combination of economists, education
researchers, and data scientists. The consensus view was that the research design
should allow for measurement of LinkedIn usage as well as short- and long-run
employment outcomes. But the mix of researchers generated interest in a variety of
causal mechanisms, ranging from economic channels (e.g., screening and signaling)
to behavioral channels (e.g., aspirations and educational engagement). In other
words, researchers were interested not only in evaluating whether the intervention
improved employment outcomes but also in understanding why. As part of the
brainstorming stage of the research design, the team sketched a simple theory
of change graphic outlining some of the hypothesized channels through which
LinkedIn could affect employment outcomes. That sketch, which is reproduced
in Fig. 12.3, guided the research design by helping researchers identify a set of
measurable outcomes that may be related to LinkedIn use.
The original theory of change groups mechanisms into five categories: labor
market information, networks, signaling/screening, psychosocial change, and educational change. In terms of the labor market information channel, LinkedIn
could provide workseekers with information about job vacancies. It could also act as
a centralized database of industries and employers, improving workseekers’ understanding of how their particular skills and qualifications match up to opportunities.
Establishing or expanding a professional network allows workseekers to connect
with individuals in the workforce who may have information about available job
opportunities. Professional networks may also prove to be important sources of
referrals. LinkedIn could provide workseekers with improved technology to signal
their ability to prospective employers who would then use this information to
screen prospective hires. Traditional signals may be particularly weak for young
people with limited work experience and educational attainment. Finally, LinkedIn
6 The survey elicited responses from the human resources staff at three large firms that jointly
employ 20% of the study participants. None of the hiring managers reported using LinkedIn in
hiring.
12 Digital Networking and the Case of Youth Unemployment in South Africa
Young South
African
Workseekers are
Trained to use
LinkedIn
Labor Market Information:
Psycho-Social Change:
-Knowledge about job
vacancies
-Knowledge about required
skills
-Expectations
-Aspirations
Networks:
303
Career Outcomes:
Employment,
Retention,
Promotion, Job
Satisfaction
-Professional networks
-Online referrals
Educational Change:
Signaling/Screening:
-Investment in training
program
-Profiles indicate
skills/qualifications
Fig. 12.3 Original theory of change
use signaling may be responsible for different types of behavioral change, including educational investment and psychosocial change. In terms of educational
investment, LinkedIn usage could either increase workseeker enthusiasm for the
job readiness training program and increase their effort or lead to discouragement
and decrease effort. In terms of self-beliefs, LinkedIn may alter a workseeker’s
perception of his/her fit for certain jobs through exposure to role models, among
other things. Through these mechanisms, LinkedIn may ultimately impact both the
propensity to be employed and the quality of the match between the young person
and a particular job.
At the start of the study, the research team was broadly interested in how
workseekers and employers alike could utilize digital networking to overcome
frictions in the job search process. The initial belief was that digital networking
presents young workseekers with an opportunity to gain job search skills and
learn about suitable job opportunities; it presents prospective employers with an
opportunity to search online for suitable workers. By the time the research design
was finalized, the focus had narrowed to a set of testable hypotheses shaped by the
local context, the partnerships with Harambee and LinkedIn, data availability, and
the composition of the research team.
3 Innovate, Implement, Iterate, Evaluate, and Adapt
3.1 Innovation
The act of finding a job has evolved vastly with the rise of technology. Throughout
the mid-to-late twentieth century, the standard job search strategy involved handing
out resumes in person or placing or answering print job ads. Respondents to the
1967 Current Population Survey (CPS) administered in the United States could
304
P. Shaw and L. Wheeler
select from five job search categories: checking with a public employment agency,
checking with a private employment agency, checking with an employer directly,
checking with friends or relatives, or placing or answering ads. In the early 1990s,
“checking with the employer directly” was the modal search strategy, and “checking
with private employment agencies” was the most successful (Bortnick & Ports,
1992).
As Internet access expanded, listings about open positions previously posted
in the classified sections of local newspapers began to move online (e.g., CareerBuilder.com, Monster.com). This worked both ways, as workseekers were increasingly able to post resumes and have employers do the searching. By 1998, 15% of
workseekers in the United States were using the Internet to search for jobs (Kuhn &
Skuterud, 2000). As the online market became flooded with resumes, referrals and
professional networking became increasingly important.7 LinkedIn was founded
in 2002 as a platform that could simultaneously provide information about job
openings, serve as a form of professional credentialing, and expand job search
networks. Since then, demand for online platforms such as LinkedIn has continued
to grow with the proliferation of smartphone usage.
LinkedIn has become a staple in many parts of the world, particularly in
Organisation for Economic Co-operation and Development (OECD) countries. But
LinkedIn tends to have lower visibility among workseekers and employers searching
within developing countries. In some regions of the developing world, more
localized platforms serve a function similar to LinkedIn. For example, Rozee.pk
provides digital professional networking services in Pakistan (https://www.rozee.
pk/), Babajob in India (http://www.babajob.com/), Silatech in the Middle East and
North Africa (https://silatech.org/), and Shortlist in Africa and India (https://www.
shortlist.net/). LinkedIn therefore exists within an ecosystem of online networking
platforms that cropped up in response to the evolution of job search strategies.
This research project involved three innovations based on the existing LinkedIn
technology. First, promoting the use of LinkedIn within the South African market
is an innovation in application. Survey evidence from OECD countries shows that
workseekers use LinkedIn to learn about prospective employers (Sharone, 2017).
In addition, firms in OECD countries report that they collect information about job
applicants from online media (Stamper, 2010; Shepherd, 2013; Kluemper et al.,
2016). But there existed little research into how workseekers and firms use LinkedIn
in the South African context.
Second, the research team collaborated with LinkedIn and Harambee to develop
a curriculum that would provide real access to this technology – not just getting
users online and connected, but training them on how digital networking could
help them gain employment. After co-developing the curriculum with a member
of the Harambee staff, the team disseminated the LinkedIn training curriculum
7 Although Internet job search may not have been the most effective tool when it was first
introduced (Kuhn & Skuterud, 2004), later research suggests that it has since contributed to
reducing workseekers’ unemployment durations (Kuhn & Mansour, 2011).
12 Digital Networking and the Case of Youth Unemployment in South Africa
305
to Harambee job readiness trainers and taught them how to properly implement
the LinkedIn training. The curriculum entailed a 1-hour presentation in the first
week of the job training program plus additional coaching and discussion sessions
in later weeks that covered building successful profiles, joining networks for
targeted occupations, and on-platform searching for openings and companies. The
curriculum is available in the paper’s supplementary materials from the American
Economic Journal: Applied Economics.8 An example of the curriculum appears in
the appendix.
The third innovation was to encourage the use of LinkedIn within an existing
local learning environment. The rationale was that introducing the technology
within an active job readiness training program with proven success would not
only serve to augment digital literacy but also ensure sustainability. Other features
contributing to sustainability of the technology include the stability of LinkedIn and
the low cost of the intervention.9
3.2 Design and Implementation
Before introducing the LinkedIn training curriculum to Harambee workseekers,
the research team spent approximately one year designing the intervention. As
depicted in Fig. 12.4, this was the first phase of many that would take place between
2015 and 2019. The evaluation was designed as a randomized control trial, relying
on randomized treatment assignment to expose the causal relationship between
LinkedIn and employment outcomes.
Researchers exploited much of Harambee’s preexisting infrastructure to streamline sample selection. As part of their regular process, Harambee recruits and
screens workseekers and administers cognitive and noncognitive assessments during
onboarding. These activities provided the sampling frame and data on population
characteristics. Prior to randomization, the research team conducted a series of
power calculations to determine how many workseekers would need to be included
in the experiment. Using information about the average size of Harambee’s job
readiness training programs, as well as other information about design features and
parameter estimates from South African survey data, researchers decided to include
30 training cohorts in the study. To illustrate this process, a power calculation
exercise appears at the end of this chapter. Next, researchers conducted pairwise
randomization of Harambee’s next 30 job readiness training cohorts across its South
Africa locations, effectively creating matched treatment-control pairs by location.
All of these design decisions were logged and registered in the American Economic
Association’s Randomized Control Trial (RCT) Registry before implementation.
8 https://doi.org/10.1257/app.20200025
9 Cost-benefit
calculations are given by the exercise at the end of the chapter.
306
P. Shaw and L. Wheeler
Research Design
Sample selecon
Randomizaon
Pilot
Implementation
Baseline survey
Endline survey
Analysis
Follow-up #1
Follow-up #2
Fig. 12.4 Project phases
In the second phase of the project, the research team gathered in South Africa
to run a pilot study of the feasibility of the research design. As part of the pilot
activities, the team devoted substantial time to writing and revising the survey
instruments. Focus group interviews with Harambee job readiness training program
participants helped refine survey questions and tailor the LinkedIn training curriculum to the sample population. Another outcome of the pilot was the development
of a short informational session directed at job readiness trainers to improve their
understanding about the experimental nature of the intervention.
Approximately one month after the pilot study, the main intervention kicked off
with the start of a job readiness training cohort in Johannesburg assigned to the
control group. Two days later, the second study cohort began their training in Cape
Town. Scaling up from the pilot study was relatively seamless, in large part thanks
to Harambee. Researchers positioned the intervention directly within Harambee’s
existing training programs and used a portion of the job readiness training time
to administer both the LinkedIn training and the baseline and endline surveys.
All Harambee training centers provide workseekers with access to computers that
they otherwise may not have. Without free Internet access, some workseekers
may have been unwilling or unable to sign up for and use LinkedIn. In addition,
administering the surveys during the Harambee training program ensured high
response rates without the need to offer cash incentives for completing surveys. This
costless survey administration is in contrast to the 6-month and 12-month follow-up
surveys, which were costly in terms of hiring the third-party professional survey
firm as well as in terms of the airtime incentives provided to study participants to
increase response rates.
Because Duke and RTI researchers were based in different parts of the world,
Harambee played an important role in overseeing the day-to-day execution of
the intervention. Harambee’s job readiness trainers administered the LinkedIn
treatment. Each cohort was led by one job readiness trainer responsible for
12 Digital Networking and the Case of Youth Unemployment in South Africa
307
overseeing the entirety of the training for the 6–8-week program. Although some
training cohorts included in the study did overlap temporally and geographically,
participants of different training cohorts were kept largely separate, minimizing the
opportunity for treatment spillovers. Trainers were familiarized with the LinkedIn
training curriculum prior to the start of the intervention, but they were not notified of
their cohort’s treatment status until the first day of each program. Study participants
would never be made aware of their treatment status, and the only difference
between control and treatment training programs would be the addition of the
LinkedIn training curriculum in the treatment cohorts.
Between 2016 and 2018, while control and treatment training programs took
place across Johannesburg, Pretoria, Cape Town, and Durban, the research team
focused their energy on data collection, cleaning, and storage. The last training
program included in the study concluded in early 2018, but data collection efforts
did not conclude until one year later. The impact evaluation ultimately consisted
of a sample of 1,638 workseekers from 30 different training programs across four
South African locations. The project produced a longitudinal dataset that followed
workseekers from the start of their training at Harambee to 12 months after the
completion of their training program.
3.3 Implementation Challenges and Iterations
The partnership with Harambee enhanced implementation efficiency. Nonetheless,
the intervention was not spared the occasional implementation challenge. The
challenges can be grouped into three broad categories: treatment administration,
survey administration, and general data collection and cleaning.
(a) Treatment Administration
The intervention experienced several unanticipated lengthy delays between training programs. Harambee’s job readiness training programs included in the study
had scheduled start dates ranging from May of 2016 to November of 2017. Many
of these programs overlapped with holiday seasons, which impacted enrollment and
survey response rates. At times, four different programs would start in a 3-week
span, and then no program would start for months at a time. Toward the end of
the study, the programs were delayed significantly due to lack of enrollment. The
research team expected to complete the intervention by mid-2017 but in reality did
not finish until early 2018.10
In addition, a few technological glitches interfered with treatment administration
at the individual level. During the LinkedIn training, some users were inadvertently
locked out of their LinkedIn accounts. This issue, which affected five study
10 In analysis, researchers control for timing to minimize the impact of delays and seasonality on
estimates of treatment effects.
308
P. Shaw and L. Wheeler
cohorts, was resolved with assistance from LinkedIn. A robustness check treating
the affected cohorts as “non-compliant” shows that the lockout issues did not
meaningfully change the results of the study. The cause of the issue was never
identified.
The research design ceded much of the control over implementation to the
trainers responsible for running Harambee’s job readiness training programs. Early
in the intervention, the research team learned the importance of instilling within
these trainers a sense of accountability for the LinkedIn component of the training.
One of the early training cohorts assigned to the treatment group did not receive
the LinkedIn training because the trainer responsible for that cohort neglected
to administer the curriculum. The research team was not able to oversee the
implementation in person, and because the cohort was not based out of the main
offices in Johannesburg, the research partners at Harambee were also unable to
observe. Although the research team had built a strong relationship with Harambee
as an organization, they had not at the onset built buy-in with each of the trainers
nor implemented a trainer feedback system.
For the majority of the job readiness cohorts included in the intervention,
implementation challenges were minimal. The research team informally received
feedback from Harambee regarding points of confusion or difficulty for both the
implementers and the workseekers. For example, an implementer from Johannesburg opined that “some of (the workseekers) hadn’t spent a lot of time on the
platform because they were intimidated by the platform layout,” likely because they
“didn’t know where to find things or where to begin.” The team addressed these
concerns with updates to the LinkedIn training. As expected, implementer comfort
with the curriculum progressed naturally throughout the study. The team also
developed a short educational session for trainers, and Harambee further socialized
them to the expectations of the project through one-on-one outreach. This alleviated
many of the initial struggles for the program trainers.
(b) Survey Administration
Survey implementation at scale is a large coordination effort. The study had
a baseline survey administered in the first week of the program, an endline
survey administered in the last week, and 6- and 12-month follow-up surveys
administered after the end of the training. Researchers sought to collect data from
each study participant to maximize the representativeness of survey responses, but
some amount of nonresponse was unavoidable. The baseline survey missed study
participants who were absent on the day of the survey or who enrolled late in the
job readiness training program, the endline survey missed some participants who
found employment before the end of the program or who left the program for other
reasons, and the follow-up surveys missed participants who were not reachable by
the survey firm after the training program, often due to changing phone numbers.
Nonresponse was under 1% for the end-of-program employment measures, 32% in
the 6-month surveys, and 40% in the 12-month surveys. Wheeler et al. (2022) show
that nonresponse does not differ by treatment status and is only weakly related to
the baseline characteristics of study participants.
12 Digital Networking and the Case of Youth Unemployment in South Africa
309
Survey administration presented additional challenges that proved costly, from
either a time or pecuniary standpoint. The research team invested countless hours
in cleaning survey data. The web-based baseline and endline surveys required
respondents to enter their own identifying information in open text questions.
The identifying information, which facilitated the merging of data from different
sources, often did not match across surveys due to data entry errors. To resolve
the mismatches, selected members of the research team collected and crossreferenced multiple identifying pieces of information, including the respondents’
Harambee identification number, full name, date of birth, location, gender, and email
address.11 These data required an immense amount of cleaning. Furthermore, in
some instances, study participants started the baseline survey, got kicked offline
or inadvertently closed the window, and then started a new survey. Although rare,
these responses showed up on the back end, forcing the research team to sift through
duplicate responses as a regular part of the data cleaning process. The research team
also invested time in coaching trainers on how to facilitate the web-based baseline
and endline surveys. The research team explained when and how trainers could offer
assistance without biasing responses. Finally, loss of power interrupted a few of
the web-based surveys. Although not an unusual occurrence in South Africa, these
power outages necessitated the readministration of some of the web-based surveys.
The follow-up survey administration proved extraordinarily costly from both
a time and pecuniary standpoint. Because a companion study found low rates
of response to both web- and SMS-based surveys in the same setting (Lau et
al. 2018), the research team hired a professional survey firm to administer the
follow-up surveys by telephone, which had a large impact on the budget. To
maximize response rates, the survey firm called participants up to 30 times until
successfully contacting them, which was both time-consuming and expensive. The
call center averaged nine calls per respondent in the 6-month follow-up with 14%
of respondents requiring 20 or more call attempts. Participants were even more
difficult to reach at the 12-month follow-up, when the survey firm averaged twelve
call attempts per respondent, with 24.5% of respondents requiring 20 or more
call attempts. The final cost of the follow-up survey effort was US$93,000, which
amounts to approximately US$30 per study participant per follow-up survey or
US$44 per completed survey.
(c) Other Data Collection and Cleaning
Data collection and cleaning challenges measured larger than any other implementation challenge. In addition to the baseline, endline, and follow-up surveys
administered specifically for this research project, the evaluation relied on LinkedIn
data and Harambee administrative and performance data. The data provided by
these third-party sources presented standard challenges of data availability and data
11 The Duke researchers did not have IRB permission to access the identifying information of the
study participants. RTI researchers collected those data and anonymized the data before sharing
with Duke researchers.
310
P. Shaw and L. Wheeler
quality. At the research design phase, researchers did not know with certainty which
measures would be provided by various sources, so some of the planned analysis
was not feasible. In addition, the Harambee in-training performance measures that
were prespecified as outcomes of interest in reality contained too many missing
values to include in analysis.
Sourcing timely LinkedIn data proved to be one challenge to data collection.
Delays were due in part to the European Union’s General Data Protection Regulation (GDPR), which was introduced in the middle of the study. For a short period
of time, LinkedIn paused data sharing as the organization ensured compliance
with the new regulations. Researchers addressed this issue statistically to account
for the possibility of both of time-varying data collection effects as well as timeinvariant geography effects. LinkedIn data collection presented another challenge in
the form of missing data. The data shared with researchers contained missing values
for a small number of study participants who had LinkedIn accounts and should
have been included in the dataset. The research team investigated the problem by
manually cross-referencing the names of the study participants with the names and
work experiences of LinkedIn users. According to LinkedIn, these active accounts
were not found by automated scraping procedures due to the existence of different
emails, misspellings or typing errors, or variations on given names.
Data issues persisted throughout the study, so it was necessary to iterate data
collection methods as the study progressed to ensure data reliability and validity.
The product of the data collection efforts was a large panel dataset that combined
microdata from more than ten different sources and tracked study participants
from the start of the intervention to 12 months post intervention. The final dataset
contained web-based and phone-based survey data, LinkedIn data, and Harambee
administrative data. Simply connecting all of these pieces was difficult, and the
result required extensive cleaning.
A final set of data challenges arose as a byproduct of inter-institution collaboration. Different institutions impose different standards for data storage. In
accordance with Internal Review Board (IRB) standards at different institutions,
the research team kept two datasets: one containing identifying information and
a random identifier for each subject and an anonymized dataset containing the
random identifier plus all substantive information from the surveys. The two datasets
were stored separately and hosted on a cloud-based storage service that can be
encrypted. No identifiable individual-level data was shared with Harambee or any
other organization. In compliance with data sharing agreements between RTI and
LinkedIn, no LinkedIn data was given to Duke researchers or stored on Duke
servers.
3.4 Evaluation
The evaluation compared the experiences of study participants exposed to the
LinkedIn training (the “treated” participants) to the experiences of study participants
12 Digital Networking and the Case of Youth Unemployment in South Africa
311
not exposed (the “control” participants). The research team discovered that, at
the end of Harambee’s job readiness training program, treated participants were
10% more likely to find immediate employment than control participants. Higher
levels of employment persisted for at least 12 months following the intervention.
Furthermore, treatment-control differences in employment appear to be driven
by treatment-control differences in LinkedIn use. The research team found that
exposure to the LinkedIn training increased the probability that a participant
had an active LinkedIn account and also increased the intensity with which the
participant engaged with LinkedIn. The results suggest that, at least in this specific
context, training young workseekers to use LinkedIn speeds up their transition into
employment.
Because the intervention was designed to be a solution to the challenge of
youth unemployment in South Africa, researchers identified short-run and long-run
employment as the primary outcomes of interest. Harambee provided a measure
of short-run employment, a binary indicator of whether the study participant was
employed immediately out of the job readiness training program. The research team
administered surveys to collect data on longer-run employment 6 and 12 months
post training. In addition to the binary employment information, the surveys
solicited information about the quality of the worker-job match, measured by job
retention, promotion, and permanency. In practice, researchers found little evidence
of treatment impacting match quality.
Treatment-control differences in current employment suggest that something
about the intervention was responsible for improving employment outcomes. In
order to attribute those differences to LinkedIn use, the team analyzed whether
and how study participants engaged with the LinkedIn platform. Extensive margin
measures of LinkedIn use – such as whether study participants opened an account
during the intervention – were examined alongside intensive margin measures of
LinkedIn use, such as profile completion, number of profiles viewed, number and
types of connections made, and number of job applications submitted through
the platform. LinkedIn provided these measures at three points in time, roughly
corresponding to the end of the training program and 6 and 12 months post
training. LinkedIn designed their own tools for tracking user behavior and sent
the research team the usage variables they had already constructed. In addition to
using LinkedIn-constructed measures, researchers employed statistical techniques
to devise alternative measures of LinkedIn usage. For instance, researchers used the
first principal component of a set of intensive and extensive margin measures to
reflect an aggregate measure of LinkedIn use. The research team found evidence of
compliance with treatment, based on the majority of these measures. The LinkedIn
treatment increased LinkedIn use both by encouraging study participants to open
accounts and by increasing the intensity with which they engaged with their
accounts.
Researchers designed the evaluation to include a host of other measures that
would be used to shed light on the role of the hypothesized mechanisms laid out
in the original theory of change (see Fig. 12.3). In terms of information provision,
researchers found that treatment significantly increased the number of profiles
312
P. Shaw and L. Wheeler
viewed and the number of jobs viewed on the LinkedIn platform, suggesting that
study participants may have used the platform to acquire information. The average
number of profile and job views was nevertheless quite low. LinkedIn provided
researchers with a measure of the number of articles read on the platform, but the
vast majority of participants read zero articles.
In terms of network formation, LinkedIn provided the research team with
four different variables describing a study participant’s professional network on
the platform: number of connections, number of connections with a bachelor’s
degree, number of connections in a managerial position, and the average power
of connections.12 Treatment had a positive impact on all network measures.
LinkedIn measures did not include information about the ways in which participants
interacted with their connections or about the identities of the network connections.
Treated participants were significantly more likely to have complete LinkedIn
profiles, suggesting a role for the signaling of workseeker ability. Although the
research design did not provide researchers with the opportunity to observe the
ways in which employers used and interpreted LinkedIn profiles, several measured
changes are consistent with the signaling/screening channel. First, researchers
observe that the treatment employment rate rises by the end of the job readiness
program, suggesting a quick mechanism like LinkedIn profiles helping workseekers
pass employer screening. Second, treatment almost triples the number of times a
workseeker’s profile is viewed by other LinkedIn users in the month of program
completion. This may reflect prospective employers viewing profiles during hiring.
However, limited information from the short firm survey conducted ex post suggests
that this mechanism likely was not important in determining the results. None of the
hiring managers who responded to the survey reported that they viewed LinkedIn
profiles during hiring.
Finally, to measure change in educational investment, researchers collected selfreported measures of interest in the job training program and studied job readiness
trainer reports describing things like participant energy and intellectual curiosity.
Treatment did not have an impact on these measures. To test the psychosocial
channel, researchers included in their survey instruments questions about study
participants’ expectations and aspirations. Similarly, treatment had almost no impact
on these measures. Although researchers only measured a subset of the possible
types of self-belief, they found no evidence to suggest that the LinkedIn training
impacted employment through its impact on behavioral change.
The research was not designed to test mechanisms directly but rather to provide
suggestive evidence on the channels through which the LinkedIn training may affect
the main outcome of interest: employment. The evaluation shows that LinkedIn
training was responsible for increasing post-program employment from 70% among
control participants to 77% among treated participants. This 10% increase is
12 The average power of connections is calculated by LinkedIn based on the number of connections
as well as the education and skills of connections. It is a measure of network quality that is
constructed by LinkedIn.
12 Digital Networking and the Case of Youth Unemployment in South Africa
313
comparable to the average effect of other active labor market interventions targeted
toward long-term unemployed workseekers (Card et al., 2017). While recognizing
that this intervention took place within a unique context, a case may be made
for adopting similar technologies to solve youth unemployment challenges in
other countries. This is particularly true in light of the high benefit-to-cost ratio
associated with the intervention. The research team calculated that the cost of the
intervention totaled approximately US$48 per study participant.13 That is relative
to the treatment-induced increase in earnings of approximately US$417 over the
course of 1 year. Cost-benefit calculations are given by the exercise at the end of the
chapter.
3.5 Adaptation
Based on the benefit-to-cost ratio alone, a case may be made for exploring the
use of LinkedIn training in other countries. High youth unemployment is an issue
that affects many developing countries, in particular countries in the Middle East
and North Africa. But there are a few unique features of the study context that
may limit generalizability. First, the study participants were disadvantaged but
high achieving, suggesting higher-than-average technological familiarity for their
demographic. Second, South Africa has high rates of LinkedIn use by workseekers
and employers. Without a strong LinkedIn presence in a country, take-up would
be low. Third, this case study describes an intervention that takes place within
an existing job readiness training program. In the absence of an organization like
Harambee, it is unclear whether the LinkedIn curriculum would be effective.
Scaling up from this intervention more broadly even throughout South Africa
requires some consideration of the obstacles to digital networking. Platform accessibility and inclusivity are imperative for widespread take-up of digital networking
tools. More than nine in ten Harambee workseekers use Internet-enabled phones
(though not necessarily smartphones), but South Africa has some of the highest
data costs in the Southern African Development Community. Thus, lowering costs
through subsidies or incentives or expanding free public Internet access would be
a big step in scaling. An additional option, which Facebook has recently tested,
provides a stripped down application version available at little to no data cost and
allows youth from marginalized communities and those without smartphones to
engage with the network. This also provides an opportunity for marginalized young
people to have a voice in the development of these types of innovations.
Another aspect of scalability pertains to the quality of other operators in the
employment ecosystem. Harambee has found success in its workflow model, but
the organization cannot reach every individual that needs training and support.
13 The estimated cost is US$48 using purchasing power parity adjustments but US$21 at the
nominal exchange rate.
314
P. Shaw and L. Wheeler
The structure of the LinkedIn intervention can be easily replicated in a similar
“facilitating” environment and in other sectors. Existing vocational training and
job readiness programs across sub-Saharan Africa do not necessarily simulate
Harambee’s environment.
4 Lessons Learned
Five years after devising a research question about whether LinkedIn could increase
youth employment in South Africa, the research team has produced the first
experimental evidence that training participants in a job readiness training program
to use an online professional networking platform improves employment outcomes.
The LinkedIn training curriculum increased immediate employment by 10%, an
effect that persisted for at least a year after job readiness training. The research
team estimates that higher rates of employment among participants who received
the LinkedIn training were largely driven by enhanced LinkedIn use.
Given the fairly distinct characteristics of the study population and employment
context, these findings suggest several potential avenues for future research. Are
there specific aspects of digital networking that drive the employment results? Can
these tools be scaled or used at all outside of the job readiness environment? Would
digital networking be as effective in a different country or with a different population
of workseekers?
Even if the findings of the evaluation apply only to the employment conditions
of a specific population, the lessons learned from the research project are wide
reaching, including lessons about policy design, lessons about study implementation, and lessons about future technology design. Policy recommendations are
rather straightforward, such as reducing data costs and encouraging the use of
digital networking platforms in vocational and other job training programs. These
insights into policy design have already informed Harambee’s advocacy with the
government and private sectors. The results of the research study have strengthened
Harambee’s call for a reduction in data costs to enable young people to access digital
professional platforms.
In terms of study implementation, the research project underscored the importance of investing in redundant backup strategies to account for losses in Internet
or power, such as laptops or tablets that can be used offline for training content
delivery and survey data collection. In addition, for researchers working with a
remote implementation partner, careful monitoring for fidelity of implementation,
at least toward the beginning of the study, may alleviate some of the issues this
research team experienced in delivering the intervention.
Finally, for future developers of digital job platforms, this research suggests a
need for strategies to generate greater take-up. For populations that are economically
disadvantaged, digital platform developers can design applications with low data
demands. For populations that are not technology savvy, digital platform developers
12 Digital Networking and the Case of Youth Unemployment in South Africa
315
can build supportive curricula and training materials into their platforms, to help
users onboard and interact with the platform in a deeper way.
A.1 Appendix
(i) LinkedIn Training Curriculum
This image depicts the first part of the LinkedIn training curriculum administered
by job readiness training managers. The full curriculum is accessible with the
published version of the paper from the American Economic Journal: Applied
Economics sited at https://doi.org/10.1257/app.20200025.
(ii) Power Calculation Exercise
For most randomized evaluations, power calculations are an important step in the
research design. Researchers design their experiments such that they are powered to
detect post-intervention differences between control and treated participants. The
power of the research design is the probability of rejecting the null hypothesis that
treatment does not change outcomes when the null hypothesis is in reality false. One
concern is that, if effect sizes are small, researchers may be underpowered to detect
them and will fail to reject the null hypothesis when in reality the intervention was
responsible for small changes in outcomes.
At the beginning of the intervention, researchers must consider trade-offs
between the sample size they’ll use in their study and the minimum effect size they
want to be able to detect, known as the minimum detectable effect size (MDE). As
they increase the sample size, they decrease the MDE. In other words, with more
data, the researchers are able to detect increasingly small responses to treatment.
316
P. Shaw and L. Wheeler
In reality, time and resources are limited, and the study sample cannot include the
entire population of interest. This is where power calculations come into play.
Let’s illustrate the basic principles of power calculations by setting the parameters and calculating the minimum detectable effect size.13 The relationship between
the MDE and the design parameters is given by Eqs. (12.1) and (12.2), with the
parameters defined below:
MDE = t(1−κ) + tα/2 ∗
1
∗
P (1 − P ) J
σ2 =
ρ+
1−ρ 2
∗ σ
n
(1 − τ ) + τ ∗ M
M
(12.1)
(12.2)
The relevant parameters include the following:
1. Test size critical value (tα/2 ): The value of this parameter is obtained from a
standard t distribution. The researcher selects a significance level α and uses a
t-table to identify the critical value associated with a two-sided test:
(a) Assume: The level of statistical significance you aim to achieve is 5%
(b) Question: What is the value of tα/2 ?
(c) Solution: tα/2 = 1.96.
2. Test power critical value (t(1 − κ) ): The value of this parameter is also given by
a t-table based on the level of power specified by the researcher:
(a) Given: Researchers are typically satisfied with power of 80%.
(b) Question: What is the value of t(1 − κ) ?
(c) Solution: t(1 − κ) = 0.84.
3. Number of clusters (J): This study involved randomization of training groups
rather than individuals, and treatment was administered at the group level. The
number of clusters reflects the number of training groups. The researcher will
solve for the number of clusters needed to obtain a large enough sample size for
a given MDE:
(a) Question: Does the MDE increase or decrease as the number of clusters
increases?
(b) Solution: The MDE decreases as the number of clusters increases, corresponding to an improvement in the study’s power.
13 Note that these parameters and calculations are based on the design factors specific to the study
at hand. They differ across studies based on differences in terms of the number of treatment arms,
the level of randomization, the degree of compliance, etc. For more information, Duflo, Gennerster,
and Kremer (2007) provide an excellent treatment on the principles of power calculations.
12 Digital Networking and the Case of Youth Unemployment in South Africa
317
4. Number of units within each cluster (n): The number of units within each
cluster reflects the expected number of individuals within each training group:
(a) Assume: The number of units within each cluster is identical
(b) Question: Does the MDE increase or decrease as the number of units within
each cluster increases?
(c) Solution: The MDE decreases. Again, increasing the overall sample size
improves the power of the study (decreases the MDE).
5. Intracluster correlation coefficient (ρ): This parameter accounts for the correlation of outcomes within groups. The intracluster correlation coefficient is the
share of variance explained by within group variance. Estimates of ρ could come
from pilot data or from national surveys of representative samples:
(a) Given: Based on data on the baseline characteristics of the first few groups
in the study, researchers estimate ρ =0.0165.14
(b) Tip: For any nonzero ρ, increasing J improves precision more than increasing n.
6. Fraction treated (P): As part of the research design, the researcher determines
the fraction of the sample that receives treatment. Unless the treatment is
expensive, it is generally optimal to treat half the sample because P =0.5
minimizes the MDE:
(a) Given: P =0.5.
7. Number of posttreatment measures (M): Some outcomes are measured at
multiple points in time after the intervention. This parameter is determined by
the research design:
(a) Given: The researchers plan to measure the outcome of interest at 6 months
and 12 months post-intervention, so M = 2.
(b) Question: How does the number of posttreatment measures affect the power
of the study?
(c) Solution: The number of posttreatment measures factors into the residual
variation. Increasing M decreases residual variation, which increases the
power of the study.
8. Intertemporal correlation coefficient (τ ): This parameter accounts for the
correlation of outcomes over time. It is the share of the variance explained by
variance over time. This parameter only becomes important if outcomes are
measured at multiple points in time. Estimates of τ often come from longitudinal
surveys of representative samples:
(a) Given: Based on multiple waves of data from that National Income Dynamics Study, researchers estimate that τ = 0.312.
14 Note that it’s best to use a range of estimates. Point estimates are given here for the sake of
clarity.
318
P. Shaw and L. Wheeler
9. Residual variation (σ 2 ): This parameter is calculated based on the values of τ
and M in a relationship given by Eq. (12.2):
(a) Question: What is the value of σ 2 based on the information given in this
example?
(b) Solution: σ 2 = 0.656.
(c) Question: Does the MDE increase or decrease with σ 2 ?
(d) Solution: The MDE increases with σ 2 , indicating that decreasing the residual
variation improves the study’s power.
Putting it all together:
Question (1): Given the above parameter values, what is the minimum detectable
effect size associated with 30 groups of 70 participants per group?
Question (2): Interpret this.
Question (3): How do you think researchers would determine if that’s an acceptable
MDE for the study?
Solution (1): 0.1447.
Solution (2): Given the above parameter values, a sample of 2,100 study participants
evenly divided into 30 groups would allow researchers to reject the null
hypothesis with statistical certainty only if the treatment effect is greater than
0.1447.
Solution (3): Power calculations are not an exact science. Researchers typically base
this determination on evidence from previous research and intuition. Based on
past studies, what effect size would you expect to see? Would you want to be
able to detect smaller effect sizes if it’s feasible from a cost standpoint?
(iii) Cost-Benefit Calculation Exercise
Given:
1. Harambee’s average cost per candidate enrolled in the 8-week version of the
job readiness training program is US$3,833 purchasing power parity (PPP).
2. The job readiness training program meets for 40 hours per week for each of
the 8 weeks.
3. Harambee allocates approximately 4 hours to LinkedIn training per job
readiness program.
4. The job readiness training program costs cover staff time for training,
administration, etc.; facility rental; IT costs; and participant stipends.
5. The intervention increases employment by 6.9 percentage points in the sample
of 890 treated candidates.
6. The South African national minimum hourly wage is approximately US$3
PPP or US$6,050 annual earnings.
Question 1: Assuming that the LinkedIn training does not increase any of Harambee’s fixed or variable operational costs, what is the average cost per candidate
of the LinkedIn intervention?
12 Digital Networking and the Case of Youth Unemployment in South Africa
319
Question 2: What is the cost of the LinkedIn intervention per each additional
candidate employed as a result of the intervention?
Question 3: Calculate the lower bound for benefit of the treatment in terms of
earnings. Assume no one earns more than the minimum wage. How much does
treatment increase the average candidate’s annual earnings?
Question 4: What is the benefit-cost ratio based on your answers to the above?
Answer 1: US$48 PPP.
(Answers are rounded to the nearest dollar.)
Answer 2: US$694 PPP.
Answer 3: US$417 PPP.
Answer 4: 8.7:1.
References
Agrawal, A., Horton, J., Lacetera, N., & Lyons, E. (2015). Digitization and the contract labor
market: A research agenda. In A. Goldfarb, S. Greenstein, & C. Tucker (Eds.), Economic
analysis of the digital economy (pp. 219–250). University of Chicago Press.
Ajaegbu, O. O. (2012). Rising youth unemployment and violent crime in Nigeria. American
Journal of Social Issues & Humanities, 2(5), 315–321.
Banerjee, A., et al. (2008). Why has unemployment risen in the new South Africa? The Economics
of Transition, 16(4), 715–740.
Barbarasa, E., Barrett, J., & Goldin, N. (2017). Skills gap or signaling gap?: insights from
LinkedIn in emerging markets of Brazil, India, Indonesia, and South Africa Solutions for Youth
Employment, Washington D.C. LinkedIn.
Bell, D. N. F., & Blanchflower, D. G. (2011). Youth unemployment in Europe and the United States.
IZA Discussion Paper No. 5873, April 2011
Bortnick, S. M., & Ports, M. H. (1992). Job search methods and results: Tracking the unemployed,
1991. Monthly Labor Review, 115(12), 29.
Caers, R., & Castelyns, V. (2010). LinkedIn and Facebook in Belgium: The influences and biases of
social network sites in recruitment and selection procedures. Social Science Computer Review,
29(4), 437–448.
Caporale, G. M., & Gil-Alana, L. (2014). Youth unemployment in Europe: Persistence and
macroeconomic determinants. Comparative Economic Studies, 56, 581–591.
Card, D., Kluve, J., & Weber, A. (2017). What works? A meta analysis of recent active labor
market program evaluations. Journal of the European Economic Association, 16, 894–931.
Choi J, Dutz M A, Usman Z (2020) The future of work in Africa: Harnessing the potential of
digital technologies for all.. The World Bank Group
Collmus, A. B., Armstrong, M. B., & Landers, R. N. (2016). Game-thinking within social media to
recruit and select job candidates. Social media in employee selection and recruitment: Theory,
practice, and current challenges, 103–124.
Dalvit, L., Kromberg, S., Miya, M. (2014). The data divide in a South African rural community:
A survey of mobile phone use in Keiskammahoek. Proceedings of the e-Skills for Knowledge
Production and Innovation Conference 2014, Cape Town, South Africa: 87-100
Duflo, E., Glennerster, R., Kremer, M. (2007). Using randomization in development economics
research: A toolkit. CEPR Discussion Paper No. 6059
Ebrahim, A., Leibbrandt, M., Ranchhod, V. (2017). The effects of the Employment Tax Incentive
on South African employment. WIDER Working Paper 2017/5
320
P. Shaw and L. Wheeler
Fougere, D., Kramarz, F., & Pouget, J. (2009). Youth unemployment and crime in France. Journal
of the European Economic Association, 7(5), 909–938.
International Labour Organization. (2017). Global employment trends for youth 2017: Paths to a
better working future. International Labour Office.
International Labour Organization. (2018). Women and men in the informal economy: A statistical
picture. International Labour Office.
Kerr, A. (2017). Tax(i)ing the poor? Commuting costs in South African cities. South African
Journal of Economics, 85, 321–340.
Kingdon, G., Knight, J. (2001). Why high open unemployment and small informal sector in South
Africa? Centre for the Study of African Economies, Economics Department, University of
Oxford.
Kluemper, D., Mitra, A., & Wang, S. (2016). Social media use in HRM. In Research in personnel
and human resources management (pp. 153–207). Emerald Group Publishing Limited.
Kuhn, P., Mansour, H. (2011). Is Internet job search still ineffective? IZA Discussion Paper No.
5955
Kuhn, P., & Skuterud, M. (2000). Job search methods: Internet versus traditional. Monthly Labor
Review, 3, 3–11.
Kuhn, P., & Skuterud, M. (2004). Internet job search and unemployment durations. American
Economic Review, 94(1), 218–232.
Lam, D., Ardington, C., & Leibbrandt, M. (2011). Schooling as a lottery: Racial differences in
school advancement in urban South Africa. Journal of Development Economics, 95, 121–136.
Lau, C. Q., Johnson, E., Amaya, A., LeBaron, P., & Sanders, H. (2018). High stakes, low resources:
what mode(s) should youth employment training programs use to track alumni? Evidence from
South Africa. Journal of International Development, 30(7), 1166–1185.
LinkedIn. (2020). The LinkedIn register. https://news.linkedin.com/about-us#1. Accessed 12
August 2020
Magruder, J. (2010). Intergenerational networks, unemployment, and persistent inequality. South
Africa American Economic Journal: Applied Economics, 2, 62–85.
Mosomi, J., & Wittenberg, M. (2020). The labor market in South Africa, 2000–2017. IZA World of
Labor, 2020, 475.
Mroz, T., & Savage, T. H. (2006). The long-term effects of youth unemployment. Journal of Human
Resources, XLI(2), 259–293.
Okafor, E. E. (2011). Youth unemployment and implications for stability of democracy in Nigeria.
Journal of Sustainable Development in Africa, 13(1).
Oyedemi, T. (2015). Participation, citizenship and internet use among South African youth.
Telematics and Informatics, 32(1), 11–22.
Pew Research Center. (2018). Internet connectivity seen as having positive impact on life in subSaharan Africa
Rankin, N., & Roberts, G. (2011). Youth unemployment, firm size and reservation wages in South
Africa. South African Journal of Economics, 79, 128–145.
Roulin, N., & Levashina, J. (2018). LinkedIn as a new selection method: Psychometric properties
and assessment approach. Personnel Psychology, 72(2), 187–211.
Schmillen, A., & Umkehrer, M. (2017). The scars of youth: Effects of early-career unemployment
on future unemployment experience. International Labour Review, 156(3-4), 465–494.
Sharone, O. (2017). LinkedIn or LinkedOut? How social networking sites are reshaping the
labor market. In Emerging conceptions of work, management, and the labor market. Emerald
Publishing Limited.
Shepherd, B. (2013). Social recruiting: Referrals. Workforce Management, 5(18).
Stamper, C. (2010). Common mistakes companies make using social media tools in recruiting
efforts. CMA Management, 12, 13–22.
Statistics South Africa. (2019). Quarterly Labour Force Survey (QLFS), 1st quarter 2019. Statistics
South Africa.
12 Digital Networking and the Case of Youth Unemployment in South Africa
321
Taylor, S., Van Der Berg, S., Reddy, V., Janse Van Rensburg, D. (2011). How well do South African
schools convert grade 8 achievement into matric outcomes? Tech. Rep. 13/11, Stellenbosch
Economic Working Papers
Uys, W., et al. (2012). Smartphone application usage amongst students at a South African
university. IST-Africa 2012 Conference Proceedings: 1–11
Wheeler, L.E., et al. (2019). LinkedIn(to) job opportunities: Experimental evidence from job
readiness training. University of Alberta Working Paper No. 2019-14
Wheeler, L.E., et al. (2022). LinkedIn(to) Job Opportunities: Experimental Evidence from Job
Readiness Training. American Economic Journal: Applied Economics, 14(2), 101–25.
Open Access This chapter is licensed under the terms of the Creative Commons Attribution 4.0
International License (http://creativecommons.org/licenses/by/4.0/), which permits use, sharing,
adaptation, distribution and reproduction in any medium or format, as long as you give appropriate
credit to the original author(s) and the source, provide a link to the Creative Commons license and
indicate if changes were made.
The images or other third party material in this chapter are included in the chapter’s Creative
Commons license, unless indicated otherwise in a credit line to the material. If material is not
included in the chapter’s Creative Commons license and your intended use is not permitted by
statutory regulation or exceeds the permitted use, you will need to obtain permission directly from
the copyright holder.
Chapter 13
Amplifying Worker Voice
with Technology and Organizational
Incentives
Achyuta Adhvaryu, Smit Gade, Piyush Gandhi, Lavanya Garg, Mansi Kabra,
Ankita Nanda, Anant Nyshadham, Arvind Patil, and Mamta Pimoli
1 Development Challenge
Across the globe, the apparel industry operates through a vast value chain of both
formal and informal workers. This includes farmers that grow cotton, factories that
turn fabrics into finished garments, and retail stores that sell these garments to
consumers. While retail stores are found in many different parts of the world, most
production and manufacturing processes are concentrated in low-income countries.
This establishes a certain degree of separation between the retailer and manufacturer
and even more between the consumer and the frontline worker.
This disconnect, even if unintentional, can lead to business practices that do not
internalize the well-being of workers, and the consequences of this disconnect can
be drastic. An extreme example is the Rana Plaza tragedy in 2013, in which over
1000 workers died in a commercial building collapse in Bangladesh, caused largely
by persistent neglect of working conditions and disregard for workers’ concerns
around building safety.
This case study describes how technology can be used to increase connection
and engagement among stakeholders on the factory floor. The solutions we describe
hold the potential to increase transparency and accountability for vulnerable workers
A. Adhvaryu ()
William Davidson Institute, Ross School of Business, University of Michigan, Michigan, MI,
USA
Good Business Lab, New Delhi, Delhi, India
e-mail: nyshadha@umich.edu
S. Gade · P. Gandhi · L. Garg · M. Kabra · A. Nanda · A. Patil · M. Pimoli
Good Business Lab, New Delhi, Delhi, India
A. Nyshadham
Ross School of Business, University of Michigan, Michigan, MI, USA
© The Author(s) 2023
T. Madon et al. (eds.), Introduction to Development Engineering,
https://doi.org/10.1007/978-3-030-86065-3_13
323
324
A. Adhvaryu et al.
across South Asia’s garment industry. In the status quo, relationships between
workers and their supervisors are rife with frictions, owing to production pressures,
gender dynamics, low wages, weak work motivation, low self-esteem, and feelings
of unbelonging (particularly for migrant workers). While the relationship between
managers and workers – and the extent to which workers feel valued – is a
key determinant of firm performance (Adhvaryu et al., 2019; Ashraf & Bandiera,
2018; Bandiera et al., 2009; Hoffman & Tadelis, 2018), these issues are too easily
deprioritized by business owners, who often fail to perceive their role in firms’
profitability and long-term survival.
The development challenge of creating high-performing firms that can retain
their workers – while providing quality jobs to low-income women – is central
to economic growth. We address this challenge through technology that enables
responsive and supportive interpersonal relationships among workers and supervisors. Our approach, like many innovations described in this textbook, will combine
a software platform coupled with a set of novel iteratively designed organizational
management strategies. The result is a solution that is highly adapted across
developing country contexts – and one that can achieve impact at scale.
1.1 Establishing Connection: Workers in the Garment Industry
The garment manufacturing industry in many low-income country contexts is highly
labor-intensive. It spans both the formal and informal sectors of the economy.
Production for multinational retail brands in almost all cases happens in the formal
setting where firms hire their employees through contracts and often provide
workers with basic benefits such as earned leave and government-mandated (in
India) health insurance coverage.
In India alone, the textile and apparel industry employs over 45 million individuals directly, making it the second largest sector in terms of employment after
agriculture. The industry has been an integral part of the Indian economy since the
seventeenth century, reaching a size of $140 billion in 2018. While COVID has
dampened its growth, along with India’s economy as a whole, according to data
released by the Confederation of Indian Textile Industry (CITI), the recovery for
the domestic market is expected to be quite steep after the pandemic. The domestic
market alone is estimated to reach USD 120 billion by 2024.The sector contributes
2.3% to India’s GDP, 7% of the country’s manufacturing production, and 13% of
the country’s export earnings.
Box 13.1: Protections for Formal Sector Workers in India
In the formal setup of the apparel industry, workers are employed in a setting
that requires compliance with both legal regulations and retailer standards for
(continued)
13 Amplifying Worker Voice with Technology and Organizational Incentives
325
Box 13.1 (continued)
worker safety. Most workers are hired not on a short-term contract basis, but
as full-time employees with workplace benefits such as retirement plans and
employee health services. While short-term contracts and informal work do
form a part of the industry, this case study focuses on formal workers.
In India, wages for frontline workers are benchmarked to government
minimum wage policy, which is largely determined at the state level. The
minimum wage consists of two parts – a “basic” portion and a “dearness
allowance,” which is intended to allow for cost of living adjustments. The
dearness allowance is adjusted every year for inflation, while adjustments to
the basic wage level are made roughly every 5 years by the Government of
India and commonly result in larger increases than the more frequent inflation
adjustments.
Wages are fixed; however, workers are entitled to receive additional
compensation if they work overtime. Collective bargaining is allowed, and
salaries are negotiated according to company policies and local labor laws.
There are several trade unions working for garment factory workers, for
example, the Karnataka Garment Workers Union (KOOGU) in the southern
state of Karnataka.
Our research team has worked for the past decade with Shahi Exports Pvt.
Ltd., India’s largest apparel export house. Shahi operates close to 60 large garment
factories in India, employing nearly 120,000 workers. Here, we describe the day-today work conditions for Shahi employees.
Frontline workers typically earn minimum wage, which in India is USD 105–
135 per month. Salaries are deposited to workers’ bank accounts around the seventh
day of every month, usually without delays in disbursement. Working hours and
holidays are in accord with national labor laws: work shifts are 9–10 hours long,
including a lunch break for 30–45 minutes (depending on the factory). The job is 6
days a week, with a day off on Sundays. Approximately 80% of the total workforce
are migrants from rural India, and they send remittances of up to USD 40–55 per
month on average to family members in their villages, leaving little opportunity for
personal savings.
The majority of the garment manufacturing workforce comprises young female
workers who stay on the job for an average of 1 year. Based on data analyzed from
our partner firm, almost 50% of migrant workers drop out of the workforce within
the first 6 months after joining. The industry’s direct and indirect costs of turnover
are high, especially in India. Direct costs are incurred by the continuous need to
hire and train new cohorts of workers; indirect costs include regularly disrupted
production, reduced productivity due to high absenteeism, and low worker morale.
A typical migrant worker comes to the manufacturing area from a rural district in
or outside of their residing state. They often face difficulty in acclimatizing to new
language, culture, food, co-workers, and cohabitants – all while being separated
326
A. Adhvaryu et al.
from their families and social networks back home. In this unusually high-pressure
environment, greater exercise of worker voice could improve well-being and sustain
young women’s labor market participation.
In fact, larger garment manufacturing firms that contract with international
buyers actually do invest in employee well-being and development. For example,
the industry has scaled soft-skills training among workers, and well-being measures
have become an integral part of management practice. Some firms also provide
medical facilities, child care, and welfare schemes for workers. However, a majority
of small garment factories, especially those producing for domestic buyers (or
subcontracting for medium and large firms), lack transparency and accountability
with regard to working conditions and employment contracts.
Facilities provided by the firm discussed in this case study include free child
care in every unit with full-time caretakers, support staff, and nutritious free
food; medical center in every unit, equipped with free medication, ambulance, and
first-aid services; bank accounts for every employee and secure ATMs on site;
support in applying for relevant government benefits; merit-based scholarships for
employees’ children; human resource team at all units trained in basic counseling
skills including behavior change, working with families, and group counseling;
specialized counseling cells in 15 units, with professional counselors; and regular
employee engagement programs, cultural events, and festival celebrations.
1.2 Attrition, Voice, and Worker Well-Being
Despite recent improvements in employee benefits, there are significant issues
facing Indian garment workers and firms. International buyers expect manufacturers
to complete regular social audits, conducted by third-party organizations, yet
ironically, this process discourages factory management from keeping records of
reported grievances. It also disincentivizes managers from taking strict action
on complaints, for fear of unfavorable audit reports (which harm the factory’s
business). Operating in a high-pressure manufacturing environment means that
worker concerns are overlooked, particularly when taking action compromises
production.
Most Shahi workers – about 80% – are women working as frontline machine
operators (see Table 13.1). Supervisory roles remain male-dominated. This systemic
gender imbalance leads to persistent power asymmetry. In addition, most entry-level
workers come from low-income and disadvantaged backgrounds, exacerbating their
lack of agency and voice. They have few alternative job opportunities (see Box 13.2)
and are therefore hesitant to report legitimate issues for fear of retaliation, which in
the extreme can lead to job loss.
Anecdotally, we find that systematic gender imbalance, coupled with an environment of pressure and fear, manifests in the form of shouting, abuse, and harassment
on the factory floor. These issues often go unreported and unresolved. Predictably,
13 Amplifying Worker Voice with Technology and Organizational Incentives
327
Table 13.1 Snapshot of workforce at Shahi Exports
Parameter
Gender
Origin
Age group
Marital status
Living with/at
Mobile phones
Work experience
Description
Mostly women (70–80%)
Migrant (20–30%)
Local (70–80%)
Migrant (18–25 years)
Local (18–45 years)
Migrant (mostly unmarried)
Local (unmarried and married)
Migrants (hostels and rented houses)
Local (rented houses, parents or in-laws)
Migrants (mostly smartphone after they come to the city)
Local (mostly feature phone, sometimes it belongs to their
parents/husband)
Migrant (1–2 years)
Local (5–6 years)
worker absenteeism and attrition in the garment industry are remarkably high, each
averaging between 8% and 10% every month at our partner firm.
Box 13.2: Indian Garment Workers Have Few Outside Options
In an Outside Employment Opportunities Survey conducted at 12 factories
of Shahi Exports, we surveyed more than 2300 workers about their wage
expectations and about outside job opportunities. The primary outside option
was another garment factory job (listed by 37% of workers); for most workers
(55%), there is no outside option.
1.3 A Lab for Good Business
Albert Hirschman’s seminal work – Exit, Voice, and Loyalty (1970) – posits that
worker voice and exit, or attrition, are intimately related. Voice is defined as follows:
Any attempt at all to change, rather than to escape from, an objectionable state of affairs,
whether through individual or collective petition to the management directly in charge,
through appeal to a higher authority with the intention of forcing a change in management,
or through various types of actions and protests, including those that are meant to mobilize
public opinion.
In this case study, we explore how technology can be used to establish a
connection between factory management and workers, in the pursuit of long-term
worker well-being. Can technology, combined with novel managerial improvements, empower workers to voice their concerns, grievances, and suggestions?
328
A. Adhvaryu et al.
Answering these questions requires us to define worker voice and identify how it can
be enabled. We must also explore how to build responsive management practices,
how to sustain buy-in for worker voice among factory stakeholders, and how to
instill bilateral trust in a method for employer-employee communication.
There are multiple existing means of amplifying workers’ voice in our context –
ranging from a worker helpline and suggestion boxes to HR outreach and unionization. Although these mechanisms are at times valuable to workers, they are not
often associated with trust; transparency; and, importantly, anonymity. The lack of a
reliable, transparent, and anonymous mechanism for enabling voice leaves workers
feeling unheard and neglected, leading to attrition. On the other hand, managers in
this context lose touch with the pulse of their factories, which in the long run allows
minor issues to snowball into larger, more systemic problems.
These observations and questions started us on a journey to develop technological
solutions informed by human-centered design to promote voice among garment
workers with a buy-in from the management. In the first leg of this journey, we
evaluated the impact of an employee satisfaction survey, an elementary form of
worker voice, on worker satisfaction and attrition. In a second experiment, we
leveraged a digital SMS-based worker grievance redressal platform to automate the
process. Learning from these efforts and analyzing other worker voice management
tools available in the market, we documented how existing technologies fail to fully
address needs in the Indian and wider South Asian garment manufacturing context.
Finally, we designed a novel, lower-cost solution that leverages digital technology to
enable worker voice coupled with managerial incentive programs to promote buy-in
from factory staff.
Our resulting worker communication solution, branded as Inache, enables
workers to communicate their suggestions and grievances via SMS or voice call, and
mobilizes managers to listen and help via system-level incentives. We are currently
evaluating the impact of this solution on management outcomes, worker satisfaction,
and ultimately worker attrition and productivity.
This journey has also spurred the creation of a nonprofit organization, called
Good Business Lab (GBL), which is registered in the United States and India.
GBL continues to design, evaluate, and proliferate new workplace technologies and
programs aimed at a myriad of persistent workplace issues. GBL also produces
insights about the adoption, effectiveness, and paths to scale of these innovations.
This chapter describes the evidence generated by GBL for the case of worker voice,
as well as documents the multistaged process we follow when engaging in usercentered software design. The journey is far from complete, but as you read, we
hope you see the potential impact of this deliberate and innovative approach.
13 Amplifying Worker Voice with Technology and Organizational Incentives
329
2 Context for the Innovation
2.1 Existing Mechanisms for Worker Voice
The stakeholders that influence worker voice the most are the manufacturers that
employ workers and the brands that source from these manufacturers. Typically,
corporate brands mandate third-party “audit” of manufacturing factories for compliance with social, environmental, health, and occupational safety requirements.
Providing an avenue for workers to voice their concerns, unfortunately, doesn’t take
priority in this list. In the rare instance that it does, the requirement is limited to
having suggestion boxes on the factory floor, an age-old traditional practice sans a
robust proof of concept in the current context. We envision providing such avenues
to voice concerns, beyond compliance. However, an unwelcome outcome of the
auditing culture has been the general fear of transparency among factories, which
gravely affects their willingness to adopt worker voice measures.
To better understand the context, we first undertook a design audit. This involved
understanding the organization’s sociocultural fabric and the prevalent norms and
rituals – both explicit and implicit. We looked at existing mechanisms to report
grievances or suggestions, or ask questions, that a worker had access to, at work.
We found that there were several communication channels in place at Shahi (see
Table 13.2), and we gathered data on these channels for 40+ factories.
We also studied existing processes and organizational hierarchies to understand
factory dynamics. This was done by undertaking focus group discussions with top
management leaders, human resources (HR) offices, and production staff members
and conducting semi-structured interviews with more than 30 workers, representing
Table 13.2 Employer-employee communication channels
Direct communication
Announcements
Suggestions
Committees
Helpline
Handbook
Help desk
Worker directly approaches the management* to communicate their
concerns
*Specifically human resources (HR), which is responsible for grievance
redressal in the factories
Management makes general announcements for all workers related to
holidays, work shifts, etc. in the factories
Suggestion and complaint boxes are located in the factory premises that
allow workers to anonymously submit their concerns
Multiple worker-management committees have been set up to handle
different kinds of grievances. Example: internal complaints committee,
which handles grievances related to sexual harassment
A phone number, handled by the management, that workers can call at,
to raise any issues (records usually not digitized)
A booklet that dispenses information to workers on factory-related
policies and practices
Counter operated by HR executives in large factories during lunch
hours, where workers can reach out and get their queries resolved
330
A. Adhvaryu et al.
different personas (e.g., migrants and locals, married and unmarried, novices and
experienced, different job functions). Moreover, we made observations on the
factory floor through short ethnographic studies.
We discovered shortcomings with the mechanisms outlined in Table 13.2, including a lack of a formal go-to process, accountability, and transparency in grievance
registration. Often, issues raised by workers through direct communication with HR
staff were not recorded anywhere. In addition, turnaround time for response varied –
from a few hours for direct communication with HR on the shop floor to several
months for suggestion boxes and worker committee meetings. Besides suggestion
boxes, it was impossible to maintain anonymity through any other mechanisms. This
restricted workers from sharing sensitive grievances, like cases related to sexual
harassment, verbal abuse, and bullying.
While helplines seemed to be an effective method for registering cases, many
workers opted to call after office hours (sometimes at 10 PM or 11 PM, a
practice discouraged by firms). Finally, while announcements and handbooks were
effective in disseminating information to a mass audience, carrying the handbook
and paying attention to announcements during working hours were a pain point,
from workers’ perspective. Like suggestion boxes, they also failed to support twoway communication. Help desks were effective in large factories with ample staff
(personnel) but ended up being futile in smaller factories with limited staff who felt
burdened with excess responsibilities.
2.2 Modeling the Factory Environment
To further build an understanding of people’s interaction with internal factory
systems and how they together enable and impact worker voice, we created a model
of the factory’s environment. We modeled the “macro” environment, focusing on
Shahi’s organizational structure, and the “micro” environment, focusing on the
worker’s universe of experiences.
Macro-environment First, we explored how factory management perceived the
value and threat of enabling worker voice. We mapped stakeholders according to
their incentives, motivations, and commitment to worker voice. By studying the
administrative records produced by stakeholders, we discovered that the factory HR
and organizational development (OD) teams were working in tandem to manage
grievances. We were able to formulate the roles and responsibilities of each unit,
resulting in an organizational structure detailed in Fig. 13.1.
Each factory’s HR team works as an interface between the workers and the
management. The HR team is responsible for employment-related procedures, such
as salary, attendance, and onboarding workers. The organizational development
(OD) team is responsible for implementing worker well-being programs on the
ground, for example, maintaining hostel facilities (room and board) for migrant
workers, running rural training centers and upskilling programs, and implementing
13 Amplifying Worker Voice with Technology and Organizational Incentives
331
Board of Directors
Chief Executive
Officer
Chief
Operating Officer
Head Org.
Development
Corporate HR/
Divisional GM HR
Chief
Compliance Officer
General Manager
OD
Factory
Operations Head
Factory HR Head
Factory Operations Team
Factory OD
Representative
Factory HR Team
Production Head
Floor Manager
Line Supervisor
Quality Control Team
Industrial Engg. Team
Maintenance Team
EHS Team
Workers
Fig. 13.1 Organizational hierarchies within the factory
other social compliance programs in the factories. The core team for grievance management in the factory comprises representatives from the HR and OD departments.
After interviewing Shahi’s staff, we were able to map interest in worker voice
tools and trace various stakeholders’ levels of influence within the factory. This
exercise allowed us to identify “paths of least resistance,” i.e., easiest ways to align
stakeholders’ interests with our reforms to management practice.
Microenvironment To understand the worker’s perspective, we first mapped all of
the actors a worker interacts with (see Fig. 13.2), including supervisors, doctors,
security guards, hostel wardens, and management staff. We also mapped the nature
of workers’ relationship (positive, negative, or neutral) with each stakeholder.
In any manufacturing setting, the workplace hierarchy is rigid, and it influences
and drives stakeholders in different ways. We tried to reinterpret the hierarchy,
incorporating the frequency with which workers interact with each stakeholder.
We identified two important loops that exist in this ecosystem: (1) conflict loop
and (2) peace loop. The conflict loop (highlighted in red) consists of workers,
line supervisors, and other production staff. There exist predictable reasons for
conflict, for example, low efficiency, the production pressure of meeting targets,
inferior production quality, and skewed gender ratio (most of the workers are female,
while their supervisors/managers are men). On the other hand, the peace loop
(highlighted in green) consists of workers, HR executives, OD representatives, and
medical/healthcare staff. Workers tend to reach out to one of these stakeholders for
help or assistance, including mustering emotional support in a conflict or distress
situation.
332
A. Adhvaryu et al.
Fig. 13.2 The microenvironment of workers
The rest of the factory’s stakeholders don’t interact directly with the workers
very often and can be categorized as a neutral group. Naturally, on the shop floor,
there is a balancing act between the conflict loop and peace loop.
Apart from the internal stakeholders, there are key external partners – like NGOs,
trade unions, government agencies, and retailers – that impact workers in various
ways. NGOs and trade unions usually have strong local connections with workers,
nurtured over a sustained period of time. They have a reputation of caring deeply
about workers’ interests. This lends them credibility, not only among workers but
also suppliers and retailers. Government agencies and departments inform state- and
national-level policy which affects workers’ day-to-day lives (e.g., how much they
earn, regulating factory working conditions such as mandating the requirement of a
child care center in factories in India). They have far-reaching networks to undertake
widespread information dissemination. Retailers or brands that do business with the
supplier often leverage their influence to demand various business practices and
measures from suppliers, which directly impact workers, for example, requiring
third-party social audits and mandating training programs.
We dug deeper to study a day in a worker’s life – to understand their high
and low points – through in-depth interviews with approximately 30+ workers.
We used empathy maps, a method used to understand users from what they say,
how they feel throughout a day, and how they respond to stressful situations (see
13 Amplifying Worker Voice with Technology and Organizational Incentives
333
Fig. 13.3). This process surfaced the cognitive load imposed by financial strain,
especially from instances of delayed wage payments. Such stress, coupled with
day-to-day issues, has a tendency to pile up and become a cause of great distress
for a worker. We also learned that in this population, very few workers owned a
smartphone (approximately 45%). In fact, most workers owned and used feature
phones, and only half were formally educated. Of those with formal education, most
completed high school only. These observations would impact our tool development
significantly.
3 Innovate, Evaluate, and Scale
3.1 Experiment No. 1: A Study of Worker Voice
Firms like Shahi revise their wages frequently. They can choose to raise wages
by more than is required by minimum wage, although this is rare. In general,
workers face substantial uncertainty about the size of annual wage increases, with
unpredictable government and firm decision-making. Anecdotal evidence suggests
that worker dissatisfaction is especially high after annual firm-wide wage increases –
a fact that may be explained, in part, by the disappointment brought about by wagerelated uncertainty.
In our first voice experiment, we investigate how this disappointment might lead
to higher quit rates. The firm-level wage hike in this case took effect in April 2016,
the same year when the basic component of the minimum wage was revised by the
government, which takes effect once every 5 years.
Through a randomized controlled trial, we tested the impact of voice on worker
satisfaction. Employee feedback channels are an important form of voice, with both
intrinsic and instrumental value. The intrinsic value comes from the ability and
opportunity to express one’s opinion about the workplace or workplace practices.
The instrumental value is derived from the changes in the workplace resulting from
feedback.
We wanted to test whether feedback operates primarily through the intrinsic
channel, by providing workers an option to voice their (dis)satisfaction. So,
we deployed a simple employee satisfaction survey in the months immediately
following the 2016 wage hike.
We selected a sample of 2000 workers, spanning 12 factories, to participate in the
study. Approximately half were randomly selected to receive the survey (treatment
group), and the other half made up the control group. The survey was anonymized
and recorded (1) worker satisfaction with the job, supervisor, wage, and workplace
environment and (2) opinions about supervisor quality (e.g., whether mistakes
are held against workers, whether it is difficult to ask others for help, whether
supervisors encourage learning, and whether workers can trust their supervisors
to advocate for them, listen to them, and help solve their problems). For all 12
334
A. Adhvaryu et al.
A DAY
IN THE LIFE
OF A WORKER
5:00 AM
5:00 AM - 7:00 AM
On a typical
We extensively studied the life of
FIRST SHIFT:
workers keeping working and non
Working in the factory
working days in mind. Most of the
This roune connues even if they
are on their period - breaks are hard
to come by.
women workers are engaged in
SECOND SHIFT:
two shis.
Fulfilling household dues,
Oen being the sole caregiver of the
which extends into the weekend
family puts a lot of pressure on them.
7:00 AM - 9:00 AM
9:00 AM - 5:00 PM
working day
Daily chores - geng ready
women workers
for work, preparing ffin for
Travel to the factory : They
wake up around
self, children and other family
travel for more than an hour and
In most of the factories work
4:00-5:00 am.
members along with basic
reach the factory by 8:30-9:00.
starts around 9:00 am.
cleaning of house and utensils.
They usually commute by public
If they get late it affects the chances
of achieving the producon target of
the day.
9:00 AM - 9:15 AM
transport, auto rickshaws and
in some cases they have to take
But, before starng the actual
mulple modes of transport.
work a worker needs to go
meengs where they inform workers
through security check at the
about issues faced and resolved on
entrance and then register their
the previous day, producon target
aendance on biometric machine.
for the day, special care to be taken
Line supervisors conduct batch
during a crical operaon and so on.
12:30 PM - 1:00 PM
1:00 PM - 5:00 PM
5:00 PM - 7:00 PM
Lunch break of half an hour, to avoid
Some workers skip their lunches and
overcrowding in the canteen many
spend me near the workstaons.
factories have the lunch break spread
Travel back home (get vegetables and
They just chit chat with their friends,
over an hour’s me and workers are
Cook dinner, set up things for the next
other household items on the way
visit medical facility or visit Human
released for lunch break in batches.
day, watch television (oen the only
back home).
Resources department in case they
This is the only me when workers
need some help. Workers resume work
interact with their friends and this
immediately aer the lunch break.
break plays an important role in
7:00 PM - 11:00 PM
entertainment in the whole day).
developing social connecons.
11:00 PM
They go to bed, the interesng aspect
to explore would be the dreams that
they see with eyes closed and how
they try to fulfil those dreams by
taking responsibility of family and
ownership at work in the factory.
02
Fig. 13.3 Day in the life of a worker
….and this is a
365/366 days
roune for them!
13 Amplifying Worker Voice with Technology and Organizational Incentives
335
factories, we also obtained routine administrative data collected by the firm. These
included retention rates and personnel data including gender, education, hometown,
department, and job type.
Our findings were compelling: many workers used the survey to express dissatisfaction with various aspects of their jobs. As shown in Fig. 13.4, over 20%
of workers agreed or strongly agreed with the first two statements: that mistakes
were held against them and that asking for help was difficult. Smaller proportions
(between 6 and 16%) provided negative evaluations of their supervisor, indicating
their supervisors were not encouraging, not someone they could trust, or indifferent
about helping solve problems. Combining responses, over 50% of the sample
responded negatively to at least one of the six statements.
Reviewing workers’ satisfaction levels, we also gained interesting insights.
Though average satisfaction with the job, supervisor, and workplace environment
was quite high (over half reported being extremely satisfied), satisfaction with
wage levels were much lower. More than half were either somewhat or extremely
dissatisfied.
We learned that workers’ expectations were substantially higher than the realized
wage hike: they expected a hike that was roughly three times the size of the actual
increase. On average, workers expected to earn about USD 17 (16% of total salary)
more per month than their realized wages.
Further analysis, combining administrative data on retention, revealed that the
effects of the voice intervention were strongest among the most disappointed.
Individuals who were disappointed by the wage hike were more likely to quit,
but the voice intervention was particularly able to lower quit rates among them. At
the average level of wage disappointment (USD 17), those who received the voice
intervention were 19% less likely to quit than the control group. For those who
were not disappointed at all, the intervention had no statistically significant effect.
This set of results (see Fig. 13.5) suggests that the survey voice intervention worked
primarily by mitigating disappointment.
3.2 Experiment No. 2: An Off-the-Shelf Software Solution
Encouraging results from the first experiment led us to a partnership with the
Children’s Place, a clothing company, to test an existing worker engagement
technology platform, called WOVO by Labor Solutions. Through interviews with
various stakeholders, we learned that worker voice was undermined by the negative
repercussions of raising complaints and the weak accountability for complaint
resolution by management. These trends demotivated workers. In addition, existing
grievance mechanisms at Shahi Exports (such as suggestion boxes and worker
committees) either lacked anonymity or offered no mechanism for ensuring feedback to workers on the status of complaints. WOVO provided both anonymity and
accountability.
336
A. Adhvaryu et al.
a
Would talk to supervisor
about leaving
Agreement with Statement
Supervisor would
advocate for me
Supervior interested
in helping
Supervior encourages
me
Not difficult to ask
for help
Mistakes not held
against me
0.00
0.25
0.50
0.75
1.00
Proportion
Strongly Disagree
Disagree
Neutral
Agree
Strongly Agree
b
Satisfaction With:
Workplace environment
Supervisor
Current wage
Current job/position
0.00
0.25
0.50
0.75
1.00
Proportion
Extremely
Dissatisfied
Somewhat
Dissatisfied
Somewhat
Satisfied
Extremely
Satisfied
Neutral
Fig. 13.4 Employment satisfaction survey. (a) Plot 1: evaluation of job conditions and supervisor
characteristics. (b) Plot 2: satisfaction levels
13 Amplifying Worker Voice with Technology and Organizational Incentives
337
Fig. 13.5 Quit share over time for treatment and control groups
Fig. 13.6 Attrition outcomes
The platform is built as an SMS-based worker grievance redressal tool, which
1) allows workers to anonymously submit messages (questions, grievances, or
suggestions) via SMS (or the WOVO smartphone application) and 2) provides
management with a dashboard to respond to manage and gather data about
such communication. Our experiment was again designed as a randomized trial,
randomizing 7,500 workers in two Shahi factories into either treatment or control.
338
A. Adhvaryu et al.
The treatment group was formally registered on the WOVO platform and received
user training. The control group had access to the tool and could submit grievances.
However, they were neither formally registered on the platform nor did they receive
user training.
This study was designed to minimize the threat of spillovers between treatment
and control groups. Manufacturing in the garment industry is organized in assembly
lines, consisting of 50–70 workers arranged in sequence. Workers are often shuffled
between lines. Together, these conditions would have created resentment if some
workers were provided with access to a service like WOVO, and others had the
service withheld (and only learned about it indirectly). To address this, we sent the
treatment group private reminders via SMS, encouraging them to use the tool. No
reminders were sent to the control group. This drove variation in tool usage between
treatment and control group and helped estimate impact.
To study the impact of WOVO on business and social outcomes, we collected
survey data and analyzed administrative records. Enumerator-led surveys were used
to capture self-reported measures of worker well-being. More than 2,600 workers
were randomly selected for survey follow-up, across treatment and control groups.
The survey modules captured worker demographics, satisfaction level, mental health
challenges, types of grievances and their redressal, and phone availability and usage.
We did two rounds of surveying: at baseline, before the start of the intervention, and
at end line, 7 months after the start of the WOVO program. Administrative data
included measures of worker productivity, retention, and absenteeism.
In the first experiment, every study participant got an opportunity to answer the
survey, which can be interpreted as 100% utilization; in the second experiment,
the utilization rate for the technology was just 4.69%. Nevertheless, the results
from the second experiment show reduction in absenteeism and attrition across
the study population. Absenteeism was reduced by 5% in the treatment group, on
a base monthly absenteeism rate of 9.6% in the control group (see Table 13.1).
We find that the attrition was 6–10% lower in the treatment group compared to
the control group, though these results are not precisely estimated (they are only
significant at 10% level for one of the specifications). We interpret this as the impact
of access to the tool, irrespective of use. This suggests that the impact of the tool is
largely delivered by having the option (i.e., access to feedback) rather than by actual
grievance redressal.
During the evaluation period, a total of 354 cases were registered in two factories,
representing a ninefold increase in utilization compared with the suggestion boxes
posted in factories (which had a utilization rate of 0.52% in the same period).
Treatment group workers used the SMS tool about four times more compared to
control group workers.
Worker surveys recorded significantly higher trust in the tool among the treatment group. Among treated workers, 84% were aware of the tool, and 92% of all
cases registered through the tool were from this group. In comparison, only 55%
of workers in the control group were aware of the tool, and only 8% of all cases
received were sent by this group. User training and (SMS) reminders administered
13 Amplifying Worker Voice with Technology and Organizational Incentives
339
Table 13.3 Effects of treatment on absenteeism
Treatment
Observations
Control Mean
Individual Controls
Absenteeism
(1)
−0.0046**
(0.0021)
51943
0.096
No
(2)
−0.0044**
(0.0021)
51943
0.096
Yes
Notes: Standard errors (clustered at worker level) in parentheses. * p < 0.1, ** p < 0.05, and
*** p < 0.01. “Individual controls” include fixed effects for age, tenure, and education categories
(including a “missing” category). “Control Mean” is the mean of the dependent variable among
control group workers.
Columns 1–2: The unit of observation is the worker-month, restricting to months during the
experimental period. Both regressions control for the worker’s average pre-treatment absenteeism,
strata fixed effects, and month-year fixed effects (Fig. 13.6).
Table 13.4 Analysis of case types
Consolidated Suggestions of all Divisions of (January–December 2018)
Types of complaints/Divisions
KNITS
KPD
LSD
Workplace Harassment/Verbal Abuse
143
18
47
Sexual Harassment
23
0
12
Salary / OT cases
2
1
0
In-disciplined Behaviour
10
0
11
Suggestions
7
1
0
Infrastructure related issues
2
0
2
Total
187
20
72
MNB
108
11
12
12
14
1
158
Total
316
46
15
33
22
5
437
to the treatment group were able to strengthen trust in the tool by 2%, driving a
fourfold increase in utilization.
A summary of the different types of cases registered on WOVO during the study
is shown in Table 13.3. The data have been aggregated from WOVO’s raw output
and cleaned to remove any test cases by Labor Solutions and Shahi. The greatest
number of cases was about provident funds and banking, which are considered to
be questions rather than grievances and are not usually considered to be urgent. This
suggests that workers leveraged the tool to share routine issues. However, some of
these issues require workers to physically visit HR and are out of the purview of
HR’s control, e.g., receiving checkbooks or linking mobile numbers to their bank
accounts. Nevertheless, WOVO is a useful way to record and track these issues to
build a collective case for action (Table 13.4).
GBL invested heavily in qualitative data collection in this study. In a series of
interactions with HR managers in the two factories, the team captured rich details
on the experience of implementing and using WOVO. Fifteen HR team members
were involved in this study; they found the dashboard relatively easy to use and were
comfortable using SMS to communicate with workers, ranking it at 4 on a scale of
1–5 (5 being easiest). One-third of the HR staff felt that the type of complaints was
340
A. Adhvaryu et al.
different than they were used to, suggesting that workers might be using WOVO
to report issues that they didn’t report earlier. Around one-third felt that the total
number of complaints through offline mechanisms (like suggestion boxes) had also
increased, while 55% felt no change in the number of complaints they had to resolve.
More than half felt an increase in their workload due to the tool, since it involved
cases that could have been resolved more efficiently if the worker came to speak with
them directly (e.g., workers using the tool to enquire about their provident fund may
not have provided enough details, like employee codes, in the SMS; this created a
communication lag of several days, which delayed processing; when workers drop
by the HR office, these issues can be resolved within minutes).
In terms of interpersonal relations within the HR team, 26% felt that relations
with their superiors improved, mainly due to transparency of the process. However,
13% felt that due to the expectation of resolving grievances quickly, relations
worsened. Over half felt that the tool brought about a positive change in the HR
culture, one-third felt that work culture remained the same, and 6% felt it had
deteriorated the culture. They felt an increase in the need to actively solve grievances
and experienced a better connection with the workers.
With respect to utilization of the service, we realized that restricting communication to only SMS service, as permissible on the WOVO platform, was suboptimal,
given the limited (digital) literacy of the workforce. In our baseline survey, we
found that only 45% of workers owned smartphones, and only 54% had completed
high school. Most workers owned and used feature phones. Strictly, SMS-based
communication further affected each step of the user journey. For example, workers
use Roman and regional language script depending upon the configuration of their
feature phones. As per tech specifications, 1 SMS = 150 Roman alphabets = 90
regional language alphabets. Thus, each grievance could take up to 2–3 SMS, and
each SMS could cost 0.5–1 INR. The costs can double quickly if back and forth is
needed to resolve a complaint, discouraging workers from reporting sufficiently or
reporting at all.
The consensus among managers was that existing job roles of floor managers
needed to be leveraged to troubleshoot and increase the speed of the redressal
process. For example, if a manager is responsible for handling canteen-related
complaints, then that manager needs to be involved in the resolution process for
related complaints. This decentralized troubleshooting would enable smoother and
quicker grievance redressal and seemed preferable than having a single centralized
“super administrator” for a factory.
Usage climbed once workers developed trust in the service. Historically, traditional grievance management systems together brought in 400–500 cases in
3–4 months across all 60+ factories. With WOVO, across just two factories, the
increase in registered cases was sizable, with over 300 cases lodged in 7 months. In
collaboration with ex-labor officers and legal experts, GBL designed and delivered
capacity-building workshops to the management, in order to resolve and manage the
increased caseload efficiently and effectively.
Managers felt that the tool brought workers closer to the management, yet they
underscored the need for an incentive system to encourage managers to execute
13 Amplifying Worker Voice with Technology and Organizational Incentives
341
the tool properly, including taking action on incoming grievances. To this end, they
suggested introducing nonmonetary incentives, alongside the tool.
3.3 Experiment No. 3: A Custom Solution
After two (impactful) experiments with our research team and with intensifying
dialogue about worker engagement, Shahi became committed to the idea of transparent, digital worker management communications. However, the implementation
of WOVO highlighted key areas where the product fell short of Shahi’s needs,
including incompatibility with voice call features and the high per-worker cost of
subscription to the software platform. With Shahi’s scale (employing more than
100,000 workers), a subscription service would be a large recurring cost for the
business and likely unsustainable. Thus, while there was buy-in from management
to implement digital tools, it made sense for Shahi to develop a custom software
solution for its 60 factories, tailored to the realities of the Indian garment industry.
Shahi asked our design team to develop a worker voice solution from the ground up.
We undertook several qualitative methods to approach the design and functionality of the tool and its implementation strategy. The first step in this process
was to understand user behavior, for both workers and managers. We dug deeper
into Shahi’s macro-environment to map stakeholders’ incentives, motivations, and
commitment to worker voice. We looked at benefits and limitations of the existing
mechanisms a worker has access to, to report grievances or suggestions or ask
questions at work. We used design thinking methods to learn about the problems
workers face at the workplace and understand what holds them back from sharing
their grievances. We mapped a day in a worker’s life, especially the highs and lows
in a typical day, conducted in in-depth one-on-one and group interviews; tried to
gauge how they feel through empathy maps; and assess how they respond to stressful
situations (described in detail under Sect. 2).
To provide access to more workers and in turn drive utilization, there was
consensus to build a voice call feature, along with messaging feature, to report
grievances. There were, however, two options to operationalize it. First, through
interactive voice response (IVR) by staffing a call center, centrally or in an individual
factory, that can receive and respond to grievance reporters (workers) in real time.
Having a person at the other end to record grievances would ensure a better
experience for workers and clear reporting. A central call center would be less costly
and efficient than a factory call center, but a factory call center would be preferred
with regard to language, context, and access to sensitive data.
The second option was to have separate phone lines for different factories through
which each grievance is recorded as voicemail which will be transcribed by a
designated staff member during office hours. With this option, workers will still be
able to send queries 24×7, but management would only be able to respond during
business hours.
342
A. Adhvaryu et al.
We decided to go with the second option because, if IVR was leveraged, a worker
would be instructed by a computer-generated audio to register their complaint under
the right category and subcategory; for example, press 1 to register a complaint
regarding the Canteen, and press 2 to select subcategory. Given that we have eight
case categories and 25+ subcategories, from a behavioral perspective, we deemed
this could create frustration among workers who are incidentally in a distressed
state when they call. In addition to that, the attrition rate among production workers
stands at 8–10% per month, so technically, after a year, there is a new cohort of
workers on the shop floor. After leaving the factory, most workers are supposed to
receive their provident fund1 (PF) and other savings, implying that a huge number of
cases that a factory receives are related to PF, gratuity, etc., and these cases are most
efficiently handled by direct factory representatives. Moreover, workers frequently
change their phone numbers making it harder to track their complaints. Thus, the
decision to provide a separate phone number (option B) to each factory would
provide a single point of (familiar) contact in the factory to each worker and would
facilitate an understanding of the pattern of such cases in each factory. This choice
facilitated accurate mapping and tracking of factory-specific cases, allowed us to
design a pertinent performance incentive model for HR (covered presently), and
led to devising a decentralized grievance management, which meant that individual
factory management would be responsible for managing complaints received from
its facility, in effect empowering and encouraging management in the respective
factories.
Keeping in mind the low worker literacy, including digital literacy, and minority
ownership of smartphones among workers, we realized that the tool needed to be
accessible outside of an Android or iOS ecosystem. Multiple regional languages
are spoken across different states in India. For example, in Karnataka, 58% of the
workers speak Kannada, 15% speak Hindi, 9% speak Oriya, 5% speak Tamil, and
8% speak Telugu. This meant that the tool needed to be compatible with all local
languages spoken by workers in a factory.
To improve uptake and buy-in from factory managers, we worked with them
to design the dashboard for our tool. We leveraged their familiarity with online
platforms such as Facebook and G Suite to build a familiar and easier dashboard
user experience. For example, the user interface is inspired from the habits of the
software user on social media platforms, e.g., uploading a document in the evidence
section and ability to comment.
Software or digital tools are revered for bringing transparency and accountability
in the reporting process; however, an important factor in the success of any grievance
1 Provident fund (PF) is an investment fund contributed to by employees, employers, and
(sometimes) the state, out of which a lump sum is provided to each employee on retirement. Many
workers leave their jobs after 5 years of service, at which point they are entitled to PF and gratuity
benefits. Recent guidelines by the Government of India suggest linking of bank and PF account
number to Aadhar Card, PAN Card, and mobile phone number. Sometimes, this process proves to
be a pain point for workers. Hence, we consider issues related to PF and other schemes as major
severity cases.
13 Amplifying Worker Voice with Technology and Organizational Incentives
343
management system is building trust through timely case resolution. To facilitate
this, we made sure that grievance handlers are notified, via email, as soon as a
new case is received on the portal. To bolster accountability and action, regular
performance review reports are generated and shared with factory heads, overseeing
grievance redressal. This ensures that cases are resolved within a stipulated time and
workers get regular updates on the status of their complaints.
To further tackle concerns regarding timely resolution and accountability among
managers, we designed performance-based incentives for grievance handlers, an
idea that was suggested by the HR itself in the qualitative findings from our
second experiment. The incentives were nonmonetary in nature because (a) there
are multiple programs that run in these factories at any given time, now and in the
future, and providing monetary incentives for one particular program might affect
expectations of future programs as well, and (b) we wanted to develop a sustainable
model that can be easily replicated in other factories. In fact, literature supports the
idea of nonmonetary incentives as being effective in increasing performance among
employees as discussed by Sonawane (2008) and Sorauren (2000).
Factory representatives shared that recognition and acknowledgment of their
efforts by peers, workers, and senior management were a credible motivator.
Suggested nonmonetary incentives were achievement certificates, free dinner for
family, a recognition email by factory heads, etc.
Finally, we came up with a nonmonetary individual performance review system,
which was, however, ceded for team incentives that the management found to work
better as it was a team effort (Bandiera et al., 2009; Hamilton, 2003). Moreover,
healthy team dynamics was favorable to remove the problem of free ridership and
ensure within motivation rather than it being enforced on anyone by their superiors.
Another critical element to build trust in the process was to ensure that the quality
of grievance redressal was up to the mark. To this effect, we introduced certain
parameters like tone of conversations with the workers and quality of evidence
uploaded on the tool. This reduced subjectivity in quality testing and enabled quality
checkers to decide whether the case was resolved in a satisfactory manner or not.
If not, they had the option to reopen that case, which would subsequently affect
factory’s performance incentives. For example, if the number of cases reopened for
a particular factory in a month exceeds 10% of total cases, the factory loses out on
incentives for that month.
All these shared insights from the design exercise, along with the learnings from
the prior experiments, guided the development of our homegrown worker voice
solution, Inache (Fig. 13.7).
Inache is a two-way communication tool for workers to anonymously communicate grievances and suggestions via SMS or call to the management. Incoming
grievances are managed on the Inache dashboard by a management representative
group in a factory, called the grievance handling team or the resolution team. This
team is made up of case reporter (CR), case manager (CM), and case troubleshooter
(CT). CR is responsible for transcribing and interpreting the voice note or SMS
received on the dashboard; this process generates a case incidence report (CIR).
344
A. Adhvaryu et al.
Fig. 13.7 ToC worker voice tool
Worker
Worker registers case
via SMS/Voice Call
Case Reporter
Case Manager
CT1
CT2
CT3
CT4
Two way communication
between worker & CTs
Case Troubleshooters
Fig. 13.8 Journey of a case in a factory
Once a CIR is prepared, the case is transferred to the CM who then assigns the case
to a CT, well positioned to resolve the grievance (Fig. 13.8).
To ensure timely resolution and accountability among managers, we have
designed team performance–based incentives. Workers and managers are given user
training and related information on Inache during induction sessions preceding its
rollout. We have set parameters in place to test the quality of grievance redressal. In
fact, the software automatically generates performance reports in real time; it also
alerts if any predefined tolerance levels of quality are breached.
13 Amplifying Worker Voice with Technology and Organizational Incentives
345
3.4 Limitations and Future Developments of Inache
Currently, the software (HR dashboard) is only supported on the web and optimized
for a desktop computer. Most users like case managers and troubleshooters,
however, spend the bulk of their time on the shop floor, preventing them from
engaging with the tool when they are not in front of their computers. Hence, there is
a need for a mobile optimized version, which simultaneously calls for looking into
data security for when the user is not in factory premises or the handheld device is
not in the user’s possession.
Further iterations could include an artificial intelligence-based chatbot, which
is capable of understanding different accents and of resolving simple, day-to-day
grievances, like how many number of leaves are pending for a worker.
Having interactive kiosks for workers in the factory can drive engagement,
providing a friendly touch point for workers, since they are familiar with ATM
kiosks. These kiosks can be placed near medical facilities, HR offices, canteens, etc.
While having kiosks in the premises takes away from the perception of complete
anonymity, we believe that workers will be willing to use them to register those
grievances, which do not jeopardize their safety, for example, banking- and salaryrelated cases, which cannot be solved without details of the worker, and cases related
to canteen, maintenance, etc. Furthermore, having kiosks in the premises can serve
as a reminder for the existence of Inache and can signal management’s commitment
to worker voice. Having said that, we will work toward designing best practices,
placement of the kiosks, and user interaction to provide maximum anonymity.
We piloted Inache in three factories for 4 months before the final rollout, in which
we tracked (a) number of cases registered daily; (b) average time taken for the case
to travel from one team member to another, i.e., from case reporter (CR), to case
manager (CM), to case troubleshooter (CT); (c) average time taken to respond to
the worker; and (d) average time taken to resolve the issue and close the case in the
dashboard.
The decentralized grievance management required 4–10 people to be a part of
the resolution team in a factory. Faced with paucity of manpower, we decided to
roll out the main intervention in a phased manner. The first phase involved those
factories where sufficient staff existed to handle the tool rollout and where no new
hires would be necessary. The second phase involved the remaining factories where
new hires would be needed.
Real-time feedback from the users – case reporter (CR), case manager (CM),
and case troubleshooter (CT) – in pilot factories helped strategize the composition
of grievance handling teams in each factory, depending on its size (number of
workers) and design user (CR, CM, CT) training modules. To select the respective
grievance handling teams, we created a core committee of senior members from the
OD team, allocating each one of them a cluster of factories. This committee was
then responsible for nominating suitable candidates from each factory to work on
case resolution and giving them user training.
346
A. Adhvaryu et al.
Hackathon
During phase two rollout, we organized a 2-day hackathon with all the
stakeholders involved in the implementation of the tool to highlight the issues
they were facing and discuss potential solutions. The goal of this exercise was
to learn about their day-to-day usage of the tool and identify the need to refine
features and develop a standard operating protocol for the users. We learned
the following:
• Workers were testing out the tool by sending in greetings like “hi,” “hello,”
“hey,” and “good morning.” This made it difficult for grievance handlers
to interpret it or decide if they needed to respond. Not responding could
breed distrust among workers.
• While using the voice note feature to send in grievances, some workers
misunderstood the feature to be a customer support-type service and kept
waiting for someone to assist them on the other end.
These issues were overcome by giving live demos to around 35,000
workers and explicitly mentioning that the voice note feature was simply
another way of sending a message, not a customer support service.
To measure the social and economic impacts of our technical innovation (Inache)
and the implementation strategy, we designed a randomized controlled trial. This
experiment spans 42 factories which will be divided into the following groups: (1)
pure control group: this cluster of factories maintains the status quo, i.e., they do not
get the tool, user training, or performance incentives for the managers; (2) grievance
tool–only group: this treatment group gets access to the tool and user training for
workers; and (3) grievance tool and incentives group: this treatment group gets the
whole suite of services, i.e., tool, user training, and performance incentives for the
managers. The intervention is at the factory level, in which each worker in a factory
gets access to the treatment/control assigned to that factory.
To measure worker well-being outcomes, we will survey randomly selected 36
workers from each factory on themes, such as loyalty toward the company, feedback
on their supervisors, workplace satisfaction, trust on redressal mechanisms, and
availability of outside job options. To measure business outcomes, administrative
data on productivity, attrition, and absenteeism will be collected and tracked.
Challenges with Worker Surveys
Our worker well-being outcomes are primarily informed by one-on-one
surveys with workers. In prior experiments, we have found that the majority
of responses by workers have been tipped toward a positive/favorable scale.
(continued)
13 Amplifying Worker Voice with Technology and Organizational Incentives
347
To understand what might be leading up to this, we piloted various versions
of the survey on the field – ranging options from five-point Likert scale to
three-point Likert scale and from human face emojis to WhatsApp emojis –
to elicit honest responses. Out of these piloted versions, we have found the
three-point scale WhatsApp emojis to work the best:
The physical survey environment also played a major role in this decision –
most surveys are conducted inside the factory, albeit in a separate room away
from their supervisors and fellow workers, and we found that it was easier
for workers to point to the appropriate emotion rather than saying the option
out loud, especially if they had an unfavorable opinion about their workplace,
wages, supervisors, etc. Additionally, we kept the questionnaire short (about
15–20 min) to make sure we minimize survey fatigue among workers and
surveyors.
We trained surveyors in this new style of questioning by using sample
questions/scenarios so that the surveyors knew how to present various options
to the worker.
The experiment is still underway at the time of preparation of this chapter. Inache
has completed 7 months in the treatment factories, and while we cannot talk about
its impact on workers and business right now, as of October 2020, the cumulative
utilization rate (total cases/total workers*100) is at 3.19%, and more than 2000 total
cases have been received from a total of over 60,000 workers.
At this stage, it is useful to bring the reader’s attention to the lesser absolute
number of the utilization rate in this experiment compared to the second experiment
(utilization rate of 4.69%). While the present number is smaller, it is not necessarily
indicative of lesser impact. Firstly, the context of the two experiments is vastly
different; the second experiment was situated in the factories in a northern Indian
state, while the current one is situated in the southern states, implying innumerable
differences in the types of issues faced at the workplace, gender and social norms
and language and ethnicity, among others. Next, until early February, only phase
one factories, i.e., a total of 14 factories and 38,000 workers, had access to the
tool, so the utilization rate takes the denominator 38,000. As shown in the graph,
between the start and early February, the utilization rate went up at first with the
access to a better tool but later came down as one-time or irregular issues were
resolved satisfactorily. Post February, the tool was rolled out in phase two factories
also, and the denominator for calculating the utilization rate took the value of 65,000
(all workers). The second wave of drop in utilization rates around March–April was
seen due to a COVID-induced nationwide lockdown, and since then, however, the
utilization has been increasing.
348
A. Adhvaryu et al.
Utilisation Rate
0.70
0.60
0.50
0.40
0.30
0.20
0.10
0.00
Late Nov
Dec
Jan
Feb
Mar
Apr
May
Jun
Jul
Aug
Sep
Oct
The pandemic has certainly heightened worker anxieties by introducing numerous uncertainties, and it poses a big challenge for our work. It might impact
the outcomes of our study both directly (attrition due to reverse migration) and
indirectly (anxious workers with low productivities). Even barring COVID, we need
to investigate how to justifiably calculate the impact of the tool – which questions to
pose, which metrics to track, etc. We need to probe how to interpret the utilization
numbers in terms of tool effectiveness and which matrix to use for measuring the
effectiveness.
The theory of change suggests that deploying an anonymous grievance redressal
tool will encourage more workers to submit suggestions, queries, and complaints.
Assuming Shahi continuously monitors the implementation and managers’ incentives are well aligned, higher usage by workers could drive responsiveness and
redressal by managers, thereby increasing workplace satisfaction among workers.
Moreover, the results from the earlier experiments suggest favorable business impact
of voice, like reduced attrition (Adhvaryu et al., 2019) and reduction in absenteeism
(Boroff & Lewin, 1997). If proven, this project has the potential to provide a positive
return on investments for Shahi and will be a testament for adoption in wider
industries as well.
4 Lessons Learned
It is valuable for businesses to provide its workers an opportunity to voice, and
technology can make this possible by bringing transparency, anonymity, and speed.
We witnessed this firsthand when comparing the analogue heavy-handed “employee
satisfaction survey” from the first experiment to a digital solution employed in the
latter experiments.
13 Amplifying Worker Voice with Technology and Organizational Incentives
349
During the second experiment, we realized that without contextual understanding, it is challenging to choose an appropriate technology suitable for workers in
the low-income setting. In addition to that, scaling existing worker voice solutions
in the market was not feasible because of high subscription fees or the technology
not best suited to our context. So, we decided to develop the solution in-house.
Given the scale of Shahi, employing upward of 100,000 workers in India, the costs
of developing its own solution seem justifiable. But we couldn’t have ruled out the
existing solutions or undertaken a successful innovative feat if we had not engaged
in rigorous, early-stage experimentation.
This endeavor led us to ask important questions, which a solution must answer
to be able to fulfill the needs of the workers and the business. What’s in it for
them? Value proposition for each stakeholder is different and needs to be prepared
and communicated aptly. Our bottom-up approach to development, which touched
stakeholders from all levels, yielded a sense of ownership among them, playing an
important, mostly favorable, role in case resolution and Inache’s sustained use. We
observed the constraints workers face and how their reporting behavior changes in
the advent of worker voice technology, and we carefully studied the role of the
employer, specifically HR, in influencing this behavior. In the process, we also
realized that simply developing a technical solution would not adequately address
the more fundamental issues around trust, accountability, quality, and incentives.
Therefore, our offering extends to other processes of grievance management than
just reporting, recording, and tracking architecture, with, namely, team-based
performance incentives for the management and quality control benchmarks.
Gender
The garment industry in countries like India and Bangladesh faces a particular
conundrum – even though the majority of the workforce it employs is
women, one rarely sees women in higher managerial positions. This trend
is a consequence of prevailing gender norms and patriarchal inertia in such
regions. Most of the women start and end up as frontline tailors. This
disproportionate gender representation at managerial levels affects a factory’s
culture – it dampens career aspirations for women and often perpetuates a
culture of discrimination in the industry. In such a gendered environment, the
role of a communication tool like Inache is to give voice to these women
workers. The ability to express themselves, air out their grievances, and hold
their supervisors accountable is an effort to address the challenges that larger
structural hierarchies pose. Inache, as a worker voice communication tool,
becomes an enabler for workers to access systems that are designed to provide
aid and support them.
350
A. Adhvaryu et al.
Pivots
Two-way communication and anonymity are the biggest incentives for workers to use worker voice technologies as an alternative to traditional grievance
redressal mechanisms like suggestion boxes. There exist several worker
voice technological tools; one such tool, WOVO, was evaluated by GBL.
This evaluation established the necessity and importance of worker voice
interventions in a factory setting. However, the evaluation also highlighted
the limitations such technology poses because it was not developed keeping a
factory setting in mind. The evaluation brought forth the challenge of limited
penetration of technological literacy among the workers. In our baseline
survey, we found that only 45% of workers owned a smartphone and 54%
of workers had a high school diploma. Another limitation of such tools is
that their expense is often not sustainable for a company of Shahi’s size and
capacity. The only way to move forward and inculcate the use of worker
voice technologies within factory settings is to design a tool, keeping the
factory ecosystem in mind. To this end, a voice call feature was included
for workers who did not feel comfortable sending SMSs. Additionally, the
low-level technological design of Inache meant that it could be used on basic
feature phones as well.
A Day in the Life: Stories from Two Garment Factory Workers
Financial strain is often felt more by those under the pressure of time.
Devi (name changed to preserve anonymity) called Inache helpline number
with one such grievance over her provident fund (PF) loan. She recounts in
disbelief how fast she received a confirmation message replete with a case
number to identify her issue, sans any lag. For workers like Devi, getting used
to procedural delays is almost a survival tactic, but its absence, she candidly
shares, brought solace, long before the issue was resolved. Within 2 days of
registering her grievance, she received a message asking her to share further
details. Soon after, she was requested by the HR department to meet the
accounts department who resolved all her queries on the pending PF Loan.
Paperwork followed, and within a week, her need, urgent at the time, was
resolved on priority.
Day-to-day issues, though minor, can pile up and become a cause of
great distress. Sheila (name changed to preserve anonymity) shares how she
requested for an extra trolley in the dispatch department through the Inache
helpline number. The HR department followed up the next day, understood
her requirements, and made the necessary arrangements within a few hours.
Sheila was elated with the timely resolution – it made her work easier,
(continued)
13 Amplifying Worker Voice with Technology and Organizational Incentives
351
increased her trust and reliability in the system, and improved her appreciation
for the employer.
Changing Technology and Political Landscape
The mobile technology landscape in India is under rapid transformation today.
While some changes affect us favorably, others could necessitate overhaul
of our service offerings. Hereunder, a few key macro-level developments are
mentioned that are currently underway. It remains to be seen how they will
affect the development of our new marketable versions:
• In India, the telecom market is a red ocean, where different players try to
outcompete with each other through price. Every month, telecom operators
come up with new data and voice call plans. This is especially attractive
to low-income populations that are highly price-sensitive, thus switching
from one operator to another in a short span of time. This is a major issue in
maintaining a stable worker master data, which maintains workers’ phone
numbers that are registered in the Inache platform. When a worker instead
chooses to use a new, unregistered phone number to file a complaint, it
could create confusion about the authenticity of the cases. We tend to
receive many cases from unregistered phone numbers. To overcome this,
we try to frequently update the worker master data. We also try to keep
workers informed about the importance of maintaining the same phone
numbers for longer periods during training, and we even do short refresher
training frequently to this effect.
• Today, prices of feature phones and smartphones are comparable. Google
has introduced low-cost Android Go-powered smartphones for emerging
markets like India. Despite this, smartphone adoption rate among women
remains low in India because the decision to buy (or not buy) a smartphone
still rests with the head, primarily husband or father, of the family who
perceive it as an item of leisure. Low smartphone penetration prevents
us from leveraging mobile applications, which could be instrumental
in creating a more engaging platform for workers. If during the RCT,
which is underway, a majority of Shahi’s workforce switches to owning
a smartphone, we will look into developing a mobile app for Inache.
• Recent developments in the telecom industry in India, for example, the rise
of Jio and merger of Idea-Vodafone, have affected the quality of phone
services in general. Telecom is moving from 2G/3G to 4G, while the
adoption rate of 4G phones is really low among our targeted population.
This means that most workers are using 2G/3G phones with teleservices
that are 4G phone compatible. This adversely affects the SMS delivery rate,
(continued)
352
A. Adhvaryu et al.
with approximately 70% success. While there is not much we are able to
do to tackle this right now, we are looking into other network providers,
which have better success rates.
• The Telecom Regulatory Authority of India (TRAI) regulates the telecommunications sector in India. According to which, an enterprise is not
permitted to receive and send an SMS from the same phone number. This
means that the phone number, which the worker uses to report grievances,
cannot be used by the factory to contact the worker. Instead, the factory
has to use a different phone number to respond, which we eventually did,
and this can lead to confusion and apprehension among workers. We try to
inform workers of this peculiarity, via demonstrations, during the training
sessions.
Discussion Questions
1. Why does the problem of trusted communication mechanisms on factory floors
still exist? What other solutions or mechanisms could accentuate Inache’s
intended outcomes?
2. What are the pros and cons of decentralized grievance management mechanism?
3. Suggest some innovative ideas to utilize technology in low tech literacy
contexts.
4. Discuss monetary vs nonmonetary incentives for case managers.
5. Discuss additional hypotheses/treatment arms which can be tested in a similar
setting.
6. Can you draw any parallels between enabling voice on the factory floor and
enabling voice in your own university/work setting? What has/has not worked
for you?
7. In the system of factory communication, can you identify negative and positive
loops that either curb or enable worker voice?
8. Beyond business returns highlighted in this case study, can you identify some
inherent moral reasons for enabling worker voice?
9. What could be a better approach to introduce digital tools to this population
(workers and managers)?
10. Can you imagine any spillover effects on other areas, not already mentioned, of
using Inache in this setting?
13 Amplifying Worker Voice with Technology and Organizational Incentives
353
References
Adhvaryu, A., Nyshadham, A., & Tamayo, J. A. (2019). Managerial quality and productivity
dynamics. No. w25852. National Bureau of Economic Research.
Ashraf, N., & Bandiera, O. (2018). Social incentives in organizations. Annual Review of Economics, 10, 439–463.
Bandiera, O., Barankay, I., & Rasul, I. (2009). Social connections and incentives in the workplace:
Evidence from personnel data. Econometrica, 77(4), 1047–1094.
Hoffman, M., & Tadelis, S. (2018). People management skills, employee attrition, and manager
rewards: An empirical analysis. No. w24360. National Bureau of Economic Research.
Expectations, Wage Hikes, and Worker Voice: Evidence from a Field Experiment-Achyuta
Adhvaryu, Teresa Molina, Anant Nyshadham (2019). https://www.nber.org/papers/w25866.pdf
Boroff, K., & Lewin, D. (1997). Loyalty, voice, and intent to exit a union firm: A conceptual and
empirical analysis. Industrial and Labor Relations Review, 51(1), 50–63.
Sonawane, P. (2008). Non-monetary rewards: Employee choices & organizational practices. Indian
Journal of Industrial Relations, 44(2), 256–271.
Sorauren, I. (2000). Non-monetary incentives: Do people work only for money? Business Ethics
Quarterly, 10(4), 925–944.
Open Access This chapter is licensed under the terms of the Creative Commons Attribution 4.0
International License (http://creativecommons.org/licenses/by/4.0/), which permits use, sharing,
adaptation, distribution and reproduction in any medium or format, as long as you give appropriate
credit to the original author(s) and the source, provide a link to the Creative Commons license and
indicate if changes were made.
The images or other third party material in this chapter are included in the chapter’s Creative
Commons license, unless indicated otherwise in a credit line to the material. If material is not
included in the chapter’s Creative Commons license and your intended use is not permitted by
statutory regulation or exceeds the permitted use, you will need to obtain permission directly from
the copyright holder.
Part IV
Water, Health, and Sanitation
Ashok J. Gadgil
Introduction
Water, Health, and Sanitation are central to human well-being. All three were
historically seen as outcomes of economic development, rather than as drivers. So,
the earlier thinking was that when communities, countries, or populations become
(economically) prosperous, they will have enough surplus to pay for good quantity
and quality of water and obtain and maintain good health and good sanitation. In
a more modern view, good-quality water-health-sanitation are seen as drivers, not
outcomes, to get people out of poverty and ill health, and focused efforts on these
services are seen as an important part of global efforts to help communities escape
absolute poverty (World Bank, 2017; United Nations, 2004).
Furthermore, technology and innovation are disruptors that can sometimes
directly improve water-health-sanitation access, without waiting for communities to
first become prosperous. Directed creative technical efforts to improve water, health,
and sanitation can bring improvements in these services far quicker than the time
it might take for first improving general economic prosperity and then obtaining its
eventual results.
Of course, it doesn’t always work that way, and the efforts of the best minds and
the most motivated teams can be sometimes unexpectedly undercut by aspects of
the real world that were not considered relevant. Practice of the emerging discipline
of Development Engineering is full of such examples. I would argue that there are
two benefits that nevertheless come from trying: (1) so long as we are willing to
analyze, think through, and share the findings about the causes of failures, we all
can learn together, and our success rate will improve over time and (2) better to try
and fail, rather than get scared and not try at all. So long as we don’t make the same
A. J. Gadgil
Department of Civil and Environmental Engineering, University of California, Berkeley,
Berkeley, CA, USA
e-mail: ajgadgil@berkeley.edu
356
IV Water, Health, and Sanitation
mistakes again and again, we can hope to make fewer and fewer new mistakes and
reach at least partial, or even full, success.
The four chapters in this section provide first-hand examples from four different
decade-long projects in the Water-Health-Sanitation area. The narratives are complex and rich in content and have many lessons to take away, based on one’s prior
knowledge, perspective, and background.
The Chap. 14 by Gadgil et al. takes us along the invention, development, and
field testing of a novel technology, “ECAR,” from its beginnings in 2005 to its
demonstration plant that became operational and financially viable in 2016. Along
the journey, we learn how the authors recover from major and unexpected setbacks
and overcame several technical obstacles. They were also very lucky to successfully
find a funding sponsor to support the design, building, and commissioning of the
full-scale demonstration plant over a period of 3 years, from 2012 to 2015. The
chapter ends with an interesting twist. Although the multi-institutional consortium
sorted out the implementation hurdles, managed community engagement and handoff to industry, and successfully obtained the needed regulatory and business
permits, until 2021, till full 5 years of its successful operation were completed (both
technically successful and financially viable), the demonstration plant remained the
only plant of its kind in India, where almost 100 million rural people are estimated to
be drinking arsenic-poisoned water. So, the chapter ends with a bit of a puzzle – what
work remains, and what is still missing so that this and similar technical solutions
can rapidly go to scale?
The chapter by Daniel Wilson on measuring adoption of fuel-efficient cookstoves with digitally enabled sensors has several important lessons and remarkable
backstories compressed in its storyline. The most important lesson to me is the
relentless effort, resourcefulness, innovation, and patient hard work to get the
deceptively simple project in remote war-torn Darfur from A to B. The effort would
be only a an academic-year of effort for one or two students in a well-resourced
and peaceful setting; however, for this team, it extended into being a multiyear
effort for a team that required more than a dozen dedicated and talented team
members. What are the overarching takeaways from this chapter? Different people
will have different takeaways. For the author of this section introduction, there are
three. First, the chapter illustrates a core principle of good experimental science:
measure all key parameters in more than just one way if at all possible, so your
measured data does not fool you. In measuring adoption, for decades and decades,
field researchers have relied on social surveys. Only recently compact non-intrusive
sensors and data loggers became available and affordable. The team used both and
compared the results, and then they discovered that the social survey methods gave
hugely and consistently inaccurate data reflecting the biases of the respondents. The
physics-based automated sensors gave quite different answers to the same questions.
Second, the team compared social survey data collection via (1) laboriously writing
down answers by hand, and later transcribing these into a spreadsheet, versus (2)
having a smart handheld device on which the answers could be entered directly
during the interview to be transmitted wirelessly to a computer. And how did these
two methods compare? Despite being more tedious, tiring, and slow, the former
IV
Water, Health, and Sanitation
357
method yielded the same (erroneous) results as the handheld smart device. So,
here technology did not improve, or yield any advantage over, the tedious and
diligent data collection and data entry by hand. And third, I note with admiration
the resilience, the resourcefulness, and the breadth of creativity energy brought to
bear on sensor design, training of field workers, and software-based automation
in the analysis of massive amounts of collected data! Here technical ingenuity
shines and yields a completely unexpected insight – how a very slight “nudge”
from a pre-announced second visit by a field worker to a non-adopting household
greatly improved adoption of the stoves! Here, the massively rich data, its automated
analysis, and human behavioral insights in adoption all show their interplay!
The chapter by William Tarpeh et al. covers a period from about 2012 to the
present (2020, at the time of writing the chapter). It provides, at its very starting
pages, an excellent exposition of how to select and define a problem that is possibly
amenable to technology invention and innovation and will have globally significant
impact, particularly in resource-poor farming communities, on their agricultural
productivity. It goes on to describe how the team developed and explored two
competing pathways for capturing nitrogen from urine. These pathways were then
assessed for their cost and feasibility under real-world constraints in a developing
country context, for agricultural applications, in parallel providing local economic
activity and also addressing the problem of environmentally harmful uncontrolled
disposal of urine on the community scale. This compact but broad-ranging chapter
covers not just the progress of the work through the 8 years but also offers lessons
on building partnerships, teaches the relevant chemistry and chemical engineering,
presents a business model canvas for the product, and discusses paths for scale-up.
All in all, an exciting and exhilarating ride! For the truly outstanding aspects of the
journey (brought out in detail in the chapter narrative and also in the summarizing
bullet points at the end of the chapter) reflect the key strengths: a learning mind-set,
nimbleness, ability and willingness to pivot, resilience and flexibility in plans, and
opening up and exploring multiple pathways to get to the next stage so as to not hit
a blind alley in the journey! It is an inspiring chapter to read and an approach that
could be emulated at a high level in attacking some entirely different problem.
As Hyun et al. note in their chapter on NextDrop, the technology development
started with noticing a problem with intermittent piped water supply almost
universally experienced in urban India: the customers received the water only a few
hours per week but had no clear idea of when the water would start flowing through
their faucets. Thus, for vast majority of customers in this situation (i.e., those who
could not afford an overhead water tank in their loft or above the roof or lived
in flimsy housing that structurally could not support one), this meant waiting and
waiting for water to arrive. The smart solution thought of by NextDrop engineers
was to save their customers the uncertainty and the wait, by a collaboration with the
water supply utility workmen. In this model, NextDrop would send an SMS message
to tell the customers when the water was going to arrive. This worked well in the
small city of Hubli-Dharwad. However, when the company expanded operations
into the large metropolis of Bengaluru, a carefully conducted field evaluation by
independent researchers showed that the system did not work.
358
IV Water, Health, and Sanitation
The authors (who are part of the evaluation research team) take a deeper look
to understand why. They explain to us the relevant institutional linkages; organizational behavior; personal motivations of the water utility staff; the limitations
experienced by low-income households that often had only one cell phone per
family, cluttered with irrelevant marketing SMS messages; and the hassles of the
wage earner, who was daily traveling long commute distances, making it totally
impractical to rush back to catch the water as it arrived at the home faucet. The
chapter offers impressive lesson in how the best technical minds can miss serious
but non-technical roadblocks to their success and also how a careful evaluation of
the overall effort from an independent third-party research group can unravel the
mystery of an unexpected failure after an initial success. Given the complexity of
challenges in development engineering projects, analyzing and sharing failures and
their causes is key to learning by those who follow. The standard of publishing in
technical literature commonly is that success leads to a publication and failure is
written off to some bad luck, or market failure, and commonly remains not only
unpublished, but also poorly analyzed by the research team, and discarded. When
that happens, extremely valuable lessons are missed. It is a pleasure to see that is
not the case here.
References
United Nations. (2004). Safe water, sanitation fundamental for poverty reduction,
commission on sustainable development told. Press Release April 27, 2004.
Available at: https://www.un.org/press/en/2004/envdev772.doc.htm. Accessed
on 14 Dec 2020.
World Bank. (2017). Millions around the world held back by poor sanitation and
lack of access to clean water. Press Release August 28, 2017. Available at:
https://www.worldbank.org/en/news/press-release/2017/08/28/millions-aroundthe-world-held-back-by-poor-sanitation-and-lack-of-access-to-clean-water.
Accessed on 14 Dec 2020.
Chapter 14
Stopping Arsenic Poisoning in India
Ashok J. Gadgil
, Susan Amrose, and Dana Hernandez
1 Introduction and Overview
The World Bank defines absolute (i.e., near-destitute) poor as those who earned
less than USD 1.90 per day in purchasing power parity (PPP), in 2015 (Katayama
& Wadhwa, 2019). At that time, there were 736 million people on the planet in
absolute poverty. Of these, 24% lived in India (Sanchez-Paramo, 2020).
It is imperative to address problems that affect the poor by inventing, developing,
testing, and scaling up new technologies (elaborated further in the first four
chapters of this book). Often, these problems are unique or especially intense
to those in poverty. Efforts to solve the problems with novel technologies, unless
scalable and unless they take root in the local social system, are doomed to remain
small one-off examples (see an excellent critique of such approaches in Rybczynski,
1991). The technologies to address many of these problems are typically not
spillover technologies (such as solar photovoltaics (PV) or mobile phones), but
rather those which are targeted to their specific needs. If the world fails to respond
to these needs, new technologies may continue to increase the divide between the
rich and poor in the coming years, as suggested by the Human Development Report
(Conceição, 2019).
A. J. Gadgil () · D. Hernandez
Department of Civil and Environmental Engineering, University of California at Berkeley,
Berkeley, CA, USA
e-mail: ajgadgil@berkeley.edu; danaah@berkeley.edu
S. Amrose
Department of Mechanical Engineering, Massachusetts Institute of Technology, Cambridge, MA,
USA
e-mail: samrose@mit.edu
© The Author(s) 2023
T. Madon et al. (eds.), Introduction to Development Engineering,
https://doi.org/10.1007/978-3-030-86065-3_14
359
360
A. J. Gadgil et al.
An effort to solve one urgent problem afflicting hundreds of millions of these
people is described in this chapter. The period covered is from its beginning in 2000
up to its status in 2019.
This technology intervention is aimed at helping to end the arsenic poisoning
of about 200 million people who drink groundwater contaminated with naturally
occurring arsenic, at concentrations above its maximum contaminant level (MCL)
in drinking water. MCL levels for various contaminants in drinking water are
recommended by the World Health Organization (WHO) and set by national
governments. The WHO-recommended MCL for arsenic in drinking water is 10
parts per billion (ppb; for water contaminants, 1 ppb is 1 μg/L). Millions of people
are consuming water with arsenic at 10, 30, or even 60 times that level, resulting in
disastrous health consequences due to chronic arsenic poisoning.
The trajectory of this technology intervention has many threads, and a simple
way to organize the developing story is to present all the threads in parallel,
chronologically. However, the multidisciplinary nature of the intervention and the
parallel nature of the threads make a simple chronological organization difficult to
follow. The authors have therefore tried to balance two perspectives to view the
trajectory more comprehensively: chronological and disciplinary. It is imperfect,
and we the authors hope the reader will forgive us for that imperfection.
About 250 individuals and about 20 organizations have made vitally important
contributions to this effort. This chapter is written as viewed through the eyes of only
three of these individuals, and we are aware that the other views may be somewhat
different, emphasizing different aspects of the work and with different perspectives.
We take responsibility for our inevitable blind spots and distortions that result from
our limited viewpoints.
Beyond this chapter, the three most relevant papers for further reading are Gadgil
et al., 2012; Amrose et al., 2013; and Hernandez et al., 2019.
2 Problem Definition
2.1 Arsenic as Development Challenge
The right to clean drinking water was recognized as a basic human right by the
United Nations (UN) General Assembly Resolution 64/292, in 2010 (Wikipedia,
2020a). However, UNICEF and the WHO recently noted that much more progress
is certainly needed, given that 2.2 billion people globally still lack access to safe
drinking water (WHO Newsletter, 2019). As part of the Sustainable Development
Goals (SDGs) and specifically SDG 6, the UN has set the target of providing
affordable, accessible, and safe drinking water for all by 2030 (UN, 2020).
An estimated 200 million people worldwide are exposed to arsenic-contaminated
drinking water (Naujokas et al., 2013; Minatel et al., 2018). In the 1980s, much of
rural India and Bangladesh switched from surface water, which was causing a high
incidence of diarrheal disease, especially among children, to groundwater extracted
with hand pumps. To prevent gastrointestinal illness, tens of millions of hand pumps
were installed (Nordstrom, 2000).
14 Stopping Arsenic Poisoning in India
361
However, prior to widespread tube well installations, the groundwater had not
been tested for the presence of arsenic. Signs of chronic arsenic poisoning were
first discovered in the 1980s in West Bengal, which led to the first diagnosis of
arsenicosis in Bangladesh in 1993 (Ghosh & Singh, 2009). Further investigations
and measurements in the 1990s led to the discovery that the groundwater in
Bangladesh and adjacent parts of India contained concentrations of arsenic far
above acceptable levels. In 2000, the WHO called the situation the “largest mass
poisoning of a population in history” (Smith et al., 2000). Recent studies have
pointed to unacceptably high levels of arsenic in groundwaters in many parts of
the world, particularly the USA, Mexico, Argentina, Nepal, Vietnam, Cambodia,
the Philippines, and China (Wang & Wai, 2004; Karagas et al., 2015). Researchers
at the Swiss Federal Institute of Aquatic Science and Technology (EAWAG) have
published a global map highlighting regions of the world with high levels of
geogenic arsenic in groundwater based on statistical modeling (Amini et al., 2008).
Chronic exposure to toxic levels of arsenic soon became apparent in the
relevant populations as hyperkeratosis, leading to skin lesions, ulcers, gangrene and
amputations, neuropathy, and internal cancers, as well as low IQ in exposed children
(Wasserman et al., 2007; Ahmad and Bhattacharya, 2019). Tens of millions of the
rural poor in afflicted regions have no viable alternative but to drink groundwater
with toxic levels of arsenic.
Arsenic is tasteless, colorless, and odorless, and testing for arsenic is expensive
and cumbersome. Arsenic chemistry is complex – in contaminated waters, arsenic
occurs in two different oxidation states (As(III) and As(V)), with each oxidation
state behaving differently (Smedley & Kinniburgh, 2002). As(III) is more mobile
and harder to remove through adsorption mechanisms because of its neutral
charge at circumneutral pH. Furthermore, co-contaminant ions commonly found
in groundwater (e.g., phosphate) compete for the same binding sites (Roberts et al.,
2004) that aim to capture As(III) and As(V), further complicating arsenic removal,
particularly because the WHO’s recommended MCL of arsenic in drinking water is
only 10 ppb. Arsenic concentrations of 250, 500, and even 1200 ppb are found in
groundwaters of Bangladesh and Northern India.
Cancer risk assessment models predict that for a population of 100,000 people
drinking water at 10 ppb arsenic over their lifetime, there will be 700 cases of excess
internal cancers. Internal cancer risk rises linearly with arsenic concentration at a
these values. For example, consuming 250 ppb arsenic in drinking water will result
in a 25-fold increase in excess internal cancers than consuming drinking water with
10 ppb arsenic (National Research Council, 2001; Smith et al., 2000, 2002).
Although internal cancers eventually lead to death, there are also high economic
costs to households of those who lose arms or legs to amputations from gangrene.
This cost is due to loss of their income, and the costs of hospitalizations and medical
costs. There are also high social and psychological costs for the affected individuals
who were considered respected breadwinners but are then perceived as a burden
on their family or socially ostracized (Chakrabarti, 2017; Rahman et al., 2018).
An analysis of economic benefits of arsenic removal from groundwater used for
drinking was presented for the Indian state of West Bengal by Prof. Joyashree Roy
in 2008 (Roy, 2008).
362
A. J. Gadgil et al.
Even for a community exposed to arsenic in their drinking water, the health
burden of arsenic falls disproportionately on the poor. This is due to their lack of
access to timely health care, poor nutritional status leading to a higher susceptibility
to negative health impacts, lower likelihood to afford treatment, and lower likelihood
to be educated about arsenic and its risks. Furthermore, women and girls are
the most highly impacted, with instances of women and girls who show signs
of arsenicosis being socially ostracized, rejected by their communities, and even
rejected by their families (Brinkel et al., 2009; Das & Roy, 2013).
Technologies that can remove arsenic from drinking water are indeed available. However, resource-poor communities have inadequate technical, managerial,
and financial capacity (“TMF Capacity”; see US EPA, 2017). Historically, wellintentioned groups, often funded by charitable donations, have installed householdor community-scale arsenic remediation technologies in rural communities. In
India, these are called arsenic removal units (ARUs). In almost all cases, the ARUs
are installed for free. However, in most cases, the installers leave the community
without a clear social organization of responsibility for maintenance and repairs, or,
in some cases, without even leaving clear instructions. Many times, the consumables
and replacement parts were too expensive for the community. Thus, the existence
of effective technologies has not translated to solving the arsenic problem. This
suggests the need for an effective and affordable arsenic removal technology that is
robust and integrates with successful social embedding for long-term sustainability.
This vision challenged a group of researchers in Berkeley to create an innovation
that sustains over the long term and meets the above criteria.
The Murshidabad district of West Bengal, located on the Indian side of the border
with Bangladesh, is one of the poorest and worst arsenic-affected poor regions of
West Bengal. In his doctoral research in applied economics, Abhijit Das studied the
fate of recently installed ARUs in rural parts of Murshidabad district. Das visited
and tracked the ARUs as they were being installed in Murshidabad villages. There
was some expectation that some of the ARUs weren’t working well in the field –
that is why Das selected this to be his research topic. However, Das found that an
astonishingly high fraction (nearly 95%) of ARUs in his study sample failed within
1 year of installation (Das et al., 2016) (Fig. 14.1). All of the ARUs studied had
incorporated sound arsenic removal technologies that were effective at removing
arsenic in laboratory settings. However, the failure rate in the field was astonishingly
(and embarrassingly) high! Another study, this time focused on the functioning ARU
units, found that only 50% were regularly being used by the local population (Inauen
et al., 2013).
The technologies did not really fail. The technologists had failed. The implementing agencies had considered the problem solved as soon as the ARUs were installed
(Das & Roy, 2013). The high risks of failure in a purely top-down approach to
arsenic mitigation are discussed and analyzed in detail by Chakrabarti (2017). The
systems were unsustainable: financially nonviable, not embedded in the societal
context, without incentives or social structures for their continued maintenance
and repair, or without knowledge transfer to local community stakeholders about
how vital the ARUs were for protecting their health. People didn’t know how they
worked or why it was important to keep them working. Toward the end of his
14 Stopping Arsenic Poisoning in India
363
Fig. 14.1 Arsenic removal units (ARUs) in Murshidabad district of West Bengal, India. Panel (a)
a working ARU (typical for 5% of installed units at 1 year after installation). Panel (b) a defunct
ARU (typical of 95% of units at 1 year after installation)
doctoral research, Das documented and photographed ARUs – most were used to
tie cattle or goats and store hay, and had fallen in disrepair within 1 year. Thus, the
fact remains that as more and more of the population in India comes to depend on
groundwater aquifers for their drinking water supply and more areas of India are
discovered to have arsenic in their groundwater, the arsenic poisoning of tens of
millions of Indians and Bangladeshis continues, almost two generations after the
discovery of arsenicosis in populations of rural West Bengal.
3 Approach
3.1 Theory of Change
The theory of change describes the eventual long-term goal and how the proposed
activity (with its required inputs and outputs) may lead to outcomes, which in turn
lead to the desired impact goals, under certain assumptions and favorable conditions.
The theory of change is an excellent way to draw out the assumptions and
favorable conditions that may be different for different actors in the “activity”
and which may not reflect the real-world conditions (out of ignorance, wishful
thinking, just hope, etc.). Spelling out the theory of change reduces the risk that
these assumptions and conditions remain hidden and challenges the team to come
together with a sharper clarity about which assumptions and favorable conditions
364
A. J. Gadgil et al.
Fig. 14.2 The theory of change (ToC) that the ECAR team formulated for the project. The inputs
began in 2005 at UC Berkeley, and by 2019, the team was continuing to put in efforts to see the
project outcomes
are necessary to make the desired impact. It also clarifies which activities might be
irrelevant and which could potentially be undertaken to reduce the risk of failure
in reaching the ultimate desired goal. The theory of change is a large domain of
intellectual inquiry, primarily from the fields of project evaluation and monitoring.
More can be found on the Wikipedia page and the references cited there (Wikipedia,
2020b). For brevity, Fig. 14.2 summarizes the theory of change for the project
described in this chapter.
3.2 Overview of Project Progression from Lab Bench
to a Full-Scale Pilot
This section describes the coalition of partners, also called “the team,” that is
working with an intention to create a sustainable solution to the arsenic crisis,
planning from the start for the solution to have the capacity to achieve a scale
commensurate with the immense scope of the problem. From the start, the members
that formed the team believed and internalized the idea that this problem is so vast
and complicated, that it is outside the abilities of any single narrowly focused group
to solve, and that it would require a coalition of partners with high mutual trust and
complementary subject-matter strengths. While technology innovation was seen as
essential, it had to be undertaken within the narrow parameter space allowed by
the requirement of financial viability and scalability of a sustainable solution – it
was critical for the coalition to have a deep understanding of the past failure stories
14 Stopping Arsenic Poisoning in India
365
and the cultural, institutional, economic, and historical background of the ultimate
customers and local community of users of the technology.
Throughout this chapter, the coalition’s funding support is described along with
the other aspects of the work. This is because, without funding, it is impossible
to carry out technology innovation and cover expenses of travel, instruments,
measurements, lab experiments, field surveys, building prototypes, and conducting
field tests. Here, only funding support that was successfully obtained is described.
The team was always on the lookout for funding, and funding is often thin for
impact-driven, highly applied research focused on solving problems of the poor –
and the success rate of proposals or approaches to funders was less than 20%
overall. So, 80% of persistence and patient effort is not noted here and will remain
undescribed further.
The initial work on an electrochemical approach to solve this problem focused on
science, technology, and innovation. That effort was undertaken by a research team
at Lawrence Berkeley National Lab and the Civil and Environmental Engineering
Department at the University of California, Berkeley (respectively abbreviated as
LBNL and UCB, both at Berkeley, CA, USA), led by Prof. Ashok Gadgil. That
period covered the first 5 years of research, from 2005 to 2010. In these early
years, Dr. Susan Amrose, first as a doctoral student and then as a project scientist
(now a research scientist at MIT), worked closely with Gadgil to test and develop
electrochemical approaches to arsenic mitigation. Initially, the team started with
a 200 mL glass beaker on a bench top, removing only As(V) spiked in clean
deionized water. The effort focused on deepening our understanding systematically
until the Berkeley team had designed a 100 L batch reactor and tested it successfully
with a mixture of equal parts of As(III) and As(V) in a synthetic Bangladesh
groundwater matrix, at an arsenic concentration approaching 1000 ppb. Early
research publications show how the Berkeley team gained knowledge little by little
as they started (Gadgil et al., 2012; Li et al., 2012; van Genuchten et al., 2012;
Amrose et al., 2013).
Funding for this effort first came from LBNL’s Laboratory Directed Research
and Development (“LDRD”) program which provides small limited-duration innovation grants. The Dow Chemical company had established a funding program at the
business school of UC Berkeley called Sustainable Products and Solutions, which
funded this work from 2009 to 2012. The Berkeley team also won funding from
phase one and phase two of the US EPA’s program called “P3” (for People, Planet,
and Prosperity). Gaps and shortfalls were filled with Gadgil’s Rudd Chair funds
from UC Berkeley campus. These resources allowed the Berkeley team to take the
necessary technical risks that led to a steady increase in knowledge and confidence,
to build up to the 100 L reactor.
Current PhD student Dana Hernandez is playing a major role in its ongoing
development, along with postdoc and former PhD student Siva Rama Satyam
Bandaru, who has been engaged in this project since 2011. Numerous other doctoral
students have been involved in the effort at Berkeley, and six of them (Amrose, van
Genuchten, Delaire, Bandaru, Glade, and Hernandez) have made this work central
to their dissertations, each making a very substantial contribution to advancing
366
A. J. Gadgil et al.
our knowledge. NSF doctoral fellowships which funded three of the six doctoral
students have been of tremendous financial help in this effort.
The strong focus on creating a sustainable solution that goes to scale led Gadgil
to approach Prof. Joyashree Roy, the founder and coordinator of the Global Change
Programme at Jadavpur University (GCP-JU; Kolkata, India). Gadgil and Roy
had known each other since 1997–1998 when Roy spent a year at LBNL as a
Ford Foundation Postdoctoral Fellow in environmental economics. GCP-JU is an
interdisciplinary organizational unit in Jadavpur University and explores global
change as it manifests itself in India, through the lens of applied social sciences,
particularly, applied economics and sociology. In this coalition, UCB contributed
technology expertise, while GCP-JU provided critical insight into the sociocultural,
economic, and political factors surrounding arsenic mitigation in West Bengal.
GCP-JU also provided access to a network of local stakeholders and influential
leaders that allowed us to translate our research into impact. Last, but not the
least important, GCP-JU brought credibility to the coalition effort, because JU is a
highly respected university in India, officially recognized to be in the top ten public
institutions of eminence, and is seen as a highly credible source of knowledge by
the general population. In hindsight, the coalition members acknowledge that this
multidisciplinary partnership was essential for the progress that was later achieved.
During 2011–2013, the team conducted a field trial of the 100 L reactor in West
Bengal, which led to their increased confidence to design, build, and test an even
larger prototype. This larger 600 L reactor was tested at a nearby school called
Dhapdhapi High School. These field trials were successful, even as new technical
and social-embedding problems surfaced and were successfully dealt with (more
on these later). The Berkeley side of the coalition won funding support for this
work from UC Berkeley’s Blum Center for Developing Economies and the United
States Agency for International Development (USAID)-funded large multicampus
multi-year program, called the Development Impact Lab, which is also led from the
Blum Center of UC Berkeley. During 2011–2013, the team was forced to change
its field site and start all over (as described later on) owing to unexpected external
events. The team’s technical and social research in these years is reflected in the
corresponding publications (Amrose et al., 2014; van Genuchten et al., 2014; Gadgil
et al., 2014).
By 2014, the development of ElectroChemical Arsenic Remediation (ECAR) had
reached a key fork in the road. The team had shown successful performance of the
ECAR technology at the 600 L scale, both in the lab and in the field at the Dhapdhapi
school. However, they had not yet built or demonstrated the long-term technical
effectiveness, commercial viability, and social acceptance of ECAR technology
to the scale of a fully functioning demonstration plant. Doing that required more
funding support. Most innovative technologies for the poor in the developing world
wither on the vine and become obscure memories or dusty curiosities at this point
in their development.
The list of the team’s failed funding efforts will be skipped to focus on the
successful one. The US and Indian governments jointly established in 2000 an
autonomous foundation in India IUSSTF (Indo-US Science and Technology Forum)
14 Stopping Arsenic Poisoning in India
367
which funds and promotes technology transfer and commercialization from the US
inventors and innovators to the sectors that India considers of critical importance.
Each proposal requires participation from an Indian industrial partner of credible
depth of technical, marketing, and management expertise. The Berkeley and JU
team searched for many months in vain for such a partner through multiple
channels, which even included Gadgil giving lectures in India to Indian industry
representatives with the help of the Confederation of Indian Industry (CII), all to no
avail.
In January 2012, Gadgil won the Zayed Sustainability Prize, for Lifetime
Achievement in the individual category. At the awards ceremony, he met Mr. JeanPascal Tricoire, the CEO of Schneider Electric, who was there to receive the
Zayed Sustainability Prize that Schneider Electric had won in the large corporate
recognition category. Schneider Electric had just purchased a majority share in an
Indian company, Luminous Power Technologies, (now called Livpure) founded by
Mr. Rakesh Malhotra. During their interaction, Mr. Tricoire offered to introduce
Gadgil to Rakesh Malhotra who might be looking to license a novel breakthrough
technology to solve a key drinking water problem. It further helped that a VP of
Schneider Electric in India, Dr. Satish Kumar, also personally knew Gadgil for over
a decade. This entirely fortuitous circumstance led to an introduction of Livpure
to the ECAR team. Within the year, in December 2012, Livpure, JU, and Berkeley
jointly applied to IUSSTF for funding.
A lot of effort followed the application to refine the proposal to communicate the
exact scope of work for meeting the due diligence by IUSSTF. Finally, in July 2014,
the collaboration of the three parties was granted the IUSSTF award for a plant that
would scale up and demonstrate the technology, to be completed within just 2 years.
This changed the trajectory of ECAR from what otherwise would have been just a
dead exhibit in the dusty museum of ignored technical curiosities.
In the meantime, in 2013, the Berkeley-JU team, led by Gadgil, won the
top honor of the Prince Sultan Bin Abdulaziz International Prize for Water
(www.PSIPW.org) – the Creativity Prize. Winning this top international prize for
the ECAR technology innovation increased the team’s credibility. Ultimately, the
team believes that the recognition was pivotal in raising funds from the IUSSTF to
build a demonstration water treatment and distribution unit at a rural school in West
Bengal.
Since the team had only 2 years to design, build, and commission the demonstration plant, the team went back to the same fabricator on whom they had relied for the
600 L smaller project. This fabricator, Shri Hari Industries, is a small engineering
company outside Mumbai, and their chief design engineer, with several years of
design experience, had been personally interested in contributing to engineering
innovation (Fig. 14.3). In close partnership with Berkeley researchers, Shri Hari
Industries staff were able to rapidly iterate the design of the ECAR reactors with
the Berkeley team to improve ease of manufacture, shipping, and operation, thereby
significantly improving reliability and reducing capital costs.
Figure 14.4 sketches the progression of the technology over a 12-year span. From
2016 onward, the ECAR full-scale pilot plant has been operating at Dhapdhapi
368
A. J. Gadgil et al.
Fig. 14.3 Ashok Gadgil, Narendra Shenoy (chief design engineer of Shri Hari Industries), and
Susan Amrose in November 2014, discussing the design details of the water distribution manifold
for the two ECAR reactors then under construction
Fig. 14.4 The progression of ECAR, beginning as a 200 mL beaker, with its development to 100 L
and 600 L prototypes, and finally scaled as two ECAR reactors of 1000 L each. The 2005 photo
shows Ashok Gadgil and Susan Amrose at the Berkeley Lab. The 2011 photo shows Ashok Gadgil
and Siva Bandaru inspecting the 100 L prototype at Amirabad High School. The 2012 photo
shows Siva Rama Satyam Bandaru, Susan Amrose, Caroline Delaire, Ashok Gadgil, Paramitha
Chaudhuri, Sudipta Ghosh, Suman Chakraborty, Chandan Bose, Amit Dutta, Peter Kuin, and
Sayantan Sarkar with the 600 L prototype at Jadavpur University. The 2017 photo shows Susan
Amrose standing next to one of the two reactor tanks at Dhapdhapi High School
High School in West Bengal, India. An automated water dispensing system daily
offers 1 L of arsenic-safe drinking water to each of 2500 students and 400 staff
and teachers free of cost and offers the excess water (about 4000 L) for sale to the
surrounding community at a locally affordable price of less than 1 US cent per L.
The Berkeley-JU team was excited to partner with Livpure. Livpure was a
large and vibrant water-treatment company, ranking as one of the top three in the
booming market of under-the-sink reverse osmosis (RO) units for urban Indian
14 Stopping Arsenic Poisoning in India
369
households. Livpure had an excellent understanding of the Indian business and
regulatory environment and a strong marketing team, with thousands of distributors
supporting their RO products. The Berkeley-JU team hoped and expected that
Livpure would advise and influence the direction of development and maturation
of the technology during the demonstration plant stage. If the demonstration plant
was successful, then they expected that Livpure would bring capital, sophisticated
marketing, and engineering resources to further improve the engineering design
and implement a wide-scale solution to the arsenic poisoning problem. This was
based on Gadgil’s experience with WaterHealth International (more in the following
section). Conversely, Livpure expected a prompt flow of funds from the government
for building more ECAR plants. For various reasons, these expectations turned out
to be misaligned, and the subsequent technology diffusion did not occur as originally
hoped.
The outcome was that technology maturation was primarily driven by members
of the Berkeley-JU team, whose members poured all their efforts into ensuring that
the system worked well technically, economically, and socially and were able to
demonstrate its robustness, effectiveness, and market acceptance. However, there
has been little interest from the industrial partner in expanding plant capacity,
increasing the sales with outreach to the community, or replicating this plant to
other locations. Yet, they did not abandon the plant and continue to operate and
manage it, test the water monthly, and conduct the water sales. They have continued
to get the product water tested monthly by a trusted third-party lab and have posted
the results outside the door of the ECAR plant for all interested parties to see. This
was vitally important to maintain the trust of the community members that come
daily to purchase water from the plant. At community’s insistence, the plant was
kept operational even during the COVID pandemic that required a shut down of all
non-essential businesses.
4 Implementing the Approach
This section describes the team’s process of first understanding the arsenic problem
in West Bengal, and then creating the ECAR innovation to address it, iteratively
implementing the innovation, and adapting the innovation to scale and for other
contexts. The iterative nature of the invention innovation process unfolds in
primarily three different ways: (1) the technical solution itself is iterated to make
it work better, rejecting some aspects of earlier designs; (2) the understanding and
framing of the problem and its boundary conditions is adjusted through interactions
with potential customers, iteratively improving the problem definition; and lastly,
(3) the demands placed on translating the scientific understanding into a specific
hardware and operating protocols also become better understood and are iteratively
improved during the field experiments and field testing. In all this effort, the core
strength of the team comes from integrity, candor, and an attitude of willingness to
learn – a learning mindset.
370
A. J. Gadgil et al.
4.1 Prior Experience
4.1.1
WaterHealth International
The team’s conceptualization of the arsenic problem was shaped, from the start, by
Gadgil’s experience in microbial drinking water treatment, particularly in India. In
1995, Gadgil had invented UV Waterworks, a device that used UV light to disinfect
drinking water at a rate of 15 L per minute, at a cost of USD 0.05/1000 L, suitable for
small community-scale deployment. Although the technology was low cost, robust,
and low maintenance and had a high positive impact on health, creating real impact
had required a market-based business model in which clean water was sold at a
locally affordable price.
A start-up company, WaterHealth International (WHI), was able to leverage the
extremely low cost of water production from the technology to maintain a locally
affordable price point while making a profit. Other good practices of WHI included
ensuring good quality control, spending the necessary funds for media outreach,
marketing, and getting support of local village-level nonprofit organizations for
local health education about diarrheal disease and microbial pathogens in water.
Furthermore, achieving a high volume of sale of the purified drinking water
was tied to WHI’s financial viability. Therefore, the company was incentivized to
continue with relevant public health education and to continue to gain the public’s
trust that the water was high quality (through monthly third-party testing of the
water they sold and publicly posting and disseminating the resulting certified data).
Gadgil knew from this experience in India that if someone’s livelihood and profit
depended on the continuous provision of arsenic-safe drinking water on a day-to-day
basis, then that person (or organization) would not let the technology fail for lack of
proper maintenance. This shaped the team’s framing of the technology innovation to
focus, not just on something that could produce arsenic-safe water, but on something
that could do so inexpensively enough to generate a small profit while selling the
arsenic-safe water at a locally affordable price.
4.1.2
Arsenic in Bangladesh
Gadgil had started research on affordably removing arsenic from drinking water
at Berkeley in 2000. The team initially focused on an innovative approach to
build a core-and-shell particulate adsorbent for arsenic, called Arsenic Removal
Using Bottom Ash (ARUBA). The ARUBA’s core was based on extremely lowcost bottom ash particles (10 micron diameter) from coal-fired power plants,
which Gadgil obtained from India and invented a process to coat them with
ferric hydroxide. The powder did remove arsenic successfully from contaminated
groundwater, and the waste passed the US EPA’s Toxic Characteristic Leachate
Protocol (TCLP; a test to determine if waste is acceptable for disposal in municipal
landfills in the USA). However, the adsorbent proved to be inexpensive only when
14 Stopping Arsenic Poisoning in India
371
Fig. 14.5 Schematic of ECAR process with iron electrodes. Anodic dissolution of Fe(0) from the
iron anode releases Fe(II) in the bulk solution. This Fe(II) reacts with dissolved oxygen (O2 ) to
form insoluble Fe(III) and simultaneously generates reactive intermediates (like Fe(IV) and *OH)
that oxidize arsenite, As(III), to arsenate As(V). The Fe(III) captures the As(V), and then, the
aggregated precipitates settle out of solution. The letters “ZLD” on the outlet water highlight that
this process is zero liquid discharge, a coveted goal of process engineering
it was deployed at large scales, on the order of tons per day. In 2005, the team
had started to explore another technology pathway that could be affordable and
profitable at both small and large scales while enabling a company to survive and
grow through the expected slow growth of the arsenic-safe water market.
The ARUBA research and field tests continued through 2008, and the team later
published their findings (Mathieu et al., 2010). Switching directions from ARUBA
to a new electrochemical technology was the first pivot in the research direction.
This new technology, called ElectroChemical Arsenic Remediation (ECAR) (Fig.
14.5), used a small amount of electricity to remove arsenic from diverse groundwaters in a way that is highly effective and low cost, produces little arsenic-laden waste,
and requires minimal supply chain development of readily available materials,
among other attractive factors.
There was another important shift in the team’s thinking in the period from
2008 to 2010. Throughout the development and field testing of ARUBA, it had
seemed logical to conduct field tests in the country most severely afflicted with
arsenic: Bangladesh. The team members reached out to the premier engineering
university in (Bangladesh University of Engineering and Technology – BUET)
which continues to offer excellent education in engineering. Team members met
several times with UNICEF officers in Dhaka who oversaw UNICEF’s programs to
improve water quality and with various officers of BRAC, the world’s largest NGO,
famous for its breadth and depth of work in Bangladesh. The team also met with
372
A. J. Gadgil et al.
the senior echelons of BRAC University and BRAC Bank. The most important and
most consistent takeaway from all of these meetings was that the arsenic problem
in Bangladesh was intensely politicized. External agencies (the UN, World Bank,
British Geological Survey, and others) were blamed for the arsenic disaster, and
they were expected to pay for arsenic-free water. There was a highly politicized
division of public opinion, with a large group of opinion leaders who were hostile to
any suggestion that arsenic remediation should ever be part of a commercially viable
enterprise. Thus, the only way to reach scale would be to work through a delivery
model fully supported by either the government or an external aid agency. The team
tried many times to obtain this support or to find alternatives, but it was clear that
this could not be achieved with the time and resources at the team’s disposal. Right
across the border, in the Indian state of West Bengal, the problem was equally
grievous, but no angry political battle was being fought over who would pay and
no blame game being played. The team decided in 2010 to move all future work to
India so it could fight on one front – against arsenic – and did not also have to fight
on a second front, the political front, to get things done. Team members believe this
was another key and important pivot that led to the success at Dhapdhapi in West
Bengal six years later, in 2016. They believe this could not have been achieved in
the highly contentious political atmosphere of Bangladesh.
4.2 The Amirabad Experience
With leadership from JU, the Berkeley-JU team reached out to numerous key
stakeholders in India and West Bengal, in particular, to inform them of their
planned work and to obtain advice and feedback. This included multiple levels
of officeholders and experts in numerous organizations. Two key lessons the team
learned through the process were (1) the critical importance of proper handling and
disposal of arsenic-bearing waste and (2) the absolute necessity of reaching out to
the local public through multiple channels of communication and contact over an
extended period, until members of the public became familiar with and socially
“normalized” to using the technology.
In 2010, the team selected a field site with the help of a local college teacher and
his NGO contacts from the JU team, in the small town of Amirabad, in the district
(roughly equivalent to a county in the USA) of Murshidabad. This was the same
district where, earlier, Das had conducted his doctoral research. Amirabad is a sixhour drive from JU, so short trips and day visits were impractical. Nevertheless, via
a small local NGO known to the JU team members, the team leaders approached the
local high school (actually, the Amirabad High Madrassa or High Religious School)
and were offered a classroom with electricity for conducting the field tests of the
100 L ECAR reactor, with plans for testing successively larger ECAR reactors. The
100 L reactor was first designed, built, and tested in Berkeley, then duplicated and
tested in JU, and finally, transported to Amirabad. For local outreach, the team
held public community meetings as well as multiple meetings and discussions
14 Stopping Arsenic Poisoning in India
373
with school teachers explaining to them what the team was doing and why. This
included explaining how mature technologies emerge from science (the progression
in technology readiness level (TRL)), since technology maturation research is an
unfamiliar activity to most people (even in the USA), and expectations of speedy
progress continued to run far ahead of what the team could humanly deliver.
As a good faith effort to provide near-term relief, the team paid for a US-based
NGO (“Project Well”) to dig a protected dug well on the school grounds. Project
Well had given assurance that the well would be a good interim solution. It turned
out that very quickly the well ran dry, and no operational problem was addressed by
the NGO or its local representatives. However, that was only the beginning of the
team’s troubles at Amirabad.
Although the team had moved the field research work from Bangladesh to West
Bengal in favor of finding a less politicized situation, the team discovered the truism
that “politics is everywhere – once there are more than two people involved!” In
2011, elections were imminent. Various political factions and leaders looking for
opportunities to strengthen support from their base are often eager to promise a
quick-fix technological solution to win the adulation and endorsement of their local
constituencies. So, while the team was field testing just a prototype, the leaders
and communities expected immediate continuous water service delivered to them
by the research team. To counter these high expectations, the research team held
various public meetings and clearly stated their short-term goals. They also met
with multiple administrators to discuss the way forward for a long-term solution.
However, these efforts had limited impact. Given the past experience of multiple
failed technology trials, the community was looking for quick and assured solutions.
Meeting this expectation was not only scientifically unfounded but also beyond the
resources and capacity of the research team.
By the fall of 2011, the field trials of the 100 L ECAR reactor at the Amirabad
school had been a technical success (the background work and field test results
are described, along with cost estimates, by Amrose et al. (2013)). Work was soon
completed in Berkeley on the design of the next-iteration larger reactor, now 600 L,
based on the technical lessons learned. By the spring of 2012, the 600 L reactor, a
600 L settling tank, a gantry (a small mobile crane), and all related equipment had
been moved to JU and tested successfully. It was time to find a large indoor space
in the Amirabad school to accommodate all the equipment.
Initially, the fieldwork was conducted with encouragement and support from the
Amirabad school’s administration led by the headmaster, who was carefully neutral,
pro-science, and pro-research. Additionally, the headmaster lived in Amirabad and
saw the beneficial implications for the community if the novel ECAR technology
was to be successful. Unexpectedly (for the team), the Department of Education
instituted their normal “rotation” of headmasters from one school to another, which
happens every few years, and the supportive headmaster was rotated out. The new
headmaster lived out of town in an area with safe drinking water. He was, from
the start, a bit equivocal about allowing ECAR fieldwork in the school’s classroom.
He was inclined to support the faction in the school teachers that began to vocally
oppose the presence of the team on the school grounds in the absence of the team
374
A. J. Gadgil et al.
offering a guarantee for providing safe drinking water supply. With increasing
virulence, this group attacked the team’s honesty of purpose and suggested that
the team represented outsiders collaborating with others from a wealthy western
superpower (the USA), who were “exploiting” the school for their research. Some
insight of this activity came, but too late, from the local NGO and their contacts
at the JU side of the team. In hindsight, the team feels that the large distance
(almost 7 hours each way by car from JU) led to inadequate communication from
the team to dispel rumors. This all ended badly. In an extremely tense meeting in
the summer of 2012 with the school headmaster and a group of teachers whose
screaming accusations he acquiesced in, the team announced its decision to pull
out, leave the school site, restore the classroom to its original state, and return it to
the school. The team felt disappointed and angry, including at themselves. Much
work to build social and political capital had been lost.
This led to two immediate consequences for the team.
The first and immediate consequence was the beginning of an internal process of
reflection, discussion, and review to try to understand what went wrong, what the
team could have done differently, and what safeguards could have been put in place
to avoid such a major setback. Team members were sure that given the intensity
of the verbal exchange at the meeting and the political situation at the school, the
damage was beyond repair and pulling out was absolutely the right decision. In
a few short years, after news of the success at Dhapdhapi reached the Amirabad
school, the headmaster and NGO there telephoned the team leader at JU several
times asking the team to restart the work at Amirabad. However, given his complete
lack of support for the field test in 2012, the team asked for the invitation to be made
in writing before it would be even considered (he never wrote).
4.2.1
Assessing Failure
One reason the team’s effort fell victim to the local sociopolitical division and
acrimony was the inadequate two-way formal communication between the team, the
community, and the school’s opinion leaders. This communication was hampered
by the long distance from JU to Amirabad and absence of a formal mechanism
for two-way communication. As a result, the impressions and expectations from
the opposing faction of teachers did not surface and get corrected promptly. They
operated under the growing belief that the research team was performing the work
for some future financial gain from unseemly business profit and that the school
should see a mature technology delivering safe drinking water to the school within
weeks or, at most, months from the start of the field test. This comprehension led
to two major shifts in the team’s thinking: (1) the team must formalize agreements
with field site owners by creating a signed memorandum of understanding (MOU)
that (although legally nonbinding) spells out the roles, responsibilities, and mutual
expectations from all sides, and (2) the team needed to pay a lot more attention
and invest more effort in managing the expectations of the field site influencers and
opinion leaders. When MOUs were created, a copy of the MOU would be given
14 Stopping Arsenic Poisoning in India
375
to each signee so that it could be referenced in future discussions, and if further
adjustments were to be made, these would also be in writing and signed by all
parties.
A second consequence of the blowup at Amirabad was the urgent requirement to
find another field site to continue the work. The team decided to be more systematic,
rather than just finding friends of friends of friends, to find the next field site. A more
rational and systematic approach was needed and implemented. The team followed
the example of Harvey MacKay searching for a bank lender for his start-up business,
described in his well-known book Swim with the Sharks Without Being Eaten Alive
(Mackay, 2005). Two team members were charged with visiting every school within
concentric circles drawn with the JU campus at its center; starting with the shortest
travel radius (30 minutes), they kept on increasing the radius of their search after
exhausting the schools in circles of successively increasing travel-time radii (i.e.,
30, 60, 90, 120 minutes, etc.). Their goal was to come back with a list of three
different potential schools that each met the following criteria:
1.
2.
3.
4.
Strong interest and support from the school administration in the effort.
Availability of infrastructure at the school (e.g., room, water, electricity).
Presence of arsenic in the local water being used at the school.
Reasonable travel time from JU to the school.
In about a month, the team (of Das and Bandaru) brought a list of three strong
candidate schools (Table 14.1), which the team discussed and ranked. The highest
weight was given to strong support from the school administration. The top ranked
school, Dhapdhapi High School, was a mere ~2-hour drive from JU (Fig. 14.6), well
connected also by railways/public buses, and had 2500 students and about 250 ppb
arsenic in the local groundwater that supplied the school. A small municipal pipe
delivered a small amount of potable water intermittently, but the daily delivered
volume was completely inadequate for the daily needs of 2500 students (in the
age group of 11–19 years) and 400 teachers and staff. Another nearby school
ranked equally well; however, it was a girls-only school. After burning their fingers
at Amirabad with accusations of unethical motivation, the team favored the coed
school at Dhapdhapi. There was less risk of another messy accusation, particularly
because the field engineers who would spend many months at the school would
include both men and women. Thus, after following a systematic and rational
approach, the team found the second field site within just a few weeks, and the
work was able to proceed.
4.3 The 600 L Prototype
Prof. Joyashree Roy, leader of the JU team, reached out to the Dhapdhapi higher
secondary school administration and was warmly received by the headmaster. This
time, the team took care to have a clearly written MOU with the school administration, which was countersigned and approved by the secretary of the school’s
376
A. J. Gadgil et al.
Table 14.1 The data for the top three schools used to select a site for the demonstration of the
ECAR technology
Arsenic concentration (ppb)
Water source
Number of students
Suitable space
Travel time from JU
School 1: Co-ed
primary school
~100–200
Hand pump,
shallow tube well
200–250
Adequate
2 hours
15 minutes
School 2: Co-ed
Dhadhapi high
school
~225
Hand pump, shallow
tube well
2500
Excellent
2 hours
School 3: Girls
only high school
~200
Shallow tube well
attached with
submersible pump
510
Excellent
45 minutes
governing board. This MOU proved to be a lifesaver during the few occasions
of misunderstandings and differing mutual expectations that inevitably arose. This
is an important point. In a community-scale technology trial, not only the official
hosting agency, but also the community becomes involved, often with incomplete
or incorrect information. Therefore, careful attention to managing community
expectations becomes very important. The team went through the process of holding
community outreach meetings, including open-mike meetings with school teachers
and staff, as well as meetings with a pair of student representatives from each class.
In parallel, the Berkeley team had completed the design of the 600 L reactor.
After successful testing at JU’s Environmental Engineering Lab in the summer
of 2012, the 600 L system (which was previously meant to go to Amirabad) was
moved to Dhapdhapi High School, where the administration provided a dedicated
unused classroom for the field test (Fig. 14.7). While 600 L was too small to serve
an entire community or even the school, it was a good step-up from the small 100 L
device (about the size of a large trash can) previously tested in Amirabad. The
next step would be a device that would deliver approximately 6,000–10,000 L/day.
This capacity was seen as optimal, based on prior experience and calculations,
to obtain good economies of scale while meeting the (projected) demand of the
local community members, who would have to walk to the plant to pick up the
water. For larger throughputs, the coverage territory becomes too large, and potential
customers at the perimeter of the cover area are understandably generally unwilling
to walk the long distances back to their households carrying water. This was another
lesson from Gadgil’s WaterHealth work.
The field test of the 600 L device at Dhapdhapi ended successfully (results were
published as a journal paper (Amrose et al., 2014)). Soon, the team received the
exciting news that the IUSSTF grant was being released in July 2014 that would
enable demonstration of a full-scale pilot of a community ECAR plant.
The team took a calculated risk by significantly changing the design of the 2000 L
reactors compared to the 600 L reactor without going through another pilot study at
the 600 L scale with the new design. The 2000 L reactors incorporated completely
different hydraulics and a more sophisticated train for processing the product water.
14 Stopping Arsenic Poisoning in India
377
Fig. 14.6 Map shows the location of Jadavpur University and the distances to promising school
sites. The straight-line distance from JU to Amirabad (the first school partner) is 195 km, but time
to travel is 6 hours and 45 minutes by car. The travel time to Dhapdhapi is only about 2 hours and
15 minutes
This was based on the team’s confidence in their scientific understanding and also
the very limited window of available time (2 years).
378
A. J. Gadgil et al.
Fig. 14.7 Professor Gadgil discussing the chemistry of ECAR with Siva Bandaru, at that time a
field engineer in the Berkeley team. Dr. Susan Amrose is on the right. This is in the classroom of
Dhapdhapi High School that was allocated for the 600 L prototype trial in 2012
4.4 Scaling Up and Commissioning the Demonstration Plant
Learning from weaknesses observed during the long-term performance of the 600 L
reactor, the electrode layout and hydraulics of the reactors for the 10,000 L per day
(LPD) demonstration plant changed, though the core chemistry remained the same.
The reactors were again designed in Berkeley and built in Mumbai by the same
trusted small fabricator, Shri Hari Industries. The Berkeley team placed two of their
engineers in Mumbai for daily collaboration and participation during the fabrication.
The 10,000 LPD design comprises two identical reactors, each capable of treating
1000 L of arsenic-contaminated groundwater per batch. The transfer of water from
each reactor tank into the settling phase occurs alternately, operating as a semi-batch
process (Fig. 14.8). As the water in the second tank is transferred, raw water fills the
first reactor tank for the next batch of treatment. There was no possibility of testing
the reactors in Mumbai or at JU due to their size. However, by then, the Berkeley
team had developed high confidence in their understanding of ECAR reactor design,
so the reactors were transported by truck directly to Dhapdhapi.
In March 2015, the two 1000 L reactors arrived and were installed at Dhapdhapi
High School. Civil work was also completed by Livpure on an external shed, built
immediately adjacent to the school, to house part of the water treatment system.
Electrical upgrades were also completed for the school power supply to receive an
additional 10 kW power to help supply the ECAR plant.
The team worked with officers of the State Pollution Control Board and a reputed
hazardous waste collection company to establish and get approval of a plan for safe
14 Stopping Arsenic Poisoning in India
379
Fig. 14.8 Treatment train at the Dhapdhapi plant. Water treatment begins at (a) the ECAR reactors
where electrolysis occurs, followed by (b) flocculation and settling and (c) tertiary treatment,
consisting of a rapid sand filter, several micron filters, and a UV light. An activated carbon filter
is also seen in panel 3, but is not in use (nor necessary to ensure safe-drinking water, but was part
of the pilot testing phase). Water is then distributed to students, teachers, and staff through (d) the
water kiosk that contains four automatic dispensing units
sludge management and disposal. Livpure and the team coordinated to complete
wiring, plumbing, and tertiary treatment systems for the full plant integration, as
well as to conduct initial testing and troubleshooting. The first local operator was
hired and trained. Maintenance equipment for the electrode plates was fabricated
and tested.
Clean, arsenic-safe drinking water was first produced intermittently in mid2015. However, no water was allowed for human consumption until the team had
developed very high confidence in the plant performance. This confidence emerged
by mid-September 2016, 6 months after plant operations began on a daily basis.
During that time, the produced arsenic-safe water was discarded into a soak pit,
much to the distress of some of the local stakeholders, who were left drinking
arsenic-contaminated water while the team completed all testing.
The Government of India had certified several commercial labs (under the
accreditation scheme “National Accreditation Board Labs” (NABL)) for conducting
water quality tests – but not all NABL labs were equally reliable, as the team
discovered by paying several of them to test blind samples of calibrated arsenic
solutions of known strengths. Throughout this period, raw and finished product
water samples were air shipped to Berkeley for analysis, in addition to water quality
380
A. J. Gadgil et al.
Fig. 14.9 Plant inauguration on July 8, 2016. The picture shows teachers and staff of Dhapdhapi
High School, as well as researchers from UCB and GCP-JU. This picture was taken right after
a meeting with teachers and staff where Prof. Gadgil and Prof. Roy explained project efforts
and answered questions from students, teachers, and staff. Sustained support and advice from the
headmaster, Mr. Biswas (in center, in white shirt sleeves) was crucial for overall project success
analysis being conducted by a local Indian NABL-certified lab, which the team had
independently verified to be trustworthy. Sending the samples all the way to the
USA was a way to overcome some of the limitations of the technical environment
faced in the team’s field research. Another research group in JU had a highly
accurate instrument (inductively coupled plasma-mass spectrometry, or ICP-MS)
for measuring water quality, including arsenic. However, that ICP-MS remained
inaccessible to the team. Another sensitive instrument at JU had been functioning,
but the essential supply of argon for its operation had run out, and the empty cylinder
of argon was not being replaced or refilled over many months. These are some small
examples of the numerous difficulties of conducting high-quality scientific research
in resource-constrained areas without a steady flow of adequate funds to support
research infrastructure.
The leaders of the Berkeley team visited the completed pilot plant for commissioning (Fig. 14.9) and met with the leadership of Livpure, relevant officers
of the Ministry of Drinking Water and Sanitation, and USAID staff in Delhi, to
discuss progress and steps forward. Progress at the demonstration site was reported
in India’s prominent daily newspaper the Times of India.
14 Stopping Arsenic Poisoning in India
381
Fig. 14.10 ECAR product water results from April 11, 2016, to January 30, 2017, demonstrate
that the Dhapdhapi plant is highly effective in reducing high arsenic concentrations (average initial:
252 +/− 29 ppb) to concentrations much below the WHO limit of 10 ppb (average final: 2.9 +/−
1 ppb). The gray-shaded region (left half) depicts the time period for which water was treated and
arsenic level was carefully monitored but the water was not allowed for consumption. The white
region (right half) depicts the time period during which water was made available for consumption
by students, teachers, and staff. This figure is adapted from Hernandez et al. (2019)
After the technical challenges (described in Sect. 4.5) were identified and
overcome, water production from the full treatment plant (Fig. 14.10) began to
reliably meet all chemical and biological aspects of the Indian drinking water
quality standard (IS:10,500:2012), including exceeding the international standards
for arsenic corresponding to the WHO-recommended MCL; the initial arsenic
concentration of approximately 250 ppb was reliably reduced to <5 ppb (Fig. 14.10).
4.5 Technical Challenges
While the deployment of ECAR as a large-scale plant was ultimately successful,
there were a number of unanticipated technical challenges that surfaced and
were overcome along the way. One of the primary reasons for engaging in field
work is to uncover and resolve these kinds of contextual challenges. The major
benefit of operating in field-relevant environmental conditions is the opportunity
to see effects that may simply not be anticipated or cannot be replicated in the
laboratory. These specific challenges resulted from the field conditions, multistakeholder management, and maintenance requirements. It is worthwhile to give
a few examples, since the devil is always hiding in the details. As another way to
382
A. J. Gadgil et al.
put it, “In theory, there is no difference between theory and practice, but in practice,
there is a world of difference between theory and practice.”
Intermittent Power Supply The pilot plant in rural West Bengal, relies on
intermittent grid power. Especially during the monsoon season (April–July), power
outages occurred almost daily due to storms, damage to transmission lines, or
substation breakdowns, etc. When power returned, the ECAR process would simply
resume where it had left off (one advantage of the ECAR process is that it does not
lose efficiency when operation stops and starts). However, because it operated as a
semi-batch process, power outages were sometimes long enough to prevent a single
daily batch of 2000 L from being treated.
Hot and Humid Climate The summer daytime temperatures in West Bengal
reach as high as 40 degrees Celsius in the shade, followed by heavy rains and
high humidity (average relative humidity of 84% between July and September).
Such extreme environmental conditions led to the rapid corrosion of bare electrical
contacts (due to high humidity), which in turn led to heat buildup that was not
dissipated under high ambient temperatures, leading to melting and charring of
plastic insulation. In addition, powdery white precipitates (later determined to be
calcium carbonate, or calcite) appeared in the product water during summer and the
water delivered to consumers in intense summer heat was unpleasantly hot. With
the onset of winter, the team also observed unexplained significant deterioration in
the performance of the tube settler process. After various troubleshooting efforts,
the team realized that the groundwater being pumped for treatment in the ECAR
tanks was warmer than the water held in the tube settler, which had equilibrated to
colder overnight ambient temperatures. As such, the iron flocs were short circuiting
the settling path in the tube settler, causing turbidity levels of up to 50 NTU at the
outlet of the tube settler. To solve this seasonal problem, it was decided to pump up
and fill the ECAR tanks with raw groundwater at the end of each workday and store
it in the ECAR tanks overnight, so that water too would equilibrate with ambient
cold night temperature by the morning. This was an adequate solution, and the tube
settler functioned properly throughout the winter months.
4.6 Implementation Challenges
Training of Local Operators At the start of the field trial, there were no written
instructions, either in English or Bengali, on plant operation. Thus, training was
“on the job” and based on (sometimes inconsistent) verbal instructions from
various team members and partners. Locally trained plant operators heard different
instructions from different stakeholders, leading to confusion. This eventually led
to the development of an operations manual to remove inconsistencies and ensure
clarity. However, that did not always ensure common-sense operation. In one case,
the arsenic concentration strangely spiked in the product water above the target level
(though it remained below the recommended WHO MCL of 10 ppb). This is seen
14 Stopping Arsenic Poisoning in India
383
in Fig. 14.10 for the period starting at 23rd of May to about 18th of July 2016. With
a lot of effort, the engineering science team traced it to the recirculation pumps in
the ECAR reactors being shut off, mid-processing, by the plant operator. It turned
out that the plant operator’s action was due to the pump noise interfering with his
personal cell phone calls. After identifying the cause, the research team explained
the importance of keeping the recirculation pumps on and that it was an essential
and nonnegotiable part of his job as an ECAR operator.
Ensuring Continuity of Knowledge Within the Team As this project involved
many researchers, interns, and partners, at certain phases, there was insufficient time
allocated to training the next incoming team members. The training process requires
expenditure of precious time in a time-bound project. However, turnover of some
team members is inevitable (e.g., as some graduate) in such multi-year projects. This
leads to discontinuity in knowledge if documentation was incomplete, overlooked,
or was felt to be only supplemental information. The team’s stumbling from this
problem led to a partial solution – as far as possible, the team had field staff work
in pairs, so if one of them rotated out, the other in the pair would have detailed
field knowledge that could be useful to train the replacement hire. This patchwork
solution seems to have worked well enough.
Revisiting and Correcting Early Mistakes Some of the initial actions and
decisions during the actual construction were suboptimal for the long-term operation
of the demonstration plant. This was the result of different priorities between the
implementing partners; the industry partner prioritized cost saving via shortcuts and
cheaper components and parts, while the research partners preferred the plant to
remain robust and resilient (in their future absence) with higher-quality parts and
with a layout facilitating easy troubleshooting, should problems develop later. Some
problems emerged very soon – owing to the initial shortcuts and cheap components
right after the pilot plant was commissioned in April 2015. Fortunately, the research
partners had committed to support two field engineers at the plant for many months
even after commissioning to diagnose and overcome unexpected problems.
First, there were misdirected water jets into one of ECAR reactor tanks. During
ECAR treatment, it is important to continuously replenish the dissolved oxygen
in the water, which is being depleted by the chemical reactions in the ECAR
process. This was done through cleverly engineered water jets integrated into a
water recirculation system, which also helped maintain chemical homogeneity in
the bulk solution. Without understanding the underlying chemistry, the installers had
misdirected these water jets, preventing the adequate recharge of dissolved oxygen.
On discovering this mistake, the field engineers inserted a metal spacer in the reactor
and ensured that the jets impinged the water surface as intended.
Second, to cut costs, the industrial partner had purchased inappropriately rated
and falsely labeled electrical wires, which were additionally also poorly installed
electrical wires. This caused overheating and melting of the plastic insulation on
the wire. Furthermore, these wires were buried in a shallow trench in the floor and
covered with concrete. The field engineers, responsible to commission the plant, had
384
A. J. Gadgil et al.
to reinstall and replace all of the faulty wiring and move it to overhead cable trays
for future easy access. In addition, the electrical contacts between the wires and the
steel plate electrodes also needed to be replaced and reinstalled. The galvanizediron (GI) connectors corroded and were replaced with tin-coated connectors which
were coated with electrical grease as a preventative measure against corrosion and
to improve lifetime
Finally, there were large energy losses and voltage drops at the power supply.
The research team had ordered a custom low-voltage DC power supply that would
deliver 80 Amps of DC current to each reactor at a voltage that could be adjusted
manually between 5 volts and 15 volts. They discovered that the busbar used for
the power supply’s output electrical distribution was not electrical-grade copper,
but just plain aluminum (a poorer and cheaper conductor of electricity). The poorer
conductivity could have been compensated with a larger cross section of the busbar,
but was not. So, the reactors kept receiving lower voltage than desired from the
power supply because of the significant voltage (and energy) loss in the aluminum
busbar. A similar problem arose from not using electrical-grade copper in other
parts of current distribution within the ECAR reactors. It took some time and
effort to diagnose these problems. The reactor performance improved after the field
engineers replaced the busbars of aluminum and poor-grade copper with busbars of
electrical-grade copper.
Additional Engineering Work Needed During Commissioning The demonstration plant included many components (Fig. 14.8) in addition to the ECAR reactor
tanks. It was impractical to test and fine-tune the performance of the large pieces
of equipment (e.g., for particle separation) in a controlled laboratory setting. As
a result, the researchers worked on these aspects of the demonstration plant onsite for the first many months. This included tests to calibrate the correct dose of
particle coagulant and flocculation treatment duration and observe and diagnose
any fluctuations in the overall performance of the particle separation equipment.
Only then could a maintenance routine be established to ensure reliable longterm plant performance. For each of the treatment steps, alterations or maintenance
requirements were identified. Two examples follow.
The actual implemented tube settler proved much less effective than expected.
It was then discovered that the plastic lamella that form the core of the tube settler
was incorrectly installed by the overconfident installation expert (who remained in
denial!). The misassembled lamella assembly was damaged beyond repair and had
to be discarded. New lamellae were purchased and correctly installed by Berkeley
field engineers. The field engineers that identified and rectified the problem learned
on the job and found the solution by searching on the Internet and watching YouTube
videos about how to correctly assemble and install the lamellae. After the retrofit, the
tube settler reliably delivered water with low turbidity (<1 Nephelometric Turbidity
Units (NTU)).
Originally, the finished product water was pumped up to the top of the (three
story) school building and stored in a dark blue plastic tank. In summer, the tank
became quite hot making the water unpleasant to drink, and furthermore, the team
14 Stopping Arsenic Poisoning in India
385
Fig. 14.11 Handoff of Dhapdhapi plant from UCB and GCP-JU to Livpure on January 31, 2017.
From left to right: Joydeep Bhattacharjee (Livpure), Pratik Mukherjee (Livpure), Joyashree Roy
(GCP-JU), and Ashok Gadgil (UCB). All manuals were handed over to Livpure after the signing.
From this day onward, Livpure has taken over the responsibility for operating and maintaining the
plant while giving access for the researchers to the plant, on an as-needed basis
engineers figured out that this high temperature was the cause of precipitation of
calcite dust floating on the water. The tanks’ location was moved to a shaded spot
(on top of the water dispensing unit), and the tanks were changed to white color.
This kept the water cool and avoided calcite precipitates. The reduced height also
decreased the excessively high rate of water flow at the dispensing unit.
The team had planned the project timeline such that two technical persons
(either field engineers or researchers) were present and engaged full time at
the site for the first 9 months of the plant operation. They were invaluable in
identifying, diagnosing, and solving numerous technical problems and transferred
the knowledge to the industry partner. The field researchers also developed manuals
for maintenance, engineering, and plant operation that were reviewed by the project
team lead and handed over to Livpure, the industrial partner, on January 30, 2017
(Fig. 14.11).
Until commissioning and for the first several months of regular operation, all
the sludge produced was needed by researchers at JU conducting research on safe
encapsulation of the sludge in structural concrete blocks (Roy et al., 2019). Doctoral
research along similar lines was also conducted earlier by Tara Clancy at University
of Michigan, Ann Arbor. See Clancy et al., (2013) for a good review of arsenicbearing waste management. The team arranged for safe handling and storage of the
sludge on site (Fig. 14.12) and its periodic pickup and disposal at the hazardous
chemicals waste disposal facility in Haldia, by a licensed chemical waste disposal
company, Ramky.
386
A. J. Gadgil et al.
Fig. 14.12 Rathin, one of the locally trained plant operators, is safely storing sludge into the onsite cage, using proper personal protective equipment (PPE)
5 Reaching Scale: Opportunities and Challenges
5.1 Lessons Learned from Innovation, Implementation,
Evaluation, and Adaptation
Based on the extensive experience of past efforts to take new technologies to scale,
the team came to define the concept of the “Critical Effort Zone” (introduced
in the published literature by Hernandez et al. (2019)). The Critical Effort Zone
(Fig. 14.13) is introduced as a part of the commonly defined innovation chain,
along with schematic cash flow for a financially sustainable innovation. As stated
in Hernandez et al. (2019), “the Critical Effort Zone matches the period in the
innovation chain for which the expected cash flow of a project reaches its largest
negative value. In the social embedding process of technology maturation, this zone
requires intense efforts for trust building with key social actors, and ultimately, for
acceptance of the technology by the society that will use the innovation. These
efforts require understanding of human behavior, strategic planning, and deep social
science understanding of the local social context. If efforts during this period
are unsuccessful, the innovation can stagnate or remain unused and perish. In
contrast, if the efforts are successful, the technology may progress toward successful
commercialization and scale-up.”
During this critical zone, GCP-JU served as the locally reputed and trusted
scientific partner that helped deploy capacity-building strategies beyond the large
prototype phase, aiming for long-term sustainability of the project beyond the pilot
14 Stopping Arsenic Poisoning in India
387
Fig. 14.13 A schematic of the Critical Effort Zone for the ECAR project. This zone encompasses
the 600 L prototype at Dhapdhapi High School, its first demonstration plant, and short duration
after the handoff to the industry partner. The figure highlights that the greatest financial expenditure
falls within the Critical Effort Zone, and if the team does not succeed here, scale-up will not be
possible. Note that the vertical axis for the cash-flow bar charts is not to scale. This figure is adapted
from Hernandez et al. (2019)
phase. The duration of the Critical Effort Zone is different for each project. For the
ECAR project, it took about four years (Dec. 2012 to Jan. 2017), comprising part
of the small prototype, the entire large prototype, and the initial commercial stages
of distributing ECAR drinking water to the community. The Critical Effort Zone
consists of successful operation of the field pilot, well-designed communication to
the public by the scientists in field operations, and flexibility toward any technology
redesign needed to fit cultural practices. The actions taken during this zone must
ensure a good fit of the technology to the market needs or “Product-Market
Fit” (Andreessen, 2007), and must build the technical, management, and financial
capacity for a transition to commercialization. During the Critical Effort Zone, the
project team deployed and socially embedded the first ever large-scale ECAR pilot
plant and delivered arsenic-safe drinking water to the first few thousand people daily
for long-term health security.
388
A. J. Gadgil et al.
5.2 ECAR Business Model
Although a technology is capable of delivering arsenic-safe water, only a technology
combined with a viable business model is capable of delivering arsenic-safe water
sustainably, day after day for many years. The ECAR team was very aware that
many grant-funded projects fail to create impact once the grant resources are spent.
Thus, the team worked to build a business model into their early conceptual framing
of the long-term sustainable operation of ECAR technology. Although this chapter
has focused largely on the technical efforts, parallel efforts led largely by GCPJU and also by Berkeley focused on understanding what kind of business model
and behavior change strategies would be most appropriate for the arsenic-affected
communities of West Bengal. Previously, Prof. Joyashree Roy had published on the
household spending on safe drinking water in Kolkata (Roy et al., 2004). A doctoral
student in the Gadgil group, Caroline Delaire, also investigated, through rigorous
in-person surveys of over 500 households in Murshidabad district of rural West
Bengal, the factors that influence consumer’s decisions about purchasing arsenicsafe drinking water and alternatives (Delaire et al., 2017). The Berkeley-JU team
believed that a technically successful demonstration plant that was also financially
viable would reduce the overall risk perceived by the industry partner and provide it
with higher confidence in the financial reward from further scale-up. All this fitted
well with the vision of the funding agency (IUSSTF) for the demonstration plant.
Partnering with a school such as Dhapdhapi High School would provide a familiar
central location and trusted source of public health information and education,
critical to help change behavior.
6 Results and Lessons Learned
Multi-stakeholder Management Requires Attention Partnerships are built and
matured at all stages of the technology development and deployment process and
require close and consistent attention. This signifies continuously explaining and
defining roles among all stakeholders and keeping communication as open as
possible. There will be challenges in the project management among partners when
hiring new staff members, seeing trained engineers leave, and instructing field
researchers from abroad during nature of international efforts separated by time
zones and varying levels of resources.
The design of the two 1000 L reactors required the involvement of all three
partners: UCB, GCP-JU, and Livpure. UCB provided adequate training about
ECAR fundamentals and operation to GCP-JU and Livpure, answering all technical
14 Stopping Arsenic Poisoning in India
389
Fig. 14.14 Official signing, by the headmaster, Shubhendu Biswas (center), of the document
giving “Consent to Establish” and “Consent to Operate” to the ECAR water treatment plant at
Dhapdhapi High School (November 2016). The “Consent to Operate” grants Livpure 10 years of
operation of the plant following yearly performance review of an advisory and a working group.
Also in the photograph are Abhijit Das (left) and Joyashree Roy (right)
and scientific questions to the full extent of their knowledge. Livpure pushed to have
a design that delivered 10,000 LPD.
Thorough and Transparent Documentation Ensures Continuity Despite Unexpected Changes in Stakeholder Leadership This large-scale, multi-year, international project involved many stakeholders. Unexpected changes in leadership can
disrupt the timeline and the anticipated date of completing milestones, causing the
cooperation to be halted or completely altered. A formal documentation signed by
key project members (Fig. 14.14) reduces the risk of the new leader, like a new
school headmaster, questioning the effort and commitment of the organization to
the project. This holds clear accountable expectations among the parties.
Technology Design and Debugging Require Your Boots on the Ground In
the laboratory, the innovation of ECAR became well understood by the team. In
the field, ECAR also reliably removed arsenic, exactly as designed. However, the
remaining aspects of scaled-up processes of sludge separation and elements of
the water distribution technology encountered unexpected challenges that could be
identified, diagnosed, and resolved only because of the full involvement of research
personnel. Thus, the research team strongly recommends that the first field trials
remain research environments, under realistic conditions, in which the system is
improved upon after feedback and iterations.
390
A. J. Gadgil et al.
Trust Building Is the Foundation for Social Acceptance of a Technology The
concept of social capital becomes evident in development engineering efforts. Local
communities have seen many good-willed researchers come and fail and go away,
never to return. They will have doubts in their minds about why this work is being
carried out. They may keep these doubts among themselves or raise questions
publicly about the motives of the team. Conscious efforts toward transparency
and building mutual trust are a worthwhile and critical investment of time and
effort. These efforts can include periodic public meetings with community leaders
and open-mike sessions with the community and making analysis and data fully
accessible.
Schools Can Be Effective Locations for Addressing a Public Health Concern
A local public school provides an excellent means of transferring information to the
students, teachers, staff, and parents and families of the students. The ECAR team
held informational sessions and large inauguration events at the school, inviting
questions from community members. They assisted with science fair entries and a
student poster competition about arsenic in drinking water. The water debit cards
used to dispense water from the automatic dispensing units carried messaging on
the importance of drinking arsenic-safe water. These activities allowed for the
diffusion of public health awareness on arsenic, as well as better understanding
and acceptance by the community of the team’s efforts in providing arsenic safe
drinking water.
Plans Will Change in the Field Researchers will face technical problems in
the field in resource-poor settings. It is also likely that researchers will not have
immediate access to the principal investigators (PIs) or other supervisors and thus
will need to either work within their capacities or hold off on certain action items.
These experts are also likely to be remote and will be pressed to diagnose the root
cause of the observed problem from incomplete information with very limited or
no analytical instruments on-site. Thus, the entire team needs to be resourceful in
low-income, rural settings and be prepared for much slower progress with the same
hard effort they may make in a technologically better-resourced environment.
6.1 Cost of Reducing Cancer Risk by Removing Arsenic
from Drinking Water
The lifetime excess risk of internal cancer from drinking water with arsenic at
250 ppb is 18 per 100 (Fig. 14.15). Reducing arsenic concentration to 3 ppb means
that the lifetime risk is lowered to 0.23 per 100, signifying an 80-fold reduction
in lifetime cancer risk for those drinking water from the Dhapdhapi plant. The
safe water sells at 1 US cent per L (or INR six per 10 L), serving about 8000
people. For a simple estimate (without discounting, etc.), assume 1 L (i.e., eight
cups) of drinking water consumption per person per day and a 70-year lifespan. So,
14 Stopping Arsenic Poisoning in India
391
Fig. 14.15 The lifetime excess risk of internal cancer from drinking water with arsenic at 250 ppb,
which is typical of groundwater in arsenic-affected areas, is about 18,360 per 100,000 people. The
lifetime excess cancer risk of consuming arsenic at 3 ppb is about 230 per 100,000 people. By
drinking ECAR water, which sells at 1 US cent per L, there is an 80-fold reduction in risk. These
numbers are calculated using the EPA risk model (U.S. EPA 2010, which is based on numerous
studies in the scientific literature)
each person spends a sum of USD 255.50 over a 70-year period. When 100 people
spend this much (i.e., spend USD 25,550), 17 of their lives are saved from internal
cancers. This works out to be USD 1500, without discounting, per life saved. In
this calculation, the benefits from avoidance of skin ulcers, gangrene, amputations,
neuropathy, diabetes, heart disease, and social ostracization are ignored.
6.2 Looking Back and Adapting to New Contexts
It is worthwhile to briefly revisit the theory of change, and where the team ended in
India after 14 years of effort (from 2005 to 2019). What worked, what didn’t, and
why? The team can say with high confidence that ECAR performs technically well,
is energy efficient, has zero liquid discharge (ZLD is a coveted goal in sustainability
engineering design), and removes arsenic easily to concentrations below 10 ppb.
ECAR is also economically attractive, financially viable, and socially acceptable
to the community at Dhapdhapi. So, the team fully met three of the four items
in the “Outcomes” (Fig. 14.2). The outcome partially met so far is the interest
from companies and from public agencies at the state and central government
392
A. J. Gadgil et al.
levels in replicating the success at Dhapdhapi. The second-ever ECAR plant is
now in operation in India since early 2021, delivering 5000 L per day of arsenicsafe drinking water. The plant is located at Bahraich in Uttar Pradesh, adjacent to
the Nepal border. This plant is fully solar-PV powered with roof-top solar panels
and has an internal water storage capacity of 15,000 L to provide for three days
of water supply in case of power interruption during heavily clouded skies. With
this second iteration, the layout has improved to include a spacious interior and
redesigned ECAR reactors. This is a great achievement by our industry partner,
and our team hopes that other companies and government agencies will support the
implementation of ECAR plants across arsenic-affected parts of India.
We note that the Central Government of India took the highly unusual step in
February 2016 to release INR 800 crores (INR 8 billion, about USD 120 million)
to the states affected by arsenic and fluoride in their groundwater (P.T.I. 2017).
These are grant funds for capital expenditures to be used by the State Public
Health Engineering Departments (PHEDs) only for community-scale safe drinking
water systems. So, now, the problem, the solution, and the money are all there.
Furthermore, the ECAR team spent a very significant time and effort to register
ECAR at the website of the Ministry of Drinking Water and Sanitation (MDWS) to
invite testing, verification, and certification of the implementation and performance
of the ECAR technology at the operating plant at Dhapdhapi. After such testing and
visits by independent government-appointed experts, the Mashelkar Committee of
the MDWS listed ECAR on its website in August 2019, as an approved technology
for arsenic remediation of groundwater for drinking (eJalshakti, 2019). With this
approval (posted on the website of MDWS), no individual State PHED needs
to undertake its own testing and verification of the ECAR technology, removing
another barrier to the technology’s dissemination.
The estimated number of Indians drinking water above 10 ppb continues to grow,
as more testing data become available. Prof. Chander Kumar Singh and his research
group at TERI University, Delhi, estimate that the number of Indians exposed to
arsenic above 10 ppb in their water exceeds 100 million (Singh 2020).
The IUSSTF project ended in 2016. Beyond IUSSTF, what is the funding
landscape for further work on ECAR? And where is it headed? A large multicampus,
multi-year project led by UCB on water-energy research, funded by the US
Department of Energy, has supported applications of advanced versions of ECAR to
remediate arsenic-bearing wastewater from coal-fired power plants in the USA. The
Philippines has a groundwater arsenic problem in some regions. Since 2018, Gadgil
has collaborated with faculty at their top engineering school, the University of the
Philippines Diliman, to transfer ECAR science and technology from Berkeley to
UP Diliman, supported by the Government of the Philippines. In 2019, the UCB
research group won 3 years of research support from the State of California’s
program to reduce cancer incidence in California populations. This project supports
the UCB group to develop an advanced form of ECAR that must work well in the
California socioeconomic and regulatory environment and to conduct a short field
test in an affected region of rural California.
14 Stopping Arsenic Poisoning in India
393
The requirement of using ECAR chemistry in rural California has led researchers
in the Gadgil Lab to invent two more-advanced versions of ECAR. These two
versions are able to treat a much higher flow of water for arsenic removal than
ECAR at only marginally higher cost but with a much smaller footprint and labor
content. As they rely on the same ECAR principles, therefore the team’s confidence
is high that they will likely function well in the field. Both the advanced technologies
have tested well in the laboratory and in very limited field tests in rural California.
The first of them, called Air Cathode Assisted Iron Electrocoagulation (ACAIE),
has been disclosed and published (Bandaru et al. 2020), and the second, Fe-EC with
External Oxidizer (FOX), is being prepared for publication at the time of this writing
(August 2020).
7 Summary of Key Actions as Viewed by the Team
• Stay focused from the start of technology invention on strong science-based
effectiveness, affordability, environmental safety of removing arsenic, and technology’s fit to a business model.
• Revisit the engineering design often, as the science understanding gets deeper.
• Keep a learning mindset – stay curious about learning everything that might
impact the technology, its implementation, and eventual scale-up.
• Actively seek to identify the team’s weaknesses (“holes” in combined organizational skills and goals), and always look to fill them by reaching out to potential
partners (e.g., unsuccessful outreach to all major industrial players in India and
finally finding Livpure serendipitously through a Zayed Prize connection!).
• Undertake conscious efforts to keep relevant authorities at various levels of the
government informed so the team is not treated as strangers, upstarts, or fly-bynight operators.
• Ensure, as far as possible, transparency and redundancy of skills, so the work
does not collapse owing to one single individual getting removed from the team.
• Aim for written signed MOU agreements from all parties on whom the team
critically depend for their cooperation to be successful. MOUs are not legally
enforceable, but they avoid later accusations of who promised what, and help in
expectation management.
• Undertake outreach effort to the community (e.g., teachers, staff, students, and
nearby community) through public meetings every 6 months or so. Report
progress or setbacks, manage expectations, and answer questions publicly and
honestly to suppress rumors and speculations.
• Work to understand all the stakeholder’s needs and constraints, which may
change throughout the project, and address the issues rationally and through
transparent communication.
394
A. J. Gadgil et al.
8 Interpretive Text Boxes
• A critical role for academia. Academia brings to the table not just an unusual
depth of knowledge, but is also seen as neutral in the sense of not having a longterm financial or political interest in the new social arrangements arising from
introduction of the new technology. Thus, academia could act as a mediator
and coordinator of stakeholders (e.g., UCB’s help to resolve issues between
Shri Hari and Livpure or JU’s frequent coordination between Livpure and the
community/school/government).
• Importance of field work. Apart from the technical aspect of iteratively testing
in the field and improving the prototypes, field work greatly helps in developing
and strengthening relationships with partners who will be essential to scale-up
and sustainable implementation.
• Expectation management. It is very important (and difficult) to manage expectations of stakeholders so they are aligned and timelines are matched. It is
important to repeatedly emphasize and convey the purpose of research. This is
related to outreach efforts to the community, such as removing rumors, inflated
expectations, and misunderstandings.
• Doing Field Work Early and Often. Field work can shape the research
questions being asked. Our field work led to a focus on designing a large-scale
rapid settling stage (based on learning, this was the limiting step in 100 L trials),
robust waste management (based on feedback from the community), steps to
overcome the passivation of electrode plates over long-term use (after 100 L,
600 L, and 2000 L trials), and the need to look at bacterial contamination in
addition to arsenic, among other questions.
• Development engineering research groups are unique. Intense impactoriented research is facilitated by operating in a slightly different way than
how most academic research groups operate. The UCB part of the team included
project scientists and staff engineers who worked as equals in the group, along
with the PI, graduate and undergraduate students, and a part-time administrative
support.
Questions for Discussion
1. Was it right for the team leadership to have a protected dug well installed at the
Amirabad school to offer immediate relief (although it did not work out)? Why
or why not? What was the team’s responsibility, having installed it, to ensure its
successful and continued operation? Was this an example of mission creep?
2. Was the team leadership right in moving their earlier efforts from Bangladesh to
West Bengal, India, for the reasons stated? Why or why not?
3. As noted in the narrative, when the team was testing various minor issues in
the treatment train after arsenic removal from the 1000 L reactors, they kept on
discarding all treated water into a soak pit for 6 months, while local people had to
continue drinking the local arsenic-contaminated water as was the past practice.
Discuss the ethical and legal pros and cons of this decision. Was that the right
decision? Why or why not? What would you do?
14 Stopping Arsenic Poisoning in India
395
4. The narrative mentions rejecting a girls-only school for the field trial (after
the Amirabad blowup) and selecting a coed school to avoid another risk of
controversy. Was that the right decision? Why or why not? Are there options
you think the team should have explored before abandoning the girls-only school
for the site of the field trial? The girls-only school is only 45 minutes by car,
compared to ~2 hours to Dhapdhapi.
5. Discuss the experience described overall, of attempting technology transfer
to what seems like a passive industrial partner. What could have been done
differently for ensuring a more energetic commitment and commercial takeoff,
particularly given that the industrial partner is a nonexclusive licensee of the
technology?
Acknowledgments We would like to thank Professor Joyashree Roy and Dr. Siva Rama Satyam
Bandaru for their invaluable roles in the ECAR project, as well as their careful review of this book
chapter for accuracy of the narrative.
We gratefully acknowledge LBNL’s LDRD program which funded the initial lab research
and the Sustainable Products and Solutions program established at UC Berkeley by the Dow
Chemical company. We also acknowledge phase one and phase two funding from the US EPA’s
P3 program. We also acknowledge the Big Ideas program at UCB, the Blum Center, and USAID’s
Development Impact Lab (DIL) led by UCB. We acknowledge the NSF Graduate Research
Fellowship Program (GRFP) support to Case van Genuchten and Dana Hernandez, in addition
to support from National Science Foundation’s program for Innovation at the Nexus of Food
Energy Water Systems (InFEWS). We also acknowledge support from University of California
Office of the President (UCOP) for Siva Bandaru’s first visit to UCB. We acknowledge JUGCP’s funds which supported their participation in this effort. We acknowledge gift funding
from Siemens Stiftung, Reed Elsevier Foundation, National Collegiate Inventors and Innovators
Alliance (NCIIA), and Jewish Teen Foundation, Marin County. We are grateful to IUSSTF in
our scale-up and commercialization efforts in the last 5 years of the project timeline. Gaps and
shortfalls were filled with Gadgil’s Rudd Chair funds from UC Berkeley campus. These resources
allowed the Berkeley team to take the necessary technical risks that led to a steady increase in
knowledge and confidence, to build up to the 1000 L reactor.
References
Ahmad, A., & Bhattacharya, P. (2019). Arsenic in drinking water: Is 10 μg/L a safe limit? Current
Pollution Reports, 5(1–3), 1137. https://doi.org/10.1007/s40726-019-0102-7
Amini, M., Abbaspour, K. C., Berg, M., et al. (2008). Statistical modeling of global geogenic
arsenic contamination in groundwater. Environmental Science & Technology, 42, 3669–3675.
https://doi.org/10.1021/es702859e
Amrose, S., Gadgil, A., Srinivasan, V., et al. (2013). Arsenic removal from groundwater using iron
electrocoagulation: Effect of charge dosage rate. Journal of Environmental Science and Health,
Part A, 48, 1019–1030. https://doi.org/10.1080/10934529.2013.773215
Amrose, S. E., Bandaru, S. R., Delaire, C., et al. (2014). Electro-chemical arsenic remediation:
Field trials in West Bengal. Science of the Total Environment, 488, 539–546. https://doi.org/
10.1016/j.scitotenv.2013.11.074
Andreessen, M. (2007). Product market fit. Stanford University. https://pmarchive.com/
guide_to_startups_part4.html. Accessed Jan. 2021.
396
A. J. Gadgil et al.
Bandaru, S. R., van Genuchten, C. M., Kumar, A., et al. (2020). Rapid and efficient arsenic removal
by iron electrocoagulation enabled with in situ generation of hydrogen peroxide. Environmental
Science & Technology, 54, 6094–6103. https://doi.org/10.1021/acs.est.0c00012
Brinkel, J., Khan, M. H., & Kraemer, A. (2009). A systematic review of arsenic exposure
and its social and mental health effects with special reference to Bangladesh. International
Journal of Environmental Research and Public Health, 6, 1609–1619. https://doi.org/10.3390/
ijerph6051609
Chakrabarti, K. B. (2017). Arsenic Contamination in Bengal Basin: Reinventing Mitigation
through Participatory Social Innovations. Dissertation. Washington State University. (Accessible via ProQuest Dissertation Database.)
Clancy, T. M., Hayes, K. F., & Raskin, L. (2013). Arsenic waste management: A critical review
of testing and disposal of arsenic-bearing solid wastes generated during arsenic removal
from drinking water. Environmental Science & Technology, 47, 10799–10812. https://doi.org/
10.1021/es401749b
Conceição, P. (2019). Human development report 2019: Beyond income, beyond averages, beyond
today: Inequalities in human development in the 21st century.
Das, A., & Roy, J. (2013). Socio-economic fallout of arsenicosis in West Bengal: A case study in
Murshidabad District. Journal of the Indian Society of Agricultural Statistics, 67, 267–278.
Das, A., Roy, J., & Chakraborti, S. (2016). Socio-economic analysis of arsenic contamination of
groundwater in West Bengal. Springer.
Delaire, C., Das, A., Amrose, S., et al. (2017). Determinants of the use of alternatives to arseniccontaminated shallow groundwater: An exploratory study in rural West Bengal, India. Journal
of Water and Health, 15, 799–812. https://doi.org/10.2166/wh.2017.321
eJalshakti (2019) List of recommended technologies. In: Department of Drinking Water and
Sanitation Government of India. https://ejalshakti.gov.in/MISC/InnovationAccrMC_Rep.aspx.
Accessed 11 Aug 2020
Gadgil, A., Roy, J., Addy, S., et al. (2012). Addressing arsenic poisoning in South Asia. Solutions,
5, 40–45.
Gadgil, A., Amrose, S., Bandaru, S., et al. (2014). Addressing arsenic mass poisoning in South
Asia with electrochemical arsenic remediation. In S. Ahuja (Ed.), Water reclamation and
sustainability (pp. 115–154). Elsevier. https://doi.org/10.1016/B978-0-12-411645-0.00006-7
Ghosh, N., Singh, R. (2009). Groundwater arsenic contamination in India: Vulnerability and scope
for remedy.
Hernandez, D., Boden, K., Paul, P., et al. (2019). Strategies for successful field deployment
in a resource-poor region: Arsenic remediation technology for drinking water. Development
Engineering, 4, 100045. https://doi.org/10.1016/j.deveng.2019.100045
Inauen, J., Hossain, M. M., Johnston, R. B., & Mosler, H.-J. (2013). Acceptance and use of
eight arsenic-safe drinking water options in Bangladesh. PLoS One, 8, e53640. https://doi.org/
10.1371/journal.pone.0053640
Katayama, R., Wadhwa, D. (2019). Half of the world’s poor live in just 5 countries. https://
blogs.worldbank.org/opendata/half-world-s-poor-live-just-5-countries. Accessed 30 Aug 2020.
Karagas, M. R., et al. (2015). Drinking water arsenic contamination, skin lesions, and malignancies: A systematic review of the global evidence. Current Environmental Health Reports, 2(1),
52–68. https://doi.org/10.1007/s40572-014-0040-x
Li, L., van Genuchten, C. M., Addy, S. E., et al. (2012). Modeling As (III) oxidation and removal
with iron electrocoagulation in groundwater. Environmental Science & Technology, 46, 12038–
12045. https://doi.org/10.1021/es302456b
Mackay, H. B. (2005). Swim with the sharks without being eaten alive: Outsell, outmanage,
outmotivate, and outnegotiate your competition. Harper Business.
Mathieu, J. L., Gadgil, A. J., Addy, S. E. A., & Kowolik, K. (2010). Arsenic remediation of drinking
water using iron-oxide coated coal bottom ash. Journal of Environmental Science and Health,
Part A, 45, 1446–1460. https://doi.org/10.1080/10934529.2010.500940
14 Stopping Arsenic Poisoning in India
397
Minatel, B. C., et al. (2018). Environmental arsenic exposure: From genetic susceptibility to pathogenesis. Environment International, 112, 183–197. https://doi.org/10.1016/
j.envint.2017.12.017
National Research Council. (2001). Arsenic in drinking water: 2001 update. The National
Academies Press.
Naujokas, M. F., et al. (2013). The broad scope of health effects from chronic arsenic exposure:
Update on a worldwide public health problem. Environmental Health Perspectives, 121(3), 295.
https://doi.org/10.1289/ehp.1205875
Nordstrom, D. K. (2000). An overview of arsenic mass poisoning in Bangladesh and West Bengal.
India. Minor elements, 21–30.
P.T.I. Press Trust of India (2017). Arsenic affected drinking water in 66,663 habitations: Govt.
In: India news, breaking news, entertainment news | India.com. https://www.india.com/
news/agencies/arsenic-affected-drinking-water-in-66663-habitations-govt-1815142/. Accessed
11 Aug 2020.
Rahman, M. A., Rahman, A., Khan, M. Z. K., & Renzaho, A. M. (2018). Human health risks and
socio-economic perspectives of arsenic exposure in Bangladesh: A scoping review. Ecotoxicology and Environmental Safety, 150, 335–343. https://doi.org/10.1016/j.ecoenv.2017.12.032
Roberts, L. C., Hug, S. J., Ruettimann, T., et al. (2004). Arsenic removal with iron(II) and
iron(III) in waters with high silicate and phosphate concentrations. Environmental Science &
Technology, 38, 307–315. https://doi.org/10.1021/es0343205
Roy, J. (2008). Economic benefits of arsenic removal from ground water — A case study from
West Bengal, India. Science of the Total Environment, 397, 1–12. https://doi.org/10.1016/
j.scitotenv.2008.02.007
Roy, J., Chattopadhyay, S., Mukherjee, S., et al. (2004). An economic analysis of demand for water
quality: Case of Kolkata. Economic and Political Weekly, 39, 186–192.
Roy, A., van Genuchten, C. M., Mookherjee, I., et al. (2019). Concrete stabilization of arsenicbearing iron sludge generated from an electrochemical arsenic remediation plant. Journal of
Environmental Management, 233, 141–150. https://doi.org/10.1016/j.jenvman.2018.11.062
Rybczynski, W. (1991). Paper Heroes: Appropriate Technology: Panacea or Pipe Dream?
Penguin.
Sanchez-Paramo, C. (2020). Countdown to 2030: A race against time to end extreme poverty.
In: World Bank Blogs. https://blogs.worldbank.org/voices/countdown-2030-race-against-timeend-extreme-poverty. Accessed 30 Jun 2020.
Singh, C.K. (2020) Personal communication to Ashok Gadgil.
Smedley, P. L., & Kinniburgh, D. G. (2002). A review of the source, behaviour and distribution of
arsenic in natural waters. Applied Geochemistry, 17, 517–568.
Smith, A. H., Lingas, E. O., & Rahman, M. (2000). Contamination of drinking-water by arsenic in
Bangladesh: A public health emergency. Bulletin of the World Health Organization, 78, 1093–
1103.
Smith, A. H., Lopipero, P. A., Bates, M. N., & Steinmaus, C. M. (2002). Arsenic epidemiology and
drinking water standards. American Association for the Advancement of Science.
U.S. EPA (2010). Toxicological Review of Inorganic Arsenic. Report EPA/635/R-10/001.
Accessed from EPA website on June 20, 2017
UN (2020). https://sdgs.un.org/goals. Accessed August 11, 2020.
van Genuchten, C. M., Addy, S. E., Peña, J., & Gadgil, A. J. (2012). Removing arsenic from
synthetic groundwater with iron electrocoagulation: An Fe and As K-edge EXAFS study.
Environmental Science & Technology, 46, 986–994. https://doi.org/10.1021/es201913a
van Genuchten, C. M., Pena, J., Amrose, S. E., & Gadgil, A. J. (2014). Structure of Fe (III) precipitates generated by the electrolytic dissolution of Fe (0) in the presence of groundwater ions.
Geochimica et Cosmochimica Acta, 127, 285–304. https://doi.org/10.1016/j.gca.2013.11.044
Wang, J. S., & Wai, C. M. (2004). Arsenic in drinking water—A global environmental problem.
Journal of Chemical Education, 81(2), 207. https://doi.org/10.1021/ed081p207
398
A. J. Gadgil et al.
Wasserman, G. A., Liu, X., Parvez, F., et al. (2007). Water arsenic exposure and intellectual
function in 6-year-old children in Araihazar. Bangladesh. Environmental Health Perspectives,
115. https://doi.org/10.1289/ehp.9501
Wikipedia
(2020a).
https://en.wikipedia.org/wiki/Human_right_to_water_and_sanitation.
Accessed August 11, 2020.
Wikipedia. (2020b). https://en.wikipedia.org/wiki/Theory_of_change. Accessed August 11, 2020.
WHO Newsroom (2019) 1 in 3 people globally do not have access to safe drinking water. https://www.who.int/news-room/detail/18-06-2019-1-in-3-people-globally-do-nothave-access-to-safe-drinking-water-unicef-who (Accessed: 15 July 2020).
Open Access This chapter is licensed under the terms of the Creative Commons Attribution 4.0
International License (http://creativecommons.org/licenses/by/4.0/), which permits use, sharing,
adaptation, distribution and reproduction in any medium or format, as long as you give appropriate
credit to the original author(s) and the source, provide a link to the Creative Commons license and
indicate if changes were made.
The images or other third party material in this chapter are included in the chapter’s Creative
Commons license, unless indicated otherwise in a credit line to the material. If material is not
included in the chapter’s Creative Commons license and your intended use is not permitted by
statutory regulation or exceeds the permitted use, you will need to obtain permission directly from
the copyright holder.
Chapter 15
Sensing Change: Measuring Cookstove
Adoption with Internet-of-Things Sensors
Daniel L. Wilson
1 The Challenge of Measuring Impact
Practitioners of development engineering aspire to create new technologies, and the
goal of these new technologies is to have a positive impact for people in need.
Perhaps the technology affords cleaner water, better governance, faster medical
diagnosis, or easier access to public services. Regardless of the technology, we
became development engineers because we want our work to have positive impacts.
In this chapter, I’ll discuss cleaner cooking appliances that were intended to
reduce exposure to air pollution and the drudgery associated with traditional woodfired cooking methods. I’ll discuss the trials and tribulations of creating new kinds of
sensor technologies to make it easier to measure cookstove adoption. This process
spans the course of about 8 years, three major technology variants, and thousands
of households in dozens of countries. In the beginning, I’ll discuss the challenges
of collecting sensor data using clunky industrial data loggers in Sudan. Then, we
will move onto a first round of custom-built data loggers deployed on advanced
cookstoves in India. Then, in a four-country trial with thousands of households
participating, we will explore how an entirely custom Internet of Things (IoT)
sensor, survey, and analytics platform were used to address many of the issues
that arose in the first two experiments. Finally, I’ll share how this cookstove sensor
technology was spun off into a startup sensor company. But first, why all this fuss
about measuring cookstoves?
Cooking is a critical global development challenge because roughly three billion
people rely on traditional wood- or other solid-fueled fires to cook their daily meals
(The World Bank, 2011). The smoke from this practice is one of today’s greatest
D. L. Wilson ()
Geocene Inc., Berkeley, CA, USA
e-mail: danny@geocene.com
© The Author(s) 2023
T. Madon et al. (eds.), Introduction to Development Engineering,
https://doi.org/10.1007/978-3-030-86065-3_15
399
400
D. L. Wilson
environmental health risk factors and is responsible for some 1–4 million premature
deaths per year (Forouzanfar et al., 2015; Lim et al., 2013). Cleaner cookstove
technologies could positively affect this situation, but we will discuss that more
in later sections.
What is impact, and how do we measure it? This is a major topic that
development engineers are grappling with today (Thomas & Brown, 2020). Suppose
you have developed a new novel cookstove technology that reduces emissions by
95%. If that cookstove is only used by a few dozen farmers as part of your research
project, did it have an impact? Alternatively, suppose you make a tiny improvement
to a traditional earthen cookstove; your innovation drives down emissions by 5%,
and you estimate that 10 million cookstoves are built per year using your technology.
Did your small improvement on a traditional technology have an impact?
I would like to propose a framework to think about impacts throughout this case
study. That is, impact is proportional to the product of performance, adoption, and
scale:
I mpact ∝ P erf ormance × Adoption × Scale
I ∝ P AS
This specific framework, which is pronounced “IPAS” (people are better at
remembering acronyms that have to do with beer), is useful for remembering
how multiple, often conflicting, considerations must be taken into account when
measuring impact. For the purposes of this chapter, we can think of the definition of
each of these variables as follows:
• Impact is the realized positive global utility that exists as a result of the existence
of the technology.
• Performance is the marginal difference in outcome between the intervention
state, on an individual product or person level, and the status quo. For example,
for cooking, a good metric of performance might be the difference in personal
relative risk of disease between breathing smoke emissions cooked on a traditional and cleaner cookstove.
• Adoption is the average degree to which the user of an individual unit of
technological intervention (e.g., a single cookstove) utilizes that intervention per
unit time. For example, this could be the average number of cleaner cookstove
uses per week. The study of adoption is part of a broader category of development
practice activities often referred to as “monitoring and evaluation.”
• Scale is the number of users of your intervention.
Of course this model is a gross oversimplification. It is important to remember
that, despite the linear simplicity of the IPAS framework, many real-world systems
have nonlinear relationships. For example, if a cookstove that reduces emissions by
50% will not reduce negative health impacts by 50% in the same way that cutting a
smoking habit from two packs per day to a single pack per day will not reduce lung
cancer risk by 50% (Burnett et al., 2014). The IPAS model also ignores important
considerations such as disadoption of harmful baseline practices, impacts of training
15 Sensing Change: Measuring Cookstove Adoption with Internet-of-Things Sensors
401
and time on performance, temporal changes in scale, and second-order effects such
as how adoption of one technology may lead to virtuous second-order adoption of
more beneficial technologies (adopting solar panels leads to adopting lighting that
leads to better educational outcomes) or negative second-order effects (adopting
microwave cooking leads to consumption of less healthy foods) (Pillarisetti et al.,
2014).
Despite the drawbacks of this simplified model, it does emphasize two aspects of
technological interventions that engineers are notorious for downplaying: adoption
and scale. As engineers, many of us are only trained to improve and measure performance, not adoption or scale. Whether designing a cookstove, water filter, generator,
or other intervention technology, we tend to be very diligent about quantifying the
performance of our interventions. The desire to measure and report metrics such
as efficiency, power, and throughput comes naturally to many engineers. However,
it is important to remember that a great-performing intervention that people do
not like or that just a few people use will not have a significant impact. In fact,
sometimes, higher performance reduces impact because higher performance is often
correlated with factors that drive down adoption and scale such as cost, durability,
multipurpose use, and difficulty of distribution (Jetter et al., 2012).
So, measuring impact is critically important. We know that measuring impact
means more than just measuring performance. We also need to measure adoption (to
what extent an average user utilizes a particular innovation) and scale (the quantity
of users). For the purposes of this chapter, we will focus exclusively on a case study
of how to measure the adoption of cookstoves using Internet of Things (IoT) sensors.
This case study will span my PhD research and then the company that grew out of
that research. So, let’s start by thinking about how to measure adoption.
1.1 Surveys Collect Bad Data
Although most practitioners of development engineering are motivated by good
intentions, our positive intentions do not necessarily lead to positive impacts. When
we create a new technology, we cannot just hope (or expect) that it will improve
lives. Before we can scale up or make any claims about the impacts of technological
interventions, we must carefully measure if and how customers use technological
interventions. We call these patterns of individual customer interaction with a new
technology “adoption.”
Historically, surveys have been the most common “instrument” for monitoring
adoption (Burwen, 2011; Lewis & Pattanayak, 2012). At first glance, survey
instruments seem like an attractive option. After all, most intervention programs
are interested in some basic understanding of questions like the following: Do
customers use our intervention? Do they like it? Would they buy it? Would
they recommend it to a friend? Is the intervention improving their lives in some
meaningful way?
402
D. L. Wilson
Most of these questions feel like they could be reasonably answered in a
thoughtful discussion with a customer. Surveys can be implemented with as little
material as a clipboard and pen, training staff to enumerate a survey is relatively
straightforward, and respondents can give rich contextual color, anecdotes, and
insights in their answers which can be difficult to gather otherwise. These factors
can make surveys seem like a low-cost and high-reward instrument for collecting
data about technological impacts.
However, surveys suffer from two critically important problems: recall errors
and social-desirability bias (Das et al., 2012; Edwards, 1957; Methodology, n.d.;
Thomas et al., 2013; Zwane et al., n.d.). Recall errors result from the difficulty
surveyees have in recalling facts or events, even if the surveyee is trying in
earnest to respond truthfully. In research, my colleagues and I have been interested
in understanding if, why, and to what extent people used their traditional and
intervention cooking appliances.
However, getting quantified metrics about cookstove use through surveys can
be challenging. For example, let me ask you, the reader, how many times and
for how many total minutes did you operate your microwave last month? Well?
This is a difficult question for anyone to answer. Most of us don’t think much
about our personal microwave utilization stats, so you might respond to me by
just guessing a number that “feels right,” or if you’re good with mental math, you
might do some quick thinking to try and estimate an accurate response. Or, more
likely, maybe you won’t say much at all. When I ask this question to students in
university lectures, most students just freeze and say “I . . . I don’t know.” In terms
of measuring quantified impact, these kinds of answers are not very useful.
While recall errors are problematic, they do not necessarily introduce systematic
bias to survey results. In answering the microwave question, we might expect
roughly the same number and degree of overestimated and underestimated answers.
By contrast, the other main drawback of surveys, social desirability bias, does
indeed create problems with systematic bias. Social desirability bias is the tendency
for research subjects to offer the normative or desirable response. This kind of
normative response, where the respondent tells the survey enumerator the “right”
answer that the enumerator “wants to hear,” tends to overstate “positive” behaviors
and understate “negative” behaviors (Nunnally & Bernstein, 1994).
In our microwave example, imagine I had sent that microwave to you as a gift
a few months back. It’s a weird gift, for sure, but then, I’m a weird guy who is
obsessed with cooking appliances. Today, I sit you down with a pad of paper and
a pencil, and I put you on the spot. “How often do you use that microwave?” I
ask. “Well,” you might be inclined to say, “I use that microwave all the time. Every
morning in fact. It’s perfect for oatmeal, which I just love by the way, so I use it
every morning. Yep.”
Nope. You didn’t even take it out of the box because you already have a perfectly
good stove. Also, you hate oatmeal.
Unfortunately, this is usually the social dynamic in development engineering
field studies. Intervention products like pumps, lights, cookstoves, water filters,
and mosquito nets are donated or heavily subsidized by the research project. Then,
15 Sensing Change: Measuring Cookstove Adoption with Internet-of-Things Sensors
403
after some time, study participants are asked to self-evaluate their adoption of the
technology (e.g., “how many nights last week did you sleep under the mosquito
net?”) and other qualitative aspects of the technology’s appropriateness (e.g., “do
you feel like this mosquito net does a good job keeping your family safe from
malaria?”). Multiple research studies have demonstrated that responses to these
kinds of questions are weakly correlated (or not correlated at all) with actual user
behavior (Wilson et al., 2015, 2016a; Wilson et al., 2018). So, how do we measure
actual user behavior?
1.2 Sensors Collect Good Data, But It’s Hard to Do It Right
Sensors are a great choice for collecting cold unbiased data about the physical world.
Sensors can be used to objectively measure facts about the environment such as
the heat from a cookstove, the flow of water through a pump, the flip of a switch,
or the opening and closing of a door (Clasen et al., 2012; Thomas et al., 2020;
Turman-Bryant et al., 2020). When sensors are designed well and implemented in
a thoughtful manner, they can collect data streams that offer insights about users’
behaviors that could not be realized through surveys alone (Iribagiza et al., 2020;
Thomas et al., 2020; Wilson et al., 2017).
As a quick side note: sensors are not immune to bias issues either. Research has
shown that, when users know their behavior is being observed, even by sensors, the
way they behave changes (e.g., they might use an intervention cookstove more). This
effect, where users change behavior when they are aware of being observed, is called
the “Hawthorne Effect” (Landsberger, 1958; McCarney et al., 2007; Methodology,
n.d.; Thomas et al., 2016).
However, sensors alone do not deliver insights or even intelligible data. There is
a wide gap between the raw data collected by data-logging sensors and the insights
most of us expect from sensor-based data collection systems (Kipf et al., 2015;
Wilson et al., 2020). When it comes to interpreting the data from sensor systems,
we have been spoiled by exceptionally vertically integrated and user-friendly
sensor systems, especially in the Internet of Things (IoT) age. Take a modern
IoT pedometer like Fitbit. At its core, a pedometer is a multi-axis accelerometer
measuring acceleration and thousands of samples per second. In the case of Fitbit,
millions of person-hours have gone into turning that raw data stream of thousands
of acceleration samples per second into a beautiful, intuitive, and comprehensible
hardware product and mobile application that allows anyone to collect and visualize
metrics about the number of steps a user has taken of the course of time.
So, where’s the Fitbit of cookstove adoption tracking? Therein lies the problem.
Development engineering practitioners want to ask questions about adoption of
novel technologies, and usually, there are no off-the-shelf sensor systems or IoT
products available to simplify the data collection and interpretation process. As
development engineering practitioners, we find that we’re usually not in a situation
where we can buy an elegant hardware and software solution to solve our adoption
404
Table 15.1 Example data
logger data
D. L. Wilson
Datalogger_id
Logger-314
Logger-314
Logger-314
Logger-314
...
Timestamp
2020-05-01 1:00:00
2020-05-01 1:01:00
2020-05-01 1:02:00
2020-05-01 1:03:00
...
Temperature
20.0 ◦ C
20.2 ◦ C
21.5 ◦ C
22.1 ◦ C
...
monitoring and evaluation needs. Using the pedometer analogy, we’re back in
the situation where we need to collect the thousands of accelerations reading per
person per second and then make sense of the data later on. This means collecting
raw sensor data about flow, temperature, humidity, acceleration, voltage, power,
pH, or whatever other environmental variable correlates well with adoption of the
technology you care about.
The tool of the trade for collecting raw sensor data streams is called a “data
logger.” A sensor is a device that turns some property of the physical world, such
as temperature, into a machine- or human-readable format such as voltage or the
position of a dial. By contrast, a data logger is a device that records the values of
a sensor to memory for later transmission to a computer. Data loggers typically
collect and store sensor data into large flat archives such as comma-separated value
files (Table 15.1).
In the cookstove example, temperature data loggers could be used to collect large
quantities of temperature time series data. Essentially, the output of a temperature
data logger would look like this.
Just raw data, data point after data point and file after file, typically for hundreds
of data loggers and millions of observations. For example, imagine a 100-household
cookstove adoption monitoring and evaluation program. This program monitors two
cookstoves per household for 3 months using data loggers that record temperature
once per minute. This monitoring campaign would collect roughly 26 million
individual data points.
Managing the collection and analysis of this data looks like this can be a major
headache. First, as you can probably surmise from the small collection of top
Google-ranked data loggers in Fig. 15.1, the data logger industry is industrial and
clunky. These devices usually do not come with slick mobile apps and intuitive fleet
management tools. Instead, data from data loggers is typically downloaded by hand
using proprietary cables and dongles using a piece of industrial software which often
only runs on a legacy version of Microsoft Windows as shown in Fig. 15.2. Training
field staff to reliably operate this kind of software has been a significant challenge
in my research.
Successful projects using traditional data loggers must ensure quality across
many critical steps in the data chain. Figure 15.3 shows 12 important steps in the
sensor data chain spanning the time period before data collection begins, while data
collection is taking place and after collection of data has been completed. At any
step along this path, significant data quality issues can be introduced which can
dramatically impact the success of a project. Here are just a few real-world examples
15 Sensing Change: Measuring Cookstove Adoption with Internet-of-Things Sensors
405
Fig. 15.1 The first images for the Google Image Search term “data logger.” Accessed on May 30,
2020
Fig. 15.2 Example of a typical data logger software interface from Maxim OneWireViewer User’s
Guide, version 1.3
of small mistakes that create significant problems in sensor-based data collection
campaigns:
1. Incorrect dates on staff laptops leading to confusion about when data were
actually collected. The data logger gets its clock time from the computer that
406
D. L. Wilson
Fig. 15.3 The data chain for monitoring and evaluation of technology adoption with data-logging
sensors
provisioned it, and the staff’s computers had the wrong time (or even the wrong
date) for some unknown amount of time.
2. Staff incorrectly record metadata when downloading data from data loggers.
For example, data is downloaded, and the file from this data is mistakenly
named household-124.csv instead of household-123.csv; there is no easy way
to even know there was a mistake, let alone correctly know where this data was
downloaded from.
3. Staff do not have adequate training to interpret data quality in real-time, and
research leadership does not have systems in place to oversee data quality.
Therefore, data quality problems persist unseen throughout a study. We have
observed several examples where research staff diligently visit households every
few weeks for months on end to repeatedly download garbage data from a data
logger with a broken sensor. This problem is not noticed until months after the
data collection part of the study is complete.
4. Graduate students with little to no data science experience are tasked with
analyzing huge datasets from these kinds of experiments. It takes months or
years for the students to complete the analysis, and often, the analysis suffers
from statistical or analytical errors.
If there is any broken link in the data chain, an expensive multi-year study can
be significantly damaged or even ruined entirely.
2 Monitoring Cookstove Adoption with Sensors
2.1 Darfur
2.1.1
Implementation Context
In 2012, the war in Darfur, Sudan, had been ongoing for 9 years. As a result of
the conflict, millions of people from rural Darfur had concentrated into camps of
internally displaced persons (IDPs). People in these camps traditionally cooked on
15 Sensing Change: Measuring Cookstove Adoption with Internet-of-Things Sensors
407
Fig. 15.4 Darfuri women carrying fuelwood back to IDP camp. Photo credited to Ashok Gadgil
firewood that was freely collected in the rural areas. However, these new largepopulation centers had put enormous pressure on the woody biomass resource in
and around the camps. Over the years, the radius of complete biomass denudation
increased to the point where, in 2005, it was estimated that women had to walk a
7-hour round trip from the camp to collect enough firewood to cook for just 2 or
3 days (Galitsky et al., 2006) (Fig. 15.4).
These trips were difficult and dangerous with many reports of sexual violence
occurring while women were outside the relative safety of the camps. In many
camps, particularly in the arid North Darfur, fuelwood had become out of reach—
and collection trips on foot had become impossible. The situation had become
desperate enough that many women reported that they had begun to trade their relief
food rations to shady businessmen who would truck in firewood from rural Darfur
and Chad. Women would use the firewood they bartered for to cook what food they
had remaining for their families.
Since 2005, Professor Ashok Gadgil and team at UC Berkeley and Lawrence
Berkeley National Laboratory had been developing and distributing an improved
cookstove called the Berkeley-Darfur Stove (Fig. 15.5). This cookstove had been
demonstrated to reduce fuel use by roughly 50% (Jetter et al., 2012; Rapp et al.,
2016). The hope was this reduction in fuel use would lead to a commensurate
reduction in time, cost, and risk spent collecting or purchasing fuel wood. By 2012,
the work of distributing this cookstove had been transferred to a Berkeley-based
nonprofit organization called Potential Energy. Potential Energy was interested in
quantifying the impact of the 50,000 or so cookstoves that had been distributed to
408
D. L. Wilson
Fig. 15.5 Berkeley-Darfur
Stove
date. At that time, Potential Energy had just changed its name away from the Darfur
Stoves Project. Potential Energy’s executive and assistant directors, Andree Sosler
and Debra Stein, knew me through my relationship with my PhD advisor, Potential
Energy board member, and Berkeley-Darfur Stove inventor Ashok Gadgil.
Our goal was to assess the adoption of about 150 Berkeley-Darfur Stoves just
after they had been distributed for free in the IDP camp near the town of Al Fashir
in North Darfur. The plan was to compare adoption of the cookstove measured by
sensors to self-reported adoption data gathered through surveys. With these two data
sources, our hope was that we could build some sort of regression in order to make
sense of some previously collected survey data about adoption. We hoped to run this
study in two contexts: internally displaced peoples’ camps near Al Fashir as well as
unorganized rural settlements further away from Al Fashir.
Part of Potential Energy’s motivation to perform this adoption study was to
build a case for carbon financing (Wilson et al., 2016b). At the time this study
was conceived, Potential Energy was already working with an organization, Impact
Carbon, that validated carbon credits. Still, additional validation about cookstove
adoption could have supported Potential Energy’s case that the fuel savings of the
Berkeley-Darfur Stove helped to offset anthropogenic CO2 emissions. To measure
the adoption of the cookstoves, Potential Energy was interested in using a sensorbased stove usage monitoring system (SUMS). Seminal work on SUMS had been
15 Sensing Change: Measuring Cookstove Adoption with Internet-of-Things Sensors
409
Fig. 15.6 El Haj Adam of SAG in a sea of Berkeley-Darfur Stoves outside Al Fashir assembly
workshop
performed by Ilse Ruiz-Mercado during her doctoral research at UC Berkeley just
a few years earlier, and Potential Energy decided that they would like to pursue this
approach (Ruiz-Mercado et al., 2008, 2011, 2012, 2013).
Our plan was to work with a local Sudanese nongovernmental organization
(NGO) partner, Sustainable Action Group (SAG), to run the study. SAG would
offer up one of their staff as the study leader and coordinate all of the day-to-day
activities and management of the field staff related to the study. SAG was already
intimately involved with the Berkeley-Darfur Stove Project because they were the
NGO responsible for the local assembly and distribution of cookstoves after the
cookstoves arrived as flat kits to Darfur (Fig. 15.6).
Following in the footsteps of Ilse Ruiz-Mercado, our team had decided to use
Maxim iButton temperature loggers as our stove usage monitoring system (SUMS).
I’ll refer to this term as “SUMS” throughout this chapter whenever discussing
a sensing device that is specifically employed to track cookstove adoption. The
Maxim iButton is a self-powered data logger with all its electronics, temperature
sensor, and battery contained in a metal button of the size and shape of a watch
battery. Some models could withstand temperatures as high as 140 ◦ C. The idea
was that we could install the iButton SUMS on the outside of the cookstoves, and as
the temperature of the cookstove rose, these temperatures would be recorded by the
iButtons, and we could later correlate spikes in temperature with cooking events.
410
D. L. Wilson
Fig. 15.7 Custom iButton case. The iButton data logger itself is the object that looks like a coin
cell battery, second from the left
However, these iButton data loggers were never designed to be used on cookstoves. They had some major weaknesses including a short battery life, and when
the battery died, all of the data was lost. Maxim iButtons are most often used in
the food industry, mounted to the side of huge milk containers inside refrigerated
trucks or inside buffet service stations to ensure food remains cold or hot enough to
be safe for consumption. To adapt the iButtons for use on a cookstove, we designed
an aluminum case that would hold the iButton and keep it firmly pressed against
the surface of the cookstove. This aluminum case also allowed us to clearly stamp
a large alphanumeric code onto the case of the SUMS, for example, “A-12,” which
made it possible to track which data came from which data logger (e.g., “2013-0812 A-12” was data from A-12 downloaded on August 12, 2013) (Figs. 15.7 and
15.8).
Throughout late 2012, our team attempted to obtain a visa to travel to Darfur
to kick off this project with SAG, but due to political turmoil in Sudan and
restrictive policies about visitors from the United States, our team was not able
to secure visas by early 2013. Instead, our team decided that in January 2013,
Angeli Kirk and I would fly to Addis Ababa, Ethiopia, where we would meet up
with a representative of SAG, Abdel Rahman, to do a multiday training session.
Angeli, a research colleague, PhD student, and friend from Berkeley’s Agriculture
and Resource Economics program, would meet up for the latter half of the training
session (and to assess Potential Energy’s expansion opportunities in Ethiopia).
During this training session, we would familiarize Abdel with the design of the
experiment as well as how to use the sensors we would need to implement the study.
I had brought all of the equipment with me to transfer to Abdel who would then take
them into Sudan (Fig. 15.9). We planned to wait until the summer to start the study,
and we were still hopeful that we would be able to secure a future visa to perform
an in-person training with field staff in Darfur sometime in the late spring of 2013.
Therefore, this training served as a kind of “kickoff” where we would get familiar
with the sensors and identify the personnel, facility, and equipment resources that
SAG would need to complete the study.
15 Sensing Change: Measuring Cookstove Adoption with Internet-of-Things Sensors
411
Fig. 15.8 Areidy Beltran, undergraduate research assistant extraordinaire, assembles iButton
SUMS in the mechanical engineering machine shop during finals week, December 2012
2.2 Innovate, Implement, Evaluate, and Adapt
2.2.1
The Lead-Up
As the early months of 2013 wore on, it became clear that our Berkeley-based team
was never going to be able to visit Darfur. In late February, we got an email from Jan
Maes, a consultant who worked for Potential Energy. He let us know that a member
of the Impact Carbon team, Ellie Gomez, had been abducted from her hotel in Darfur
by armed assailants. This was the same hotel I was planning to stay at. Miraculously,
Ellie escaped her kidnappers just minutes after the abduction. This close encounter
happened in the context of frequent stories about aid workers and NGO employees
being kidnapped, held for ransom, and sometimes murdered in Darfur.
The abduction incident threw cold water on our whole study. We had originally
planned to do some studies in the rural settlements surrounding the IDP camps, but
considering the security situation, these plans were scrubbed. Also, we decided we
412
D. L. Wilson
Fig. 15.9 Supplies brought from Berkeley to Ethiopia in January 2013 to be transferred to Darfur
could not even visit individual domiciles in the IDP camps; instead, we would have
to ask women to congregate at an IDP Women’s Center.
These meetings at the Women’s Center were partly necessary to administer
qualitative surveys, but they were also a result of the way iButton sensor data
needed to be downloaded: to access the data, our field staff needed to carry a laptop
computer, a set of cables and dongles, and screwdrivers and wrenches to detach
the data logger from the cookstove. This whole process took about 10 minutes per
cookstove and certainly created quite a spectacle in the IDP camps. If we could have
discretely and wirelessly transmitted the data, it is likely that our study could have
been designed differently.
In addition to creating a custom case for securely holding and attaching the
SUMS to the cookstoves, it was extremely important to identify a good placement
location for the SUMS. Because these iButtons were a fully integrated miniature
data logger in a small case, that meant that the sensitive microcontroller, memory,
and battery would get just as hot as the temperature sensor. Want to measure a
100 ◦ C temperature? Well, the whole data logger has to get that hot.
This posed a significant optimization challenge when measuring cookstove use
in the hot Sudanese desert. The bounds of this design challenge were as follows:
15 Sensing Change: Measuring Cookstove Adoption with Internet-of-Things Sensors
413
1. In order to easily identify temperature spikes in temperature time series data, the
temperature when cooking should be as high as possible.
2. In order to maximize battery life and minimize the risk of damaging the data
logger and losing all the data, the temperature should be as low as possible.
3. The hot summer sun in Darfur could easily heat a cookstove’s surface to 50 ◦ C
or more even when a user was not cooking.
This “get the data logger as hot as possible but not so hot that it destroys
itself or drains the battery before the study is complete but also hot enough to
unambiguously identify cooking apart from solar heating” design challenge required
some significant engineering effort. This challenge was unique to the design of the
iButton SUMS because of the quirk that the sensor was co-located with the battery,
memory, and microcontroller. We used parameterized testing, thermal cameras, and
some optimization calculations around battery lifetime vs. temperature to select a
best-possible mounting location (Fig. 15.10).
Not only was this position-optimization process cumbersome and overwrought,
it had very little potential for scalability or impact. How could any team of other than
well-resourced engineering PhD students replicate this technique for future studies?
Double-Click vs. Single Tap
It’s a muggy January 2013 day in Addis Ababa, Ethiopia. I am sitting on a loveseat
in my hotel room with Abdel Rahman at my side. We’re both looking at the screen of
a laptop that Abdel has brought with him from his NGO office in Sudan. Together,
we’re working through how to use a particularly byzantine piece of data logger
software, but we keep getting hung up on one particular step. Abdel is having a
Fig. 15.10 A Berkeley-Darfur Stove imaged by an infrared camera to determine optimal iButton
SUMS placement, August 2012
414
D. L. Wilson
very difficult time double-clicking certain icons in the software’s user interface. As
in, he just cannot properly execute the double-clicking action. It’s not clear what is
leading to this confusion, because Abdel is clearly computer literate. But he can’t
quite seem to get the timing or positioning of the cursor quite right. Perhaps this is
a new laptop, or maybe he is used to using a wired mouse and not fussing with the
flimsy trackpad and buttons of this low-quality laptop.
We’re spending long stretches of time, sometimes minutes on end, simply trying
to open files, click menus, and generally get the cursor to behave the way Abdel
wants. He’s getting frustrated, and I can feel it. I’m starting to wonder to myself, “if
Abdel, as the senior lead of this project, cannot succeed at this task from the quiet
comfort of a hotel room, how are his dozens of less-educated field staff going to be
successful in the middle of a Darfuri IDP camp in the blazing hot sun surrounded by
countless challenges and distractions?” Abdel is fidgeting next to me in the loveseat
and getting increasingly agitated. He asks for a break, pulls out his phone, and starts
effortlessly navigating the apps and screens, checking email, messaging friends, and
reading articles. I think to myself, “well, that’s interesting.”
This was a formative experience in my journey to build a better system for
monitoring cookstove adoption. Whatever we did long term, we needed it to work
on mobile phones and mobile phones alone.
My experience struggling to use the laptop in the hotel room in Ethiopia with
Abdel Rahman caused me to become increasingly concerned that a laptop-based
sensor data acquisition system would not be appropriate for the field staff in Darfur.
In the spring of 2013, Javier Rosa, an electrical engineering and computer science
PhD student at Berkeley, and I spent considerable effort trying to hack the iButton
dongles to work with Android phones.
However, after much consternation, we were never able to read an iButton with
a phone. But this desire for a system that would allow for a phone-only ecosystem
to provision, deploy, and collect data from SUMS stayed with us (Kipf et al., 2015).
For the time being, we resigned ourselves to the idea that one or two exceptionally
well-trained field staff would need to run the laptop computer to download data
from the iButtons, while the survey enumeration staff would administer the survey
in another area of the Women’s Center.
Given the ubiquity of literacy with mobile phones, we decided to design the
survey-based data collection for our study around an open-source survey tool called
Open Data Kit (ODK). We also designed a sidecar paper survey with identical
questions just in case the phone survey failed. Also, in true mechanical engineering
grad student overengineered fashion, we even designed a little jig to allow field staff
to repeatably take high-quality photos of the survey since the SAG offices in Darfur
lacked any kind of scanner (Fig. 15.11).
Part of the reason we were anxious about the ODK system not working correctly
(and thus implemented the paper survey as a backup plan) was our discovery
that global sanctions on the Sudanese government were blocking Internet traffic
originating from Sudan to ODK’s servers, which were hosted by Google at that
time. We discovered this in late spring 2013, and the experiment was scheduled to
15 Sensing Change: Measuring Cookstove Adoption with Internet-of-Things Sensors
415
Fig. 15.11 The Open Data Kit (ODK) mobile phone and backup jig to take photos of paper
surveys
start that summer. This incident led to a scramble to redeploy the open-source ODK
backend system on Javier’s own server. Pointing traffic originating in Sudan to a
server on US soil was probably still a violation of some sort of international law, but
our attempts to deploy a server in Sudan were not successful. This entire incident,
which could have significantly delayed our experiment if it would have been
discovered a few months later, helped me to understand the value of controlling the
entirety of the data platform when performing field research in heavily sanctioned
countries or countries with extremely restrictive Internet access. We also owe our
success to the open-source feature of the ODK backend system, so it could be ported
to Javier’s server at UC Berkeley.
Meanwhile, around April of 2013, it was becoming clear to our team that Abdel
Rahman was not going to be able to execute this study as we had planned. It
had become increasingly difficult to maintain consistent lines of communication
and continue momentum, progress, and meet schedules with Abdel and SAG. It
seemed like the SUMS study was not a top-of-mind priority for SAG and was losing
momentum. Additionally, it was unclear if Abdel was prepared to lead the complex
administration and oversight of the study from Darfur. Abdel remained a critical
member of our SUMS study team, especially as it related to cookstove assembly
and distribution, but we needed to make an important decision about bringing in
additional help.
On April 10, 2013, Jan Maes, Potential Energy’s consultant, introduced me to
Dr. Mohammed Idris Adam. Dr. Moh (as he liked to be called) was a professor at
Al Fashir University in Darfur. He had been assisting Impact Carbon and Potential
Energy with enumerators of surveys related to carbon credits, and he had become a
trusted collaborator. Over the course of the coming months, Dr. Moh, Angeli, and
I collaborated via email and planned to meet in Addis Ababa in July to coordinate
final plans for the experiment.
416
D. L. Wilson
Around this time, another important hire was made. Potential Energy hired a
Sudanese woman then living in the Bay Area named Omnia Abbas. Omnia was
an incredible resource at Potential Energy. She was fluent in Arabic and English,
intimately familiar with Sudanese culture, and could travel with relative ease back
and forth to Darfur.
I met with Dr. Moh, Omnia, and Potential Energy’s associate director, Debra
Stein, in Addis Ababa in July 2013. The content of this meeting was largely a
repeat of the meeting just 6 months earlier. Unfortunately, the timing of this meeting
was over Ramadan, and the fasting and prayer schedule made it difficult for Dr.
Moh to participate past the midafternoon (this is a common rookie scheduling
oversight made by researchers). But still, the effect of this second meeting was
transformational for the project. In retrospect, the difficult decision to pivot project
leadership just months before the study was slated to begin was one of the most
important decisions we made for the overall success of this project. Before hiring
Dr. Moh and Omnia, our team did not realize the incredible importance of having
an experienced, motivated, and trusted champion for your research study stationed
in the field. Today, I strongly believe that it is impossible for field research to be
administered solely from outside the study site. To this day, one of the first questions
I ask students who are planning field work is “Who is the champion who is located
in the field?” (Fig. 15.12).
Fig. 15.12 Left: Dr. Mohammed “Moh” Idris Adam (top row, third from left) and Abdel Rahman
(top row, fifth from left) with the SUMS field team they assembled in Darfur. Right: In the
foreground, field staff administer surveys to Darfuri IDP women using paper and mobile phonebased techniques. In the background, Dr. Moh and an assistant interact with SUMS using a laptop
computer
15 Sensing Change: Measuring Cookstove Adoption with Internet-of-Things Sensors
2.2.2
417
The Study
In August of 2013, the study in Darfur began in earnest. One of the first things
we noticed was that far more of our sensors were failing due to overheating than
expected. We had invested such careful attention in the placement of the sensors
(e.g., the thermal imaging), but now, we noticed that about 20% of our data loggers
were coming back with symptoms of overheating.
In our survey data, we found that participants who self-reported charcoal as a
primary or secondary fuel source were much more likely to have burned-out sensors.
After some sleuthing by SAG field staff, we discovered that some women like to
burn charcoal in the Berkeley-Darfur Cookstoves even though the cookstove was
only designed to burn wood. In order to adapt the cookstove to the charcoal fuel,
women were flipping the cookstove upside down and packing the bottom of the
stove (close to where the iButton was mounted) with charcoal. This behavior caused
the iButtons to overheat and become unresponsive. It was very valuable to discover
how common this charcoal-cooking behavior was, but it was at the heavy cost of
losing almost 20% of our data. Additionally, this data was lost in a way that biased
study results (participants who don’t use their cookstove can’t burn out their sensors
and therefore were overrepresented in our surviving sensor data).
Throughout the fall, our team performed the hard work of administering a sensorbased data collection program from overseas. Dr. Moh and our team had regular
weekly meetings late at night California time. At first, these meetings covered
mundane issues such as how to buy new data plans for the SIM cards in the ODK
cell phones, if we would be reimbursing the field staff for gasoline, and how to
download and install Dropbox. However, as time went on, an increasing number of
our conversations covered mounting issues related to data quality. “Where’s the data
from household 10?” “I looked through the data, and there are 3 baseline surveys
that are all marked as being from the same respondent.” “The sensor data from
household 153 says that it was collected in the year 1970—what’s going on there?”
Our team was so busy administering the day-to-day activities of the study that we
did not have the time or resources to preprocess any of the data coming back from
Darfur.
While I was occupied with administration work, Angeli Kirk was looking
through some of the early results from sensor data that had been downloaded and
sent back to California via Dropbox. She noticed that a small subset of households
had barely used their stoves yet. She wondered what impact, if any, returning to
the Women’s Center for the follow-up survey (and data download) would have on
future adoption for this group. However, the plan had always been that the data
collection would stop after the follow-up survey visit. Personally, I was struggling
to hold the administration of the project together as it was, and I was not interested
in mission creep to answer a new and unplanned research question. However, after
some prodding from Angeli and an amendment to our institutional review board
(IRB) protocol, I acquiesced. We asked Dr. Mohammed to send future tranches of
follow-up survey takers home with SUMS-equipped stoves instead of taking the
sensors off. A second and final follow-up was planned on the fly just to remove the
418
D. L. Wilson
SUMS. This decision, which was enabled by an early peek at results, turned out to
be vital for our research.
As the plan changes and late-night phone calls carried on, administering the
Darfur SUMS program became a difficult contextual picture to maintain. The
number of caveats and special cases and “oh yeah, that sensor is a different special
case for ___ reason” issues began to mount. These gotchas were cataloged in ad hoc
in emails, paper notebooks, spreadsheets, and mental notes. By the time the last of
the sensor data was being collected in November 2013, we knew our team only had
just a month or two of short-term memory acuity before it would become nearly
impossible to stitch together all of the data into a coherent story.
2.2.3
After the Study
In the winter of 2013, we began assembling the data from the SUMS study. I
personally had never analyzed data of this volume before. Up until that point, I
had just “faked it until I made it” with data analysis. I was comfortable using Excel
and had some really weak MATLAB skills. But the four million data point SUMS
dataset was a huge step up from anything I, or anyone else on our team, had analyzed
before. There were hundreds of files, each with about ten thousand rows of raw
temperature and timestamp data, and our job was to create a coherent story about
how women in Darfur adopted the Berkeley-Darfur Cookstove. We didn’t know
where to start.
A few months earlier, I had carpooled to Burning Man with another graduate
student named Jeremy Coyle. Jeremy was a PhD student in biostatistics at Berkeley,
and he lived across town from me in the student coops. Our team needed some help,
so I rode over to his place on my bike to see if he could help me learn to use R, the
statistical programming language, to analyze the Darfur SUMS dataset.
I had thought that Jeremy and I would just spend an afternoon getting me up
speed with R, and I would be on my way. But eventually, to both of our surprises,
Jeremy and I collaborated on the analysis of the Darfur dataset for the next 3 months.
The amount of time that went into this analysis was far beyond my expectations. As
an aside, Jeremy and I still collaborate on research, software development, and data
analysis to this day.
The majority of this effort was spent creating a cooking-event-detection algorithm that could reliably find the start and end of individual cooking events from
long stretches of temperature time series (Fig. 15.13). Also, there was significant
data cleaning, organizing, and merging of survey and sensor data. Because the
sensor and survey data acquisition systems were completely separate, all of the
merging and comparison efforts needed to be hand-rolled in code. Our team
estimated that we spent 400 person-hours on this analytics effort. In 2020, the going
rate for quality data science consulting is about $300/hour. Although a professional
senior data scientist would probably be able to finish this analysis faster than we
did, an analysis like this could easily cost on the order of $100,000. However, more
likely, a smaller NGO or development agency that wanted to deploy sensors to
15 Sensing Change: Measuring Cookstove Adoption with Internet-of-Things Sensors
419
Fig. 15.13 An example of a temperature time series to illustrate the challenge of creating a
deterministic algorithm to count and quantify “cooking.” Where do the cooking events start and
stop? Axis scales intentionally left blank, but vertical (Y) is temperature, and horizontal (X) is time
monitor cookstove adoption would find themselves stuck at the data analysis step
and might resort to a much simpler analysis that didn’t realize the full value of the
data. This experience helped me to realize the massive investment in time and/or
money to analyze sensor data for development research. This investment was likely
a major barrier to ubiquitous deployment of sensors for research.
2.2.4
What We Learned
The Darfur SUMS study ended up teaching us many valuable lessons. We found
that about 75% of women adopted the Berkeley-Darfur Stove (Wilson et al., 2016a).
For the women who did not adopt it, we found out that about 80% of them could
be converted into adopters simply through the act of conducting the first followup. Angeli was right. Without her early analysis and encouragement to change the
research study, we would have never known this important insight that non-adopters
just needed a small nudge to become adopters. In addition to this, we confirmed
what we believed about the quality of survey data to assess adoption of technology;
no matter how we asked the question, we were not able to assess adoption of the
Berkeley-Darfur Stove through surveys. As shown in the figure below, when asked
a question about how many times per day she uses her Berkeley-Darfur Stove, cooks
almost always respond with the socially desirable response: three (every meal).
The number of times someone self-reports cooking in surveys has essentially no
correlation with their behavior measured by sensors (Fig. 15.14).
In addition to what we learned about how women in Darfur use cookstoves,
we learned even more about what it takes to run an effect sensor-based impact
evaluation. Some of the most important takeaways from Darfur were as follows:
1. Analytics is a major barrier to effective deployments of sensors for monitoring
and evaluation.
2. Field staff are far more comfortable with mobile phones than with laptop
computers, and mobile phones do not attract the attention that computers do.
420
D. L. Wilson
Fig. 15.14 Cooking events
measured by self-report vs.
SUMS
3. Training field staff to deploy industrial data loggers using industrial tools is
extremely difficult and error-prone.
4. Cookstove sensors that cannot survive cookstove temperatures are bound to
break.
5. The higher a temperature a cookstove sensor can measure, the clearer its cooking
signal will become, and the more easily analytics can be run on the data.
6. It’s common for data loggers’ batteries to die during a study. So, a dead battery
should not erase all of the data from the logger (as happens with iButtons).
7. The ability to continuously and easily audit data in real-time as it is collected
in the field is critical to maintaining data integrity and communicating feedback
about data quality issues to your field team and for potentially asking interesting
new questions during your study.
8. Every time a person needs to take an action in the sensor data chain, anything
from naming a file to adding an attachment to an email, you are opening your
project up to significant risks in terms of coordination, privacy, and data quality.
9. If it takes the undivided attention of a PhD student and 2 years of significant
technical and administrative effort to execute a relatively small sensor-based
impact evaluation, then sensor-based impact evaluations are too burdensome for
all but the most well-funded academic research studies.
2.2.5
Where We Went Next
SUMSarizer One of the main takeaways from the seminal work in Darfur was that
analyzing sensor data for impact evaluation was extremely difficult. Jeremy Coye,
Ajay Pillarisetti from Public Health, and I were very interested in democratizing
event detection from time series data. We wanted to make it easier for coding-naive
users to summarize SUMS data, so we began work on a machine learning tool called
SUMSarizer. SUMSarizer was a web-based “label and learn” tool that allowed users
to import raw SUMS files from common SUMS data loggers. Once imported, users
15 Sensing Change: Measuring Cookstove Adoption with Internet-of-Things Sensors
421
Fig. 15.15 The home screen of the SUMSarizer web application
could highlight which sections of the time series data they believed represented
cooking. Over time, SUMSarizer would learn to identify cooking events, even in
complex data. SUMSarizer would then summarize the cooking data and output
results that could be more easily interpreted in a simpler tool like Excel. SUMSarizer
allowed someone who did not know how to write code to repeat the Darfur analysis
that took Jeremy and me 3 months in about 3 hours.
Unfortunately, we still had some hard lessons to learn. The development of the
web application was funded by a single ~$30 K grant from Center for Effective
Global Action (CEGA) at Berkeley. This money went toward research stipends for
the creators, but we did not stop to think about the ongoing costs of maintaining a
popular web application. As the user base of SUMSarizer grew over the years, the
cost of maintaining SUMSarizer grew significantly. Tens of millions of data points
to warehouse, cloud service subscriptions to maintain, and significant user technical
support to maintain were costing Jeremy and I, personally, thousands of dollars per
year. Without the ability to find ongoing support for the platform, in 2019, we made
the hard choice to shut down SUMSarizer.com and open source its machine learning
code1 (Fig. 15.15).
ASUM Some of the core challenges of using iButtons as SUMS inspired the
creation of the Advanced Stove Usage Monitor (ASUM). The ASUM was designed
1 https://github.com/geocene/sumsarizer
422
D. L. Wilson
by Advait Kumar, Abhinav Saksena, Meenakshi Monga, and me at the Indian
Institute of Technology (IIT) Delhi during a 2014 Fulbright Fellowship to India.
Unlike the iButton, the ASUM was compatible with multiple sensor input channels,
had nonvolatile memory that could survive a dead battery, had room for billions
rather than thousands of samples, and used microSD card storage instead of a
proprietary interface that required custom dongles and Windows-only software. The
ASUM was powered by an Arduino-compatible Atmel microcontroller, and for our
research program in India, we integrated its multichannel analog frontend with an
advanced cookstove’s internal thermoelectric generator, USB charging port, battery,
fan, and a proximity switch (Fig. 15.16).
The flexibility of the ASUM allowed us to perform novel research about how
advanced cookstoves with inbuilt thermoelectric generators are adopted, namely,
how the ability of a cookstove to power a USB port for charging a cellphone and
other small appliances influenced adoption of the cookstove (Wilson et al., 2018).
Also, the ASUM allowed our team, for the first time, to be able to administrate an
entire cookstove impact evaluation using only mobile phones. Most Android phones
at the time had a slot for microSD card expansion storage, and we used this port to
read the cards and then transmitted the data to the cloud with the phones. The data
from ASUMs were analyzed using SUMSarizer.
However, ASUM was not without its problems. It was a boutique purpose-built
device for our study. The device could not maintain charge on a reasonable-size
battery for more than a couple weeks, it was not very rugged and had no integrated
tool for metadata collection (e.g., which household the data logger was deployed
in), and the flexibility of the microSD card was as much a liability as a feature; on
a few of the ASUM microSD cards we retrieved from the field, we found all of our
data was missing and had been replaced by MP3 files of Bollywood music.
Geocene The most recent iteration of a stove usage monitoring system is Geocene.
Today, in summer 2020, I am the CEO of Geocene. Geocene makes a fully integrated
SUMS product. The three pillars of this system are as follows:
1. The Geocene Temperature Logger (also known as the “Dot”). This data logger
runs on replaceable AAA batteries that can be found in almost any small town
in the world, uses rugged thermocouple probes that can withstand temperatures
up to 500 ◦ C, has over a year of storage and battery life, and communicates over
Bluetooth Low Energy (BLE).
2. The Geocene Mobile App runs on Android or iOS and is the only tool field
staff need to provision and collect data from Dots. The mobile application also
has an inbuilt survey feature. This allows survey data to be collected alongside
sensor data, making easy the process of merging, filtering, and analyzing data
with survey questions as covariates. The mobile application is designed to run
even without access to the Internet, but when it does have access, it syncs its data
to the cloud.
3. Geocene Studies is a cloud-based web application that organizes users’ sensor
and survey data and leverages the SUMSarizer engine to analyze data from the
15 Sensing Change: Measuring Cookstove Adoption with Internet-of-Things Sensors
423
Fig. 15.16 Top: Evolution of the ASUM from breadboard to final manufactured device. Bottom:
ASUMs installed on BioLite cookstoves undergoing functional testing at IIT Delhi
Dots. Today, Studies is analyzing data from about 7000 cookstoves every day,
has hundreds of active users, and contains about 1 billion individual temperature
samples (Fig. 15.17).
Geocene has supported several very large field trials including the Household
Air Pollution Investigation Network (HAPIN) with about 3200 households and
LEADERS Nepal with about 2000 households. In addition to cookstove projects,
Geocene’s platform also supports electricity-monitoring and GPS asset-tracking
sensors. Using these tools, Geocene has also supported international development
424
D. L. Wilson
Fig. 15.17 Clockwise from top-left: a Geocene Dot-brand thermocouple data logger, the Geocene
mobile application, and a screenshot of temperature time series data with cooking events detected
and highlighted from Geocene’s web application, Geocene Studies
projects monitoring electric grids and tracking the leakage of aid through supply
chains and onto the black market.
However, despite these large projects, Geocene does not generate enough
revenue from supporting cookstove programs to employ the talented professional
engineering team it takes to support such a modern and highly integrated IoT
product. Today, most of Geocene’s revenue comes from consulting work for Silicon
Valley companies building IoT products. Still, the founding and heart of Geocene
are still sensor-based impact evaluation for the developing world.
3 Summary
As development engineers, we strive to develop technologies that will improve
lives. However, measuring impact is a complex exercise that must consider product
performance, adoption, and scale (IPAS). Historically, measuring adoption relied
on self-reported surveys, but we have discussed and demonstrated in this chapter
that sensor-based objective evaluation of product adoption is a more reliable and
informative measure of adoption behaviors.
Still, deploying sensors came with significant challenges related to sensor
provisioning, data collection, warehousing, and analytics. To solve these problems,
we built three major iterations of cookstove sensor platforms from cookstoves and
15 Sensing Change: Measuring Cookstove Adoption with Internet-of-Things Sensors
425
ODK, to ASUM, to the Geocene Dot and Studies platform. In each subsequent
iteration, we endeavored to move field work to intuitive mobile interfaces and
analytics to cloud-based coding-naive point-and-click systems. In doing this, our
goal was to make sensor-based monitoring and evaluation more accessible to
broader groups of users.
This journey has been an incredibly enriching part of my life. I hope this chapter
has helped the reader imagine some of the possibilities that a career in development
engineering could afford. In your own work, my colleagues and I hope you take the
lessons we learned into consideration. Aim for impact, measure reality, and keep on
iterating toward a future with less poverty and more justice for all human beings.
Discussion Questions
1. When Internet-connected sensors are the dominant instruments used for data
collection rather than surveys, how do we still engage local communities to
participate in data collection? What happens to capacity building and job
opportunities that used to be afforded to large teams of survey enumerators.
2. If you had $25 K to spend on an impact evaluation of 100 households in rural
India but the sensors you needed to perform this evaluation cost $500 each,
what would you do? Propose a rough budget that includes travel expenses, staff
salaries, incidentals, and sensors.
3. Given what you have learned in this case study, if you were designing a sensorbased field study of technology adoption, what would be your top-three priorities
in terms of designing the study?
4. Sensors can offer objective observations about the physical environment, but
what are three ways you can imagine sensors fail to teach us what we need to
know about technology adoption?
References
Burnett, R. T., Pope, C. A. I., Ezzati, M., Olives, C., Lim, S. S., Mehta, S., et al. (2014). An
integrated risk function for estimating the global burden of disease attributable to ambient fine
particulate matter exposure. Environmental Health Perspectives, 122, 397–403.
Burwen, J. (2011). From technology to impact: Understanding and measuring behavior change
with improved biomass cookstoves (pp. 1–60). Energy and Resources Group, University of
California.
Clasen, T., Fabini, D., Boisson, S., Taneja, J., Song, J., Aichinger, E., et al. (2012). Making
sanitation count: Developing and testing a device for assessing latrine use in low-income
settings – Environmental Science & Technology (ACS publications). Environmental Science
& Technology, 46, 3295–3303. https://doi.org/10.1021/es2036702
Das, J., Hammer, J., & Sánchez-Paramo, C. (2012). The impact of recall periods on reported
morbidity and health seeking behavior. Journal of Development Economics, 98(1), 76–88.
https://doi.org/10.1016/j.jdeveco.2011.07.001
Edwards, A. L. (1957). The social desirability variable in personality assessment and research.
Dryden Press.
Forouzanfar, M. H., Alexander, L., Anderson, H. R., Bachman, V. F., Biryukov, S., Brauer, M.,
et al. (2015). Global, regional, and national comparative risk assessment of 79 behavioural,
426
D. L. Wilson
environmental and occupational, and metabolic risks or clusters of risks in 188 countries, 19902013: A systematic analysis for the Global Burden of Disease Study 2013. The Lancet, 386,
2287–2323. https://doi.org/10.1016/S0140-6736(15)00128-2
Galitsky, C., Gadgil, A. J., Jacobs, M., & Lee, Y.-M. (2006). Fuel efficient stoves for Darfur camps
internally displaced persons report of field trip to north and South Darfur, Nov. 16 – Dec.17,
2005 – LBNL-59540 (pp. 1–43). Lawrence Berkeley National Laboratory.
Iribagiza, C., Sharpe, T., Wilson, D. L., & Thomas, E. A. (2020). User-centered design of an air
quality feedback technology to promote adoption of clean cookstoves. Journal of Exposure
Science & Environmental Epidemiology, 1–12. https://doi.org/10.1038/s41370-020-0250-2
Jetter, J. J., Zhao, Y., Smith, K. R., Khan, B., Yelverton, T., DeCarlo, P., & Hays, M. D.
(2012). Pollutant emissions and energy efficiency under controlled conditions for household
biomass Cookstoves and implications for metrics useful in setting international test standards.
Environmental Science & Technology, 46, 10827–10834.
Kipf, A., Brunette, W., Kellerstrass, J., Podolsky, M., Rosa, J., Sundt, M., et al. (2015). A proposed
integrated data collection, analysis and sharing platform for impact evaluation. Development
Engineering, 1–9. https://doi.org/10.1016/j.deveng.2015.12.002
Landsberger, H. A. (1958). Hawthorne revisited. Ithaca.
Lewis, J. J., & Pattanayak, S. K. (2012). Who adopts improved fuels and cookstoves? A systematic
review. Environmental Health Perspectives, 120(5), 637. https://doi.org/10.1289/ehp.1104194
Lim, S. S., Vos, T., Flaxman, A. D., Danaei, G., & Shibuya, K. (2013). A comparative risk
assessment of burden of disease and injury attributable to 67 risk factors and risk factor clusters
in 21 regions, 1990–2010: A systematic analysis for the Global Burden of Disease Study 2010.
The Lancet, 380, 2224–2260.
McCarney, R., Warner, J., Iliffe, S., van Haselen, R., Griffin, M., & Fisher, P. (2007). The
Hawthorne effect: A randomised, controlled trial. BMC Medical Research Methodology, 7(1),
30. https://doi.org/10.1186/1471-2288-7-30
Methodology, B. B. I. J. O. S. R., 2010. (n.d.). The Hawthorne effect in community trials in
developing countries. Taylor & Francis. https://doi.org/10.1080/13645570903269096
Nunnally, J. C., & Bernstein, I. H. (1994). Psychometric theory (3rd ed.). McGraw Hill.
Pillarisetti, A., Vaswani, M., Jack, D., Balakrishnan, K., Bates, M. N., Arora, N. K., & Smith, K.
R. (2014). Patterns of stove usage after introduction of an advanced cookstove: The long-term
application of household sensors. Environmental Science & Technology, 48(24), 14525–14533.
https://doi.org/10.1021/es504624c
Rapp, V. H., Caubel, J. J., Wilson, D. L., & Gadgil, A. J. (2016). Reducing ultrafine particle emissions using air injection in wood-burning cookstoves. Environmental Science & Technology,
50(15), 8368–8374.
Ruiz-Mercado, I., Lam, N. L., & Canuz, E. (2008). Low-cost temperature loggers as stove use
monitors (SUMs). Boiling Point.
Ruiz-Mercado, I., Masera, O., Zamora, H., & Smith, K. R. (2011). Adoption and sustained
use of improved cookstoves. Energy Policy, 39(12), 7557–7566. https://doi.org/10.1016/
j.enpol.2011.03.028
Ruiz-Mercado, I., Canuz, E., & Smith, K. R. (2012). Temperature dataloggers as stove use monitors
(SUMs): Field methods and signal analysis. Biomass and Bioenergy, 47, 459–468.
Ruiz-Mercado, I., Canuz, E., Walker, J. L., & Smith, K. R. (2013). Quantitative metrics of stove
adoption using Stove Use Monitors (SUMs). Biomass and Bioenergy, 57, 136–148.
The World Bank. (2011). Household cookstoves, environment, health, and climate change (pp.
1–94). The World Bank.
Thomas, E. A., & Brown, J. (2020). Using feedback to improve accountability in global
environmental health and engineering. Environmental Science & Technology, acs.est.0c04115–
10. doi:https://doi.org/10.1021/acs.est.0c04115.
Thomas, E. A., Barstow, C. K., & Rosa, G. A. (2013). Use of remotely reporting electronic
sensors for assessing use of water filters and cookstoves in Rwanda. Environmental Science
& Technology.
15 Sensing Change: Measuring Cookstove Adoption with Internet-of-Things Sensors
427
Thomas, E. A., Tellez-Sanchez, S., Wick, C., Kirby, M., Zambrano, L., Abadie Rosa, G., et al.
(2016). Behavioral reactivity associated with electronic monitoring of environmental health
interventions—A cluster randomized trial with water filters and cookstoves. Environmental
Science & Technology, 50(7), 3773–3780. https://doi.org/10.1021/acs.est.6b00161
Thomas, E. A., Kathuni, S., Wilson, D. L., Muragijimana, C., Sharpe, T., Kaberia, D., et al.
(2020). The drought resilience impact platform (DRIP): Improving water security through
actionable water management insights. Frontiers in Climate, 2, 258–211. https://doi.org/
10.3389/fclim.2020.00006
Turman-Bryant, N., Sharpe, T., Nagel, C., Stover, L., & Thomas, E. A. (2020). Toilet alarms:
A novel application of latrine sensors and machine learning for optimizing sanitation services in informal settlements. Development Engineering, 5, 100052. https://doi.org/10.1016/
j.deveng.2020.100052
Wilson, D. L., Adam, M. I., Abbas, O., Coyle, J., Kirk, A., Rosa, J., & Gadgil, A. J. (2015).
Comparing cookstove usage measured with sensors versus cell phone-based surveys in Darfur,
Sudan. In S. Hostettler, E. Hazbourn, & J.-C. Bolay (Eds.), Technologies for development (pp.
211–221). Springer International Publishing. https://doi.org/10.1007/978-3-319-16247-8_20
Wilson, D. L., Coyle, J., Kirk, A., Rosa, J., Abbas, O., Adam, M. I., & Gadgil, A. J. (2016a).
Measuring and increasing adoption rates of cookstoves in a humanitarian crisis. Environmental
Science & Technology, 50(15), 8393–8399. https://doi.org/10.1021/acs.est.6b02899
Wilson, D. L., Talancon, D. R., Winslow, R. L., Linares, X., & Gadgil, A. J. (2016b, January).
Avoided emissions of a fuel-efficient biomass cookstove dwarf embodied emissions. Retrieved
August 9, 2017, from.
Wilson, D. L., Coyle, J. R., & Thomas, E. A. (2017). Ensemble machine learning and forecasting
can achieve 99% uptime for rural handpumps. PLoS One, 12(11), e0188808. https://doi.org/
10.1371/journal.pone.0188808
Wilson, D. L., Monga, M., Saksena, A., Kumar, A., & Gadgil, A. J. (2018). Effects of USB port
access on advanced cookstove adoption. Development Engineering, 3, 209–217. https://doi.org/
10.1016/j.deveng.2018.08.001
Wilson, D. L., Williams, K. N., & Pillarisetti, A. (2020). An integrated sensor data logging, survey,
and analytics platform for field research and its application in HAPIN, a multi-center household
energy intervention trial. Sustainability, 12(5), 1805–1815. https://doi.org/10.3390/su12051805
Zwane, A. P., Zinman, J., & Van Dusen Proceedings of the, E., 2011. (n.d.). Being surveyed can
change later behavior and related parameter estimates. Proceedings of the National Academy
of Sciences. https://doi.org/10.1073/pnas.1000776108/-/DCSupplemental
Open Access This chapter is licensed under the terms of the Creative Commons Attribution 4.0
International License (http://creativecommons.org/licenses/by/4.0/), which permits use, sharing,
adaptation, distribution and reproduction in any medium or format, as long as you give appropriate
credit to the original author(s) and the source, provide a link to the Creative Commons license and
indicate if changes were made.
The images or other third party material in this chapter are included in the chapter’s Creative
Commons license, unless indicated otherwise in a credit line to the material. If material is not
included in the chapter’s Creative Commons license and your intended use is not permitted by
statutory regulation or exceeds the permitted use, you will need to obtain permission directly from
the copyright holder.
Chapter 16
Reimagining Excreta as a Resource:
Recovering Nitrogen from Urine
in Nairobi, Kenya
William A. Tarpeh, Brandon D. Clark, Kara L. Nelson, and Kevin D. Orner
1 Development Challenge (Problem Identification)
1.1 Sanitation as Development Challenge
Access to sustainable sanitation in the developing world is lacking, fundamental,
and overlooked. Globally, 1 in 3 people still do not have access to improved
sanitation, contributing to over 3.6 million water-related, preventable deaths each
year (WHO/UNICEF Joint Water Supply et al., 2015). In Kenya, 75% of the
population lives in rural areas with little access to sanitation infrastructure (World
Health Organization, 2013). Nairobi, the capital of Kenya, only treats half of its
wastewater and often uses untreated wastewater to irrigate crops (Scott et al., 2004).
Irrigating food crops with untreated wastewater leads to a high risk of exposure to
pathogens for consumers (United Nations, 2015, p. 6). Only 10–15% of Nairobi’s
informal settlements are sewered, and sewer pipes are often broken or clogged.
W. A. Tarpeh ()
Stanford University, Stanford, CA, USA
e-mail: wtarpeh@stanford.edu
B. D. Clark
Department of Chemical Engineering, Stanford University, Stanford, CA, USA
e-mail: bdclark4@stanford.edu
K. L. Nelson
Department of Civil & Environmental Engineering, University of California Berkeley, Davis Hall,
Berkeley, CA, USA
e-mail: karanelson@berkeley.edu
K. D. Orner
Department of Civil & Environmental Engineering, West Virginia University, Morgantown, WV,
USA
e-mail: kevinorner@mail.wvu.edu
© The Author(s) 2023
T. Madon et al. (eds.), Introduction to Development Engineering,
https://doi.org/10.1007/978-3-030-86065-3_16
429
430
W. A. Tarpeh et al.
In total, four million tons of human waste from Kenya’s informal settlements are
dumped untreated into waterways each year – polluting the environment, spreading
disease, and threatening community health (Auerbach, 2016).
Sanitation is fundamental – it improves public health and environmental quality
by separating excreta from water, food, and soil, reducing the prevalence of
preventable diseases like cholera, dysentery, and typhoid; it also improves women’s
lives by increasing access to nearby toilets, saving time and decreasing the risk
of sexual violence (World Health Organization, 2011). School sanitation facilities
increase girls’ attendance and literacy rates, thereby improving women’s job
opportunities (World Health Organization, 2019). When people are not sick at home,
productivity at school and work increase, generating more income. The global
cost of inadequate sanitation is $260 billion, including healthcare costs, premature
deaths, and productivity losses (Ki-Moon, 2013). The loss of productivity due to
sanitation-related illness costs Kenya’s GDP a million dollars a day (O’Keefe et al.,
2015; UN-Habitat 2006); instead, the average dollar invested in sanitation shows a
fivefold return (Ki-Moon, 2013). In addition to improving public health, sanitation
also addresses environmental quality. Untreated excreta cause nutrients in the form
of nitrogen and phosphorus to be released in high concentrations, irreversibly
altering aquatic environments and contaminating groundwater (Galloway et al.,
2008; Kringel et al., 2016).
Sanitation is overlooked, with access expanding more slowly than for drinking
water because of less investment, although both are needed to prevent water-related
diseases (Ki-Moon, 2013). To inspire and facilitate a global response for sanitation
progress, Millennium Development Goal 7(c) aimed to halve the number of people
without sustainable access to sanitation by the end of 2015. Since this goal was
not met (Fig. 16.1), the Sustainable Development Goals, approved by the UN in
2015, revised the MDG commitment to “achieve access to adequate and equitable
sanitation and hygiene for all and end open defecation” by 2030 (United Nations,
2015). In Kenya, sanitation infrastructure has not kept up with population growth,
leading to the net failure to meet Millennium Development Goal 7(c): 70% of the
country in 2015 did not have access to improved sanitation (WHO/UNICEF Joint
Water Supply et al., 2015). At current rates, reaching complete sanitation coverage
in Kenya will take 150 years. As a result, low-income communities like Mukuru,
an urban Nairobi informal settlement with over 185,000 residents, are left without
adequate sanitation solutions. These implications extend beyond Nairobi as the
majority of people in the developing world live with untreated feces and urine in
their communities.
The developing world’s sanitation needs will intensify in the next few decades,
necessitating robust sanitation methods that can be rapidly and efficiently implemented. Providing access to sanitation will be particularly challenging in urban
informal settlements, which will double in population over the next decade; this
explosive population growth outpaces provision of essential services like water,
sanitation, and electricity (United Nations Human Settlements Programme and
United Nations Human Settlements Programme, 2003). At current installation rates,
traditional, centralized wastewater treatment systems would still reach less than half
16 Reimagining Excreta as a Resource: Recovering Nitrogen from Urine. . .
431
Fig. 16.1 Graphical representation of Millennium Development Goal 7(c): halving the population
without access to improved sanitation. Here we compare the global population with access to
sanitation as defined by excreta collection (improved vs. unimproved fixtures, gray/green bars)
and as defined by excreta treatment in 2010 (untreated vs. treated, red/black bars). For excreta
collection, the Millennium Development Goals were developed in 2000 and aimed to halve the
1990 population without sanitation access by 2015. Original data from (Baum et al., 2013; United
Nations, 2015, p. 6)
of the populations of Asia and Africa by 2050 due to high infrastructure, staffing,
and energy requirements (Larsen et al., 2016). On-site, decentralized options must
be considered as an alternative to rapidly increase access to improved sanitation.
1.2 Partnership Between UC Berkeley and Sanergy
In this chapter, we describe a multi-year, ongoing partnership between researchers
at the University of California, Berkeley, and Sanergy, a sanitation service provider
in Kenya. The UC Berkeley team was led by Professor Kara Nelson in Civil and
Environmental Engineering and continues to involve William Tarpeh, a former
PhD student in Prof. Nelson’s group and now an assistant professor of Chemical
Engineering at Stanford. Sanergy is a social enterprise that provides comprehensive sanitation services, including manufacturing, installation, operation (via
franchisees), maintenance, and resource recovery from source-separating toilets
in informal settlements around Nairobi, Kenya. The Nelson group experience
with pathogen inactivation and treatment processes was complementary, and both
432
W. A. Tarpeh et al.
partners prioritized recovery of valuable products from excreta through their
continual interactions over the past several years. After 2013, we refer to the team as
ElectroSan, the name of the process engineering spinoff from the urine valorization
technologies we developed during this project. Related, ongoing activities in the
Tarpeh group at Stanford are also considered part of ElectroSan’s efforts.
In 2012, Nelson led a Gates Foundation Grand Challenge team focused on intoilet disinfection. Dubbed Safe Sludge, the innovation focused on using ammonia
in urine to disinfect feces using an attractive, ergonomic toilet design. The project
team attended the August 2012 Gates Reinvent the Toilet Exposition in Seattle,
Washington, and met Sanergy, another Gates grantee. This conversation eventually
led to several research exchanges, observation- and practice-driven innovations, and
blended industrial and academic expertise that has catalyzed the development of
options to recover nutrients from urine. Designing technologies for use in informal
settlements around Nairobi (Sanergy’s primary region) demands rapid scaling and
constant adaptation to dynamic needs, such as the explosive population growth
associated with informal settlements near sub-Saharan African cities (Jacobsen
et al., 2012). Over the past decade, Sanergy has established itself as a pioneer
in container-based sanitation by meeting the needs for rapid scaling of toilets,
collaborating with local stakeholders, and designing diversified income streams.
In terms of resource recovery, Sanergy has focused on the production of valuable
end products from the collected feces and has successfully brought two products
to market. The ElectroSan team has focused on novel processes for converting
collected urine into valuable products. This narrowed scope was critical to problem
definition and progress on a clearly defined challenge while staying connected to
the broader development challenge of increasing access to sanitation.
1.3 Problem Iteration
The first iteration of our problem was addressing the pathogen risks from feces
during toilet or pit emptying, especially for toilet users and sanitation workers. The
Safe Sludge Toilet was developed as a self-disinfecting fixture that separated urine
and feces, created disinfectant in urine through urea hydrolysis and lime addition,
and then ensured sufficient contact time to disinfect the feces (Ogunyoku et al.,
2016). We envisioned Sanergy adapting the Safe Sludge approach to its Fresh Life
Toilets (FLTs) to reduce the risk of pathogen exposure for collection staff and
community members.
While hydrolyzed urine could be used to disinfect feces, its high ammonia
content might interfere with thermophilic composting, Sanergy’s primary method
of valorizing feces at the time. A field visit by the UC Berkeley team focused on the
effect of ammonia on composting identified an additional problem to solve: how to
separately valorize urine. Urine-diverting toilets were being increasingly installed in
Nairobi and by other sanitation service providers; however, resource-oriented urine
treatment technologies lagged behind feces valorization. We further specified this
16 Reimagining Excreta as a Resource: Recovering Nitrogen from Urine. . .
433
problem to what nitrogen products could be extracted from urine, because struvite
precipitation, a mature phosphate recovery technique that generates a phosphaterich fertilizer, recovers only 5% of nitrogen from urine (Etter et al., 2011). Nitrogen
recovery from urine was less understood at the time (2012) and benefited from
lessons learned during nitrogen fertilizer recovery from other wastewaters.
From 2013 onward, ElectroSan focused on developing treatment processes to
extract nitrogen from urine. We made several choices early on to constrain the
problem but remained flexible to revisit them as needed. First, we focused on
nitrogen fertilizer because Sanergy was already focused on agricultural products
with its feces-derived soil conditioner. Second, we focused on liquid fertilizers
because they required minimal post-processing and could be combined with
irrigation. After a preliminary market analysis, we identified ammonium sulfate
as a promising product because it is among the highest used fertilizers worldwide
and is typically sold in liquid form (Chien et al., 2011). We also chose to focus on
treating urine once it was collected from several toilets at a collection depot, which
provided relatively stable design constraints as the number of toilets and installation
sites (e.g., schools, private, public, residential) grew rapidly. Based on this decision,
we concentrated our efforts on hydrolyzed urine because urine was hydrolyzed by
the time it reached the collection center and was added to containers of already
hydrolyzed urine. The major difference between fresh and hydrolyzed urine is the
form of nitrogen: uncharged urea in fresh urine and positively charged ammonium
in hydrolyzed urine (see Sect. 3.1).
Thus, the large problem of crafting economically viable sanitation was reduced
to the narrow challenge of designing technologies to recover ammonium sulfate
fertilizer from urine. Establishing the problem in the context of Sanergy and economically viable sanitation facilitated translation of laboratory results to evaluation
of factors critical for real-world implementation (see Sect. 3.2).
1.4 Lessons from Problem Definition
1.4.1
Problem Definition: Access to Sanitation and Fertilizer
Like many Development Engineering efforts, the process of defining our problem
was iterative and time-consuming. Based on the team’s expertise, we approached
the problem primarily from the motivation of increasing access to sanitation. We
hypothesized that recovering valuable products from excreta could generate revenue
for sanitation service providers. While we started with the technical aspects of
designing recovery processes, we also had to consider the market viability of
the recovered products, which involved another value chain, agricultural inputs,
including fertilizers. Because our innovations could affect two dire needs in Kenya
(access to sanitation and access to fertilizer), we spent considerable time talking
with partners and subject matter experts to situate our project among the many
stakeholders involved. We also constructed business model canvases and theories
434
W. A. Tarpeh et al.
of change for both sanitation and fertilizer (see Sect. 3). As can be seen from our
project timeline, we focused first on sanitation, then added agriculture, and then
refined our vision at the nexus of both problems among partners in both sectors.
1.4.2
Theory: Circular Economy and Resource Recovery
Our work on resource-oriented sanitation was motivated by two increasingly recognized theories: the circular economy and resource recovery from wastewater. For
decades, fecal matter has been repurposed as compost, energy, and even irrigation
water. Recently, efforts have intensified to recover additional valuable products from
excreta, including microbial protein products (Calvert, 1979), building materials
(Diener et al., 2014; Mohajerani et al., 2019), cooking charcoal (Ohm et al., 2013),
and disinfectants (Huang et al., 2016). This resource recovery perspective aims to
extract all possible value from waste before disposal. Most recently, a US National
Academies of Engineering report identified one of the major twenty first-century
environmental engineering challenges as “designing a future without pollution
and waste” (Board and National Academies of Sciences 2019). Several of these
extracted products intersect with other critical industries, including agriculture and
energy storage. Another one of these five grand challenges is “sustainably supplying
food, water, and energy”; resource recovery may play a major goal in realizing this
vision over the next several decades.
More broadly, the circular economy re-envisions current linear, extract-and-emit
chemical manufacturing as loops that use every molecule as many times as possible
before disposal (Fig. 16.2). With this perspective, waste streams of all kinds, including excreta, should be maximally repurposed into useful products (Geissdoerfer et
al., 2017). The circular economy perspective is a broader instantiation of resource
recovery and can apply to gaseous carbon dioxide emissions (Amouroux et al.,
2016), solid domestic waste (Tisserant et al., 2017), and consumer products (Singh
& Ordoñez, 2016). The circular economy concept in sanitation is well-recognized
and regularly discussed at conferences like the Fecal Sludge Management Conference and the International Water Association Conference on Resource-Oriented
Sanitation. Recently, the concept has been synthesized as the Circular Sanitation
Economy by the Toilet Board Coalition, a network of multinational industries in
sanitation provision (Toilet Board Coalition, 2016).
1.4.3
Observation-Driven: Valorizing Urine
While our academic focus on converting excreta into valuable products embodies resource recovery and a circular economy, our approach was also radically
informed by observations in resource-constrained communities. By the ElectroSan
team’s estimation in 2012–2013, resource recovery tended to focus on combined
wastewater (urine and feces) most, followed by separately collected feces and
urine as a distant third. From our informal review of resource-oriented toilet
16 Reimagining Excreta as a Resource: Recovering Nitrogen from Urine. . .
435
Fig. 16.2 Contrasting linear (top) and circular (bottom) economies for carbon, nitrogen, and
phosphorus. Image adapted courtesy of Heather Goetsch
systems, the major motivation for separately collecting feces was to reduce water
content by removing urine, which enhances composting and drying techniques.
We observed that urine was underutilized, in part because of its large volume
and high water content (Kvarnström et al., 2006), which would lead to high
transport costs. Once we decided to concentrate our efforts on urine, we considered
several possible recovered products. The most established product to recover from
urine is struvite, or magnesium ammonium phosphate (MgNH4 PO4 •6H2 O), a
phosphate-rich fertilizer (NPK mass ratio 6:29:0). Urine contains the majority of
macronutrients in excreta (80% N, 50% P, 60% K), making it an ideal stream from
which fertilizer nutrients can be concentrated (Larsen & Gujer, 1996). At the time,
we observed that urine efforts were more focused on phosphorus than nitrogen; thus,
we concentrated our efforts on recovering nitrogen from urine. In addition to being
understudied, nitrogen is the primary parameter by which fertilizer application rates
are determined; furthermore, nitrogen recovery from excreta could benefit the global
nitrogen cycle, which humans have severely imbalanced due to synthetic fertilizer
production (Galloway et al., 2008). Ultimately, recovering nitrogen from urine was
an untapped opportunity for recovery of valuable products from excreta.
2 Implementation Context
2.1 Partners and Implementation Setting
Sanergy operates over 3690 Fresh Life Toilets that are collectively used over
126,600 times daily in informal settlements around Nairobi. As of 2019, FLTs are
436
W. A. Tarpeh et al.
Fig. 16.3 (Left) Evergrow organic soil conditioner. Photo credit: William Tarpeh. (Right) The
black soldier fly larvae are sold as an animal protein feed. Photo credit: Kevin Orner
primarily owned and operated by local entrepreneurs as pay-per-use, but others are
open to the public, located at schools, or associated with multifamily dwellings.
The toilet user interface is a squat plate with separate holes for urine and feces.
Toilet operators pay for urine and feces containers (25 L urine, 30 L feces) to
be collected and replaced twice per week by Sanergy employees (O’Keefe et al.
2015). The containers are taken to a central collection center where urine and feces
are processed separately. Fecal waste is trucked 30 km to a processing facility
and converted into the following value-added products: a soil additive branded as
Evergrow through a co-composting process and a black soldier fly animal feed
(Fig. 16.3). Urine from the toilets is stored in 1000 L tanks at the collection center
and periodically disposed of in a nearby sewer or trucked 20 km to a wastewater
treatment facility. Sanergy’s New Technologies team identifies and scales novel
methods to treat the separated feces and urine, establishing a sanitation value chain
(Fig. 16.4).
2.2 Aligning Incentives
Both ElectroSan and Sanergy aimed to create a diversified portfolio of excretaderived products, including valorizing urine as a critical business and innovation
opportunity. Several practical questions posed by experiences in Nairobi inspired
laboratory research at UC Berkeley; conversely, Sanergy provided an ideal testbed
for several research questions (e.g., urine composition at different toilets) based
16 Reimagining Excreta as a Resource: Recovering Nitrogen from Urine. . .
437
Fig. 16.4 Conceptual sanitation value chain, including collection, treatment, and reuse. Image
credit: Sanergy
on their large volumes of collected urine, which quickly outgrew urine-separating
networks in the United States.
At times, our focus on fundamental research was not completely aligned with
Sanergy’s business objectives. After our pilot study of ion exchange (i.e., flowing
urine through columns of negatively charged polymeric resin beads that adsorb
cations; see Sect. 3.1.1 for more details) in Nairobi, we determined that urinederived fertilizers cost 40% less than trucking urine to a wastewater treatment
facility and cost 70% less than commercial fertilizers in Kenya (Tarpeh et al., 2018a,
b). However, the supply chain for the resins and the customer based for urine-derived
fertilizers were not well established. Thus, Sanergy pivoted more to scaling up
feces valorization with anaerobic digesters and black soldier fly larvae, eventually
favoring the latter. Technical challenges still remained, and ElectroSan focused on
addressing those in the laboratory. Partners stayed in contact, but diverged efforts
for a time period as the research team focused on reducing regeneration costs
and combining nitrogen recovery with phosphate recovery. Once these practical
questions were answered in the laboratory and urine valorization became a priority
for Sanergy again, the partners planned another field visit and pilot-scale facility.
Regular communication played a key role in identifying catalytic collaborative
opportunities for ElectroSan and Sanergy when incentives aligned. Before each field
visit, both partners iteratively agreed on a work plan and desired outcomes from the
interaction.
2.3 Overcoming Constraints
One early challenge was establishing an analytical laboratory on-site. Our first field
visits entailed battery-operated lab equipment brought from UC Berkeley. Within
438
W. A. Tarpeh et al.
a few years, Sanergy purchased additional warehouse space near the operations
office and collection depot in Mukuru and hired several laboratory staff. Berkeley
researchers (both within and outside of ElectroSan) were involved as consultants
and even on-site employees for the laboratory design, which facilitated future
experiments and regular monitoring of Sanergy’s excreta-derived products. Close
collaborative preparations between ElectroSan and Sanergy facilitated successful
equipment planning, and some equipment used during field visits was donated to
the Sanergy lab (e.g., spectrophotometer for ammonia analysis).
To overcome the variability of data collected during field studies, field methods
were benchmarked with more precise laboratory methods before and after deployment. Fieldwork in turn revealed issues to be resolved in the laboratory, including
ion exchange column pressure management during long-term operation. Based on
ion exchange resin regeneration consuming the majority of operating expenses, we
also turned to alternative regeneration schemes in the laboratory with clear field
motivation. Because the urine-derived fertilizer market was not as well established
as its feces-derived counterpart, we also began considering other high-nitrogen
waste streams and other products beyond fertilizers. In our preliminary field
experiments, we demonstrated nitrogen recovery from anaerobic digester effluent to
reduce ammonia inhibition and create ammonia fertilizers. These preliminary data
catalyzed further laboratory experiments with adsorbent and electrochemistry-based
approaches to recovering nitrogen from additional waste streams.
2.4 Lessons Learned from Implementation
One of our major lessons, which is common to many Development Engineering
studies, is the value of close and continued partnership. Sanergy and ElectroSan
have complementary and overlapping missions that allowed both entities to focus on
their core business: increasing toilet access (Sanergy) and creating value from liquid
waste streams (ElectroSan). Our shared interests in expanding the product portfolio
for excreta-derived products and our willingness to experiment with bold ideas
were fundamental ingredients of the successful development and implementation
of fertilizer recovery from urine in Nairobi. Partnership also includes broader
networks of academic researchers, practitioners, and funders from which Sanergy
and ElectroSan have benefited. Conferences and alliances like the Sustainable
Sanitation Alliance (SuSanA), the Container-Based Sanitation Alliance (CBSA),
and the Rich Earth Summit have fostered catalytic conversations and created
enabling environments within the sanitation community.
One of the largest challenges of Development Engineering is making decisions
based on limited information. Throughout this experience, we became comfortable
with making as informed a decision as possible, documenting our thought process,
and remaining open to revisiting the decision later. We decided early on to focus on
designing processes at the collection depot level for several reasons: we expected
urine to be hydrolyzed (so that nitrogen was present as ammonia), variability would
16 Reimagining Excreta as a Resource: Recovering Nitrogen from Urine. . .
439
be less acute than at the toilet level, and samples would be easier to gather. This
decision constrained some of our applications, but ultimately in a manner that led
to meaningful progress on recovering ammonium sulfate fertilizer from hydrolyzed
urine. We have since relaxed some of these assumptions to expand the applications
of our technological innovations, as informed by our preliminary efforts. Expanded
applications have included treating fresh urine and accelerating urea hydrolysis,
producing alternative ammonia products from hydrolyzed urine, and recovering
nitrogen from other waste streams besides urine.
During technology development, we used an iterative design process in the
laboratory (Berkeley) and the field (Nairobi). We did not wait until the technology
was “complete” before going into the field but instead aimed to learn as much as
we could in the field to drive further laboratory research. For example, we learned
early on that showing the robustness of the technology to deal with variable influent
composition was crucial to implementation; thus, we focused on mechanistic
laboratory studies to identify which components most influenced ammonia recovery
performance metrics (e.g., recovery efficiency). Based on making the practical
decision to focus on treatment of thousands of liters of urine, we were very
interested in how the choice of scale would impact process design. After establishing
performance in our lab-scale columns, we explored increasingly large columns
capable of treating a larger volume of urine on-site with Sanergy. This scientific
equivalent of rapid prototyping aligns with the lean business model canvas approach
of failing fast and gathering rich information on the target customer. Focusing on one
target application with one partner led to deep insights that informed and directed
our laboratory development of nitrogen-selective extraction technologies.
3 Innovate, Implement, Evaluate, and Adapt
3.1 Innovation
Within the broader context of resource-oriented sanitation, our work addresses one
overarching question: can valuable nitrogen products be made and profitably sold
from separately collected urine? Within the potential urine-derived product portfolio, ElectroSan focused on nitrogen fertilizers because 90% of global ammonia is
used to manufacture fertilizer (Nørskov et al., 2016); we focused on liquid fertilizers
because they could be easily combined with irrigation (fertigation) and because
they are simpler to produce from a process engineering perspective. Even more
specific to Sanergy, we aimed to design unit processes that could treat thousands of
liters of urine each day at the collection depot (Fig. 16.5). Based on this constraint,
we designed for hydrolyzed urine treatment after phosphorus was recovered. We
compared the aqueous chemical compositions of fresh and hydrolyzed urine to
inform design of recovery processes focused on ammonia over urea (Table 16.1).
We always imagined the ElectroSan processes within a treatment train that would
440
W. A. Tarpeh et al.
Fig. 16.5 (Top) Schematic of urine and feces treatment at Sanergy and placement of ElectroSan
technologies. (Bottom) Schematic of ion exchange in urine treatment train
recover phosphorus precipitates as valuable products and mitigate fouling in the
ElectroSan reactors. Designing for a unit process within a larger process scheme
helped constrain the possible composition and informed repeatable laboratory
influents (synthetic urine) for experiments.
Our core innovation is selective separation processes that extract ammonium
from urine as high-purity ammonium sulfate, a common liquid fertilizer. Thus, we
16 Reimagining Excreta as a Resource: Recovering Nitrogen from Urine. . .
441
Table 16.1 Composition of fresh and stored urine
Rows highlighted in yellow describe parameters that change significantly during urine storage and
urea hydrolysis (Larsen et al., 2021; Udert et al., 2003)
focused on both urine treatment and fertilizer production. For fertilizer production,
we considered how liquid ammonium sulfate could be generated and used as
a viable product. We considered three major value propositions: reducing urine
treatment volume, supplementing Evergrow solid organic fertilizer from feces, and
producing ammonium sulfate fertilizer. We evaluated these value propositions by
considering several metrics, including volume of regenerant compared to volume of
urine treated, purity of product, and ammonium concentration of the product.
3.1.1
Technology
After reviewing existing methods for nitrogen recovery from wastewater in practice
and in academic literature, ElectroSan developed two technological solutions to
achieve selective separations: ion exchange and electrochemical stripping. Ion
exchange and electrochemistry were first identified as methods with untapped
potential for selective nitrogen recovery; within those two areas, we iterated ideas
over several months. Throughout this chapter, we focus primarily on ion exchange,
as we chose to do during technology development in Kenya, because it was the more
mature technology. The relative maturity of ion exchange eased communication
with partners and integration with existing treatment processes.
Ion exchange leverages solid adsorbents in a fixed-bed column, where liquid
flows over stationary adsorbent beads. For nitrogen recovery, positive ammonium
ions are passed over a negatively charged ion exchange resin and trade places with
protons (Fig. 16.6). After all adsorption sites are filled with ammonium, an acid
442
W. A. Tarpeh et al.
Fig. 16.6 Conceptual diagram of ammonium adsorption and regeneration via ion exchange
adsorption
(proton-rich) solution is passed over the resin to regenerate the resin and produce
concentrated ammonia solution. To produce ammonium sulfate fertilizer, we used
sulfuric acid as an eluent. Previously, adsorbents were primarily used for nitrogen
removal rather than recovery and rarely used in hydrolyzed urine with the aim of
producing high-purity ammonia concentrate. In our first study, we compared the
behavior of clinoptilolite, wood husk biochar, and two industrial ion exchange
resins for ammonium adsorption and fertilizer production (Tarpeh et al., 2017).
In addition to characterizing adsorption mechanisms in ideal solutions and real
urine, we examined several performance criteria: maximum adsorption density (mg
ammonia/g resin), regeneration efficiency (ratio of ammonia eluted to ammonia
adsorbed), and cost per mass of nitrogen recovered.
Electrochemical nitrogen stripping was still in development as we concentrated
our efforts on ion exchange in Nairobi. As electrons are removed from solution
via the circuit, ammonium (NH4 + ) ions and protons cross the cation exchange
membrane (CEM) to the cathode (Fig. 16.7). Both diffusion due to concentration
gradients and migration due to applied current contribute to transmembrane flux.
Protons are produced from the oxidation of water, which decreases the pH of
the anode, making it strongly acidic. Once ammonium reaches the cathode, it
is transformed into aqueous ammonia (NH3 ) due to high pH resulting from the
production of hydroxide ions. Aqueous ammonia is selectively transported to the
trap chamber, which conserves the driving force for ammonia flux from cathode
to trap by consuming the ammonia with dilute acid and producing ammonium
concentrate, a key ingredient for fertilizer. The liquid can be further processed by
distillation or freeze-drying to produce concentrated liquid and solid fertilizer. The
16 Reimagining Excreta as a Resource: Recovering Nitrogen from Urine. . .
443
Fig. 16.7 Conceptual diagram of electrochemical stripping, where nitrogen as ammonia is
selectively recovered based on positive charge (cation exchange membrane) and volatility (gaspermeable membrane)
cathodic reduction of oxygen produces hydroxide ions that raise pH, facilitating the
production of ammonia from ammonium (Tarpeh et al. 2018a, b).
We regularly benchmarked the energy consumption, nitrogen recovery efficiency,
and selectivity of electrochemical stripping with ion exchange and the other existing
nitrogen treatment technologies. Even during our field study of ion exchange,
we operated preliminary tests on electrochemical stripping on the same influent
that accelerated development back in the laboratory. Ultimately, electrochemical
stripping excels in its low chemical and energy input requirements, as well as its
much higher selectivity than ion exchange. On the other hand, ion exchange requires
less technical maintenance and exhibits potentially longer lifetime due to its relative
simplicity compared to electrochemical stripping.
Designing with the user in mind, and even more specifically operators within
Sanergy, drove design decisions like combining columns in series for easy operation. Working closely with Sanergy treatment operators helped the ElectroSan team
understand their schedules, incentives, and challenges (e.g., intermittent electricity).
These users were kept in mind when developing technologies and provided informal
and formal feedback on the technologies during our field visits. Based on discussion
with Sanergy, we have since aimed to reduce chemical inputs due to limited and
potentially volatile supply chains to informal settlements.
3.1.2
Theories of Change: Fertilizer and Agriculture
There are two main direct beneficiaries of ElectroSan innovations: fertilizer consumers and sanitation collection services. Within fertilizer consumers, we characterized smallholder farmers who would benefit from access to locally produced
444
W. A. Tarpeh et al.
Fig. 16.8 Agricultural and sanitation theories of change for ElectroSan. Image adapted courtesy
of Rachel Dzombak, Ivan Buchanan, Woojin Jung, Martha Lesniewski, and William Tarpeh
affordable fertilizers to improve their crop yield and increase income. Currently,
almost all fertilizer is produced outside of Kenya and distributed by either the
national government or private wholesalers. Utilizing local distribution networks
and incorporating education with product distribution, ElectroSan targeted farmers
who need agricultural innovation the most. Sanitation collection services like
Sanergy would benefit by avoiding transport of collected urine for disposal and by
increasing revenue due to sales of urine-derived products. As such, we developed
two theories of change: one for agriculture and one for sanitation (Fig. 16.8).
We characterized user needs by incorporating feedback from multiple stakeholders with experience in Kenya including agricultural experts, farmers, and
sanitation and fertilizer distribution companies. Based on our team’s expertise, we
primarily focused on the sanitation theory of change but were informed by our
agriculture theory of change. We engaged several potential agriculture partners,
both with Sanergy and on our own. With Sanergy, we engaged potential organic
fertilizer users, such as Lipton and horticulture farms. In parallel, the ElectroSan
team consulted with businesses focused on farming inputs (e.g., One Acre Fund,
Mavuuno). These did not lead to formal partnerships but informed our technology
design and instilled confidence that these activities could be carried out once the
fertilizer product was more firmly characterized.
3.1.3
Markets/Economic Sustainability
Several versions of both business model and social impact canvases have been
iterated within ElectroSan (one example in Fig. 16.9). A key part of our business
16 Reimagining Excreta as a Resource: Recovering Nitrogen from Urine. . .
445
Fig. 16.9 Business model for urine-derived fertilizers. Image adapted courtesy of Hannah Greenwald, Luis Anaya, John Law, and William Tarpeh
model is partnering with fertilizer distributors so that ElectroSan can focus on
fertilizer production. Ongoing work focuses on characterizing the market for liquid
fertilizers in Nairobi, as well as the potential for producing solid fertilizer by
freeze-drying or other similar methods. Anecdotally, most fertilizer is distributed
in solid form, so we would need to identify submarkets open to liquid fertilizer
(e.g., horticulture) or show that liquid fertilizer has marked advantages over solid
fertilizer to elicit behavior change. Another key aspect related to behavior change
is demonstrating the efficacy of our fertilizer product, which we have considered
piloting during exhibitions, landscaping projects, or cooperative farms to double as
research and demonstration sites.
In parallel with our laboratory development, we catalogued cost and forecasted
costs at scale. Initially, we used experimentally determined adsorption densities to
estimate operating costs of ion exchange adsorbents. Naturally derived adsorbents
(clinoptilolite and biochar) were cheaper than conventional nitrogen removal via
nitrification-denitrification but exhibited suboptimal recovery efficiencies. Of the
synthetic resins tested, Dowex Mac 3, a weak cation exchange resin, exhibited the
lowest cost because of its high nitrogen adsorption density and high regeneration
efficiency (99%) (Tarpeh et al. 2017). Our preliminary cost estimates showed that
446
W. A. Tarpeh et al.
just ten uses of Dowex Mac 3 would make it more cost-effective than conventional
nitrogen removal, which we demonstrated during our pilot study in Nairobi. Urinederived ammonium sulfate fertilizer was also produced at lower cost than urea and
diammonium phosphate (Tarpeh et al., 2018a, b). We used local fertilizer prices in
Nairobi, which reflect the costs of importing fertilizer and markups associated with
transport from the port of Mombasa to inland Nairobi. Through this market analysis,
we determined the major value of urine-derived fertilizer: its local and steady
production. An ongoing challenge is to communicate the most fitting comparison for
nitrogen fertilizer recovery to the sum of fertilizer production and nitrogen removal.
Wastewater treatment experts tend to compare nitrogen recovery to only nitrogen
removal, and fertilizer producers tend to compare nitrogen recovery to only HaberBosch nitrogen fixation. However, nitrogen recovery meets both value propositions:
curtailing nitrogen wastewater discharges and producing usable fertilizer.
A market analysis for positioning human urine and derivatives as fertilizers
was conducted by Sanergy and ElectroSan in 2014. Synthetic nitrogen fertilizers
use the Haber-Bosch process, which requires million-dollar capital investments
and large quantities of natural gas that limit the number of installations in subSaharan Africa (Buluswar et al., 2014). According to stakeholder interviews, urine is
commonly viewed as a means to achieve increased crop yield as well as an effective
insecticide (Sanergy, 2014). ElectroSan aims to leverage this market opportunity
for our urine-derived fertilizer product. Based on interviews, farmers value lowrisk, repeatable yield increases and return on investment. We identified several
competitors and existing options for fertilizer, including synthetic fertilizers. Both
solid synthetic fertilizers (e.g., calcium ammonium nitrate) and liquid synthetic
fertilizers (e.g., solubilized diammonium phosphate) are commonly used across
Kenya but are often cost prohibitive for low-income farmers. Import tariffs, a 30%
markup due to transportation costs, and few importers contribute to high price points
(Sanergy, 2014). Solid fertilizers tend to be easier to transport, but each formulation
requires different production mechanisms. Liquid fertilizers may be more difficult
to transport but can be easily combined with irrigation. ElectroSan exhibits several
competitive advantages: local production, regular supply, customization to various
chemical compositions, and application by fertigation.
3.1.4
Environmental Sustainability
Protecting environments for future generations is a major motivation of ElectroSan’s
vision of reimagining waste. Worldwide, 80% of wastewater is discharged without
treatment (Larsen et al., 2016); re-envisioning toilets as collection centers for
raw materials could incentivize collection and treatment. Reimagining waste as
a resource is particularly beneficial for global nitrogen use, because the global
nitrogen cycle is severely unbalanced due to anthropogenic interferences. Industrial
ammonia production, large-scale agriculture, and fossil fuel combustion have added
16 Reimagining Excreta as a Resource: Recovering Nitrogen from Urine. . .
447
unprecedented amounts of reactive nitrogen (e.g., NO3 − , NH4 + , N2 O) to the
biosphere from the atmosphere, outpacing denitrification that converts reactive
nitrogen back to dinitrogen gas (N2 ). Because of the widespread untreated wastewater discharge, much of the world’s synthetic reactive nitrogen contributes to
eutrophication and threatens aquatic ecosystems. Recovering nitrogen directly from
wastewater could reduce the demand for atmospheric N2 extraction and incentivizes
restoration of polluted aqueous environments.
Even while we were still developing our ion exchange technology, we evaluated
the environmental impacts of its potential implementation using life cycle assessment (LCA) and techno-economic assessment (TEA). LCA considers embedded
energy and emissions associated with engineered processes from raw materials to
disposal; TEA considers process modeling, engineering design, and cost estimation.
These system-level assessments of new technologies can serve two major goals: (1)
comparing to existing approaches and (2) prioritizing opportunities for optimization
(Corominas et al., 2013a,b). We considered ion exchange cartridges or ammonia
recovery from urine for both purposes and using both TEA and LCA, along with
geospatial modeling for a citywide collection scheme (Kavvada et al., 2017). Our
analysis demonstrated that ion exchange was not only less environmentally harmful
than conventional nitrogen removal but net-negative for greenhouse gas emissions
and energy input considering the avoided Haber-Bosch production. Within ion
exchange-based ammonia recovery, we expected transport (collection of cartridges
from households) to be the major emitter and energy consumer; however, the
sulfuric acid for regenerating the resin represented 70% of greenhouse gas emissions
and energy input (deriving from the manufacturing process). Although the city used
for the environmental impact analysis (San Francisco, CA) differs in important ways
from Nairobi, the finding that the sulfuric acid contributed such a large footprint
would likely apply in both contexts. This insight inspired another laboratory
iteration focused on alternative regenerants including acids (hydrochloric, nitric)
and brine (sodium chloride). We found that the acids were similar in performance
but the brine exhibited a trade-off: lower environmental impacts but also lower
regeneration efficiency. Ongoing efforts focus on alternative regeneration schemes
to further reduce the emissions and energy input required for nitrogen recovery from
urine.
3.2 Iterative Implementation
The ElectroSan experience exemplifies a major aspect of Development Engineering: iterative implementation. Rapid and frequent iterations between laboratory
research and field implementation, even with imperfect prototypes, accelerated
the development of technologies to recover nitrogen from urine. Both laboratory
and field research were supported by educational experiences (many through the
Development Engineering program at UC Berkeley) and diverse funding sources.
448
W. A. Tarpeh et al.
Fig. 16.10 Parallel timelines of funding, education, laboratory research, and field implementation.
Safe Sludge activities are striped to identify them as preceding the formal start of ElectroSan but
integral to the ElectroSan story
The interplay of funding, education, laboratory research, and field implementation
is illustrated in the multicomponent timeline in Fig. 16.10.
3.2.1
Laboratory Research and Implementation
Early Visits
ElectroSan built on the foundation of the Safe Sludge project, which connected the
Nelson group at UC Berkeley with Sanergy in 2012. Safe Sludge combined laboratory experiments with multidisciplinary design to create a conceptual prototype
of a self-disinfecting toilet. In parallel, laboratory experiments documenting ideal
ratios of urine to feces for inactivation of waterborne pathogens were determined
(Ogunyoku et al., 2016). Once these results proved promising in Berkeley, Dr.
Temi Ogunyoku planned a presentation at the second Fecal Sludge Management
Conference in Durban, South Africa, followed by a field study of Safe Sludge for
Sanergy excreta in December 2012.
The team returned to UC Berkeley to plan the next trip to Nairobi, with the
major objective of identifying effects of the Safe Sludge process on compost in
small-scale containers. We also explored the impact of lime addition as a cover
material during toilet use on the thermophilic composting process at Sanergy’s
collection depot. Both the 2012 and 2013 field visits built a relationship with
Sanergy and familiarized the UC Berkeley team with their operations by visiting
16 Reimagining Excreta as a Resource: Recovering Nitrogen from Urine. . .
449
toilets, meeting operations and collection team members, and working alongside
treatment operators. In January 2014, two ElectroSan team members (Tarpeh and
MBA student Ryan Jung) visited Sanergy to conduct focus groups with Fresh Life
Toilet users. The major goals were to survey existing business resources in Nairobi,
examine the price and cost needs for a successful business model to sell Fresh Life
toilets to homeowners, and obtain feedback from users on prototyped treatment
options.
These early trips also identified several challenges and opportunities for Safe
Sludge. A major challenge was conducting experiments without a fully functional
laboratory, which incentivized both partners to accelerate laboratory installation.
Experiments during the 2012 trip were conducted some 15 km from Mukuru, the
center of operations. During the 2013 trip, experiments were conducted at the
composting treatment site; however, intermittent electricity required largely batteryoperated experiments (e.g., pH meters, mass balances).
Starting ElectroSan
ElectroSan was formed out of the 2013–2015 visits and literature review on urine
treatment technologies. We identified urine as underutilized during visits to Sanergy
and conversations with other sanitation service providers visited in sub-Saharan
Africa and Latin America. Working closely with treatment plant operators at
Sanergy on a daily basis was a major precipitator, including regular visits from
a truck to collect urine and transport it to a wastewater treatment plant. Based
on these insights, Tarpeh and Nelson connected this opportunity with the ongoing
experiments in Berkeley to selectively recover nitrogen from urine.
From January 2014 to December 2015, the ElectroSan team dedicated its efforts
to developing ion exchange and electrochemical stripping in the laboratory. A major
goal of laboratory efforts was to establish an experimental dataset and descriptive
model that could be used to predict adsorption density for a given urine composition.
We also successfully identified mechanisms of adsorption and the influence of
composition by comparing simplified solution, synthetic urine, and real urine for
both ion exchange and electrochemical stripping. During this focused time in the
laboratory, the ElectroSan team still engaged with Sanergy through conference calls,
meeting at conferences (e.g., Fecal Sludge Management Conference), and Sanergy
visits to Berkeley. During this time, Sanergy grew rapidly in staff, number of toilets,
and volume of excreta collected daily. We originally planned to visit Nairobi in
Summer 2015 but decided to delay for a year to better characterize adsorption
in realistic continuous operation and achieve publication-quality results during the
field trial.
In 2016, the ElectroSan team had collected enough experimental data to plan
for a field study of ion exchange. We met approximately monthly with Sanergy
staff, particularly the laboratory manager and personnel. Pictures and supply lists
were shared between the Berkeley and Sanergy laboratories to ensure compatibility.
In 6 weeks during June to August 2016, Tarpeh, Nelson, and MS student Ileana
Wald collected data on repeatable column performance using Dowex Mac 3 and
Sanergy urine, surveyed urine composition across a representative set of Sanergy
450
W. A. Tarpeh et al.
toilets, and monitored composition changes during collection. We also fabricated
and operated columns at ten times the size of lab scale, which could then treat
ten toilets’ daily production of waste based on Sanergy’s average across all toilets.
Key performance metrics, including adsorption density and regeneration efficiency,
were conserved over ten cycles at 6.5 L/d (one average Sanergy toilet) and for two
cycles at 65 L/d (ten average Sanergy toilets). We continued analyzing the data
collected in Nairobi over the 2016–2017 academic year that resulted in a publication
in the new Development Engineering Journal in (Tarpeh et al., 2018b) (https://www.
sciencedirect.com/science/article/pii/S235272851730074X).
Based on the encouraging results from our work in Nairobi, the ElectroSan
team continued to develop larger-scale setups in Berkeley, as well as relax some
of the assumptions that accelerated previous laboratory experiments. A master’s
student from ETH Zurich (Maja Wiprächtiger) explored urea hydrolysis and
combining nitrogen recovery with phosphate recovery. We explored several options
of combined nitrogen and phosphorus recovery: struvite precipitation followed by
cation exchange, anion exchange followed by cation exchange, and simultaneous
anion and cation exchange. We hypothesized that phosphate recovery could be
conducted before nitrogen recovery with minimal effects on nitrogen recovery. In
2017 and 2018, we published several articles on our findings and presented our
work at several conferences.
Dr. Kevin Orner, a postdoctoral researcher at UC Berkeley, conducted the most
recent visit to Sanergy in September 2019. The objectives of the visit included
(1) evaluating the economic feasibility of producing and selling urine-derived
fertilizer, (2) exploring the technical feasibility of toilet-level nutrient recovery, and
(3) determining if pit latrine waste could be used to produce liquid fertilizer via
ion exchange. ElectroSan and Sanergy explored selling to Unilever, the owner of
Lipton, which makes teas that require liquid fertilizer. Although Lipton could pay
a premium for organic liquid fertilizer for their organic teas, we later learned that
urine-derived fertilizer could not be classified as organic under current regulations.
Another strategy for economically treating urine is to recover nutrients via ion
exchange and locally dispose the treated urine effluent, which avoids transportation
and disposal costs. Ion exchange can be used to recover ammonium and phosphate
but will require additional treatment steps to meet effluent discharge requirements
(e.g., pathogens, organic contaminants). This need motivates current research at UC
Berkeley on urea hydrolysis, ion exchange, and media filtration that can take place
underneath the Sanergy source-separating toilets. Liquid from fecal sludge could
also be an influent to ElectroSan processes, which Orner explored with Sanergy and
Sanivation, another sanitation company in Kenya.
3.2.2
Education and Funding
ElectroSan came of age with the Development Engineering program at Berkeley
and benefited richly from interacting with the DevEng ecosystem of students,
faculty, and collaborators. This enabling ecosystem also included the Blum Center
16 Reimagining Excreta as a Resource: Recovering Nitrogen from Urine. . .
451
for Developing Economies and the Development Impact Lab, supported by the
US Agency of International Development through the Higher Education Solutions
Network (HESN).
In Spring 2013, Tarpeh led a team of students in a Design for Sustainable
Communities course to design an in-home toilet with Sanergy. This assessment
validated the existing business model of shared public toilets being more profitable
and user-friendly than in-home toilets. After pivoting away from in-home toilets,
the ElectroSan team applied for class funds for the Summer 2013 field visit.
The project continued during Fall 2013 as part of Cooperative Innovation, a new
course focused on designing with low-income communities. The team designed and
evaluated business models for excreta-derived products in Nairobi. Students traveled
to Nairobi for several weeks in January 2014, supported by a Development Impact
Lab Explore Grant ($5000) to seed new projects or pivots.
ElectroSan was first identified as an independent project through the Big Ideas
at Berkeley grant competition, in which the team placed first in the Global Poverty
Alleviation Category. As a Big Ideas recipient, the team benefited from mentoring
from sanitation experts, funders, and impact investors. The work in progress was
also presented at several conferences, which provided professional development to
ElectroSan students, including Tarpeh.
In Fall 2014, the Development Engineering core course was offered for the
first time at UC Berkeley. ElectroSan was pitched as a project and benefited
from contributions from a multidisciplinary team (environmental/sustainability
engineering, social work, business) that developed business models and surveyed
potential users. This was a major step in articulating ElectroSan’s relationship with
Sanergy and role at the food-energy-water nexus: producing an agricultural input
from wastewater at reduced energy. ElectroSan benefited from a free supply of urine
to test its technologies, and Sanergy benefited from research and development that
could expand the product portfolio of excreta-derived products by valorizing urine
rather than paying for its disposal. A major output of this class was a Development
Innovation Ventures Proposal, which is a USAID competition. ElectroSan did not
actually submit the proposal, but articulating the ideas in a concise way guided both
technology development and planning for future implementation.
ElectroSan continued to conduct research, funded in part by Big Ideas, NSF
fellowship support, and the VentureWell business competition, which we won based
on a presentation at the HESN annual meeting in 2016. VentureWell funds supported
planning for installing a pilot source-separating toilet on the UC Berkeley campus
to supply urine for research and attract visitors. ElectroSan successfully applied for
the Scaling Up Big Ideas Program in 2018, which helped fund the next iteration of
technology development. We also extended preliminary results on accelerating urea
hydrolysis to facilitate toilet-level recovery. This iteration was again the subject of
a Development Engineering course project that informed the most recent visit to
Nairobi in Fall 2019. Several students have benefited from the ElectroSan project at
UC Berkeley and Stanford, including undergraduates, MS students, PhD students,
and postdoctoral researchers.
452
W. A. Tarpeh et al.
3.3 Adaptation
3.3.1
Reaching Scale: Scaling Down to Toilet-Level Recovery and Scaling
Up to Pilot
Reaching meaningful scale for nitrogen recovery from urine could involve numerous
small installations or a few large ones. We aim to identify optimal scale by combined
experimental and modeling efforts. On the modeling side, we identified Paretoefficient scales that minimize energy consumption and emissions in San Francisco.
We will conduct similar analyses with Nairobi data to identify optimal scales for
environmental impacts and costs. Experimentally, we have expanded our focus from
larger-scale pilot installations to toilet-level treatment, which requires engineered
urea hydrolysis.
Sanergy’s rapidly scaled toilet collection inspired rapid scaling of feces and urine
treatment. Several iterations of feces treatment have been considered, including
thermophilic composting, anaerobic digestion, and, most recently, black soldier fly
larvae. Sanergy now has a profitable full-scale plant for treating feces but transports
and disposes urine without cost recovery due to no economically viable options.
Thus, ElectroSan efforts were generally dedicated to developing pilot- and full-scale
treatment options to recover nitrogen fertilizer from urine.
More recently, we have considered toilet-level urine treatment to recover nutrients and discharge treated effluent. Accordingly, ElectroSan researchers at UC
Berkeley are currently investigating media filtration for removal of carbon and
pathogens prior to local discharge (Fig. 16.11). This option would achieve scale
by thousands of installations (one per Fresh Life Toilet). The real optimum may be
a hybrid of toilet-level and centralized urine treatment, but further characterization
of toilet-level nitrogen recovery is needed. Regardless, a practical, effective urine
treatment solution could reach hundreds of thousands of users in Nairobi alone.
3.3.2
Current State of Technology
A challenge in recovering ammonium on-site from source-separated urine via ion
exchange is accelerating the hydrolysis of urea. When urine exits the body, nitrogen
is in the form of urea. The urea-N must be hydrolyzed into ammonium-N prior
to nutrient recovery via ion exchange; however, the urea hydrolysis process can
last multiple days. Accelerating urea hydrolysis by varying biofilm carriers or the
bacterial inoculum could reduce reactor size to be feasible for individual sourceseparating toilets in informal settlements (Deleu 2020). Urine will be collected from
a LAUFEN Save! urine-separating toilet installed in a bathroom on campus at UC
Berkeley and used as an influent to the pilot treatment system that integrates urea
hydrolysis, ion exchange, and media filtration.
In parallel with toilet-level efforts to recover urine, ElectroSan researchers at
Stanford are investigating more selective adsorbents to improve the lifetime, cost-
16 Reimagining Excreta as a Resource: Recovering Nitrogen from Urine. . .
453
Fig. 16.11 Process flow diagram for treating urine from Fresh Life Toilet via urea hydrolysis, ion
exchange, and media filtration prior to subsurface disposal
effectiveness, and purity of the process (Clark & Tarpeh, 2020; Clark et al., 2022).
Electrochemical stripping has also been further developed with predictive models
for removal and recovery and energy estimations that show that electrochemical
stripping is on par with other nitrogen removal technologies (Liu et al., 2020). We
have also demonstrated high recovery efficiencies in various wastewaters, which
may expand the applications of electrochemical nitrogen stripping (Fig. 16.12). This
line of research was first inspired by ElectroSan’s 2016 visit to Sanergy, in which
ion exchange was tested on anaerobic digester effluent because of potential scale-up
of anaerobic digestion at the time.
3.3.3
Reaching Scale: Opportunities and Challenges
As is typical for Development Engineering, research questions have evolved over
time from fundamental and proof-of-concept to applied, practical questions. Now
that we have demonstrated that high-purity ammonium sulfate can be recovered
from various wastewaters, including urine, several questions remain to reach scale.
Establishing a regular supply chain for adsorbents is one such practical question.
Making infrequent bulk purchases could be possible, but the overall lifetime of
the adsorbent needs to be characterized to inform purchasing decisions. We have
explored several alternative methods for regeneration in the laboratory but look
454
W. A. Tarpeh et al.
Fig. 16.12 Ammonium recovery efficiency for electrochemical stripping in various wastewaters.
RO = reverse osmosis. Citations: real urine, Tarpeh et al. (2018a,b); hydrothermal liquefaction
effluent, Li et al. (2018); anaerobic digestate, Liu et al. (2020); RO concentrate, unpublished
forward to contextualizing this regeneration decision based on cost and available
supply chains for various acids and brine solutions. During a 2018 field trial in
the United States, we encountered the practical challenge of how to apply an
acidic ammonium sulfate fertilizer. Fertigation seems to be the best option, but
dilution ratios must be devised and adapted from conventional ammonium sulfate
application. Another question to reach scale is how to automate the continuous
nitrogen recovery process, which we can adapt from other industrial ion exchange
processes, such as water softening. Building on our cost analysis of ion exchange,
we aim to identify marginal costs at scale. We expect economies of scale to exist,
especially for resin purchasing and potential regenerant reuse, but aim to do a more
long-term pilot study to further establish both technical and economic feasibilities.
This was the aim of our pilot scale study with Lipton, but classifying urine-derived
fertilizers as organic may be a prerequisite to running such a pilot study with
fertilizer consumer interest.
Throughout its development, ElectroSan reported its results in scientific and gray
literature, ranging from academic articles to reports and general media. Research
collaborations have also played a critical role in disseminating our results, including
16 Reimagining Excreta as a Resource: Recovering Nitrogen from Urine. . .
455
with the University of Michigan where Tarpeh conducted postdoctoral research
with Professors Nancy Love and Krista Wigginton. Ion exchange columns were
constructed and operated at the University of Michigan to create ammonium sulfate
fertilizer and applied to fields in Vermont. A growing community of urine-focused
researchers now gathers annually at the Urine Summit, sponsored by the Rich Earth
Institute in Vermont and most recently by the University of Michigan. Professor
Tarpeh’s research group at Stanford also led a recent short course in Senegal
with master’s students from Cheikh Anta Diop University in Dakar. Additional
installations of urine-diverting dry toilets have led to informal communication
among urine researchers, especially at conference symposia at several conferences,
including the American Chemical Society and the Association of Environmental
Engineering and Science Professors.
Another major challenge is reaching scale beyond Sanergy to other sanitation
service providers (SSPs). To date, we have depended on building relationships with
SSPs through our networks, including Sanivation and Delvic Sanitation Initiatives.
The Container-Based Sanitation Alliance (CBSA) brings together several of these
entities, some of whom have encountered ElectroSan at conferences and other
meetings. To reach the needed scale of billions, we will need to leverage this
increasingly robust network and develop regional models that cities can learn from
and adapt.
3.3.4
Adapting to New Contexts
Since 2018, ElectroSan team members have explored electrochemical nitrogen
stripping in partnership with Delvic Sanitation Initiatives (DSI), an SSP in Dakar,
Senegal. This context differs considerably from Nairobi along several dimensions.
In Dakar, the majority of the population is served by septic tanks that are exhausted
by private trucks. DSI works with L’Office National de l’Assainissement de Senegal
(ONAS), the national sanitation agency, to operate fecal sludge treatment plants
in Dakar and recover valuable products. We have recently demonstrated high
recovery efficiency from fecal sludge collected from anaerobic digesters at one
such fecal sludge treatment plant and can produce both fertilizer and disinfectant
from influents of varying composition. DSI benefits from strong collaborations
with ONAS and Cheikh Anta Diop University (UCAD), from where its founders
graduated. This enabling environment has accelerated field visits, funding, and
student exchanges from 2018 to 2020. Most recently, a field visit in December 2019
included demonstration of electrochemical stripping, tours of fecal sludge treatment
plants, meetings with ONAS and UCAD collaborators, and a short course on
resource recovery for UCAD master’s students. Diversifying ElectroSan’s product
portfolio will help identify additional markets and customers to incentivize urine
collection and treatment.
456
W. A. Tarpeh et al.
4 Results/Lessons Learned
Our major lessons can be summarized as follows:
• Iterative development between laboratory and practical implementation accelerated innovation by facilitating rapid adaptation of laboratory findings to practical
problems.
• Developing multiple technologies simultaneously helped establish relative
advantages and value propositions.
• Flexible consideration of value propositions facilitated prioritization amidst
changing partner priorities, constraints, and findings. Documenting rationale for
our choices helped constrain our research questions and facilitated revisiting as
needed.
• Strong in-country partnerships allowed ElectroSan to situate our expertise and
focus on our core activity: converting urine into value-added products.
• Prospective assessment of costs and environmental impacts helped compare
ElectroSan approaches to existing alternatives and prioritize future optimization
opportunities.
4.1 Context and Vision for Our Results
Ultimately, our findings have advanced the case for a circular sanitation economy.
Reimagining excreta as a resource has increasingly entered the public sphere
through the collective efforts of the sanitation research community over decades,
and ElectroSan is fortunate to contribute to this transformation and build on
contributions from this dynamic community. Our vision remains to establish a
diverse and profitable portfolio of urine-derived products, including fertilizers,
disinfectants, fuel, water, and commodity chemicals. Recently, other researchers
have extracted microbial proteins and brickmaking materials from urine (Randall
et al., 2016; Christiaens et al., 2017). As the field matures, we expect to realize
the vision of a suite of technologies and products that resource-oriented sanitation
service providers can consider when they separately collect urine.
Within the field of resource-oriented sanitation, ElectroSan has focused primarily
on a circular nitrogen economy. These efforts can help rebalance the nitrogen cycle
by reusing reactive nitrogen, thus reducing discharges that foster eutrophication
and harmful algal blooms, which damage aquatic ecosystems and threaten human
health. Designing selective separation processes and materials will make this vision
a reality. Just as we have integrated lab and field studies, we integrate investigations
of novel materials that enable novel processes with process engineering that outlines
criteria for groundbreaking materials.
While many problems are interdisciplinary, crafting profitable sanitation initiatives absolutely demands contributions from several fields (Hyun et al., 2019). The
ElectroSan story demonstrates the multifaceted contributions required from engi-
16 Reimagining Excreta as a Resource: Recovering Nitrogen from Urine. . .
457
neering, business, policy, social sciences, public health, and humanities. Sanitation
is often considered a “boundary object” to which many fields refer (Hyun et al.,
2019), but will require communication and coordination between disciplines to meet
the demanding challenge of providing billions of people with sanitation access.
4.2 Pivots
Like many Development Engineering projects, the story of ElectroSan is a series
of pivots, design sprints, and iterative technology development. We have identified
several pivot points throughout this chapter but highlight several significant changes
in direction here:
1. We shifted from the Safe Sludge focus on using urine as a feces disinfectant to the
ElectroSan focus of making separate valuable products from urine. This shift was
motivated by separate collection of urine and feces and Sanergy already having
thermophilic composting of feces. There was a major need to separately valorize
urine, and ElectroSan developed to fulfill that need.
2. Although we developed two technologies in parallel, we chose to focus on ion
exchange because it was more mature, logistically simple, easier to operate, and
better proven at the time of our field trial. This decision was difficult at the time
but in retrospect was a clear choice to accelerate the overall project and still apply
learnings from ion exchange to electrochemical stripping that have facilitated
transfer to other settings besides Nairobi.
3. Our brief expansion from urine to anaerobic digester effluent seeded the idea of
using ion exchange and electrochemical stripping for other waste streams, but
did not end up being installed at Sanergy. This decision allowed us to focus on
urine at Sanergy, which we had most thoroughly characterized; at the same time,
the decision opened up applications for ElectroSan technologies in the United
States and other settings outside of urine.
4. Most recently, we pivoted from depot-level urine treatment to toilet-level recovery, which could obviate the need to transport urine. This was identified early on
as a potential value proposition for urine treatment (during the 2016 field visit)
but revisited with the scientific question of accelerating urea hydrolysis on site.
The continued search for customer for urine-derived fertilizer also informed this
choice, because scaling up will likely involve many installations rather than a
few large installations.
We consider these pivots learning experiences more than failures or successes.
Because hypotheses are constantly being generated in the laboratory and tested in
the field or vice versa, we expect to continue to pivot as the idea of extracting value
from urine matures.
458
W. A. Tarpeh et al.
4.3 Ongoing and Future Work
We have also identified several areas of ongoing work throughout this chapter.
Significant highlights include:
1. Analyzing potential uses and buyers of ammonium sulfate fertilizer and other
urine-derived products.
2. Engineering nutrient capture and urine treatment within the size constraints of a
Fresh Life Toilet.
3. Adapting ion exchange and media filtration from treating urine to treating fecal
sludge.
4. Developing more nitrogen-selective adsorbents to enhance adsorbent lifetime
and product purity.
5 Summary and Interpretive Text Boxes
Guiding Framework
Throughout ElectroSan’s activities, we have focused on several criteria: (1) maximizing nitrogen recovery efficiency, (2) creating profit by value of products
exceeding costs of extraction, (3) operating at scale, (4) beating conventional
methods in costs and/or environmental impacts, and (5) evaluating social acceptance
from product users and/or treatment operators. Ideas have constantly been evaluated
against this framework to inform our future research. For example, when we
performed our life cycle assessment of ion exchange, we would have pursued other
options if conventional nitrogen management was less costly and less environmentally harmful than ion exchange. We also conducted a preliminary estimate of the
size of ion exchange cartridge needed for an average household (4 L); if it were
prohibitively large, we would have pivoted to other adsorbents earlier on in the
design process.
Pivots
One major pivot was our focus on ion exchange over electrochemical stripping,
although electrochemical stripping was the newer and potentially more exciting
technical option at the time. Another was our recent choice to pivot from selling
liquid fertilizer at a premium because of its potentially organic source (urine) to
instead reduce transport of urine, because the latter was easier to monetize. While
we continue to work on establishing demand for urine-derived fertilizers, Sanergy’s
collection costs are a more sorely felt need that our innovations can address in the
near term.
Responsible Research and Capacity
Many stories exist of organizations building a project far from home and then
losing contact and thus failing to ensure that the project is sustainably operated
and maintained. One best practice in international sustainable development efforts
is partnering with a strong in-country partner who knows the social and economic
16 Reimagining Excreta as a Resource: Recovering Nitrogen from Urine. . .
459
landscape. In this case, our in-country partner Sanergy employs 400 people, 60% of
whom live in communities where Fresh Life Toilets are being utilized (Jobs, 2020).
Maintaining close communication with Sanergy leadership and field staff promotes
quick realistic feedback and iteration during laboratory and pilot research even while
being located almost 10,000 miles away. The ElectroSan team has also engaged
Sanergy laboratory staff to a high degree, including training laboratory staff on urine
treatment technologies and having two New Technologies (Sanergy department)
researchers as co-authors on our Development Engineering Journal publication
(Tarpeh et al., 2018b). Similarly, training students and providing opportunities for
research exchanges has been a major focus of our recent activities with Delvic
in Senegal. UC Berkeley students also worked at Sanergy, helping establish the
laboratory and build capacity for pathogen inactivation experiments and ammonia
analysis.
Discussion Questions
1. How should “sustainability” be defined for sanitation service provision? How
should trade-offs between human health, cost, and environmental protection be
evaluated? For example, should Sanergy prioritize reducing nitrogen discharges
to the environment at additional cost, given that the majority of human waste
in Nairobi is discharged to the environment with minimal or no treatment?
As another example, is it sustainable to treat urine using ion exchange resin
materials that must be imported? Suggest other decisions facing Sanergy and
ElectroSan, and evaluate them through your definition of sustainability.
2. What factors would most significantly affect the ElectroSan business model
if it were implemented in Dakar, Senegal? Rural Kenya? India? Choose other
settings and reflect on the same question. List the questions you would ask
to ascertain the required changes. Describe the factors that companies like
ElectroSan and Sanergy should consider when expanding their geographical
scope and business verticals.
3. What is the role of beneficiary communities in the development of human
waste collection services and waste-derived products? What is the importance
of community input? What is the importance of culture?
4. How might fields other than economics/business and STEM provide value in
Development Engineering contexts and specifically in this case study?
5. What are the benefits and potential drawbacks of franchising toilets instead of
Sanergy maintaining complete ownership over toilets? How would changes in
the toilet provision and excreta collection affect the ElectroSan business model?
6. How might businesses like Sanergy and ElectroSan be affected or adapt in the
coming decades as developing areas change according to various forecasts (e.g.,
technological, environmental, political, economic)? Consider some best case,
worst case, and moderate scenarios.
7. For researchers located far away from their Development Engineering enterprise or partners, what strategies are important for maximizing the effectiveness
of trips to the enterprise location? Moreover, what are the most important
aspects for maintaining effective productivity between both locations while
distanced?
460
W. A. Tarpeh et al.
8. How might related enterprises be different or similar if sponsored or operated
by a government instead of a private entity? What are the pros and cons of
public vs. private sponsorship, for various countries?
9. When collaborating on a development venture, how might academic and
business realms differ in the enterprise aspects that they emphasize or overlook?
How might they overcome these differences to make integrated progress?
10. Comment on the timeline and workflow of this case study from inception
to present day. Are there certain work strategies or order of events that you
consider beneficial or would have modified?
11. How can mission-driven companies focused on social impact, like Sanergy and
ElectroSan, balance ethical provision of services with profitability and financial
sustainability, especially if business competition begins to arise?
References
Amouroux, J., & Auerbach, D. (2016). Sustainable sanitation provision in urban slums – The
Sanergy case study. In E. A. Thomas (Ed.), Broken pumps and promises: Incentivizing impact
in environmental health (pp. 211–216). Springer International Publishing.
Baum, R., Luh, J., & Bartram, J. (2013). Sanitation: A global estimate of sewerage connections
without treatment and the resulting impact on MDG progress. Environmental Science &
Technology, 47, 1994–2000.
Board, O. S., & National Academies of Sciences E and Medicine. (2019). Environmental
engineering for the 21st century: Addressing grand challenges. National Academies Press.
Buluswar, S., Friedman, Z., Mehta, P., et al. (2014). 50 breakthroughs: Critical scientific and
technological advances needed for sustainable global development. LIGTT. Institute for
Globally Transformative Technologies, Lawrence Berkeley National Lab.
Calvert, C. (1979). Use of animal excreta for microbial and insect protein synthesis. Journal of
Animal Science, 48, 178–192.
Chien, S. H., Gearhart, M. M., & Villagarcía, S. (2011). Comparison of ammonium sulfate
with other nitrogen and sulfur fertilizers in increasing crop production and minimizing
environmental impact: A review. Soil Science, 176, 327–335.
Christiaens, M. E. R., Gildemyn, S., Matassa, S., et al. (2017). Electrochemical ammonia
recovery from source-separated urine for microbial protein production. Environmental Science
& Technology, 51, 13143–13150. https://doi.org/10.1021/acs.est.7b02819
Clark, B., & Tarpeh, W. (2020). Selective recovery of ammonia nitrogen from wastewaters
with transition metal-loaded polymeric cation exchange adsorbents. Chemistry – A European
Journal n/a. https://doi.org/10.1002/chem.202002170
Clark, B., Gilles, G., & Tarpeh, W. A. (2022). Resin-mediated PH control of metal-loaded
ligand exchangers for selective nitrogen recovery from wastewaters. ACS Applied Materials
& Interfaces, February 15. https://doi.org/10.1021/acsami.1c22316
Corominas, L., Larsen, H. F., Flores-Alsina, X., & Vanrolleghem, P. A. (2013a). Including life cycle
assessment for decision-making in controlling wastewater nutrient removal systems. Journal of
Environmental Management, 128, 759–767. https://doi.org/10.1016/j.jenvman.2013.06.002
Corominas, L., Foley, J., Guest, J. S., et al. (2013b). Life cycle assessment applied to wastewater treatment: State of the art. Water Research, 47, 5480–5492. https://doi.org/10.1016/
j.watres.2013.06.049
Deleu, E. (2020). Producing fertilizer from source-separated urine. MS Thesis, Ghent University.
Diener, S., Semiyaga, S., Niwagaba, C. B., et al. (2014). A value proposition: Resource recovery
from faecal sludge—Can it be the driver for improved sanitation? Resources, Conservation and
Recycling, 88, 32–38. https://doi.org/10.1016/j.resconrec.2014.04.005
16 Reimagining Excreta as a Resource: Recovering Nitrogen from Urine. . .
461
Etter, B., Tilley, E., Khadka, R., & Udert, K. (2011). Low-cost struvite production using sourceseparated urine in Nepal. Water Research, 45, 852–862.
Galloway, J. N., Townsend, A. R., Erisman, J. W., et al. (2008). Transformation of the nitrogen
cycle: Recent trends, questions, and potential solutions. Science, 320, 889–892. https://doi.org/
10.1126/science.1136674
Geissdoerfer, M., Savaget, P., Bocken, N. M., & Hultink, E. J. (2017). The circular economy–a
new sustainability paradigm? Journal of Cleaner Production, 143, 757–768.
Huang, W., Zhao, Z., Yuan, T., et al. (2016). Effective ammonia recovery from swine excreta
through dry anaerobic digestion followed by ammonia stripping at high total solids content.
Biomass and Bioenergy, 90, 139–147.
Hyun, C., Burt, Z., Crider, Y., et al. (2019). Sanitation for low-income regions: A cross-disciplinary
review. Annual Review of Environment and Resources, 44, 287–318. https://doi.org/10.1146/
annurev-environ-101718-033327
Jacobsen, M., Webster, M., & Vairavamoorthy, K. (2012). The future of water in African cities:
Why waste water? World Bank Publications.
Jobs. (2022). Sanergy. http://www.sanergy.com/jobs/
Kavvada, O., Tarpeh, W. A., Horvath, A., & Nelson, K. L. (2017). Life-cycle cost and environmental assessment of decentralized nitrogen recovery using ion exchange from source-separated
urine through spatial modeling. Environmental Science & Technology, 51, 12061–12071. https:/
/doi.org/10.1021/acs.est.7b02244
Ki-Moon B (2013) The millennium development goals report 2013.. United Nations Pubns.
Kringel, R., Rechenburg, A., Kuitcha, D., et al. (2016). Mass balance of nitrogen and potassium
in urban groundwater in Central Africa, Yaounde/Cameroon. Science of the Total Environment,
547, 382–395. https://doi.org/10.1016/j.scitotenv.2015.12.090
Kvarnström E, Emilsson K, Stintzing AR, et al (2006) Urine diversion: One step towards
sustainable sanitation.. EcoSanRes Programme.
Larsen, T. A., & Gujer, W. (1996). Separate management of anthropogenic nutrient solutions
(human urine). Water Science and Technology, 34, 87–94.
Larsen, T. A., Hoffmann, S., Lüthi, C., et al. (2016). Emerging solutions to the water challenges of
an urbanizing world. Science, 352, 928–933. https://doi.org/10.1126/science.aad8641
Larsen, T. A., Riechmann, M. E., Udert, K. M. (2021). State of the art of urine treatment
technologies: A critical review. Water Research X, 13, 100114. https://doi.org/10.1016/
j.wroa.2021.100114
Li, Y., Tarpeh, W. A., Nelson, K. L., & Strathmann, T. J. (2018). Quantitative evaluation of
an integrated system for valorization of wastewater algae as bio-oil, fuel gas, and fertilizer
products. Environmental Science & Technology, 52, 12717–12727. https://doi.org/10.1021/
acs.est.8b04035
Liu, M. J., Neo, B. S., & Tarpeh, W. A. (2020). Building an operational framework for selective
nitrogen recovery via electrochemical stripping. Water Research, 169, 115226. https://doi.org/
10.1016/j.watres.2019.115226
Mohajerani, A., Ukwatta, A., Jeffrey-Bailey, T., et al. (2019). A proposal for recycling the world’s
unused stockpiles of treated wastewater sludge (biosolids) in fired-clay bricks. Buildings, 9.
https://doi.org/10.3390/buildings9010014
Nørskov J, Chen J, Miranda R, et al (2016) Sustainable ammonia synthesis–exploring the
scientific challenges associated with discovering alternative, sustainable processes for ammonia
production.. US DOE Office of Science.
O’Keefe, M., Lüthi, C., Tumwebaze, I. K., & Tobias, R. (2015). Opportunities and limits to
market-driven sanitation services: Evidence from urban informal settlements in East Africa.
Environment and Urbanization, 27, 421–440. https://doi.org/10.1177/0956247815581758
Ogunyoku, T. A., Habebo, F., & Nelson, K. L. (2016). In-toilet disinfection of fresh fecal sludge
with ammonia naturally present in excreta. Journal of Water, Sanitation and Hygiene for
Development, 6, 104–114. https://doi.org/10.2166/washdev.2015.233
462
W. A. Tarpeh et al.
Ohm, T.-I., Chae, J.-S., Moon, S.-H., & Jung, B.-J. (2013). Experimental study of the characteristics of solid fuel from fry-dried swine excreta. Process Safety and Environmental Protection,
91, 227–234.
Randall, D. G., Krähenbühl, M., Köpping, I., et al. (2016). A novel approach for stabilizing fresh
urine by calcium hydroxide addition. Water Research, 95, 361–369. https://doi.org/10.1016/
j.watres.2016.03.007
Sanergy. (2014). Designing a product positioning strategy for human urine as fertilizer in Kenya.
Scott C, Faruqui N, Raschid-Sally L (2004) Wastewater use in irrigated agriculture: Confronting
the livelihood and environmental realities.. International Water Management Institute.
Singh, J., & Ordoñez, I. (2016). Resource recovery from post-consumer waste: Important lessons
for the upcoming circular economy. Journal of Cleaner Production, 134, 342–353.
Tarpeh, W. A., Udert, K. M., & Nelson, K. L. (2017). Comparing ion exchange adsorbents for
nitrogen recovery from source-separated urine. Environmental Science and Technology, 51,
2373–2381. https://doi.org/10.1021/acs.est.6b05816
Tarpeh, W. A., Barazesh, J. M., Cath, T. Y., & Nelson, K. L. (2018a). Electrochemical stripping to
recover nitrogen from source-separated urine. Environmental Science & Technology, 52, 1453–
1460. https://doi.org/10.1021/acs.est.7b05488
Tarpeh, W. A., Wald, I., Omollo, M. O., et al. (2018b). Evaluating ion exchange for nitrogen
recovery from source-separated urine in Nairobi, Kenya. Development Engineering, 3, 188–
195.
Tisserant, A., Pauliuk, S., Merciai, S., et al. (2017). Solid waste and the circular economy: A global
analysis of waste treatment and waste footprints. Journal of Industrial Ecology, 21, 628–640.
Toilet Board Coalition. (2016). Sanitation in the circular economy. Transformation to a commercially valuable. Self-Sustaining, Biological System.
Udert, K. M., et al. (2003). Fate of major compounds in source-separated urine. https:/
/iwaponline-com.stanford.idm.oclc.org/wst/article-abstract/54/11-12/413/13916/Fate-ofmajor-compounds-in-source-separated-urine
United Nations. (2015). Goal 6: Ensure access to water and sanitation for all.
United Nations Human Settlements Programme. (2003). The challenge of slums: Global report on
human settlements, 2003. UN-HABITAT.
WHO/UNICEF Joint Water Supply, Sanitation Monitoring Programme, World Health Organization. (2015). Progress on sanitation and drinking water: 2015 update and MDG assessment.
World Health Organization.
World Health Organization. (2011). Women and girls and their right to sanitation.
World Health Organization. (2013). Health through safe drinking water and basic sanitation.
World Health Organization. (2019). Sanitation.
Open Access This chapter is licensed under the terms of the Creative Commons Attribution 4.0
International License (http://creativecommons.org/licenses/by/4.0/), which permits use, sharing,
adaptation, distribution and reproduction in any medium or format, as long as you give appropriate
credit to the original author(s) and the source, provide a link to the Creative Commons license and
indicate if changes were made.
The images or other third party material in this chapter are included in the chapter’s Creative
Commons license, unless indicated otherwise in a credit line to the material. If material is not
included in the chapter’s Creative Commons license and your intended use is not permitted by
statutory regulation or exceeds the permitted use, you will need to obtain permission directly from
the copyright holder.
Chapter 17
Engineering Predictable Water Supply:
The Humans Behind the Tech
Christopher Hyun, Tanu Kumar, Alison E. Post, and Isha Ray
1 Introduction
In the summer of 2007, graduate student Emily Kumpel, from the University of
California, Berkeley (UC Berkeley), attempted to collect household water quality
samples in Hubli-Dharwad, India. As she went from home to home, she found piped
water service to be intermittent and unpredictable; even those who had lived in the
city for years could not tell her when the water would turn on. She contacted the
local water utility for more accurate information, but they could only give her a
rough estimate. “They told me that water would arrive a certain number of times
in a week, but not exactly when,” Kumpel recalls. She realized then that significant
numbers of households with piped network connections experienced uncertainty
about when and if water would arrive.1
Around the globe, public services such as water and electricity are often not
delivered continuously. Even though 89% of the world’s population had access to
piped water by 2012, Kaminsky and Kumpel (2018) estimate that at least one billion
people around the world receive their piped water for fewer than 24 h a day. Service
intermittency is often a consequence of inadequate supply for the entire service area.
Intermittency places many burdens upon households. First, it often leads to
inadequate quantities of supply at the household level. A few hours of piped water
Tanu Kumar and Christopher Hyun are co-first authors of this chapter.
Kumpel, personal communication, February 3, 2020
1 E.
C. Hyun () · A. E. Post · I. Ray
University of California, Berkeley, CA, USA
e-mail: chrish@berkeley.edu
T. Kumar
William & Mary, Williamsburg, VA, USA
© The Author(s) 2023
T. Madon et al. (eds.), Introduction to Development Engineering,
https://doi.org/10.1007/978-3-030-86065-3_17
463
464
C. Hyun et al.
supply, after all, may be insufficient for an urban household’s cooking, cleaning,
and bathing needs over the day or the week. Furthermore, intermittent water supply
imposes burdens because it often arrives at unpredictable times. Water utilities are
often unable to follow schedules for many reasons, including a lack of internal
coordination, poor infrastructure, or problems with intermittent electricity supplies.
Households are left not knowing exactly when their water supply will begin or end.
Water supply unpredictability can be particularly burdensome for poorer households. Many middle- and upper-class households can afford purchased water from
tankers or automatically filling tanks to store the water whenever it arrives. For
households that cannot regularly afford tanker water or do not have load-bearing
roofs to support tanks, the only option is to wait for water and to fill household
storage containers manually. For them, waiting for water could mean forgone wages
or missed social events. These costs fall primarily upon women, who are most likely
to be at home during the day.
Emily Kumpel, with a few colleagues, founded a social enterprise named
NextDrop, which sent SMS (text message) notifications to urban households about
water arrival times. The premise was that, since it is costly to address the underlying
causes of water intermittency in piped systems, an information-based service could
be a low-cost solution to ease the burden of water unpredictability. NextDrop rolled
out and scaled up in the state of Karnataka in two urban areas of varying sizes,
Hubli-Dharwad and Bangalore.
We studied NextDrop’s services and found that while its pilot in the twin cities of
Hubli-Dharwad was promising, the services rolled out on a larger scale in Bangalore
did not have a measurable impact on many dimensions of household welfare. Why
not?
NextDrop’s system depended on water utility employees to provide timely
information about water arrival to disseminate to the company’s customers (see
Fig. 17.1). These “valvemen” opened and closed water valves throughout the city,
channeling water to particular segments of the piped network in rotation. NextDrop
found it difficult to incentivize the valvemen to send the company regular and
accurate data in metropolitan Bangalore. NextDrop’s system was also not fully
compatible with the existing social dynamics between households, valvemen, and
utility supervisors. Moreover, even when information was accurately disseminated,
customers often did not receive it; in many homes, for instance, the women who
were responsible for waiting for and collecting water were not in possession of the
household mobile phone during the day.
NextDrop’s problematic rollout in Bangalore illustrates that the preferences and
priorities of employees and customers are vital human components of technological
innovations. They must be understood before and during the initial rollout of an
innovation, and they can vary in unexpected ways across locations. It is essential to
consider the possibility of this variation when scaling up an innovation from pilot
locations.
In this chapter, we analyze NextDrop’s evolution and develop this argument as
follows: first, we provide an overview of the NextDrop system in its final form.
We then go back in time and describe the system’s development during a class
17 Engineering Predictable Water Supply: The Humans Behind the Tech
465
Fig. 17.1 NextDrop’s phone-based water supply notification system depended on notifications
from water valvemen. (Adapted from NextDrop)
on Information and Communications Technology for Development (ICTD) at UC
Berkeley in 2009. We move on to discuss the company’s initial, and apparently
successful, pilot in Hubli-Dharwad, India. We follow the company’s expansion
to Bangalore with a pair of companion studies that we (the authors) conducted
during 2014 and 2015. Drawing on insights from these studies, we show that
the intervention had little impact on Bangalore’s households, in part because key
human elements in the system differed significantly and unexpectedly from the pilot
location. We conclude with some takeaways for development engineers who wish
to better understand and manage the human aspects of technological innovations.
2 The NextDrop System: An Overview
NextDrop’s founders noticed that households faced major difficulties dealing with
intermittent water supply and decided to develop a technological system that would
provide them with advance warning of water arrival times. This was easier said
than done, as water utilities delivering intermittent water supply tend not to have
sensors throughout their piped network. In systems without such sensors, the water
utility may not have any centralized information about where water is flowing
throughout its pipes, especially at the household level. Though Bangalore’s water
utility released its schedule for piped water supply for residents to see in newspapers
and local utility offices, responses from our 2014–2015 household survey revealed
that this information was generally inaccurate in our study area (see Fig. 17.2). This
shows that residents would have required a more accurate source of water supply
information if they wanted to know when their water would turn on.
466
C. Hyun et al.
Fig. 17.2 Scheduled versus reported interval between supply days in Bangalore utility’s E3
subdivision. (From Kumar et al., 2022)
After a fair amount of research, NextDrop’s founders discovered that the
valvemen who turned the water on and off were the best source for information
on water arrival times. They developed a system through which they asked the
valvemen to call a toll-free number whenever they opened a water valve, closed a
valve, or did not open a valve when scheduled to do so (i.e., a supply cancellation).
NextDrop developed proprietary software and then used it to send text or voice
notifications with expected water arrival times to participating households that it
had located in specific valve areas based on their GPS coordinates. Because it takes
time for water to flow into a valve area and fully pressurize any specific portion of
17 Engineering Predictable Water Supply: The Humans Behind the Tech
467
the network, notifications would arrive before water reached household taps, giving
residents some time to get ready to receive water.
NextDrop relied on the valvemen’s knowledge of the piped network in order to
accurately map which valves served which households. It collected GPS coordinates
for households and, with the valvemen’s help, created maps of the valve areas,
which Indian utilities typically do not possess. Each polygon in Fig. 17.2 is an
example of one of Bangalore’s thousands of valve areas; each valveman was
responsible for several at a time. NextDrop could then identify which households
fell in which valve areas based on household GPS coordinates.
Thus, we can see that the valvemen had unique knowledge of the day-to-day
workings of the urban water system. They possessed information that was not
available to even the chief engineers of the utility. As a result, their cooperation
was essential to the success of NextDrop’s innovation.
3 From Idea to Pilot to Scale-Up
3.1 Idea Formation at UC Berkeley, USA
After that summer in India, Kumpel, then a PhD student in the Civil and Environmental Engineering Department, took Tapan Parikh’s project-based class at
UC Berkeley, “Social Enterprise for International Development.” Kumpel worked
with a handful of other students—Ari Olmos, Thejovardhana Kote, Matt Gedigian,
and Niranjan Krishnamurthi—to develop a technology that sent households text
messages about their water supply status. The team settled on calling the system
“NextDrop,” inspired by an app called “NextBus.” The team won a prize for the
best project in the class. They eventually submitted an $8000 USD proposal to
the Big Ideas Contest at UC Berkeley, an initiative providing funding along with
training and contacts to help support student-led innovations. All this led Kumpel to
do initial groundwork for a pilot in Hubli-Dharwad.2
3.2 Pilot in Hubli-Dharwad, India
The twin cities’ area of Hubli-Dharwad is the second most populous urban center in
the state of Karnataka, with a population of just under a million people by the time
NextDrop started. Rapid population growth had put pressure on the municipal water
2 Before this, Kumpel decided to conduct her dissertation research in Hubli-Dharwad. From
2007 onward, Kumpel and other UC Berkeley researchers established relationships with the
municipality, so that when the NextDrop team put together its first business plan and won a grant
in 2009, it could leverage this relationship to launch its system in Hubli-Dharwad.
468
C. Hyun et al.
distribution system operated by the Karnataka Urban Water Supply and Drainage
Board. Most residents received piped municipal water intermittently, from every
other day to once a week, with a median of every 5 days (Ray et al., 2018).3
By the time NextDrop began in Hubli-Dharwad, over 50 valvemen managed
more than 800 valves, supplying water to various neighborhoods at different times
across the twin cities. The utility announced water schedules in local newspapers,
but they were frequently out of sync with actual water delivery times. Utility workers
coordinated water delivery with one another mainly through ad hoc mobile phone
calls and field visits. This, along with electricity outages and pipe breaks, led to
not only intermittent but also unpredictable water supply timings. Households did
not know when water would turn on and for how long the supply would last. For
some (mostly higher-income) residents with large storage tanks, this may have not
been a major inconvenience. However, water supply intermittency coupled with
unpredictability can lead to high wait times, missed work or social events, and waterrelated stress for low-income residents with little water storage capacity (Kumpel et
al., 2012).
In 2010, Kumpel spent almost a year in Hubli-Dharwad with the NextDrop team,
setting up the first iteration of their innovation. Through her dissertation research,
she had already established a solid working relationship with the chief engineer
of the water board, who wanted to both address the problem of intermittent water
supply and implement a novel mobile phone system. Ari Olmos and Anu Sridharan,
a UC Berkeley undergraduate at the time, traveled to India to pilot the system. In
2012, after much discussion and with Sridharan as chief executive officer, NextDrop
became a for-profit company, giving the organization greater opportunities for
funding and tendering by the government. NextDrop won several awards, including
the Clinton Global Initiative Award for Outstanding Commitment, the GSMA
mWomen BOP App Challenge, and the Knight Foundation News Challenge.
NextDrop’s first system was primarily manual and relied on households to report
when they received their water supply. In this first iteration of the product, Kumpel
worked with the Deshpande Foundation to collect mobile numbers from households,
requesting customers to call in when they received water. Whenever NextDrop
received a call from any household about water supply, they would use a spreadsheet
to keep track and send messages to the households in the same valve areas. In
later iterations, the valvemen would send notices via NextDrop’s interactive voice
response system when they were about to adjust a water valve, indicating (1)
“advance notice” an hour or less before opening a valve, (2) “valve opening,” (3)
“valve closing,” or (4) “last-minute changes” when water supply was interrupted.
NextDrop would then send notifications to customers’ mobile phones via voice
or text messages based on household GPS coordinates. As the municipality did
not supply funding or administrative capacity for their system, NextDrop recruited
3 From 2007 to 2008, the Board installed new pipes with continuous water supply through a World
Bank-funded project. However, only 10% of consumers received this 24/7 provision, and even
then, there have been reports of service interruptions (Ray et al., 2018).
17 Engineering Predictable Water Supply: The Humans Behind the Tech
469
valvemen directly, who, for the most part, seemed content to contribute to an
innovation that could potentially reduce the time they spent on fielding complaint
calls from households.
NextDrop also implemented various incentives to encourage valvemen to use
their system. The more often a valveman called NextDrop, the more they accumulated points for a list of items they could win. This worked so well that valvemen
worked together to combine their points for large ticket items, such as televisions.
NextDrop also recognized “Valvemen of the Quarter.” During this pilot stage,
NextDrop staff members worked closely with the valvemen, being considerate of
their personal needs and providing a sense of camaraderie with NextDrop. Trust was
built. According to NextDrop team members, this worked well for the valvemen and
the company alike.4
In 2012, after a month of close monitoring, NextDrop found the valvemen’s data
to be relatively accurate for “opening” and “advance” notifications (Kumpel et al.,
2012). They also found that advance notices reached customers 20 to 40 min before
they received water supply, close to NextDrop’s ideal 30-minute target. Customers
reported being able to go home or arrange water collection by family or neighbors
in time for the start of the water supply due to NextDrop’s mobile messages. By
2012, NextDrop had over 7000 customers across 80 valve areas in Hubli-Dharwad.
They offered new customers a free month of service and slowly rolled out a payment
system with text messages for 10 INR ($0.20 USD) per month or voice messages
for 15 INR ($0.30 USD) per month. Most of NextDrop’s customers were middleto high-income and opted for the text messages; however, the company hoped
eventually to include more low-income customers who might have preferred voice
messages due to lower literacy levels.
Though NextDrop collected fees from their customers in Hubli-Dharwad, these
funds were not sufficient to cover costs. In order to find new funding streams and
reap economies of scale, they decided to expand to a new city. They chose the state
capital, Bangalore, a city over eight times the size of Hubli-Dharwad. As excitement
and potential funding for the Bangalore rollout grew, NextDrop diverted most of its
resources and personnel to the new site, eventually leaving operations in HubliDharwad to run primarily on autopilot.
3.3 Scale-Up in Bangalore, India
Growing from 5.8 million people in 2001 to 8.6 million in 2011, Bangalore is
considered the Silicon Valley of India. Though known in international water policy
circles for providing extensive water coverage and achieving highly successful fee
collection, piped water delivered by the Bangalore Water Supply and Sewerage
Board (BWSSB) is still, like in Hubli-Dharwad, intermittent (McKenzie & Ray,
4 D.
Miller, personal communication, January 30, 2020
470
C. Hyun et al.
2009). The utility’s public website displays a water arrival timetable showing that
neighborhoods can expect their water at varying intervals across a range of time—
from once a week to everyday. For some locations, specific water arrival times are
not given; for others, specific times are given but not specific days, leaving supply
unpredictable for households.5
NextDrop initiated its Bangalore rollout by signing a memorandum of understanding (MOU) with the BWSSB in 2013. This agreement did not provide any
funding from the utility, but it did provide NextDrop with some authority over the
valvemen: they and their supervisors now had to comply with NextDrop’s system.
At the time, the BWSSB divided the city into 32 subdivisions. NextDrop initially
rolled out in “Subdivision A,” a pseudonym we use to protect the identities of
the valvemen among whom we conducted our ethnographic study. At the time,
Subdivision A had five service stations with two to four valvemen at each station.
Each valveman was assigned 20 or more valve areas, and each valve area covered
anywhere from 20 to 200 households.
From the start, NextDrop staff knew that the valvemen in Bangalore might
be reluctant to comply with their notification regime. During its pilot in HubliDharwad, NextDrop had garnered a workable level of cooperation from the valvemen. The company did not keep detailed data on incentive-specific performance
but believed that their combination of individual and social incentives in HubliDharwad had been effective. Scaling up this highly personalized incentive system
to the megacity of Bangalore did not seem feasible, however, so NextDrop relied
on the BWSSB’s official hierarchy to encourage valvemen to submit the required
data. In other words, the valvemen’s supervisors were required to ensure that they
sent notifications to NextDrop under the MOU. In effect, the Bangalore rollout
substituted the reliance on individual incentives and personal goodwill for reliance
on the utility’s organizational structure—arguably a more scalable proposition.
At the same time, NextDrop continued to make changes to its technology, led by
their chief engineer, Devin Miller. In Hubli-Dharwad, the messaging system was in
Kannada, the primary language of the state. Bangalore is much more cosmopolitan,
requiring multiple languages, such as Tamil and Telugu, in addition to Kannada, so
these languages were added. NextDrop also created an online customer registration
system, converted their spatial data to Google Maps, and added more specific
information to customer notifications (e.g., power outages as a reason for supply
delays).
5 This information was retrieved on December 21, 2020, from the BWSSB’s Water Supply
Timing website (https://web.archive.org/web/20201221210514/https://www.bwssb.gov.in/watter_
supply.php)
17 Engineering Predictable Water Supply: The Humans Behind the Tech
471
4 Research on the Scale-Up
In 2014, our team of researchers from UC Berkeley led by Professors Alison Post
(Political Science) and Isha Ray (Energy and Resources Group) began an evaluation
of NextDrop’s innovation. Post researches urban water politics and service delivery
in developing countries. Ray researches water and sanitation in developing countries
and was one of the original authors for studies on the World Bank’s continuous water
supply demonstration in Hubli-Dharwad (Ray et al., 2018). Our evaluation consisted
of two studies. The first was a randomized controlled trial to assess the effects of
NextDrop’s innovation on household welfare. The second was a mixed-method
study aimed at understanding the NextDrop system from the water valvemen’s
perspectives. PhD students Tanu Kumar (Political Science) and Christopher Hyun
(Energy and Resources Group) joined the team to work on the household evaluation
and valvemen studies, respectively.6
4.1 Study 1: Impact Evaluation7
We conducted the household impact evaluation from June 2014 to November 2015.
This evaluation focused on three main sets of outcomes at the household level: the
costs of unpredictability, psychological effects, and political attitudes toward the
government and the water utility. The costs of unpredictability included any costs
associated with waiting for water, including the time spent, missed events (such as
family gatherings) or missed work, missed or delayed religious observances (such
as the need to wash in fresh water before Friday prayers for many Muslim families),
and purchase of substitutes for piped water. Psychological effects included reported
worry or stress about water arrival times or water running out. Political attitudes
referred to citizens’ perceptions of the BWSSB as a water provider.
We measured the effects of NextDrop’s innovation on these outcomes for 3000
households using two waves of survey data on either end of the randomized
allocation of NextDrop’s services in the BWSSB’s E3 subdivision. Overall, we
detected null effects on all outcomes—except for stress related to household water
management, for which we detected modest beneficial effects. We believe that
these null-to-modest effects can largely be explained by the failure of accurate
information about water arrivals to reach customers.
6 Our research team was also advised by several others who had worked with NextDrop in HubliDharwad, including Zachary Burt, Kara Nelson, and CS Sharada Prasad. This work was funded
by a grant from UC Berkeley’s Development Impact Lab (USAID Cooperative Agreement AIDOAA-A-13-00002), which aims to help students and researchers scale up and evaluate science and
technology innovations for development.
7 See Kumar et al. (2018) for full details on this study.
472
4.1.1
C. Hyun et al.
Site Selection
Our study site, E3, is a BWSSB subdivision near Bangalore’s eastern periphery.
To minimize interfering with NextDrop’s operations and to keep subdivision-level
characteristics constant across households, we decided to conduct the evaluation
within a single subdivision. We selected E3, in consultation with NextDrop and
the BWSSB, for two reasons. First, it was not among the subdivisions scheduled
for immediate expansion of NextDrop’s services, making possible the selection
of control group households who would not receive NextDrop’s services during
the study period. Second, field visits and census-level data revealed that this was
a subdivision with many low-income settlements and relatively intermittent water
supply, suggesting this was an area where NextDrop’s services might be particularly
impactful.
4.1.2
Sample Selection and Randomization
Within areas receiving piped water in E3, we surveyed households and randomly
enrolled them for NextDrop’s notifications (the treatment condition) or not (the
control condition). A concern common to randomized studies of information
interventions such as this one is that treatment households might share information
with control households. To reduce this threat to causal inference, we used cluster
randomization and assigned households to treatment or control status in groups
determined by their geographic location. These groups were separated by at least
two streets to prevent individuals in our treatment and control groups from sharing
information. Additionally, clusters were usually in different valve areas, meaning
that it was unlikely for individuals across clusters to share information because water
arrival times are relevant only to individuals within the same valve areas.
This cluster randomization was also stratified, or blocked, by neighborhood
socioeconomic characteristics. Blocking increased the statistical precision of the
study and allowed us to look for subgroup effects among the low-income households
for which we predicted the effects of the information would be largest. Based on
extensive site surveys, we designated blocks to be either low-income or mixedincome. Each block comprised four clusters (following Imbens, 2011) that we
expected to be similar in terms of socioeconomic variables and the underlying water
infrastructure. We randomly assigned two clusters in each block to receive treatment
and two to the control condition.
Overall, the study included 3000 households, with the sample size calculated to
detect a 30- to 45-min average reduction in the time spent waiting for water. The
total sample had 10 low-income and 20 mixed-income blocks (Fig. 17.3), with 120
total clusters of 25 households each.
17 Engineering Predictable Water Supply: The Humans Behind the Tech
473
Fig. 17.3 The BWSSB E3 subdivision boundary is shown in blue. Areas receiving piped water
supply are denoted in yellow. Green and purple polygons denote low-income clusters (treatment
and control); black and red polygons denote mixed-income clusters (treatment and control). There
are four clusters per block. (Adapted from Kumar et al. 2018)
4.1.3
Two-Wave Survey and Enrollment into NextDrop Services
In early 2015, we worked with a Bangalore-based survey firm to conduct a baseline
survey of the 3000 study households. Enumerators contacted every third household
in a cluster until a quota of 25 households was reached. They then administered
a survey that we designed to obtain measures of our main outcomes and other
variables of interest. Enumerators surveyed the individuals who reported managing
and storing water for the household. In line with the expectation that women are
generally responsible for managing water, 80% of our respondents were women.
The enumerators next offered all households the opportunity to enroll in
NextDrop services by submitting their mobile phone numbers. They could sign
up for text or voicemail notifications in English, Kannada, Telugu, or Tamil.
Because surveys were conducted on tablets that collected GPS coordinates with
5-meter precision, NextDrop was able to correctly identify the valve areas in which
households lived. NextDrop then enrolled the households in our treatment group
clusters following the completion of the baseline survey. In October and November
2015, about 4 months after NextDrop had begun sending messages to customers in
E3, we surveyed the study households once more. NextDrop and the research team
estimated that 4 months was enough time for enrolled households in our treatment
group to adapt to using the notification system and for potential impacts of the
service to occur. The control group was enrolled after the completion of the study.
474
4.1.4
C. Hyun et al.
Results
Overall, we were unable to detect effects of NextDrop’s intervention across our
study population for any of our outcome variables, aside from those related to
worry or stress. Even though our sample size would have enabled us to detect a
decrease in wait times for water as small as 9 min, we observed no effects on time
spent waiting for water, the likelihood of missing work or community events while
waiting, or using substitutes for piped water. We similarly failed to detect effects
for households living in low-income clusters or those we identified as NextDrop’s
target customers, namely, low-income households without automatically filling
water tanks. We detected no effects on attitudes toward the utility, but this could
be because of already positive attitudes at baseline.
Our baseline survey confirmed that E3 was the kind of site in which the
notifications “should” have been impactful; our data indicated that over 85% of
residents received water services just once or twice a week and 28% did not possess
an automatically filling water tank. About 43% reported that they simply learned
that water had arrived when it began to come out of their taps, rather than knowing
when to expect it. Respondents spent roughly 1 h per supply day waiting for water,
which they agreed led to missed work and community or family events. As we
discuss below, we believe these null effects are a result of few customers receiving
accurate and timely information about their water supply.
4.1.5
An “Information Pipeline” to Diagnose the Null Results
We created a framework consisting of each of the steps in the process of producing
and disseminating information to understand our null results (Fig. 17.4). First, someone must collect the relevant information in full. Second, someone must analyze the
information or compile it into a usable format. Third, someone must disseminate
the information. There could be poorly aligned incentives or technical difficulties
preventing any of these first three steps from happening. Organizations often cannot
control those charged with executing their assigned tasks, and employees can
exercise significant autonomy.
Fourth, this information must actually reach the intended recipients. Messages
may go to the wrong person because phone numbers change or because the intended
recipient does not have control over the household mobile phone. Fifth, these
recipients must actually register that they received a message. Information may
be sent in the wrong language, or go unnoticed if a recipient is inundated with
messages, or be so useless that the recipient stops paying attention. Finally, the
information must be accurate. Inaccuracies could reflect deliberate efforts to conceal
information, carelessness, or some inability to measure the relevant information.
We identified several “leaks” in this information pipeline for NextDrop’s model
in Bangalore. First, valvemen had to submit information by calling NextDrop’s
automated interactive voice response system to log valve opening times. Yet logs
17 Engineering Predictable Water Supply: The Humans Behind the Tech
475
Fig. 17.4 Information pipeline: from collection to action. (Adapted from Kumar et al., 2018)
of valvemen notifications to NextDrop show that they sent reports to NextDrop only
70% of the time.
Furthermore, even while NextDrop passed on all of these messages to customers,
only 38% of treatment group members reported receiving notifications. We argue
that these low levels of information receipt can be explained by two factors. Even
among the 854 households that were regularly sent notifications, 207 household
“waiters” for water, usually women, did not have daytime access to the mobile
phone registered with NextDrop; a male member of the family usually took the
phone to work. Second, many respondents may simply have not noticed NextDrop’s
texts or voicemails, which may have become buried under the many solicitation and
informational messages regularly received via SMS.
Finally, only 289 of our 1193 treatment group respondents reported that the
information received in NextDrop’s notifications was either always or usually
accurate. Moreover, when we compared household survey responses about the last
day they had received water to the valveman reports, we found that over one-third
of households reported receiving water on a different day than that reported by
the valveman. In fact, 62% of households received “advance” notifications after
their water had already arrived. Figure 17.5 shows each of the steps preventing
information from reaching our treatment groups. We can identify two “human”
factors that are particularly important here. The first is intra-household dynamics
that prevent the individual responsible for waiting for water from accessing the
household mobile phone. The second is the valvemen’s lack of cooperation in
476
C. Hyun et al.
Fig. 17.5 NextDrop’s leaky information pipeline and treatment group attrition. (Adapted from
Kumar et al., 2018)
sending accurate information to NextDrop to be disseminated. Our second study
explores the extent to which, and why, this latter dynamic was occurring.
4.2 Study 2: Valvemen’s Role and “Compliance”
in NextDrop’s System8
Why were the valvemen not sending notifications when they were supposed to, and
why were these notifications often inaccurate? In a parallel study in a different
part of Bangalore, we examined factors that could contribute to the valvemens’
willingness to comply with NextDrop’s system. They were not sending notifications
to NextDrop, as they were expected to do. So why did the valvemen not comply? We
framed our second study in terms of three levels of factors that may have contributed
to valvemen compliance: organization-, community-, and individual-level factors. In
Fig. 17.6, we measured “compliance” by comparing actual to expected notifications
for each valveman in Subdivision A, using NextDrop’s database. Valvemen had low
to moderate levels of compliance overall, but we also observed that the ratio of
actual to expected valve opening notifications varied within the same subdivision
(between 0.4 and 0.8) and even varied within the same service station (or team).
This revealed that, when controlling for management, valvemen still complied at
different rates, indicating that the characteristics of individual valvemen or of the
8 See
Hyun et al. (2018) for full details on this study.
17 Engineering Predictable Water Supply: The Humans Behind the Tech
477
Fig. 17.6 Notification compliance: actual/expected valve opening reports per valvemen, August
to December 2014, Subdivision A. (Adapted from Hyun et al., 2018)
different community neighborhoods within which they worked may explain why
they did not comply with NextDrop.
4.2.1
Study Design to Understand Compliance Levels
Our field observations focused on Subdivision A because NextDrop’s relationships with the valvemen were strong there, and it was relatively distant from
our household evaluation study area in E3. We used an ethnographic approach
to understand why valvemen complied with NextDrop’s system at low rates.
Our methods included interviews with valvemen, community residents, and staff
members of the water utility and NextDrop. Out of the subdivision’s 17 valvemen,
we chose 9 for close observation, representing a variety of compliance levels. We
followed the valvemen on their daily rounds, on breaks, and even into their homes,
taking extensive notes and geolocated photographs of the neighborhoods that they
serviced. Throughout our interviews and observations, we thought of the valvemen
as “street-level bureaucrats” (following Maynard-Moody & Musheno, 2000, 2012)
and encouraged them to share their personal narratives about their own jobs and
their relationship with NextDrop.
We also created a dataset on the characteristics of the valvemen and the valve
areas in which they worked. Through semi-structured interviews, we collected data
on the number and gender of the valvemen’s children, their wives’ employment
type, the vehicles they used for work, their ages, and the numbers of valves for which
they were responsible. We also visited all 233 valve areas serviced by the 9 valvemen
and collected data on the socioeconomic status (SES) of the neighborhoods, water
infrastructure, and street activity, with most observations taking place around the
same time during weekdays. We observed that “low” SES valve areas had narrow
478
C. Hyun et al.
roadways, few trees, high noise levels, high numbers of people on the streets, and
high domestic activity (e.g., cooking or washing dishes on the streets). “High” SES
valve areas had fewer people on the streets and more water storage tanks, which
implied less work for the valvemen. We ran linear regressions to establish whether
or not our ethnographic observations were supported by correlations within our
broader dataset.
4.2.2
Findings that Explained Overall Low Compliance
We found three explanations for low compliance with NextDrop’s system: (1) the
valvemen’s views of their own jobs, (2) their overworked days, and (3) the insider
knowledge valvemen had that gave them some level of job security.
First, in the water utility’s view, the valvemen’s job description was simple:
listen to utility supervisors and adjust water valves as needed. However, valvemen
perceived their job as responding to “the public” rather than merely to the utility’s
hierarchy. Their overriding sentiment was: “My main work is working with the
public.” The pressure from the public was so strong that another valveman claimed:
“When I work I forget about my family and friends. These people are my family
and friends.”
In public administration literature, this phenomenon is discussed as the tendency
of street-level workers to “cope toward” citizens, seeing themselves as working
for ordinary citizens rather than just for the government (Tummers et al., 2015;
Maynard-Moody & Musheno, 2000). We saw this when observing what valvemen
do when water supply was not on time—the very situation in which NextDrop’s text
messages would be needed. If water arrived late, the conventional utility practice
dictated that the valve area would be given less time, so as not to hold up water
supply for subsequent areas. Valvemen, however, would not always follow this rule:
“If I’m supposed to give them an hour of water, and due to power cuts they only
get a half hour, then I will give them another half hour.” Furthermore, residents
would often complain to valvemen, and residents were not asking for NextDrop’s
text messages; they wanted water. We observed that valvemen routinely prioritized
their time to meet residents’ actual requests over sending notifications to NextDrop.
Second, though it took valvemen less than a minute to send a notification to
NextDrop, even this small act was too much when they felt overworked. Many of
them worked non-stop, constantly negotiating with residents, utility supervisors,
and politicians on the phone and in person while moving from valve to valve.
As a consequence of their low wages, they also made time for other incomegenerating activities, such as side plumbing jobs. If their wives had jobs outside
of the home, the valvemen would also tend to domestic work. Since they knew the
water system well, they would also be called in to assist with pipe breaks at night.
Though some valvemen appreciated NextDrop’s service, others found it annoying:
it is “not helpful for valvemen”; “It’s just an additional job.” During these constant
negotiations, moonlighting work, and moving from neighborhood to neighborhood,
17 Engineering Predictable Water Supply: The Humans Behind the Tech
479
we rarely saw valvemen sending notifications to NextDrop—even though they knew
this was why we were observing them. Many were just overwhelmed.
Finally, as mentioned earlier, valvemen had privileged knowledge of the water
infrastructure and therefore did not take threats of dismissal from the utility
seriously. NextDrop relied on their MOU with the water utility to get the valvemen
to submit notifications, but the valvemen’s tacit knowledge of the city’s water
system was highly valuable, and the utility would have been hard pressed to fire a
valveman for not complying with NextDrop’s system. On-the-ground understanding
of the valve areas is passed on from valveman to valveman, bypassing the head
engineers. When we questioned why one valveman spoke rudely to NextDrop’s
staff and even to his own utility supervisor, he was unconcerned: “I don’t worry
about being fired.”
NextDrop had initially implemented positive incentives in Bangalore, as they had
done in Hubli-Dharwad. They offered the valvemen prizes, such as phones and free
mobile talk time. NextDrop could afford these prizes, but they were not motivating
enough for valvemen who lived in a city with a higher cost of living than HubliDharwad. For the Bangalore valvemen, the incentives did not match the extra work
they had to do for the company. NextDrop also celebrated the “best” valveman, but
this resulted in skepticism about the company’s ranking system and led to social
divisions. When NextDrop eventually secured an MOU with the water utility, the
company was relieved; instead of expensive and ineffective incentives, they thought
they could rely on the utility’s hierarchy to keep their system going. However, as we
saw, this was not enough to get valvemen to comply.
4.2.3
Findings that Explain Variation in Compliance
As explained above, overall compliance with NextDrop was low; however, we
also uncovered explanations for why compliance varied across individual valvemen
through our interviews and observations of the valvemen at work. We observed
that valve area characteristics and a valveman’s family circumstances could explain
differences in compliance levels.
There were often stark community-level differences between middle-class and
low-income valve areas, which influenced how the valvemen worked in each area.
First, valve areas differed in terms of infrastructure. Middle-class areas had wide,
paved roads, making it easier for valvemen to navigate. On the other hand, lowincome areas had narrower and sometimes unpaved roads, with chickens and
dogs that had to be avoided. Middle-class homes had more water storage tanks
with maintenance holes outside of the home, while valveman often had to enter
lower-income homes to check water pressure in their faucets, leading to greater
inconvenience for both the households and the valvemen.
Second, valve areas differed in terms of face-to-face interactions with residents.
In low-income areas with less household water storage capacity, residents stayed
near their homes to wait for water. Sometimes residents stood outdoors with
buckets, dirty laundry, and dishes ready as soon as they saw the valveman in
480
C. Hyun et al.
their neighborhood. Such residents often confronted valvemen with complaints.
According to the valvemen, this was a major difference across valve areas: “The
higher class people call our superiors and the superiors tell the valvemen the
problem. The lower class people come to me directly, and I have to explain to them
directly....I lose a lot of time talking to people.” This pushed NextDrop notifications
to the bottom of the work list in low-income valve areas.
Along with these differences in community-level characteristics, the valvemen’s
individual characteristics affected levels of compliance, particularly in relation to
their personal finance and family circumstances. More children indicated greater
financial need, and this was especially apparent for girl children. Daughters come
with the extra financial burden of (future) marriage dowry expenses, and this was on
the minds of less compliant valvemen, who had to borrow money for dowries: “We
ask our relatives for help—if you help us now, we’ll help you when your daughters
get married.” These valvemen had side jobs, such as driving and plumbing, which
diverted them from sending notifications to NextDrop. If their wives worked outside
the home in inflexible jobs, such as babysitting and dishwashing, the valvemen
sometimes went home in the middle of the work day to take care of a sick child
or do other work (e.g., bring in the family’s hanging laundry before it rained). A
wife’s occupation, then, indicated financial need and could mean more domestic
responsibilities for the valvemen.
Our regression analysis supported our ethnographic observations of the valvemen’s individual characteristics. We saw significant correlations between the
number of children and levels of individual compliance, even in our small sample
size. One additional child was associated with a 7% decrease in compliance. If that
child was a girl, there was an 11% decrease. We also saw decreases in compliance
related to the job type of a valvemen’s wife. Though we created a dataset for 233
valve area communities, we could shadow only 9 valvemen, so we do not claim
causality in this case. However, we see these results as hypotheses to pursue further
explorations of frontline workers’ compliance with new workplace expectations.9
5 Subsequent Status of NextDrop10
While we conducted our research in 2015, NextDrop made plans to roll out
in different cities in order to expand their operations. During our study period,
NextDrop visited other smaller cities in the state of Karnataka, as well as the cities of
Varanasi and New Delhi. This was all done while operations in Hubli-Dharwad were
slowing down and the rollout in Bangalore was still incomplete. Unilever decided to
fund a new project in nearby Mysore, a city slightly smaller than Hubli-Dharwad.
9 See
Hyun et al. (2018) for more details on the analysis.
section is based on personal communication with A. Sridharan (February 3, 2020) and D.
Miller (January 30, 2020).
10 This
17 Engineering Predictable Water Supply: The Humans Behind the Tech
481
To improve their data collection, NextDrop experimented with using smartphones in Mysore, creating a smartphone app that would collect data from the
turning of a valve key—the large, metal T-shaped tool that valvemen use to turn
water valves on. Valvemen would stick the smartphone to the valve key using
Velcro, and, by employing the GPS and motion sensors already in the phone,
algorithms would determine if a specific valve was opening or closing. This was
an innovative idea but difficult to implement in practice. Threading on the valves
was inconsistent and so were valve angles, smartphone placement on the key, and
network connection.
Ultimately, it became an uphill battle for NextDrop to find venture capital for
a valvemen-based call-in system. Raising investor funding on this idea became
unsustainable, and our studies showed that households were not benefiting from the
intervention, due in large part to dependence on the valvemen. NextDrop needed
to reconsider their business model and technological approach. This, combined
with struggles with personnel on the team, led NextDrop’s leaders to downsize the
company.
In 2016, the NextDrop team went from 20 to 5 employees. In Hubli-Dharwad,
they let the system continue to run without oversight until 2019, when they officially
shut it down. In Bangalore, NextDrop agreed to map out the rest of the city and
register all of the remaining valvemen into the NextDrop system for the BWSSB.
NextDrop shifted their maps to the BWSSB’s servers even though valvemen were
no longer sending in data. In 2017, NextDrop submitted a proposal to the BWSSB
for a new system with sensors in major valve areas. Engineers at NextDrop had
considered the use of a sensor-based system since day 1; however, it was costprohibitive. As of early 2020, the BWSSB had not floated a tender for the new
project nor had any funding materialized from the utility. In the meantime, the heads
of NextDrop, Sridharan and Miller, moved on to different water-related projects in
India.
6 Key Takeaways for Development Engineers
In this chapter, we traced the evolution of a technological innovation designed
to reduce the burden of unpredictable water supply, which affects millions of
households around the globe. Climate change and the growth of cities will only
exacerbate the problem, making it even more critical to study and mitigate such
burdens. While NextDrop’s water notification system proved unsuccessful at scale,
it provides key lessons for development engineers, especially those working in the
water or Information and Communications Technology (ICT) sectors.
Our main takeaways are best stated by NextDrop’s own leaders: “We were asking
the wrong question. We were asking, ‘Can this [technology] work?’, when we
needed to ask, ‘Is it worth it?’” says Sridharan, who, as of early 2020, continued
as the CEO of NextDrop. “Worth” emphasizes the value of their innovation to
people. In other words, even the most efficient technology must respond to felt
482
C. Hyun et al.
needs in order to be successfully deployed at scale. There are needs across the
human ecosystem of a technological intervention. Below we summarize three types
of human needs to consider: (1) customer and end user needs, (2) needs of human
intermediaries involved in implementation, and (3) changing needs across contexts
during scale-up.
In our NextDrop study, we found that not everyone who actually received water
supply messages on their phones acknowledged that they received them, suggesting
that a number of customers felt no need to read NextDrop’s messages. Devin Miller,
head engineer at NextDrop, emphasizes the importance of market research, saying
“Spend a whole year on market research if you need to! If you talk to a hundred
customers to understand the problem, and they all say they want it, then you’re
good. But if they don’t understand or don’t say they want it, then you’re going to
have a hard time.”
Technological interventions that aim to help women in particular will benefit
from market research on gender roles or household bargaining structures. In many
low- and middle-income countries, women may have different roles of domestic
labor, access to resources, and less decision-making power than men. In our study,
for example, we found that women tended to be responsible for waiting for water,
but they did not have regular access to the phone to which water supply notifications
were sent. Roessler et al. (2020) similarly find that, in a smartphone intervention for
low-income women in Tanzania, over 40% of the intended beneficiaries reported
that the main user of the phone was not themselves, but rather their husbands or
sons.
Furthermore, it is important to assess how useful an intervention is to end users
not only when delivered perfectly but in its actual, imperfect state. For NextDrop,
this would have meant understanding the usefulness of providing information
even when it was not completely accurate. Development engineers should not
only continually refine their technology, but they also should invest in continual
refinement of market research in order to evaluate the utility of their intervention as
it evolves.
Incorporating the end users themselves, such as women residents, across the
phases of a project may improve design and implementation overall. The Global
Clean Cooking Alliance, an organization that delivers cleaner-burning cookstoves
in low- and middle-income countries, aims to involve women from target countries
in all phases of their projects, including design, production, distribution, promotion,
investment, education, and product servicing. This practice increases the probability
of creating a product that is actually useful and attractive to the intended end user.
Along with end users, it is also important to know what the innovation is worth
to the people who help implement the innovation (e.g., the utility’s employees in
our study). Our research showed that human intermediaries, like the valvemen,
are often ignored in business models or their needs are oversimplified. Often
technological interventions, particularly ICT interventions, aim to eliminate the
need for intermediary workers altogether. As we show, however, the intermediaries
and the “last-mile” delivery for which they are responsible can be key to the success
of an innovation.
17 Engineering Predictable Water Supply: The Humans Behind the Tech
483
For example, the valvemen in Bangalore focused mainly on providing water to
the public, and sending data to NextDrop seemed unimportant to them in comparison. NextDrop could have worked more on convincing valvemen of the connection
between their data input and helping the public. It could have been helpful for
valvemen to meet satisfied NextDrop customers, either in person or through video,
and get their feedback. The core problem here, however, is that neither the utility nor
NextDrop understood the valvemen’s jobs the way the valvemen understood them;
what the company saw as non-compliance, the valvemen saw as compliance to their
greater task—helping the public.
Relatedly, intermediaries are important sources of market information. Instead
of attempting to simply align incentives, engineers and designers should understand
that such intermediaries have insight into on-the-ground realities, which can hint
at what is “worth” doing or not. In our study, we observed on the ground that the
valvemen were “complying,” i.e., actually helping customers, but in ways that the
utility possibly did not sanction or would not approve of. Development engineers
should account for their perspectives and needs along with those of the end users,
especially when planning to scale up.
Lastly, it is crucial to consider differences in context when scaling up innovations,
especially in terms of people’s needs. When a pilot is deemed to be successful
in one location, implementers and funders often decide to replicate it in another
location. Yet, both the process for creating the innovation and its effects may vary
from location to location. Indeed, even within areas of the same state and country
(i.e., Bangalore and Hubli-Dharwad), differences in context were a key aspect of the
difficulties NextDrop faced. In both cities, valvemen had similar job descriptions,
but NextDrop found that incentives that seemed to work well for Hubli-Dharwad
valvemen did not work well for those in Bangalore, reflecting differences in their
needs. “Human behavior is really hard to change,” Kumpel reflected, underscoring
the key challenge of NextDrop’s system in Bangalore.
The potential effects of the intervention also varied across the two locations.
While customers in Hubli-Dharwad seemed to find the innovation useful, the
relevant individuals in Bangalore were, for reasons of intra-household dynamics,
prevented from even receiving the messages. Moreover, a 30-min advance water
notification was actionable in Hubli-Dharwad, but in Bangalore—a larger city with
traffic congestion—household members may have needed longer to reach home
before their water was turned on. This longer interval between notification and water
services was difficult to achieve with NextDrop’s valveman-based system. It seems,
therefore, that in this new context, the end users’ needs could not be met.
All of these lessons ultimately point to the importance of not just understanding
the technology that one designs but also the human ecosystem in which it is
deployed and used. Kumpel believes that, in order to understand the human
ecosystem, designers must know the context personally. She says, “You have
to move there! There is no way NextDrop would have gotten off the ground
without moving there.” Reflecting on the NextDrop experience, Sridharan added
another important point: “A lot of tech startup manuals and guides are based on
companies that are based in Silicon Valley [USA], but the constraints faced by the
484
C. Hyun et al.
customers and employees of places like PayPal and Dropbox are very different from
those we saw.” Understanding the diverse aspirations, constraints, and priorities
of key stakeholders is fundamental to the success (or failure) of technology-based
innovations designed to solve large-scale development challenges.
Discussion Questions
1. What types of information might have been helpful for NextDrop to collect prior
to rolling out their services in Hubli-Dharwad? In the megacity of Bangalore?
How would you design a process for collecting information over time as the
company grew and developed?
2. How would you design a preliminary needs assessment to understand (a) whether
women would have access to NextDrop notifications and (b) whether they really
needed it? What information would you consider collecting (e.g., how women
spend their time, their water use, how regularly they leave their home, and
what you would want to know about these trips)? Consider why each type of
information may or may not be useful.
3. How would you design an information collection process to learn about how
women used (or might use) the innovation? Why might simply surveying women
not be effective here?
4. What type of data collection and ongoing monitoring could NextDrop have
performed to better understand the valvemen that were so critical to their
system? What sort of information could they have collected on a continual
basis about “compliance,” and how could they have analyzed these data? What
sorts of meetings with and/or programs for the valvemen might have improved
valvemen’s performance or led NextDrop to reconsider the way it worked with
them?
5. How can we guide development engineering toward thinking about human
systems first, allowing the technological interventions and/or designs to follow?
How does NextDrop’s experience illustrate the distinction between systems and
interventions?
References
Hyun, C., Post, A. E., & Ray, I. (2018). Frontline worker compliance with transparency reforms:
Barriers posed by family and financial responsibilities. Governance, 31(1), 65–83.
Imbens, G. W. (2011). Experimental design for unit and cluster randomized trials. International
Initiative for Impact Evaluation Paper.
Kaminsky, J., & Kumpel, E. (2018). Dry pipes: Associations between utility performance and
intermittent piped water supply in low and middle income countries. Water, 10(8), 1032.
Kumar, T., Post, A. E., & Ray, I. (2018). Flows, leaks and blockages in informational interventions:
A field experimental study of Bangalore’s water sector. World Development, 106, 149–160.
Kumar, T., Post, A. E., Otsuka, M., Pardo-Bosch, F., & Ray, I. (2022). From public service access
to service quality: The distributive politics of piped water in Bangalore. World Development,
151, 105736.
17 Engineering Predictable Water Supply: The Humans Behind the Tech
485
Kumpel, E., Sridharan, A., Kote, T., Olmos, A., & Parikh, T. S. (2012). NextDrop: Using human
observations to track water distribution. In NSDR.
Maynard-Moody, S., & Musheno, M. (2000). State agent or citizen agent: Two narratives of
discretion. Journal of Public Administration Research and Theory, 10(2), 329–358.
Maynard-Moody, S., & Musheno, M. (2012). Social equities and inequities in practice: Street-level
workers as agents and pragmatists. Public Administration Review, 72(1), 16–23.
McKenzie, D., & Ray, I. (2009). Urban water supply in India: Status, reform options and possible
lessons. Water Policy, 11(4), 442–460.
Ray, I., Billava, N., Burt, Z., Colford, J. M., Jr., Ercümen, A., Jayaramu, K. P., Kumpel, E.,
Nayak, N., Nelson, K. L., & Woelfle-Erskine, C. (2018). From intermittent to continuous water
supply: A household-level evaluation of water system reforms in Hubli–Dharwad. Economic
and Political Weekly, 58.
Roessler, P., Carroll, P., Myamba, F., Jahari, C., Kilama, B., Nielsen, D. L. (2020). The economic
impact of mobile phones on low-income households. Working Paper.
Tummers, L. L., Bekkers, V., Vink, E., & Musheno, M. (2015). Coping during public service
delivery: A conceptualization and systematic review of the literature. Journal of Public
Administration Research and Theory, 25(4), 1099–1126.
Open Access This chapter is licensed under the terms of the Creative Commons Attribution 4.0
International License (http://creativecommons.org/licenses/by/4.0/), which permits use, sharing,
adaptation, distribution and reproduction in any medium or format, as long as you give appropriate
credit to the original author(s) and the source, provide a link to the Creative Commons license and
indicate if changes were made.
The images or other third party material in this chapter are included in the chapter’s Creative
Commons license, unless indicated otherwise in a credit line to the material. If material is not
included in the chapter’s Creative Commons license and your intended use is not permitted by
statutory regulation or exceeds the permitted use, you will need to obtain permission directly from
the copyright holder.
Part V
Digital Governance
Arman Rezaee
Introduction
Governments are pivotal to economic development. But the capacity of governments
to support economic development varies widely both across and within countries,
especially in the case of the low- and middle-income countries (LMICs) that
development engineers focus on. As an example, the World Bank’s Worldwide
Governance Indicators project ranks low-income countries as having an average
percentile rank of 17.3 for government effectiveness as opposed to 87.9 for OECD
countries (Dal Bo et al., 2017). It is no surprise, then, that some development
engineers focus their attention specifically on improving government capacity.
While, at the end of the day, governments in developing countries face a set of
problems to which the Development Engineering toolkit can be applied just like any
other problem, there are some specific distinctions between governments and private
or non-governmental actors. Dal Bo et al. (2017) summarize five key differences.
First, governments operate at a longer time horizon than most others. Second, they
are limited in what types of contracts they can write for their employees. Elections
create very different incentives for politicians than those of a CEO, for example.
Third, governments often heavily subsidize the goods and services that they provide,
like education and healthcare, making it harder for market forces to ensure proper
incentives for workers. Fourth, government careers differ from others in terms of
the mission of the organization. Many go into government not to make money but to
“make a difference.” And fifth, governments often have more checks and balances
built into their organization than private firms or NGOs.
The three cases in this chapter involve leveraging digital technology to improve
government performance by tackling head-on these unique properties of governments. The first case is about attempts in Afghanistan, Uganda, Kenya, and South
A. Rezaee
Department of Economics, University of California, Davis, Davis, CA, USA
e-mail: abrezaee@ucdavis.edu
488
V Digital Governance
Africa to use technology, starting with a simple camera, to introduce greater checks
and balances into elections themselves, or to ensure the incentives of those elected
are to represent their populace. This case relies on working within the realities of
electoral systems. The second case is about how ICT allowed for the collection of
accurate and actionable data to improve the incentives for government healthcare
workers to show up to work in Punjab, Pakistan. This case relies on understanding
the existing post-colonial Pakistani bureaucracy and how it led to information
bottlenecks. The third case is about two large-scale bio-authentication programs
in India designed to increase the efficiency of massive public benefit schemes.
Among many other things, this case relies on understanding the trade-offs between
decreasing corruption by government officials and potentially stopping legitimate
transactions from occurring.
Despite these differences, all three of these cases were selected because they
embody the Development Engineering design process. In all three cases, authors
and their collaborators developed an innovative, technology-based solution aimed
at government capacity. In all three cases, iterative implementation was key to the
solution’s success. In all three cases, this success was measured through rigorous,
researcher-led evaluation. And, in all three cases, the solution has been adapted to
program or policies affecting hundreds of millions of the world’s poorest citizens.
At the end of the day, all three of these cases can be thought of as being about
increasing government transparency. In the first case, it is about private citizens
holding their government accountable from the outside. In the second and third
cases, it is about academics and NGOs working within government to increase
accountability. Government accountability has become a centerpoint in the push
for economic development in the last two decades, beginning most notably with the
2004 World Development Report, Making Services Work for Poor People (Ahmad
et al., 2003). This report summarizes the impetus for this chapter:
Learning from success and understanding the sources of failure, this year’s World Development Report, argues that services can be improved by putting poor people at the center of
service provision. How? By enabling the poor to monitor and discipline service providers,
by amplifying their voice in policymaking, and by strengthening the incentives for providers
to serve the poor.
References
Dal Bó, E., Finan, F., Folke, O., Persson, T., & Rickne, J. (2017). Who becomes a
politician? The Quarterly Journal of Economics, 132(4), 1877–1914.
World Bank. (2003). World development report 2004: Making services work for
poor people (No. 26895, pp. 1–356). The World Bank.
Chapter 18
Protecting Electoral Integrity
in Emerging Democracies
James D. Long
1 Development Challenge
Inclusive political institutions are associated with improved service delivery (Bueno
de Mesquita et al., 2002), reduced corruption (Kolstad & Wiig, 2016), and positive
economic growth (Acemoglu et al., 2001). Two explanations for these patterns
are that democratic governance reinforces political accountability by rewarding or
punishing government performance (Barro, 1973), and by articulating the policy
demands of the electorate (Manin et al., 1999). Accordingly, competitive elections
represent a promising benchmark to guarantee government responsiveness and
communicate clear mandates. A country’s elections depend on robust participation
and outcomes that reflect the will of the people to promote good governance and
rule of law as a road to economic development.
But elections can only serve constructive purposes when conducted transparently
with fair outcomes. While the holding of multiparty elections has become common
across much of the developing world over the last 30 years, many emerging
democracies still lack credible electoral institutions and processes. Problems include
restrictions to party competition, voter suppression, and blatant fraud.1 Stories
1 From
1980 to 2010, upward of 70% of all developing country elections registered reports by
independent observers of significant problems (Kelley, 2012). The inability of countries to manage
elections properly has resulted in global “democratic backsliding” since 2010 (Hyde, 2020).
According to Freedom House in 2020, while 115 of 190 (60%) countries qualify as “electoral
democracies” (coded as having mostly free and fair elections) and elections technically occur in all
but 2 sub-Saharan African countries, only 31% of African countries were rated as having electoral
democracy.
J. D. Long ()
University of Washington, Seattle, WA, USA
e-mail: jdlong@uw.edu
© The Author(s) 2023
T. Madon et al. (eds.), Introduction to Development Engineering,
https://doi.org/10.1007/978-3-030-86065-3_18
489
490
J. D. Long
abound documenting electoral manipulation in contests ranging from Afghanistan
to Venezuela. There are many reasons such cheating persists. First, many election
commissions – the managerial body tasked with electoral management – frequently
lack the internal capacity and appropriate technology to oversee election day operations and obtain reliable ballot counts. Election infrastructure is also vulnerable to
“hacking” of various sorts. Second, politicians often exploit weak legal safeguards
to corrupt elections in illicit ways, from vote buying to rigging vote tallies. For
their part, citizens often face political exclusion arising from numerous institutional and socio-demographic barriers that limit healthy electoral participation.
The growing weaponization of election-related content on digital media further
degrades voter mobilization, and a lack of quality elections increasingly undermines
citizens’ engagement (Norris, 2014). All told, while many developing countries have
transitioned to democracy, problems with electoral integrity threaten democratic
consolidation. The more governments reflect a corrupted vote process, the less likely
its leaders are to pursue the reforms necessary for development.
This case study recounts attempts to confront threats to electoral integrity in
emerging democracies. The set of actors critical to the story include electoral commissions, politicians, and citizens along with international organizations, academic
researchers, and global publics. While the specific manner in which these groups
work to protect or erode democracy forms a central narrative of a country’s political
cycles – including an array of public and hidden actions – elections are also shaped
by a set of intuitive and fairly generalizable plot points derived from the political
economy and behavioral dimensions of how some of these actors organize and
respond to fraud. Not all electoral actors are corrupt, but enough of them are enough
of the time that the quality of democratization over the past few decades falls short
of democratic ideals and the public’s aspirations in many countries. Within the
governance sector, election administration is perhaps unique in requiring some of
the most urgent, yet simple, fixes to existing systems. As I describe, these fixes do
not require radical technological shifts as much as important shifts in theoretical
orientation and reforms to programming.
My personal interest in the topic of election security arose from dissatisfaction
with the status quo – of which I found myself a close observer and participant. In
2007, while collecting data on electoral integrity in Kenya for my PhD research, I
uncovered fraud firsthand (Gibson & Long, 2009). Rigging claims in that election
resulted in sustained post-election violence – upward of 2,000 deaths and 700,000
internally displaced people – and the collapse of a rapidly growing economy
(Kanyinga & Long, 2012). Witnessing these events inspired me to study electoral
corruption and work with organizations in the governance sector to combat it.
The international community has spent billions of dollars a year over the last
three decades in democracy assistance to shore up elections in developing countries.
Donor efforts target institutional strengthening through technical assistance to
election administrative bodies to ensure accuracy in voting procedures and the
deployment of non-partisan observers to oversee electoral processes and outcomes
(Bjornlund, 2004). Third-party monitoring of elections should enhance election
quality since independent oversight can provide important tools for improving
18 Protecting Electoral Integrity in Emerging Democracies
491
the performance of election bodies (Hyde, 2011). Motivated to contribute positively to these activities, I joined a US Agency for International Development
(USAID)-funded mission to support Democracy International’s (DI) observation
of Afghanistan’s 2009 elections. Our team of advisors and monitors visited polling
stations on election day, tracked the results, and lent other technical support. But
in a manner eerily similar to what I saw in Kenya regarding problems in the
tallying and certification of votes, failures of election management and producing
accurate counts led to a contested outcome. Vote totals had been improperly
aggregated, likely manipulated, and the election commission lacked the proper
infrastructure to protect and certify results. Not from a lack of will and despite our
presence, international observers could neither guarantee a fair process nor provide
the requisite support to improve the election’s management. Rather, like many
observation missions, we were ill-equipped to anticipate and then action assistance
necessary that would have better protected the vote count process.
I quickly learned that these experiences in Kenya and Afghanistan were not
unique. Despite the near-universal independent observation of elections in developing countries over the past 30 years, electoral fraud abounds, and the presence of
foreign democracy assistance is actually more likely to be associated either with a
null or negative impact on election quality than a positive one (Kelley, 2012). I came
to realize that the existing model of observation may not always work because the
methods employed by these groups have not always taken into account changes in
or threats to the electoral environment, evolving methods of hacking, or the strategic
response by election workers and politicians to observation. Such missions also do
not consistently monitor or audit the results transmission and lack reliable measures
of fraudulent activity. These missions also tend to lack comprehensive coverage of
polling stations, an important constraint we faced in Afghanistan where the security
required for international observers becomes cost prohibitive beyond a handful of
stations.2 While the commitment to improve elections through donor aid remains,
these limitations pointed to the need to re-examine aspects of democracy assistance.
But after returning from Afghanistan in 2009, I saw that the lessons learned and
technical fixes were not yet being implemented ahead of the country’s upcoming
parliamentary elections slated for 2010.
To address these gaps, I teamed up with a fellow graduate school colleague,
Mike Callen, who had also been working in Afghanistan and examining fraudulent
vote patterns from 2009. Looking at the evidence from Kenya and Afghanistan
regarding changes to vote totals and the failure of other monitoring modalities,
we did not see an obvious solution in existence to enhance the credibility of
the count. Any improvement would need to confront core aspects of electoral
management and the vote aggregation process, including the poor performance of
2 The largest international mission in Afghanistan in 2010 spent about $10 million USD and visited
85 stations due to security concerns (Callen & Long, 2015). While many missions do not report
budgets, the European Union says it spends on average $4 million USD per observation mission
(European Union, 2006). As calculated in Callen et al. (2016) and applied to the 643 stations the
EU observed in Uganda in 2011, this costs on average $6,220 per station.
492
J. D. Long
administrative bodies to conduct counts properly and outside political influence to
corruptly change vote totals. No matter what solution we developed, we would be
constrained by costs and security that would prevent anything like full monitoring
of all activities at all polling stations. One way around this could be to leverage the
evolving nature of advances in information and communications technology (ICT)
in developing countries. ICT holds potential to better mobilize users – like election
observers or citizens – to overcome barriers to participation in public acts and lowcost monitoring of bureaucratic performance, and to collect diffuse information
regarding government service delivery. Curiously, prior election observation had
often ignored these positive uses of ICT and instead focused technologies in
expensive and complex ways without measurable improvements. Our aim then was
to harness the reality of Afghanistan’s institutional context, understand the (often
hidden) threats to election integrity, and incorporate ICT adoption of low-cost forms
of monitoring to inspire new ways to overcome the programmatic and technical
challenges of previous approaches.
The innovation we developed – “photo quick count” – is a low-cost, ICTcapable, independently managed platform of audited election results performed by
citizen monitors that provides polling station level photographic records of tally
sheets to compare alongside scanned and certified results from a country’s election
commission. By obtaining original records of vote results on tallies, the audit detects
procedural failures by election officials and aggregation fraud (rigging that occurs in
results transmission as observed in Kenya and Afghanistan), including from officials
directly changing tally results forms and computer hacking into results transmission
systems. Photo quick count also has the ability to deter these administrative
problems and corruption by announcing the audit to officials at polling stations. The
inception and innovation for photo quick count was supported by DI and USAID’s
Development Innovation Venture (DIV) grant of phased funding.
Thus far, photo quick count has been conducted by a group of in-country
deputized professional citizen monitors that have been activated, managed, and
trained by our research team and deployed for project purposes in Afghanistan,
Uganda, and Kenya. Recently, we pivoted to broadening adoption and functionality
using crowdsourced election monitoring in South Africa with “VIP:Voice,” a
bespoke ICT platform that recruits dispersed users entirely through ICT channels
with no pre-existing infrastructure or direct engagement by our team (other than via
the platform). Available across user devices, VIP:Voice allows any citizen to access
election-related content and obtains volunteers who agree to report on polling station
activities and perform photo quick count.
Through rigorous evaluations, photo quick count and VIP:Voice have documented reductions in aggregation fraud and improvements to a variety of methods of
citizen participation to improve electoral integrity. They further scientific knowledge
and the evidence base on instruments for policy guidance on the mechanisms
and cost-effective tools to bolster institutional performance and elections at scale.
But many of the problems recounted here also plague the election security of
many industrialized democracies, including the United States, who are increasingly
incapable of managing and securing their own vote counts and lack consistent and
18 Protecting Electoral Integrity in Emerging Democracies
493
credible audits. The knowledge transfer often promoted by research and policy
communities from developed countries to developing countries has a different
directionality in this instance, with vital contributions that developing countries are
providing to protect electoral integrity on a global scale.
2 Implementation Context
Combating election fraud must confront manifold contextual, technical, and implementation challenges. Although every country presents its own unique constraints
to fair elections, our innovation grew out of both how we understood these problems
comparatively and attempts to overcome them within each case.
A first challenge is perhaps the most obvious: politicians lacking enough virtue
to uphold clean races regardless of the outcome confront the temptation to cheat
if doing so helps them win and they are unlikely to get caught or face sanction.
Because developing countries are more likely to face fewer safeguards to protect
rule of law compared to industrialized democracies, fraud is more likely in emerging
democracies. Yet the possibility of corruption must be weighed against the activities
of citizens, civil society, and donors working to fight it. Governance is therefore
one of the most sensitive development sectors to work in and requires balancing a
number of conflicting political interests of those running for office and voting in
elections with the administrative duties of delivering a free and fair process.
A second obstacle involves the countries themselves, where levels of state
capacity and the nature of political competition hold the potential to shape election
quality in fundamental ways. Holding an election is never easy, and in fragile states
with low bureaucratic capacity like Afghanistan, it is administratively difficult,
financially burdensome, and dangerous.3 Taliban insurgents frequently disrupted
Afghan elections (Condra et al., 2019); even higher capacity states like Uganda
and Kenya still often suffer perennial swells in violence during campaigns. These
fragile and middling states contrast with countries like South Africa, which enjoy
strong bureaucratic capabilities and less fraud but still have room to improve election
management. The nature of political competition is also an important contextual
variable; party systems and electoral rules influence how candidates gain office and
subsequently patterns of likely corruption.4
3 Condra et al. (2018) document that Afghan elections cost the government about $210 million
USD per round (not including security costs), most of the funds coming from donors.
4 As discussed in Callen and Long (2015), Afghanistan’s 2010 parliamentary election had
thousands of candidates running for hundreds of seats with a single non-transferable vote (SNTV)
across 34 provinces; fraud is therefore relatively decentralized without party linkages to predict
ex ante and large returns to fraud for numerous candidates. But in dominant party systems like
Mexico under the PRI (Magaloni, 2006) or competitive party systems where parties enjoy strong
“vote bank” areas like Ghana (Ferree & Long, 2016), corruption is likely to be either centralized
nationally and controlled by one party, or localized to areas of strong party support.
494
J. D. Long
Polling Station
District Center
Polling Official --
District Manager --
Responsible for posting
tally at station and sending
copy to District
Responsible for receiving all
tallies from all stations in
district and sending copy to
headquarters
Election Commission
Headquarters
Commissioners -Responsible
for receiving all tallies from all
district centers, and certifying
and announcing results
Fig. 18.1 Bureaucratic organization and process of aggregation of vote totals within an election
commissions. (Adapted from Callen & Long, 2015)
A third set of challenges recognizes that elections are just unavoidably difficult
to manage. To understand why, it is helpful to embed the political economy and
behavioral dimensions of election fraud within an institutional analysis of election
management to define the set of relevant actors and their roles managing elections in
developing countries. This helps delineate and focus on dimensions for corruption,
and from that, improvement. One helpful aspect of implementation context is that
many countries in the developing world run their elections in very similar ways
that follow analogous, if not the same, procedures. For demonstration purposes, I
will adopt a uniform nomenclature to describe relevant electoral institutions and
processes here, even though many words and concepts differ slightly depending on
the case.
Election commissions are bureaucratic agencies mandated with delivering a
credible election. They are responsible for registering voters, hiring and overseeing
poll workers, managing voting processes, tabulating results, and certifying winners.
Refined over the last three decades, developing countries often share the same
or similar procedures for ensuring ballot secrecy, protecting ballot boxes, and
transmitting results tallies. To run an election, election administrators are embedded
within a standard bureaucratic chain of delegation. Starting from the most local
unit in Fig. 18.1, at each polling station, what I term a polling official oversees
voting and compliance with procedures opening the polling station, during the vote,
and tabulating results. That official has a district manager in charge of running
the election process at administrative units higher than the polling station (e.g.,
constituency or province), who oversees and monitors all of the officials and
polling stations in their area. This includes receiving the election results that are
sent by officials from individual polling stations to be aggregated and organized
at the district level by the manager. At the national level, district managers are
overseen by election commissioners, who run the nationwide electoral process from
the agency’s headquarters and oversee all managers and officials. Commissioners
declare a winner after a final vote tabulation, but election workers at every stage are
important to bring the process to conclusion.
An election commission is a necessary body for running an election, but its mere
existence is not sufficient for protecting electoral integrity because commissions
face many of the institutional pathologies of public sector governance in developing
countries (Olken & Pande, 2011). Within the chain of delegation, three problems
18 Protecting Electoral Integrity in Emerging Democracies
495
arise that threaten the ability of the commission to secure proper administrative
procedures and without undue political interference. First, commissioners and
managers face difficulty in the hiring process of polling station officials. These
officials are not permanent workers with long-term contracts or incentives for
performance pay; rather they are temporary laborers who are hired for a very short
period (the election). Officials receive only minimum training, are provided wages
that typically do not offset any wages they obtain from permanent employment, and
while officials must demonstrate literacy and numeracy, such requirements are hard
to enforce and heterogeneous across contexts.5 Performance pay could theoretically
help improve the quality of the labor pool but is prohibitively costly, does not
address underlying problems of training, and would need to outweigh the amount
an official could receive in a bribe.
Second, managers and commissioners lack reliable procedures and technology
to oversee their agents. With a national exercise like an election occurring in a
truncated period, managers are often not able to properly monitor the conduct of
officials at individual polling stations or keep close watch on the vote tally and
aggregation process.6 Commissioners are unlikely to be in a position to action every
reported problem from managers across districts on a single day. While standardized
chain-of-custody practices of protecting the transmission of tallies in the results
process exist on paper, they are not properly enforced in many countries, particularly
at levels of the aggregation process beyond the polling station (e.g., district and
national levels in Fig. 18.1). This occurs for a number of reasons. Officials
frequently find it difficult to adjudicate discrepancies and may not be incentivized
to report irregularities. Unfortunately, this structure provides opportunities to cheat,
including administrators artificially and illegally changing vote totals for candidates
directly on tally forms at district centers.7 As a result, managers may overturn results
from polling stations, change them, or fail to enact investigations into differences.
The national intake center at commission headquarters scans a carbon copy of the
tallies they receive, which should be the same as what is posted at the polling station
to publicize and certify results on their website. But these totals often fail to reflect
original totals, and candidates often seek to directly destroy evidence of the polling
center count (including its tally) to then manufacture an entirely new tally that they
insert into the chain of custody (Fig. 18.1).
5 South Africa requires at least 250,000 individual polling officials and managers to run the election
and tally votes over a week’s period every election. Kenya hires about 45,000 individual officials
and the equivalent of 230 district managers. In Afghanistan, where men and women voters cast
ballots in separate polling stations, the commission often finds it difficult to recruit female presiding
officers who meet numeracy and literacy requirements.
6 While South Africa has one of the best performing commissions in Africa, our observers
still noted tallies missing in nearly 60% of polling stations in clear violation of administrative
procedure.
7 For example, illegal changes to tally sheets in Kenya’s 2007 election are documented in a
comprehensive investigation by Kanyinga et al. (2010).
496
J. D. Long
Third, election commissions – which should remain non-partisan and independent of political influence – are weak and vulnerable to outside influence from
collusion by candidates with officials to rig in their favor, either on the transmission
of paper tallies or computer hacking into results systems from outside computer
networks.8 Collusion can involve direct bribe paying at the level of official, manager,
or commissioner; but the returns to bribing a manager or commissioner are much
higher given their control over the aggregation process.
A final set of challenges potentially involves actors who operate outside of the
election management delegation chain but nonetheless have and could work to
support electoral integrity. Civil society and the international community desire
fair results and lend diplomatic, financial, and technical assistance to elections. But
curiously, much of the technology advocated by these organizations has actually
made it harder to secure results transmission by overburdening officials with
unnecessary tasks that slow them down and are prone to error, while at the same
time failing to protect or integrating original ballots or tallies into stream-lined,
easy-to-audit, and difficult-to-hack ways.9 Moreover, to stop corruption at scale, an
election needs polling station monitoring beyond areas typically visited by these
organizations and in ways that actually catch cheating. Methods to recruit citizen
volunteers over ICT to report on polling stations and vote returns is one avenue
to increase coverage, but citizens face many institutional and personal constraints
to free and fair participation in elections. Even if people have technology readily
available, it does not mean that they are motivated or equipped to monitor actions
by bureaucratic actors embedded within election administrative bodies.
3 Innovate, Iterate, Evaluate, and Adapt
To combat threats to electoral integrity, our theory of change had to recognize the
industrial organization of fraud in emerging democracies’ elections as arising from
institutional and behavioral elements of the actors described above. Specifically,
we innovated a new way to detect and deter cheating with “photo quick count,”
which overcomes many of the bureaucratic pathologies of election commission by
8 In Kenya’s 2017 presidential election, forensic evidence revealed tampering of tally forms and
computer hacking into the results transmission system.
9 Afghanistan’s biometric voter identification system (supported by $20 million USD from the
international community) failed on election day in 2018 and did not protect the integrity of results
transmission. Kenya’s Integrated Electoral Management System (KIEMS), which reportedly costs
the government upward of $1 billion USD ($24 million USD donated by the United States),
was meant to upgrade and improve results sent over ICT for the 2017 election. The inability of
thousands of officials to properly transmit results due to user, network, and administrative error
over the system was apparent in real time as the commission was attempting to aggregate and
certify results electronically. They would eventually have to revert to original hard-copy tallies.
While the Supreme Court eventually nullified this election, the opposition boycotted the revote in
part given a lack of any upgrades to KIEMS and the results transmission system.
18 Protecting Electoral Integrity in Emerging Democracies
497
protecting against illicit actions that occur in the transmission of results along the
chain of bureaucratic delegation. Photo quick count also seeks to improve the role
that outside actors (including civil society, donors, and citizens) can play supporting
elections. The cycle of innovation, iteration, evaluation, and adaption followed from
pilot phasing in Afghanistan, to nationwide scaling in Uganda (2011) and Kenya
(2013), pivoting to ICT-recruited and widespread citizen adoption of photo quick
count with “VIP:Voice” in South Africa (2014).
3.1 Innovation
Photo quick count occurs in two phases, described here temporally. Phase 1
consists of a randomized announcement of an audit of polling station tallies. The
announcement occurs by the delivery of a letter from one of our deputized election
monitors given to the polling station official on election day during voting.10
The letter states that the official’s station has been randomly selected to have its
results audited, which will occur the next day when monitors return to the station
to photograph the tally that officials are required by law to post publicly at the
conclusion of the station’s vote count (typically the evening of the election). In
effect, the letter “reminds” officials that they are responsible for publicly posting
the tally and indicates that our monitor will photograph the tally to then compare
to the certified result published at the conclusion of the election. The letter explains
that this procedure helps to verify compliance with procedures at the polling station
(e.g., the official’s posting of the tally) and against the certified result (e.g., by the
commission), recording any discrepancies and differences. The letter asks officials
to sign acknowledging having received it. The monitor takes the signed copy and
leaves a copy with the official. Phase 2 occurs the next day when, as indicated
in the letter, monitors return to the same polling station to record whether the
tallies have been posted and photograph the ones that are present. This is the
technological component of the intervention, photo quick count, which records
whether procedures were followed in that tallies were posted, undamaged, and
not removed after posting and, if properly posted, whether a polling center’s tally
matches the final and certified count.
The announcement of monitoring via the letter delivery and verification with
photo quick count functions similar to other audits with measurement tools to detect
irregularities, and in this context, to encourage compliance with electoral procedures
as proscribed by countries’ laws to guard against aggregation cheating (conducted
by an outside actor to the delegation chain). This is because of how the tally itself
functions in the results transmission process (Fig. 18.1). Importantly, all of the
10 These monitors are in-country citizens recruited and managed by our team. They received the
equivalent of 2 days of paid work for Phases 1 and 2 and attended one training session. They were
not previously part of an election monitoring organization.
498
J. D. Long
Fig. 18.2 Afghan voters examining a tally form posted at a polling station. (Berman et al., 2019)
countries in our studies require posting of tallies by officials – failure to do so is an
abrogation of responsibilities, and not posting is a bureaucratic failure of managers
to not properly oversee officials. If the tally is posted, photographed, and the same
as the scanned and certified tally published by the commission (made available on
their website for public viewing), the audit verifies that no changes were made in
the aggregation process by managers, commissioners, or other political actors. As
designed, these original tallies are supposed to provide checks on certified results
since the latter are carbon copies of the former that were originally filled at each
station with identical copies sent along the delegation chain to managers at the
district level and then commissioners at the national level (Fig. 18.1). Electoral laws
mandate that the results of the original tally be posted in a public and conspicuous
place since they are the only official means by which an individual can see how their
precinct votes (and citizens are legally allowed to view and photograph them (Fig.
18.2)). It is typical that many citizens and political agents from local communities
examine tallies since they plausibly send a signal to those communities about the
fairness of the election at that station. However, failure to post tallies, stealing or
damaging of tallies, or inconsistencies in results between the original tallies and
copies scanned by the commission reflect at best administrative failures and at worse
the possible intention to manipulate the vote count process.11
11 Berman
et al. (2019) report that thousands of complaints received by the Afghan Electoral
Complaints Commission demonstrate that tallies were often stolen by political agents in order
to take tallies to a secret location or another part of the aggregation chain (e.g., provincial election
centers) to falsify results and reinsert tallies back into the count.
18 Protecting Electoral Integrity in Emerging Democracies
499
Counterfactuals
From our theory of change and photo quick count’s tally fraud detection, we
hypothesized that the announcement of monitoring of stations receiving the
letter in Phase 1 would be more likely to improve their procedures and result
in fewer tally discrepancies, compared to a station that did not receive a letter.
To evaluate this possibility against a counterfactual, we selected a sample of
audit-eligible stations. In Phase 1, we randomized the delivery of the letter in
treatment stations with control stations receiving no letter. In Phase 2, for both
treatment and control stations, our researchers followed the same protocols to
conduct photo quick counts. The evaluation compares these results to estimate
the effect of the announcement via letter delivery.
To understand how the two phases work concretely, I describe the first deployment in Afghanistan’s 2010 parliamentary elections (Callen & Long, 2015). We
created an experimental sample of 471 polling centers (about 7.8% of the total) that
we determined were audit-eligible and could be visited by our team.12 Of the 471
centers, we randomly selected 238 to receive the letter on election day (Phase 1)
delivered by a team of Afghan monitors that we hired and trained; the remaining
stations received no letter. The next day (Phase 2), our monitors returned to the
stations that had received a letter on election day and the stations in the sample
without a letter to perform photo quick count the morning after the election at which
point officials should have posted tallies. They photographed tallies with digital
cameras purchased by us for the project, which were not capable to transmit data
in real time but could save images on removable memory chips. (While our initial
hope was to crowd-seed smartphone devices to our monitors, we lacked the budget,
time, and programming capability in the project period.) If tallies were not posted or
there was evidence they had been torn down, monitors investigated as to why and by
whom (without interacting with any polling officials) and recorded that information.
Photo quick count documents numerous suspicious activities regarding tally
postings by our monitors. Figure 18.3 shows a comparison taken by our monitors at
a polling station (left-hand panel) and the scan of that polling station’s tally received
and published by the election commission in Kabul (right-hand panel) scraped from
their website. These should be carbon copies and thus otherwise identical, but they
differ in obvious ways. Someone has converted an original Dari script from the
polling station into Arabic numerals scanned at the commission, the polling station
official’s name has changed, and the station tally records vote totals for several
candidates that are entirely deleted from the commissions’ tally. To see how these
differences operated over the whole sample, Table 18.1 records levels and types of
differences between tallies. Importantly, tallies were damaged or removed at 62 of
12 The sample was limited to precincts within provincial capital cities due to safety, administrative,
and cost limitations.
500
J. D. Long
Fig. 18.3 Tally forms from the same polling station in Afghanistan (Callen & Long, 2015); lefthand panel shows photograph posted at station and right-hand panel shows scan at the election
commission
Table 18.1 Patterns of discrepancies in tally aggregation process between photographed tallies
at polling stations via photo quick count (sample of 346 stations) and commission tallies in
Afghanistan
Pattern of discrepancies
None
Adding votes (only)
Subtracting votes (only)
Adding and subtracting (equally)
Adding more than subtracting
Subtracting more than adding
Number of polling stations
74
70
15
15
127
45
Share of sample
21.4%
20.2%
4.3%
4.3%
36.7%
13%
Adapted from Callen and Long (2015)
the sampled polling stations (13%), preventing any direct comparisons. But for the
tallies observed in the remaining 346 stations, Table 18.1 shows that while there
are no discrepancies recorded in 21%, the remaining stations had differences of
addition, subtraction, or both.
Table 18.1 indicates that one limitation we confronted with photo quick count
is that many times the tallies were not posted or torn down at polling stations.
This generated a lack of consistent measurement across the entire sample regarding
candidate’s originally posted vote totals to compare against their certified vote
totals.13 Our intervention and evaluation in Afghanistan and subsequent countries
13 We address treatment-related attrition for experimental estimates in Callen and Long (2015) and
Callen et al. (2016).
18 Protecting Electoral Integrity in Emerging Democracies
501
therefore make use of other administrative data that further reveal measurement
of likely administrative violations and fraud. Because commissions still publicize
both scanned copies of tallies at the national center and separately certified data
on polling station level results for each candidate on their website (even if tallies
are not posted at stations), we obtain copies of commissions’ scanned tallies
and published results. We then employ election forensics, which uses statistical
analyses of observed vote distributions to detect dubious or systematic irregularities
indicative of fraud that deviate from theoretical distributions that accord with a
fair vote (Mebane, 2008; Myagkov et al., 2009). Because we believed the audit
announcement might differentially impact candidates based on their linkages to
election administrators and therefore their ability to collude to change vote totals,
we also used qualitative data on candidates’ backgrounds that identifies likely
patterns of political linkages between politicians and election administrators.14 The
combination of these data and tests with photo quick count helps measure the full
impact of the intervention.
In a first set of results from Afghanistan, comparing the treatment sample relative
to the control, the letter delivery positively improved measures directly observed
by photo quick count and other administrative data sources. The letter delivery
decreased the theft of tallies by 60 percent (from 18.9% to 8.1%) and reduced
discrepancies in vote totals between photographed tallies and those certified by the
electoral commission.15 The letter delivery had the largest reduction on votes for
candidates who gained the most votes at individual polling stations (from about 21–
15 ballots, or a 25% drop).
3.2 Iterative Implementation
Aspects of the operational, political, and technical environment of Afghanistan
influenced iterative implementation of photo quick count in Uganda and Kenya.
First, we wanted to deploy photo quick count but to do so at scale in a nationwide
and nationally representative sample of polling stations, which we had lacked in
Afghanistan. Laterally, this scaling had to be cost-effective, so we considered ways
to leverage photo capture with real-time data transmission over ICT using relatively
cheap smartphones. We also wanted to test the effectiveness of the intervention in
14 For Afghanistan, the main parliamentary candidates’ known connections with government
officials were recorded from ethnographic profiles produced by DI since there are no party
affiliations; in Uganda and Kenya, we relied on more straightforward relevant party, ethnic, and
regional linkages.
15 Given sample attrition per Table 18.1, we use a bounding exercise to estimate that this effect
was between about 9 and 17 fewer votes changed during aggregation for candidates with known
connections to the equivalent of the district manager.
502
J. D. Long
Fig. 18.4 Photo quick count smartphone application on Android for Uganda. (From Callen et al.,
2016)
different institutional environments with variation in political dynamics that likely
affect how political agents might influence bureaucratic functioning of commissions. While Afghanistan’s commission was decentralized and the parliamentary
elections featured no formal political parties, the institutional and political dynamics
in Uganda and Kenya were different (and more tractable to measure).
For Uganda’s 2011 election, we expanded polling station coverage to 1,002 in
a nationwide sample (representative by region; see Callen et al., 2016). While this
sample was more comprehensive of Uganda’s electoral and institutional landscape
than what we achieved in Afghanistan, it was also harder to access and manage,
particularly in remote areas. We tried to offset this by having our monitors
conduct photo quick count with an Android-enabled smartphone app developed
in partnership with Qualcomm that cost less than half the price of the digital
cameras in Afghanistan (Figure 18.4 displays the app interface). We had to crowdseed phones since many of our team did not yet have personal devices capable of
photo quick count. The political dynamics that affect institutional performance in
Uganda are different than Afghanistan. Rather than multiple sites of contact and
influence by dispersed candidates with no formal political linkages, the Ugandan
election commission is staffed from a single dominant political force, the National
Resistance Movement (NRM) and incumbent President Yoweri Museveni, who
gained office after winning a civil war in 1986 and has won multiparty elections
since 2006. Uganda therefore has a high degree of centralization of political
influence in the commission (at all levels) which was easier to predict ex ante but
18 Protecting Electoral Integrity in Emerging Democracies
503
could also differentially influence the effects of monitoring. With these dynamics
in mind, we worried that the simple announcement of monitoring would potentially
not operate as well in Uganda, so we developed a second version of the letter that
announced monitoring and included a message that reminded officials of the legally
proscribed penalties for violations of the country’s electoral law (Fig. 18.5).
The third deployment in Kenya in 2013 built on the features of Uganda, with a
truly nationally representative sample of 1,200 polling stations, an improved opensourced photo quick count app, and novel administrative data sources to look at
measurement strategies built into political context as detected by photo quick count,
including conducting a parallel exit poll of voters. Patterns of corruption in Kenya
are less centralized overall than Uganda given the lack of a dominant party. Instead,
two large and polarized political forces have dominated recent elections and are
backed in part by ethnic and regional coalitions that exert control in their “vote
bank” areas (Long, 2020), allowing localized and regional avenues of collusion with
managers; one of these coalitions reflecting the incumbent government is also strong
nationally with influence in the commission.
3.3 Evaluation
Similar to Afghanistan, we evaluated the randomized announcement of the tally
audit of the vote results via photo quick count. In Uganda, where we observe a lack
of posted tallies in about 78% of the entire sample, letter delivery decreased the
practice of not publicly posting tallies between about 6 and 11% points (depending
on specification and letter version) and also reduced discrepancies in vote totals
between photographed tallies and certified results for Museveni’s votes per station
from 8 to 16% (or 26–49 votes from an average of 307 per station). While
Uganda introduced a second version of the letter reminding of penalties, we found
no additional consistent effect of this letter compared to the announcement of
auditing itself. We also observed that the letter reduced the propensity for adjacent
digits (a forensic measure of fraud) by between 6 and 10% points in Museveni’s
votes. Although preliminary, early analysis from Kenya shows similar effects of
the announcement increasing the propensity of posted tallies and decreasing the
likelihood of suspicious vote totals and differences between tallies and commission
results.
In a second set of results, we document that the audit intervention seems to
affect political actors differently given how political dynamics map on to institutions
and likely rigging strategies. In general, the intervention appears to have the
largest impact on candidates most likely to rig, followed in different ways by
evidence of strategic re-adjustment (analogous to negative or positive spillovers). In
Afghanistan, the treatment effects were largest for candidates with known linkages
to election administrators (specifically, the equivalent of the district manager), but
we also found evidence of a chilling effect from letter delivery. Using geolocations
of polling stations in our sampled areas, polling stations that had a neighboring
504
J. D. Long
Fig. 18.5 Election day letter announcing photo quick count in Uganda. (From Callen et al., 2016)
18 Protecting Electoral Integrity in Emerging Democracies
505
station within 1 km treated with a letter also saw an additional loss of about seven
votes for the most politically connected candidates. In Uganda, letter delivery had
an impact on the polling station level results for Museveni, reducing his votes by
about three percentage points. However, we see evidence that in our sample, the
central election commission appears to have slightly added votes back in his favor
in monitored stations. In Kenya, rigging appears to occur at the behest of both
incumbent and opposition coalitions in their local and regional vote banks, but the
more powerful coalition closely connected with commissioners at the national level
had additional avenues for cheating and re-adjustment.
3.4 Adaption
Photo quick count produced scientific evidence on the use of randomized audits to
bolster institutional performance and improve electoral integrity by an independent
team of deputized citizen monitors that we trained and deployed. At the same
time, scaling was still linearly expensive and limited by the availability of ICT
that required crowd-seeding devices. Beyond organizational adoption, we had yet
to investigate the opportunities and constraints to widespread citizens’ participation
and their capacity for ICT-enabled monitoring. If we wanted adaption at scale,
we needed to pivot and re-orient our programmatic thinking and technological
ambitions.
Pivot
Pivoting to citizen-based crowdsourced monitoring required thinking through
some core components of photo quick count. Broad coverage of polling
station observations by voters obviates the need for a team of researchers
announcing monitoring via a letter, but many factors shape voters’ political participation and technology use in positive and negative ways. Many
crowdsourced platforms have encountered problems of uptake and usage in
development applications; barriers to action and ICT usage must therefore
inform the design and functionality of monitoring platforms.
To do so, I worked with colleagues to build a new multi-channel ICT and digital
media system for an entirely citizen-based election monitoring platform financed
through USAID Phase 2 funding. We designed the system, branded “VIP:Voice,”
and launched it in South Africa before its 2014 election in partnership with
developers at the Praekelt Foundation (Ferree et al., 2020). VIP:Voice allowed
citizens who registered with the system to engage with the electoral process by
reporting their opinions on politics, campaign activities in their area, and other
election-related matters in the lead up to polling day, including user reports on
506
J. D. Long
their election day experiences and monitoring of tallies. The platform was available
on a variety of ICT channels accessible by users of basic phones, feature and
smartphones, and web users. VIP:Voice differed from other interventions that
leverage predefined organizations or lists of users obtained from registration drives,
organizational memberships, or household surveys. Instead, it advertised on social
media channels and “please call me” text messages (Fig. 18.6).16 This design and
functionality therefore did not limit usage to any segment of society, and multichannel development eliminates the need to seed devices (they are able to rely on the
devices participants already possess). Through our recruitment over SMS and social
media, VIP:Voice was able to reach 50 million South African citizens, engaged
with 250,000, and registered more than 90,000. Half of registered users came in
through SMS “please call me” pushes on standard phone channels and half through
social media channels (particularly “Mxit,” which was South Africa’s most popular
social media channel at the time). From this, we also registered citizen volunteers
in 37% of the countries’ electoral wards from a set of identified highly engaged
users, hundreds of whom provided reports of polling station activities and hundreds
of photographed tallies.
Gender
Digital access is not equal across demographic groups in developing countries. In South Africa, older, female, rural, and Black citizens are all likely to
lack the web-enabled smartphones that other groups employ, but they are still
likely to own basic mobile phones. Because a goal of VIP:Voice was to obtain
a nationwide yield of users that included people from all backgrounds, we had
to explicitly consider how gender dynamics vary across ICT channels.
VIP:Voice featured mechanisms to evaluate the efficacy of different types of
engagement across the different channels and a series of randomized experimental
interventions on incentives and cost in the standard phone channel. Channels
that were easier to use (with social media apps) had higher rates of engagement
compared to text messages, but these user-friendly channels were more likely to see
more engagement attrition over time. Many users registered with VIP:Voice with no
external incentive offered, but small offers of incentives (free airtime or lotteries
advertised within “please call me” alerts) improved levels of engagement. In a
proof-of-concept experiment, from a list of about 42,000 highly engaged users, 17%
volunteered to observe elections (which was further improved by incentivization).
Actual photo quick count monitoring documents numerous problems of tallies
and differences in the commissions result, but these differences did not appear
16 Please call me messages are free-to-user alerts that people can send to a contact requesting a
(paid) call back – they are popular when individuals lack airtime credit to make direct calls and are
paid by advertising space embedded in the message.
18 Protecting Electoral Integrity in Emerging Democracies
Fig. 18.6 Advertising for VIP:Voice platform in South Africa. (From Ferree et al., 2020)
507
508
J. D. Long
to systematically benefit any particular party and instead may have resulted from
administrative failures.17 Although the salience of one important design consideration was not apparent at the time, VIP:Voice had the added benefit of providing
citizens with real news about the campaign and election results under the control of
researchers to guard against misinformation.
Responsible Research
Allowing citizens to serve the function of election monitor does nothing more
than allowing them to perform the same democracy-enhancing function as
voting by providing reports on polling stations. But does that guarantee that
all citizens are safe to monitor? This is a question that researchers must answer
depending on context and that individual users must answer for themselves.
We chose one of the safest election environments, South Africa, to build
VIP:Voice but any crowdsourced platform must rely on trusting its users to
know if and when it is too dangerous to report on government activity. And
boosting participation, even if sometimes risky, should be weighed against
the realities of corruption and inadequate service delivery that citizens in
developing countries face and must collectively organized to overcome.
VIP:Voice shows that citizens can be mobilized to take an active role in
protecting institutions in the public realm, even where they do not receive immediate
private benefits. But engaging and registering them over a digital platform to
engage in real-world activities is also beset with many recruitment, technical, and
programmatic challenges (Erlich et al., 2018).
4 Results/Lessons Learned
Photo quick count provides a competitive advantage to alternatives, such as
expensive international observation missions, given its effectiveness at detection
and deterrence of aggregation fraud and potential for citizen adoption. It also works
in most countries at less than 1% of the per polling station cost of international
missions. The lessons learned have provided important insights informing ongoing
work to translate previous project phases into improving the technical aspects
of VIP:Voice. We aim to further address participation barriers, recruitment, and
engagement at the same time as maintaining and growing the capacity for a
professionally managed photo quick count of tallies with enough coverage to
provide the minimum risk-limiting coverage.
17 We also conducted a parallel study on locally enabled ICT professional monitors using the
traditional photo quick count.
18 Protecting Electoral Integrity in Emerging Democracies
509
Results tie to numerous literatures and generalize to other contexts. They
contribute to studies on the political economy of public sector corruption, evaluations of democracy and governance programs in emerging democracies, studies of
election fraud, and connection to citizen-based ICT platforms in other development
sectors.18 While election commissions form only one critical institution within the
governance sector, there are common institutional challenges that apply broadly
across bureaucratic functioning and rule of law related to oversight and monitoring of frontline officials and managers, how political linkages and connections
outside of bureaucracies often undermine the performance of those bureaucracies,
and whether audits work to improve agency capacity and citizen monitoring of
government performance. Results offer guidance to organizations, activists, and
developers regarding the usability of platforms like VIP:Voice for elections in other
contexts where problems of participation, data quality and reporting, and electoral
integrity can be improved with ICT.
Capacity
An independently managed audit via photo quick count can help election
commissions improve their capacity and output where those commissions
lack strength. For example, if a commission had real-time exposure to the
information coming from audits, it could respond immediately or preserve
records to include in adjudication of disputes later. This possibility is likelier
in cases where commissioners continue to be blamed for disputed results or
where the commission is high performing already but wishes to use our tools
to manage the process better.
These positive aspects should be considered alongside numerous lessons learned
for policy, some of which reveal a new set of challenges and fruitful avenues
for research, technical development, and programming. First, adaption of photo
quick count by election commissions, civil society organizations, and donors can
help improve electoral integrity; but photo quick count only provides a check on
integrity when it itself is non-partisan and independent, or done in conjunction
with credible partners. If used in partnership with or by commissions directly, it
also requires institutional actors that are fair and forthright. Even though many
commissions lack capacity or are subject to influence, the growing precedent to
prosecute commissioners and managers (as in Afghanistan) or nullify elections
from poor management (as in Kenya in 2017 and Malawi in 2020) could change
the thinking on the need for audit, the modalities required to conduct one, and
18 Because many features of VIP:Voice were agnostic as to the particular use of those features,
we provide guidance on scaling to other sectors in international development where citizens’
interaction with government agencies could be improved with monitoring and data capture to
receive services, like health, education, agriculture, and financial inclusion.
510
J. D. Long
how to preserve evidence to its effect. Given the alarming rate at which electronic
systems are being hacked, photograph- and paper-based audit methods are growing
increasingly important to provide original copies of results.
International organizations and civil society groups are also plausibly well
placed to serve as third-party “monitors-of-monitors” to facilitate the use of
these tools given the other important advocacy work they are already doing to
support democracy programming and technical assistance to commissions. In our
experience, beyond DI, it has been hard to find dependable international and civil
society organizations to work with, which has revealed a number of second-order
challenges that involve diplomatic and political considerations for donors and nonpolitical interference for civil society. The fidelity of the design of photo quick count
and VIP:Voice would need to ensure that the technology itself is deployed robustly
and cannot itself be hacked, misused, or suppressed. Our fruitful partnership with
USAID provides hope that these organizations could still play an important role
funding or supporting independent applications of VIP:Voice as a component to
democracy assistance.
5 Summary
Our research contributes important evidence regarding Afghanistan, Uganda,
Kenya, and South Africa’s electoral processes, the political economy of governance
in election commissions in developing countries, and the viability of using photo
quick count and VIP:Voice to improve electoral integrity. Although institutional
pathologies of election administration persist, audits can work to improve
accountability and guard against threats to results transmission. VIP:Voice provides
important benefits to citizens both directly by engaging them in the election process
and monitoring of their elections, and indirectly by building confidence in the
credibility of the process. Because the posting and comparison of results via tallies
has important resonance for certifying the election, citizen monitoring plausibly
could occur in a large enough sample to provide something like a minimum
threshold, particularly alongside an independent manual audit. But recruitment
problems and rates of attrition from registration to monitoring with citizen platforms
also suggest that if a large number of users are desired, it takes more development
time and continued pushes across ICT channels. These technical challenges must be
considered in the design phase, and the time is ripe to action these issues. Citizens
have now spontaneously begun to employ version of photo quick count in recent
elections. In 2017, thousands of dispersed and unorganized Kenyans photographed
tallies and posted results to social media with a series of dedicated hashtags,
where comparisons often did not comport with the election commission’s certified
results. The Supreme Court then conducted its own audit of original paper tallies
and a review of the electronic results transmission, a process revealing so many
discrepancies that they nullified the election and declared a revote. The importance
18 Protecting Electoral Integrity in Emerging Democracies
511
of independent tally audits and citizen-based monitoring is only growing more
salient as the integrity of elections around the world faces new and evolving threats.
Discussion Questions
1. Under what conditions should government officials and bureaucratic agents be
involved in performance audits?
2. What are the most productive ways to galvanize donors, civil society, and citizens
to adopt new technologies to address needs in the governance sector?
3. How best might ICT improve citizens’ political participation and ability to
monitor government performance, at the same time as protecting respondent
privacy and data security?
References
Acemoglu, D., Johnson, S., & Robinson, J. A. (2001). The colonial origins of comparative
development: An empirical investigation. American Economic Review, 91(5), 1369–1401.
Barro, R. (1973). The control of politicians: An economic model. Public Choice, 19–42.
Berman, E., Callen, M., Gibson, C., Long, J. D., & Rezaee, A. (2019). Elections and government
legitimacy in Afghanistan. Journal of Economic Behavior & Organization, 168, 292–317.
Bjornlund, E. (2004). Beyond free and fair: Monitoring elections and building democracy.
Woodrow Wilson Center Press.
Bueno de Mesquita, B., Morrow, J., Siverson, R., & Smith, A. (2002). Political institutions, policy
choice and the survival of leaders. British Journal of Political Science, 32(4), 559–590.
Callen, M., & Long, J. D. (2015). Institutional corruption and election fraud: Evidence from a field
experiment in Afghanistan. American Economic Review, 105(1), 354–381.
Callen, M., Gibson, C. C., Jung, D. F., & Long, J. D. (2016). Improving electoral integrity with
information and communications technology. Journal of Experimental Political Science, 3(01),
4–17.
Condra, L. N., Long, J. D., Shaver, A. C., & Wright, A. L. (2018). The logic of insurgent electoral
violence. American Economic Review, 108(11), 3199–3231.
Condra, L. N., Callen, M., Iyengar, R. K., Long, J. D., & Shapiro, J. N. (2019). Damaging
democracy? Security provision and turnout in afghan elections. Economics and Politics, 31(2),
163–193.
Erlich, A., Jung, D. F., Long, J. D., & McIntosh, C. (2018). The double-edged sword of mobilizing
citizens via Mobile phone in developing countries. Journal of Development Engineering, 3,
34–46.
European Union. (2006). European Union: External action FAQ. www.eeas.europa.eu/. Accessed
4 Nov 2013.
Ferree, K., & Long, J. D. (2016). Gifts, threats, and perceptions of ballot secrecy in African
elections. African Affairs, 115(461), 621–645.
Ferree, K., Gibson, C., Jung, D., Long, J. D., & McIntosh, C. (2020). How technology shapes the
crowd: The 2014 south African election. Center for Effective Action Working Paper.
Gibson, C., & Long, J. D. (2009). The presidential and parliamentary elections in Kenya, December
2007. Electoral Studies, 28(3), 497–502.
Hyde, S. D. (2011). The pseudo-democrat’s dilemma: Why election observation became an
international norm. Cornell University Press.
Hyde, S. D. (2020). Democracy’s backsliding in the international environment. Science, 369(6508),
1191–1196.
512
J. D. Long
Kanyinga, K., & Long, J. D. (2012). The political economy of reforms in Kenya: The Post-2007
election violence and a new constitution. African Studies Review, 55(1), 31–51.
Kanyinga, K., Long, J. D., & Ndii, D. (2010). Was it rigged? A forensic analysis of vote
returns in Kenya’s 2007 election. In K. Kanyinga & D. Okello (Eds.), Tensions and reversals
in democratic transitions: The Kenya 2007 general elections (pp. 373–414). Society for
International Development and Institute for Development Studies.
Kelley, J. G. (2012). Monitoring democracy: When international election observation works, and
why it often fails. Princeton University Press.
Kolstad, I., & Wiig, A. (2016). Does democracy reduce corruption? Democratization, 23(7), 1198–
1215.
Long, J. D. (2020). Civil conflict, power-sharing, truth and reconciliation (2005–13). In N.
Cheeseman, K. Kanyinga, & G. Lynch (Eds.), The Oxford handbook of Kenyan politics (pp.
82–95). Oxford University Press.
Magaloni, B. (2006). Voting for autocracy: Hegemonic party survival and its demise in Mexico.
Cambridge University Press.
Manin, B., Przeworski, A., & Stokes, S. (1999). Elections and representation. In A. Przeworski,
S. C. Stokes, & B. Manin (Eds.), Democracy, accountability, and representation (pp. 29–54).
Cambridge University Press.
Mebane, W. R., Jr. (2008). Election forensics: The second-digit Benford’s law test and recent
American presidential elections. In R. M. Alvarez, T. E. Hall, & S. D. Hyde (Eds.), Election
fraud: Detecting and deterring electoral manipulation (pp. 162–181). Brookings.
Myagkov, M., Ordeshook, P. C., & Shakin, D. (2009). The forensics of election fraud: Russia and
Ukraine. Cambridge University Press.
Norris, P. (2014). Why electoral integrity matters. Cambridge University Press.
Olken, B., & Pande, R. (2011). Governance review paper, J-PAL Governance Initiative. MIT.
Open Access This chapter is licensed under the terms of the Creative Commons Attribution 4.0
International License (http://creativecommons.org/licenses/by/4.0/), which permits use, sharing,
adaptation, distribution and reproduction in any medium or format, as long as you give appropriate
credit to the original author(s) and the source, provide a link to the Creative Commons license and
indicate if changes were made.
The images or other third party material in this chapter are included in the chapter’s Creative
Commons license, unless indicated otherwise in a credit line to the material. If material is not
included in the chapter’s Creative Commons license and your intended use is not permitted by
statutory regulation or exceeds the permitted use, you will need to obtain permission directly from
the copyright holder.
Chapter 19
Monitoring the Monitors in Punjab,
Pakistan
Arman Rezaee
1 Development Problem
It is well documented that government frontline service providers such as teachers
and health workers are often absent from their posts in developing countries.
Chaudhury et al. (2006) conducted unannounced visits to primary schools and
primary health centers across six developing countries spanning three continents.
The authors found widespread absence, with rates averaging 19% for teachers
and 25% for health workers. The authors also found that lower-income areas had
higher absence rates, suggesting absence may exacerbate socioeconomic divides.
Many studies have since documented similar patterns (e.g., Banerjee & Duo, 2006;
Banerjee et al., 2008; Olken & Pande, 2012; Dhaliwal & Hanna, 2017; Finan et al.,
2017).
While the specific impacts of absenteeism on outcomes of the world’s poor are
less well documented, evidence suggests the potential for large negative impacts
from missing workers. For example, Duflo et al. (2012) leveraged cameras coupled
with financial incentives to boost teacher attendance in India. The authors found
that lower teacher absenteeism translated directly to increased student achievement.
Using a nationwide representative sample of public schools in rural India, Muralidharan et al. (2017) found that “investing in reducing teacher absence through better
monitoring could be over ten times more cost effective at reducing the effective
student teacher ratio (net of teacher absence) than investing in hiring more teachers.”
Based on research conducted by Michael Callen, Saad Gulzar, Ali Hasanain, Yasir Khan, and
Arman Rezaee
A. Rezaee ()
Department of Economics, University of California, Davis, CA, USA
e-mail: abrezaee@ucdavis.edu
© The Author(s) 2023
T. Madon et al. (eds.), Introduction to Development Engineering,
https://doi.org/10.1007/978-3-030-86065-3_19
513
514
A. Rezaee
These seminal studies, as well as anecdotes about absent frontline health workers
in Punjab, Pakistan, motivated this case study. Indeed, in November 2011, my
co-authors and I conducted surprise, independent inspections of a representative
sample of 850 of Punjab’s near 2500 provincial rural health clinics (dubbed Basic
Health Units (BHUs)). We found that government doctors posted to BHUs were
absent from their facility during open hours two-thirds of the time (Callen et al.,
forthcoming). This is particularly alarming as BHUs provide primary care for nearly
all of Punjab’s rural population, including outpatient care, pre- and postnatal care
and deliveries, and vaccinations.
Myriad factors contribute to the problem of absenteeism among frontline workers
in developing countries, including poor incentives to show up to work (Callen et al.,
2015; Dal Bó et al., 2013); political-economic factors such as patronage (Callen et
al., 2016), political alignment (Callen et al., 2020), and/or political turnover (Akhtari
et al., 2017); and poor management (Dal Bó et al., 2018; Rasul et al., 2018).
Another factor contributing to absenteeism is a lack of accurate and actionable
data. Before the ICT-based program that is the subject of this case study took shape
in late 2011, there was an elaborate, colonial-era, paper-based system for collecting
operational data on public health facilities in Punjab. This system was similar to
those still in existence across many developing country bureaucracies today. The
centerpoint of this system is the physical register—log books at each facility that
are used to keep diligent records on staff attendance, medicine stock, patients seen,
vaccinations given, etc. During their required monthly inspections of each BHU,
government health inspectors record aggregate information from these registers on
a standard paper form. Once collected, forms are brought to a central district facility,
manually entered into a spreadsheet, and aggregated into a monthly report for senior
health officials.
While the pre-existing system led to the collection of vast amounts of data, it ultimately was ineffective in the case of Punjab’s Health Department. Registers upon
registers were filled. But then they collected dust. According to our independent
inspections, only 23% of facilities received their required monthly health inspection
prior to November 2011, essentially halting the flow of information from registers
to health inspectors and their managers. And what little information did make its
way to a District Headquarter was often inaccurate, for the same political economy
reasons that allowed health worker absence in the first place (Callen et al., 2015).
This could be seen as a self-fulfilling prophecy—data is collected but isn’t used, so
there is no incentive to collect good data in the first place, so data isn’t good enough
to be used, and so on.
Enter ICT. In late 2011, 2G networks and smartphones had just made their
way to Punjab. Zubair Bhatti at the World Bank in Pakistan recognized this as an
opportunity to make Punjab’s health data more accurate and more actionable.1 At
the same time, Punjab’s provincial government had just set up the Punjab Health
1 We thank Asim Fayaz in addition to Zubair Bhatti for envisioning and designing the smartphone
monitoring program.
19 Monitoring the Monitors in Punjab, Pakistan
515
Sector Reform Program (PHSRP), which had the mandate to push reform within
the Department of Health but also had substantial autonomy. PHSRP was run by
Farasat Iqbal, a well-respected career bureaucrat in Punjab and someone who was
quick to recognize the potential of ICT. He was one of the first champions for the
use of technology within the bureaucracy and remained a champion throughout.
We partnered with Mr. Bhatti’s World Bank unit and Mr. Iqbal’s PHSRP to take
advantage of this opportunity. Together, we designed, implemented, and evaluated
a smartphone monitoring program, officially termed “Monitoring the Monitors,”
across Punjab’s 36 districts. The program simply replaces the paper-based system
of old with an app-based system, otherwise collecting the same data and involving
the same health workers. Instead of using paper forms, government health inspectors
are equipped with a smartphone and an app to collect data and feed it to an online
dashboard system. Cutting out the aggregation step assures real-time information
on BHU performance, aggregated into simple charts and tables, for the review of
senior health officials.2 Importantly, the app also includes several fail-safes to ensure
accurate reporting and thus to break the self-fulfilling prophecy described above:
reports are geo-stamped and time-stamped and all staff reported present must be
photographed with the inspector (Fig. 19.1).
We evaluated the Monitoring the Monitors system through a large-scale randomized controlled trial. Beyond improving the flow of data, the system changed
the behavior of inspectors, at least temporarily. In independent audits conducted
6 months after the system launched, the inspection rate increased from 25.5% to
51.9%. After a year of operation, inspection rates were 33.8% in the treatment
districts and 23.5% in control districts.
It was our hope that this increase in inspections would increase doctor attendance.
On average, this was not the case. But interestingly, we find that the Monitoring the
Monitors system did lead to increased doctor attendance exactly in the cases when
the system’s data was made actionable for senior health officials. To show this, we
built into the system an A/B test of sorts. Specifically, if more than three of the seven
health workers that are supposed to staff a rural clinic were absent during a health
inspection, we “flagged” a facility as underperforming by highlighting it in red on
the dashboard.3 We find that flagging increased subsequent doctor attendance from
23.6% to 41.3%. We interpret this as evidence that policymakers do indeed use data
when making decisions, if it is made actionable.
This result brings us back to the development problem here—a lack of accurate
and actionable data for public sector managers to use to ensure frontline workers
show up to work. In this case, ICT ensured more health inspections feeding more
accurate data on performance to senior health officials and subsequently much
2 The data include staff attendance, availability of medicine, patient visits, vaccines provided,
cleanliness, and so on.
3 See Fig. 19.1, Panel B, for the red flagging. Note this arbitrary threshold was not known to anyone
outside of the research team.
516
Fig. 19.1 Online dashboard screenshots
A. Rezaee
19 Monitoring the Monitors in Punjab, Pakistan
517
higher rates of government doctors showing up to work in rural health clinics, but
only when data on those doctors’ (lack of) performance was actionable.
2 Implementation Context
Pakistan is the world’s fifth most populous country, equivalent in population to all
of Western Europe combined. Punjab is Pakistan’s largest province, with over 110
million people. Most of these people rely on free government health services. These
are provided by Punjab’s Department of Health, which is headed by the Secretary
of Health. The Monitoring the Monitors system facilitates flows of information
through the Department’s existing chain of command, so describing that chain is
fundamental to characterizing the program.
This provincial Department comprises 36 District Health Departments, each
headed by a “senior health official.” Senior health officials are thus in charge of
health service delivery for several million people, and they report directly to the
Secretary.
Senior health officials are, in turn, each supported by several “health inspectors,”
typically one for each sub-district (there are, on average, 3.4 sub-districts per
district). Health inspectors are charged with inspecting all of the health facilities in
their sub-district at least once every month. Health inspectors are themselves trained
doctors who likely began their government service lower down in the bureaucracy.
There are 5 classifications of health facilities, all inspected by health inspectors;
we focus on the frontline tier, called Basic Health Units, of which there are 2496
spread throughout Punjab (on average 17 per sub-district). Each BHU is headed
by a doctor, who is generally supported by six additional staff. Doctors are general
practitioners who have completed 5 years of medical school and are therefore the
most trained health professionals in rural areas.
Figure 19.2 depicts this administrative hierarchy.
While we have already discussed general reasons that frontline workers might
be absent from their post, in this particular context, it is important to note that
doctors also face particularly weak career advancement prospects. Very few doctors
rise through the ranks to become health inspectors: compared to the 2496 doctors
posted to BHUs, there are only 123 health inspectors. This is not the case with health
officials higher up in the bureaucracy. Strong performance by senior health officials
is commonly rewarded with appointment to a higher office. Health inspectors are
also more likely to move up the ranks.
Another important institutional feature in this context is the fact that it is very
uncommon for health workers to be fired from their jobs at any level. However,
there are still tools for managers to ensure the performance of their subordinates.
In the case of senior health officials ensuring the performance of health inspectors,
interviews reveal that they typically begin simply by having a conversation with
a problematic health inspector. The next step is to refer the matter to a senior
provincial-level official in charge of general administration. This can result in a
518
A. Rezaee
Post
Most senior official in…
Health Secretary
Province
(i.e. Punjab)
District
Senior health official
(36 in Punjab)
Health inspector
Tehsil (County)
(145 in Punjab)
Doctor
Clinic
(2,496 in Punjab)
Fig. 19.2 Organization chart for the Punjab Department of Health
formal inquiry and ultimately in pay cuts. In the case of health inspectors ensuring
the performance of doctors, health inspectors may issue a “show-cause notice,”
which requires doctors to explain their absence to senior health officials. In severe
cases of persistent absence, health inspectors can transfer doctors to less desirable
locations.
3 Innovate, Iterate, Evaluate, and Adapt
3.1 Innovation
While an app that collects data and sends it to an online dashboard may seem
trivial today, in 2011 Pakistan, it was novel. The app itself was built using the Open
Data Kit open-source platform (https://getodk.org/). As described above, other than
the geo-stamps, time-stamps, and pictures, the data collected by the app was not
innovative. In fact, it intentionally collected identical data to that collected by the
original paper-based forms, to ensure buy-in from the Health Department.
The smartphones required to run the app were the first smartphones that any of
Punjab’s 123 health inspectors had ever used. Health inspectors had to be trained
to use the phones and app in person, district by district, over the course of more
than a month. And there were persistent challenges ensuring smartphones remained
charged, working properly, and able to regularly sync data with the online dashboard
via 2G networks. This required a full-time staff member to help health inspectors to
troubleshoot technical issues and to work directly with phone manufacturers and a
major telecom operator in Pakistan.
19 Monitoring the Monitors in Punjab, Pakistan
519
There was a more subtle innovation with this app in the context of 2011 Pakistan,
and this is perhaps the reason this case is in this Development Engineering textbook.
That was the way in which the app and dashboard were developed through a
partnership between academics, the World Bank, and the Health Department. The
idea of an app and online dashboard was not on the Health Department’s radar prior
to the World Bank offering the system. And the World Bank-based technology team
that developed the system had no experience fulfilling the needs of an entrenched
government bureaucracy, such as not changing what data was being collected by
the app to allow for sufficient political buy-in. Finally, neither the World Bank nor
the Health Department had experience implementing what was essentially a policy
reform in a way that could allow for a careful evaluation of its impacts before any
scale-up. For example, given the flow of information to senior health officials, it
was important to do a clustered randomized controlled trial at the district level. The
academics filled this need.
While such a process again may seem trivial today, it was quite innovative at the
time, to the point where the system’s technology lead, Asim Fayaz, subsequently
started a non-profit center based at Lahore University of Management Sciences
with support from Google to repeat the same needs assessment and app design
process for other departments of Punjab’s provincial government. This center, the
Technology for People Initiative (TPI), went on to design apps for Punjab’s schools,
police, courts, and more. Eventually, Punjab’s provincial government’s in-house app
development team, based at the Punjab IT Board (PITB), extended the use of mobile
apps in many of those departments. PITB developed more than 270 apps for the
provincial government between 2012 and 2017.
As stated in Chap. 2, “DevEng integrates the theory and methods of development economics with the principles and practice of engineering, resulting
in technical innovations that are tightly coupled with the social or economic
interventions required for success in the ‘real world’.” In this case, it was
crucial that development economists and engineers at the World Bank, later
TPI, came together. There was an added group that was crucial, however—the
government—that had to be integrated in the process from the beginning.
One caveat is worth mentioning related to the development of the Monitoring
the Monitors app and dashboard—the design approach was very top-down. Few
doctors were consulted in the design process, as well as few health inspectors. As
a result, once the novelty of the smartphones wore off, many health inspectors
were unhappy with the system, and they left their phones at home. Of course,
the dashboard allowed senior health officials to pick up on missing data and
sanction delinquent health inspectors, ensuring the system continued to operate
at a level deemed sufficient. We understand that researchers in fields such as
Human-Computer Interaction (HCI) have conducted extensive research to suggest
bottom-up app development may often be more effective than top-down (Hartson &
Pyla, 2019).
520
A. Rezaee
3.2 Iteration
While in the end the Monitoring the Monitors system was relatively straightforward
in terms of the data it collected and how it displayed that data (excluding the flagging
A/B test built into the dashboard), the design, implementation, and evaluation
process required several rounds of iteration.
The app and dashboard design process itself required several rounds of iterations
between the World Bank technology team and the Health Department. As mentioned
above, this type of direct interaction was new for those involved but ultimately
successful. This success can be most attributed to the fact that Zubair Bhatti
had served in the civil service in Pakistan prior to joining the World Bank. The
understanding that this brought, coupled with sufficient patience, ensured the project
did not stall at this stage.
Once a beta version of the system had been built, our research team piloted it in
one district of Punjab—Khanewal. Khanewal was selected specifically because the
District Coordination Officer (DCO), its highest ranked civil servant, was willing to
serve as a champion for the new system within a bureaucracy that was resistant to
change, especially if it might involve breaking down existing patronage networks
that allowed doctors to shirk from their work. This dovetailed with Farasat Iqbal
serving as the system’s champion within the Health Department. That Rashid
Langrial had become Khanewal’s DCO shortly before the project launched was
luck from the project’s perspective. With his help, we were able to pilot the system
in a real-life setting with several health inspectors and one senior health official.
This proved instrumental in working out several kinks, especially in the process
of training health inspectors and troubleshooting issues with data collection and
aggregation. The pilot was also instrumental for final Health Department buy-in.
The Department needed to see that the system could work.
The pilot also allowed for us to get DCO Langrial’s perspective on the likelihood
of success of the system. He was the one who recommended the dashboard flagging
that ultimately proved successful, arguing that the system would be ineffectual
unless we made sure those that wanted things to improve had what they needed.
In the last box, we stressed the importance of adding government bureaucrats
themselves as key members of the team when turning DevEng toward
governance. It is important that these champions have a deep understanding
of political realities. It is also important that you identify champions at each
step of the project, from design to pilot to the intervention. In our case, we
had the head of a reform unit in the Health Department as well as the head of
a district as champions. These individuals were critical.
19 Monitoring the Monitors in Punjab, Pakistan
521
The large-scale randomized controlled trial that followed can itself be thought of
as another round of iteration, as we only rolled the system out across half of Punjab
for approximately 1 year. We will now discuss this evaluation.
3.3 Evaluation/Results
The randomized controlled trial (RCT) of the Monitoring the Monitors was
conducted between November 2011 and October 2012. To collect data for the RCT,
independent survey enumerators made 3 unannounced visits to 850 health clinics
randomly sampled from the province’s 2496: one before smartphone monitoring
began, in November 2011, and two after smartphone monitoring began (in treatment
districts), in June and October 2012.
During these unannounced visits, enumerators collected the same information
that health inspectors record—information on health clinic utilization, resource
availability, and worker absence—as well as information on the occurrence of
health clinic inspections themselves. Enumerators also physically verified health
clinic staff presence. We also conducted face-to-face surveys with all doctors, health
inspectors, and senior health officials in Punjab during the RCT.
We began the experiment after baseline surveys concluded. We randomly
selected 18 of Punjab’s 36 districts to receive the Monitoring the Monitors system
(“treatment” districts), while 17 districts maintained the status quo, paper-based
system (“control” districts).4 We randomized at the district level for two reasons.
First, the intervention channels information about health inspections to district-level
senior health officials. Second, all inspectors in a district are required to attend
monthly meetings and so interact frequently, while these relations are much weaker
across districts. District-level randomization therefore makes sense in terms of the
design of the program and also reduces concerns about contamination.
At the end of the day, the fact that our evaluation leveraged an RCT allowed us
to measure the impacts of Monitoring the Monitors by simply comparing inspection
and attendance rates in treatment districts with control districts in the post period
(our second and third survey waves). Of course, many small decisions were made
in the process of conducting the RCT and measuring the impacts of treatment,
such as how to select districts for treatment or control (we chose to “stratify” on
several variables to ensure the treatment and control groups were as comparable
as possible with each other apart from receiving treatment, for example), which
empirical specifications to use, how to conduct hypothesis tests carefully, and so on.
Details can be found in Callen et al. (forthcoming).
Our results are summarized in Figs. 19.3 through 19.6.
4 Note 35 of Punjab’s 36 districts were in our experimental sample. Khanewal was left out of our
sample for the main RCT because it had already received the system during our pilot.
A. Rezaee
.5
.4
.3
.2
0
.1
Average doctor attendance
.6
.7
522
Wave 2 only
Wave 3 only
Endline survey wave
Treatment districts
Avg. waves 2 and 3
Control districts
Fig. 19.3 The effect of smartphone monitoring on the rate of inspections. Notes: This figure
reports unconditional average treatment effects of the “Monitoring the Monitors” program on
the rate of health clinic inspections. The data come from primary unannounced surveys after
the treatment was launched (survey waves 2 and 3). The dependent variable is the average
inspection rate across clinics within a month prior to the survey. Whiskers depict 95% confidence
intervals, calculated using standard errors clustered at the district level. See Table 1 in Callen et al.
(forthcoming) for additional details
Figure 19.3 shows the impact of Monitoring the Monitors on inspection rates
across our sample facilities. We find that health clinics in treatment districts were
18.1% points more likely to be inspected in the previous month during the treatment
period. This represents a 74% increase in inspection rates in treatment districts
relative to control districts. Breaking this up into the two waves of post-treatment
data collection, we find comparable effects, though there is evidence that the effect
of treatment had attenuated by October 2012, a year after the introduction of the
program. It is interesting to point out that Monitoring the Monitors still did not
achieve anywhere near-perfect health inspector performance. This represents the
reality that there are many factors, not just a lack of accurate and actionable data,
affecting health worker performance.
We should keep in mind that apps and dashboards are agnostic to political
economy realities and that they cannot solve every problem. They might even
exacerbate some problems. They are at best thought of as one part of a larger
(continued)
19 Monitoring the Monitors in Punjab, Pakistan
523
solution toward ensuring public sector absenteeism, or other governance
failures, is not a problem in a particular setting. Development economists who
choose to tackle issues one app at a time despite larger realities might think of
themselves as a plumber engaged in fixing one leak at a time (Duflo, 2017).
Figure 19.4 shows the subsequent impact of Monitoring the Monitors on doctor
attendance at BHUs (an explicit goal of the program). We find mixed results
here that are highly dependent on our decisions about empirical specification.
Conservatively, it seems the program did not have an impact on doctor attendance,
on average. That is not to say that it didn’t have an impact in some areas and not
others. And, in fact, our flagging results do suggest large impacts when data was
made actionable.
Figure 19.5 shows these heterogeneous impacts between BHUs that were flagged
as underperforming on the dashboard (those that were likely to draw the attention
of very busy senior health officials) and those that were not flagged, comparing
ITT on doctor attendance
TOT on doctor attendance
0
.25
.5
.75
1
1.25
DinD
DinD with facility FEs
Control for baseline attendance
IV with control for baseline attendance
Fig. 19.4 The effect of smartphone monitoring on doctor attendance. Notes: This figure reports
estimated intention-to-treat and treatment-on-the-treated (TOT) effects of the “Monitoring the
Monitors” program on the doctor attendance. Effects are estimated from OLS regressions in which
the unit of observation is the clinic, and data come from primary unannounced surveys after the
treatment was launched. The dependent variable is an indicator for whether a doctor was present at
the clinic during an announced visit. All models include randomization block fixed effects. DinD
refers to a difference-in-difference specification. IV refers to a TOT specification that estimates the
effect of inspections on doctor attendance, instrumenting for inspections with treatment. Whiskers
depict 95% confidence intervals, calculated using standard errors clustered at the district level. See
Table 2 in Callen et al. (forthcoming) for additional details
A. Rezaee
.5
.4
.3
.2
.1
0
Average doctor attendance after flagging (or not)
.6
524
Flagged facilities
Unlagged facilities
Fig. 19.5 The effect of flagging underperformance on the dashboard. Notes: This figure reports on
the effect on subsequent doctor attendance of flagging on an online dashboard the fact that a clinic
had three or more staff absent to a senior policymaker. Clinics were flagged in red on an online
dashboard if three or more of the seven staff were absent in one or more health inspections of the
clinic 11 to 25 days prior to an unannounced visit by our survey enumerators. The data sample
limits to facility reports in which either two or three staff were absent (the threshold to trigger the
underreporting red flag). In addition, the sample is limited to “Monitoring the Monitors” treatment
districts due to the necessity of the web dashboard for flagging clinics. All underlying regressions
include survey wave fixed effects. Whiskers depict 95% confidence intervals, calculated using
standard errors clustered at clinic level. See Table 3 in Callen et al. (forthcoming) for additional
details
facilities just above and below the flagging threshold to ensure the BHUs were
otherwise very similar. We find that doctor attendance subsequent to flagging on the
dashboard increases by 17.7% points or about 75%. Conversations with government
partners suggest that the most likely driver of this effect is verbal reprimands from
senior health officials to doctors in charge of clinics.
For our Monitoring the Monitors system to have an impact on doctor
attendance, data needed to be made both accurate and actionable. In this case,
making data actionable meant making our online dashboard skimmable by
high-level, quite busy senior health officials. We did this by drawing particular
attention with red highlights to the lowest performing health inspectors and
doctors for senior health officials to quickly sanction.
19 Monitoring the Monitors in Punjab, Pakistan
525
Finally, Fig. 19.6 breaks down the impact of Monitoring the Monitors by two
different dimensions than whether a facility was flagged on the dashboard. First, a
growing literature documents the role of individuals (as opposed to institutions) in
ensuring (or not) the level of public service delivery across the developing world,
summarized in Finan et al. (2017). We examine whether personality characteristics
of the health workers in our study predict their response to monitoring and to
information. To do this, we measured personality characteristics—the Big Five
Personality Index and the Perry Public Service Motivation Index5 —of all of the
doctors in our sample clinics and the universe of health inspectors and senior
health officials in Punjab. In Callen et al. (2015), we explore this dimension of
heterogeneity in great detail. As an example of the role of personality characteristics
in this setting, we present heterogeneity of our flagging results in Fig. 19.6, Panel
A. We find that personality characteristics systematically predict responses by
senior health officials to our dashboard experiment, as measured by future doctor
attendance in flagged facilities: a one standard deviation increase in the Big Five
Personality Index of senior bureaucrats increases the effect of flagging on the
likelihood that doctor is present at the clinic during a subsequent unannounced visit
by 28% points. We see a similar though smaller differential effects of flagging in the
case of Public Service Motivation. Of course, these results are merely predictive as
we did not randomize personality traits.
When seeking to evaluate a program such as Monitoring the Monitors, it is
crucial to consider the fact that impacts of the program will likely differ across
time, across space, and across individuals. If you stop to develop hypotheses
about likely dimensions of heterogeneity from the start (by talking to those
(continued)
5 Developed by psychologists in the 1980s, the Five-Factor Model, or Big Five personality traits,
is now one of the most widely used personality taxonomies in the field. We measure the Big Five
traits using a 60-question survey developed specifically in Urdu and validated for use in Pakistan
by the National Institute of Psychology at Quaid-i-Azam University, Islamabad. Each of the 60
questions offers the respondent a statement such as “I see myself as someone who does a thorough
job” and asks them to agree or disagree with the statement on a five-point Likert scale (disagree
strongly, disagree a little, neutral, agree a little, or agree strongly). In addition to measuring Big
Five traits separately as the mean response to 12 questions (where disagree strongly is assigned a
1, disagree a little a 2, etc.), all traits are normalized into z-scores and averaged to form a single
Big Five index. The Big Five personality traits are agreeableness, emotional stability, extroversion,
conscientiousness, and openness. The Perry Public Service Motivation (PSM) battery is designed
to measure intrinsic motivation for public service. Also developed in the 1980s, it comprises a
total of 40 questions measuring 6 traits—attraction to policymaking, commitment to policymaking,
social justice, civic duty, compassion, and self-sacrifice. We similarly combine these traits into one
index. See John et al. (2008) for the Big Five measure and Perry and Wise (1990) for the Perry
Public Service Motivation measure. See Callen et al. (2015) for more information on these surveys
and indices.
A. Rezaee
.9
.8
.7
.6
.5
.4
.3
.2
.1
0
Average doctor attendance after flagging (or not)
1
526
Flagged facilities
Flagged, +1SD EDO Big5
.8
.7
.6
.5
.4
.3
.2
.1
0
Average doctor attendance after flagging (or not)
.9
Unlagged facilities
Unlagged
Flag., low comp
Flag., med comp
Flag., high comp
Fig. 19.6 Flagging effects by senior policymaker personality and by political competition. Notes:
Panel A reports average doctor attendance in clinics 11 to 25 days after the clinic was flagged or
not on the dashboard as well as for flagged facilities in districts with a senior health official (EDO)
with a Big Five index one standard deviation or higher above the mean. The Big Five index is
a z-score average across five Big Five personality traits, elicited through surveys of senior health
officials. Panel B also reports average subsequent doctor attendance for flagged facilities in districts
with low, medium, and high political competition based on the most recent election. Notes for Fig.
19.5 provide additional details about flagging. Appendix Tables A12 and A13 in Callen et al.
(forthcoming) provide additional details about the personality and political competition measures
19 Monitoring the Monitors in Punjab, Pakistan
527
who know the context), you will have a chance to test for differential impacts
and potentially adapt your program to them before long.
Second, we explore whether measures of political competition predict flagging
effects. The bureaucrats we worked with to create the program felt strongly that the
program would break down when politicians interfered with senior health officials’
attempts to sanction their subordinates. Indeed, in our surveys, senior health officials
report that politicians routinely interfere in this way.6 In Callen et al. (2016), we
match each clinic in our sample to a provincial assembly constituency and examine
in detail the extent to which these political moderators affect the efficacy of the
Monitoring the Monitors program. As an example, we find that the treatment effect
of flagging on doctor attendance varies by the degree of competitiveness in the
previous election. Fig. 19.6, Panel B, presents the results. We find that while flagging
increases subsequent attendance by 35.9% points in the most politically competitive
third of constituencies, flagging has no apparent effect in the least competitive
third. In addition, flagging works better on doctors who do not report a direct
connection with a local politician. Indeed, the point estimates, though noisy, suggest
the program may have negatively affected attendance of connected doctors.
Taken together, these results drive home that the effectiveness of ICT-based
programs such as Monitoring the Monitors very much depends on the individuals
making use of the program as well as the political environment in which the program
is implemented. Similar findings have been documented in many settings, including
by Kentaro Toyama (see Chap. 4). These results also drive home the importance of
the Development Engineering framework—the fact that despite the technology is
more or less universal, local context is paramount to the effectiveness of potential
interventions.
3.4 Adaptation
Perhaps the primary goal of the evaluation of Monitoring the Monitors was to
determine the extent to which it should be adapted into a permanent, province-wide
policy. The results above suggest the program could be quite effective, but only
in certain circumstances. To determine whether the effects were worth the cost,
we would have liked to conduct a thorough cost-effectiveness analysis as part of
our evaluation. This was not easy, however, since increased inspections or doctor
attendance was not the benefits we were ultimately interested in. The ultimate goal
was to increase health outcomes for Punjab’s rural poor, outcomes that were too
6 Based on interviews with all senior health officials in Punjab, we find that 44% report a politician
interfering in their decision to sanction an underperforming employee during the previous year.
528
A. Rezaee
costly for us to measure well in this setting. As a result, we had to rely on one
fact about our ICT-based intervention to make a recommendation about continuing
the policy or not—it was very cheap to implement. The Monitoring the Monitors
program cost 17,800 USD to set up and 510 USD per month to operate.7 While the
results of the program are mixed, given this low cost, we would expect it to pass a
cost-effectiveness test.
Thanks to the excitement of our Health Department partners about this project,
we had the opportunity to present the results from our experiment and our conclusions at one of Punjab’s Chief Minister’s (the province’s highest level bureaucrat)
monthly health stock-taking meetings. One slide and 1 minute of presenting led to
a nod by the Chief Minister. The government of Punjab then scaled the program
up to cover the entire province. The hand-off from our team to the government
included several adaptations. First, the government rebranded our system to be
called HealthWatch, both for design reasons and also so that the government could
take credit for developing a new system. Second, the Health Department had to
learn how to manage the system. As an example, when we first handed off the
system, it crashed for several months, while the Department worked out a process
to pay server, airtime, and phone repair bills. Our full-time staff member also spent
a great amount of time meeting with those in the Health Department put in charge
of HealthWatch to ensure they had the ability to train new health inspectors and to
troubleshoot problems with the system.
It is important to understand the goals of politicians and bureaucrats and
how they may differ from those of development economists and/or engineers.
While academics often care about academic journal publications as a way to
impact their discipline (and gain credit toward promotion), bureaucrats may
place a much higher weight on photo opportunities as a way to ensure they
receive credit toward their own career advancement.
HealthWatch remains in place today, and it is largely the same as first designed.
It is unusual for policies and programs to preserve for so long in Punjab as political
tides have regularly shifted. We see HealthWatch’s persistence as testament to the
strength of the initial Development Engineering collaboration. If any one of the
groups involved had attempted to design, implement, and evaluate the program by
themselves, it would likely have been unsuccessful. By coming together, we were
able to innovate, iterate, evaluate, and adapt our way to a sustainable, impactful
program.
The hundreds of similar apps and dashboards that have followed HealthWatch
in Punjab can also be considered further adaptations. Some of these adaptations
have literally been cut-and-paste jobs. While the photo ops and political payoffs
7 The
setup costs included 4470 USD to develop the app and 13,330 USD for smartphones.
19 Monitoring the Monitors in Punjab, Pakistan
529
to such apps were high, our observation is that such quick adaptations were much
less successful than cases when the TPI or PITB teams repeated the entire process
that we followed, including the initial design stage. This is in keeping with best
practices in Development Engineering (Chap. 3). We have also observed many
online dashboards that failed to take the lesson from our flagging results in making
data expedient. Bureaucrats have told us when it takes them too long to browse an
online dashboard, they tend to delegate to assistants to create paper reports of what
is found on the dashboard. This is a clunky and inefficient process at best.
One final anecdote about adaptation—in a recent trip to Punjab, I met with a
government vaccinator. When I asked him about the app he was charged with using
to keep track of his performance, he pulled out his phone and showed me not one,
not two, but three different apps he was required to open, fill out, and monitor for the
same set of activities (on top of registers that are still filled out and kept collecting
dust in a closet at the BHU). Because it is so easy to create new apps, PITB and
the Health Department have taken to doing so rather than fixing and/or adapting old
apps. But the bureaucracy is not as nimble and often still relies on old apps for some
time, creating redundancies.
4 Lessons Learned
An investment in developing ICT-based solutions to public sector management
problems by Punjab and others like it has driven a revolution in the amount of
data that can quickly and cheaply be accessed for policy decisions. This trend is
only likely to accelerate with the rise of remote sensing, digital trace (e.g., cell
phone call and mobile money transaction records), smartphones, and other research
innovations. A key lesson from this exercise is that, appropriately channeled, these
data streams can improve policy outcomes.
Other lessons are highlighted in the text boxes above:
• The Development Engineering focus of bringing together development
economists and engineers holds when working to make changes within a
government bureaucracy, but there is another group that must also be involved
from the beginning—government bureaucrats themselves.
• It is particularly important to build this political buy-in from the start of a new
project. In our case, we ensured buy-in through partnering with individuals with
a deep understanding of political realities and through identifying champions
within the government at each step.
• Relatedly, it is important to understand the goals of politicians and bureaucrats
and how they may differ from those of the rest of the team. While everyone may
agree that health outcomes are paramount, bureaucrats may place a much higher
weight on photo opportunities as a way to ensure they receive credit toward their
own career advancement. As an academic, it is important to be reminded that
many don’t care one bit about an economics journal publication.
530
A. Rezaee
• Relatedly, it is important to understand that apps and dashboards are agnostic
to political economy realities and that they cannot solve every problem. They
might even exacerbate some problems. They are at best thought of as one part of
a larger solution toward ensuring public sector absenteeism is not a problem in a
particular setting.
• For our Monitoring the Monitors system to have an impact on doctor attendance,
data needed to be made both accurate and actionable. In this case, making
data actionable meant making our online dashboard skimmable and drawing
particular attention to the lowest performing health inspectors and doctors for
senior health officials to quickly sanction.
• Finally, when seeking to evaluate a program such as Monitoring the Monitors, it
is crucial to consider the fact that impacts of the program will likely differ across
time, across space, and across individuals. If you stop to develop hypotheses
about likely dimensions of heterogeneity from the start (by talking to those who
know the context), you will have a chance to test for differential impacts and
potentially adapt your program to them before long.
Discussion Questions
1. The success of Monitoring the Monitors was in part due to building off an
existing system of data collection. What if there had been no data collected in
the first place as is often the case in these settings?
2. We make the point that it may be important to allow specific politicians and
bureaucrats to claim credit for a new app. But we have also seen in Pakistan
that apps associated too much with one particular individual or party are quickly
removed with political turnover. How can a project strike the balance between
political expediency and long-term sustainability?
3. Why bother partnering with governments to create monitoring systems in the first
place? We could have created a crowdsourced data collection system outside
of the government such as a yelp.com or angieslist.com. Indeed, in follow-up
work to this project, co-authors and I did this for government veterinarians to
great success (Hasanain et al., 2020). The case study in this book on Protecting
Electoral Integrity is another example of a political intervention from the outside.
When might it be better to work within the bureaucracy rather than from outside?
4. Relatedly, this case has been about improving the flow of information on
health service delivery within the bureaucracy and ultimately the performance of
frontline health workers in Punjab. Health services could improve dramatically
but still not translate to improved health outcomes for poor Punjabis for many
reasons, such as a lack of trust in the government. How could you imagine
improving the Monitoring the Monitors system, or coupling it with other
interventions, to ensure end-goal improvements in health?
5. As more and more systems such as Monitoring the Monitors are maintained
across the developing world, the amount of data available to understand public
service delivery outcomes, shortcomings, and the political economy reasons
behind such has been growing rapidly. If you suddenly had access to all of PITB’s
data, how could you use it to an effect?
19 Monitoring the Monitors in Punjab, Pakistan
531
6. Imagine you were the Secretary of Health for Punjab and you learned that
personality characteristics of bureaucrats and local political competition are
pivotal to whether data is used to improve public sector performance. How could
you make use of this information to improve health outcomes in your province?
References
Akhtari, M., Moreira, D., & Trucco, L. (2017). Political turnover, bureaucratic turnover, and the
quality of public services. Working paper.
Banerjee, A., & Duo, E. (2006). Addressing absence. The Journal of Economic Perspectives, 20(1),
117–132.
Banerjee, Abhijit V., Esther Duo, and Rachel Glennerster, “Putting a band-aid on a corpse:
Incentives for nurses in the Indian public health care system,” Journal of the European
Economic Association, 04-05 2008, 6 (2–3), 487–500.
Callen, M., Gulzar, S., Hasanain, A., Khan, M. Y., & Rezaee, A. (2015). Personalities and public
sector performance: Evidence from a health experiment in Pakistan (No. w21180). National
Bureau of Economic Research.
Callen, M., Gulzar, S., Hasanain, S. A., & Khan, Y. (2016). The political economy of public sector
absence: Experimental evidence from Pakistan (No. w22340). National Bureau of Economic
Research.
Callen, M., Gulzar, S., & Rezaee, A. (2020). Can political alignment be costly? The Journal of
Politics, 82(2), 612–626.
Callen, M., Gulzar, S., Hasanain, A., Khan, M. Y., & Rezaee, A. (forthcoming). Data and policy
decisions: Experimental evidence from Pakistan. Journal of Development Economics.
Chaudhury, N., Hammer, J., Kremer, M., Muralidharan, K., & Rogers, F. H. (2006). Missing
in action: Teacher and health worker absence in developing countries. Journal of Economic
Perspectives, 20(1), 91–116.
Dal Bó, E., Finan, F., & Rossi, M. A. (2013). Strengthening state capabilities: The role of financial
incentives in the call to public service. The Quarterly Journal of Economics, 128(3), 1169–
1218.
Dal Bó, E., Finan, F., Li, N. Y., & Schechter, L. (2018). Government decentralization under
changing state capacity: Experimental evidence from Paraguay (No. w24879). National Bureau
of Economic Research.
Dhaliwal, I., & Hanna, R. (2017). Deal with the devil: The successes and limitations of bureaucratic
reform in India. Journal of Development Economics.
Duflo, E. (2017). The economist as plumber. American Economic Review, 107(5), 1–26.
Duflo, E., Hanna, R., & Ryan, S. P. (2012). Incentives work: Getting teachers to come to school.
American Economic Review, 102(4), 1241–1278.
Finan, F., Olken, B. A., & Pande, R. (2017). The personnel economics of the developing state. In
Handbook of economic field experiments (Vol. 2, pp. 467–514). North-Holland.
Hartson, R., & Pyla, P. (2019). Chapter 13 – Bottom-up versus top-down design. In The UX book
(2nd ed., pp. 279–291). Morgan Kaufmann.
Hasanain, A., Khan, Y., & Rezaee, A., (2020). No bulls: Asymmetric information in the market for
artificial insemination in Pakistan. Working paper.
John, O. P., Naumann, L. P., & Soto, C. J. (2008). Paradigm shift to the integrative big five trait
taxonomy: History, measurement, and conceptual issues. In Handbook of personality: Theory
and research. The Guilford Press. chapter 4.
Muralidharan, K., Das, J., Holla, A., & Mohpal, A. (2017). The fiscal cost of weak governance:
Evidence from teacher absence in India. Journal of Public Economics, 145, 116–135.
532
A. Rezaee
Olken, B. A., & Pande, R. (2012). Corruption in developing countries. Annu. Rev. Econ., 4(1),
479–509.
Perry, J. L., & Wise, L. R. (1990). The motivational bases of public service. Public Administration
Review, 367–373.
Rasul, I., Rogger, D., & Williams, M. J. (2018). Management and bureaucratic effectiveness:
Evidence from the ghanaian civil service. The World Bank.
Open Access This chapter is licensed under the terms of the Creative Commons Attribution 4.0
International License (http://creativecommons.org/licenses/by/4.0/), which permits use, sharing,
adaptation, distribution and reproduction in any medium or format, as long as you give appropriate
credit to the original author(s) and the source, provide a link to the Creative Commons license and
indicate if changes were made.
The images or other third party material in this chapter are included in the chapter’s Creative
Commons license, unless indicated otherwise in a credit line to the material. If material is not
included in the chapter’s Creative Commons license and your intended use is not permitted by
statutory regulation or exceeds the permitted use, you will need to obtain permission directly from
the copyright holder.
Chapter 20
Digital Public Services: The Development
of Biometric Authentication in India
Ashwin Nair and Burak Eskici
1 Development Challenge
Throughout the world, government welfare programs face two intransigent challenges: (1) how to deliver public assistance to the neediest, the “targeting” problem,
and (2) how to minimize the “leakage” of resources from public coffers (World
Bank, 2003). Targeting assistance to those in need is particularly difficult in developing countries because government agencies often lack reliable data on household
income and government systems for welfare monitoring are weak (Niehaus et al.,
2013). There is also widespread corruption in the delivery of services, a problem
documented by many researchers over several decades (Bardhan, 1997; Olken
& Pande, 2012). Corruption in public services can come in many forms, from
skimming off beneficiary payments to creating “ghost” beneficiaries and extracting
bribes from eligible beneficiaries. In 2006, Olken found that 18% of subsidized
rice distributed to poor families in Indonesia was unaccounted for, when comparing
household reports with administrative data. Even more stark, a study in Uganda
The authors were affiliated with the Payments and Governance Research Program in the capacity
of Research Associate and Project Director, respectively. We thank Karthik Muralidharan, Paul
Niehaus, Sandip Sukhtankar, and the Payments and Governance Research Program for their
support. In addition, we would like to thank Anustubh Agnihotri, Temina Madon, Karthik
Muralidharan, Arman Rezaee, and Sneha for their comments and suggestions.
A. Nair ()
University of Virginia, Charlottesville, VA, USA
e-mail: an2cg@virginia.edu
B. Eskici
University of California at San Diego, San Diego, CA, USA
© The Author(s) 2023
T. Madon et al. (eds.), Introduction to Development Engineering,
https://doi.org/10.1007/978-3-030-86065-3_20
533
534
A. Nair and B. Eskici
Table 20.1 Fiscal cost of leakages in India
Commodity
Wheat
Kerosene
Rice
Government allocation
18.77 M tons
9.03 M kiloliters
24.33 M tons
Public consumption
8.59 M tons
5.35 M kiloliters
20.69 M tons
Leakage
54%
41%
15%
Fiscal cost of leakage
USD 2.1 billion
USD 1.6 billion
USD 1.0 billion
Source: Indian Economic Survey 2014/2015 (Volume 1)
Note: The fiscal cost of leakage has been calculated by multiplying the subsidy cost of a unit
of the commodity by the government allocation in excess of household consumption. The total
consumption by households has been estimated using survey data from a random sample of
households
estimated that on average just 13% of reported government expenditure on primary
schools was actually delivered to schools (Reinikka & Svensson, 2001).
The diversion of public resources away from intended beneficiaries is a development challenge on multiple fronts. First, the social and economic value of public
welfare programs is drained when those dependent on assistance are prevented from
accessing their entitlements (Ferraz et al., 2012; Niehaus & Sukhtankar, 2013).
Second, leakage of public funds substantially reduces the efficiency of governments.
This is particularly detrimental for developing countries that have limited fiscal
capacity, and it undermines citizens’ confidence in the public sector (Muralidharan
et al., 2017; World Bank, 2003).
Our case study focuses on India, where it is estimated that a significant
proportion of spending on key forms of public assistance does not reach its intended
beneficiaries (see Table 20.1, from the 2014 to 2015 Indian Economic Survey and
Dreze & Khera, 2015). It is estimated that these leakages cost the Indian government
an estimated Rs. 28,534 crores annually – translating to roughly 4.7 billion dollars,
or 0.2% of India’s GDP.
Digital identification (ID) technology offers a promising solution to the challenges of public welfare distribution. In this chapter, we examine the application
of two different biometric identification systems in India: a “Smartcards” pilot in
the state of Andhra Pradesh and the use of Aadhaar, the national digital ID, in the
state of Jharkhand. The applications combined advances in biometric authentication
technology with a suite of policy reforms, public-private partnerships, and service
delivery innovations. Taken together, these innovations represent a profound investment in India’s state capacity.
To grasp the novelty and significance of India’s Aadhaar, it is helpful to
first understand how most governments operate welfare programs today. Welfare
services are typically “targeted” to those most in need, with eligible beneficiaries
identified through proxy means testing (PMT). These tests establish eligibility for
assistance based on readily observable household characteristics that closely proxy
income – such as household size, land holdings, quality of housing, and consumer
durables. PMT models or algorithms are designed and validated using data from
representative surveys (which include more detailed measures of household income,
20 Digital Public Services: The Development of Biometric Authentication in India
535
assets, and consumption). A household’s score is usually assigned by government
workers, who directly observe the outcomes that determine eligibility.
However, targeting is prone to two types of errors: (1) inclusion errors, giving
benefits to households who are not eligible for the program thereby increasing
leakage and fiscal burden on the government, and (2) exclusion errors, denying
benefits to eligible households.
In India, household scores are assigned at the state level, and those falling
below the government’s poverty line are issued a below poverty line (BPL) ration
card (Alkire & Seth, 2013; Niehaus et al., 2013). To access public benefits,
registered individuals or households have traditionally presented their BPL card
alongside documents that authenticate their identity. However, many people lack this
documentation, particularly households and individuals that are socioeconomically
marginalized or disadvantaged. It is estimated that over a billion people in the world
lack legal identities (World Bank, 2019a).
Assuming eligible citizens or households are correctly identified, the next
challenge is reaching and authenticating the targeted beneficiary. Recent advances
in biometric technology present a solution to the challenge of rapidly, accurately,
and uniquely identifying welfare beneficiaries (Gelb & Metz, 2018). Biometric technologies capture and digitize the physical traits of individuals including fingerprints,
iris scans, and speech. As these traits are unique and attached to a person, they
cannot be lost or forgotten and are difficult to replicate (unlike paper identification
cards; see Goldberg et al., 2010). In addition, ID programs that use biometric
technology are more suitable for populations with low literacy and numeracy,
particularly compared to alternatives like passwords and pin numbers (Muralidharan
et al., 2016).
In the past two decades, the number of national ID programs that use biometric
technology has grown rapidly (Gelb & Metz, 2018). India’s ambitious Aadhaar
initiative was one of the first, providing unique biometric IDs to over a billion
residents in under a decade. Similar large-scale initiatives are currently underway
in Kenya (Huduma Namba), Indonesia (Kartu Tanda Penduduk Elektronik), Nigeria
(National Identification Number), and the Philippines (PhilSys).
In addition to authenticating citizens’ identities, biometric technology can also
be linked to the banking ecosystem, enabling governments to use existing payment
systems to deliver welfare transfers. Money can be deposited directly into the
bank accounts of beneficiaries, which creates more credible records for government
accountability and transparency compared to cash-based systems. Even better are
digital payments, which can be continuously monitored and audited to expose fraud.
With the proliferation of mobile phones, biometric IDs and bank accounts
are also being interlinked with beneficiaries’ mobile numbers (i.e., SIM cards),
making it possible for banks to remotely authenticate an individual’s identity,
complete digital payments, and provide customer support without brick-and-mortar
infrastructure. Digital payments can also be delivered to the doorstep of the
beneficiary, by deploying mobile banking correspondents equipped with point-ofservice (PoS) devices to authenticate users and then disburse cash on the spot.
536
A. Nair and B. Eskici
While there are many potential benefits of digital ID technology, these systems
also raise important concerns about citizens’ privacy and the exclusion of eligible
beneficiaries. Many developing countries lack the legal safeguards, legal capacity,
and civil society organizations needed to protect individuals from privacy violations
and other abuses by the state. For example, there are concerns that biometric IDs
can be used by governments to profile citizens and carry out mass surveillance
activities, under the guise of national security (Dreze, 2016). There are also fears
that governments can monetize interlinked databases, by selling data to private
entities (Bhatia, 2018) without citizens’ permission.1 In some countries, biometric
ID enrollment efforts have failed to reach the most marginalized households, and
it is unclear whether this is politically motivated or a failure of the bureaucracy.
Those lacking official identification are made more vulnerable when biometric IDs
are made mandatory for accessing welfare schemes and other government services
like education and health care (Dahir, 2020) .
The Aadhaar program in India is the largest application of biometric technology
in a national ID program; and given its scale, it is a unique opportunity to
study how the design of a new technology influences economic development. The
effort has exposed a number of intertwined technological, bureaucratic, social, and
ethical challenges. Technical problems like hardware failures and lack of Internet
connectivity have led to the exclusion of genuine beneficiaries and the starvation
deaths of a few. Government collection of biometric data en masse has raised
important privacy and security concerns among members of India’s civil society
(Dreze et al., 2017; Khera, 2019a, b). The opportunities for learning – both what
works and what has failed – are unparalleled (Box 20.1).
Box 20.1: Evolution of Biometric IDs in India
Calls for a biometric identity card in India can be traced back to national
security concerns related to illegal immigration across India’s borders (Government of India, 2001). In 2003, the government launched a biometric
Multi-Purpose National Identity Card (MNIC) for all citizens. The MNIC
project aimed to provide a “credible identification system” for speedy delivery
of public and private services and which could also serve as “deterrent for
illegal migration” (Census of India, 2003).
With these aims in mind, a pilot of the MNIC was initiated in 2006 in
13 districts. The pilot ran for a period of 3 years but failed to establish
(continued)
1 Taking cognizance of these issues, the Kenyan High Court had in fact temporarily suspended the
implementation of the Huduma Namba until adequate legal safeguards were put in place. On the
other hand, the Supreme Court in India in a majority opinion (with one judge dissenting) allowed
the use of the Aadhaar biometric ID program for welfare schemes, as it was of the opinion that it
collected minimal data for a larger purpose, i.e., to provide services to the poor.
20 Digital Public Services: The Development of Biometric Authentication in India
537
Box 20.1 (continued)
citizenship for more than half of the residents of participating districts. Rural
residents, with a weak document base, found it particularly difficult to prove
their citizenship (Singh, 2020).
In parallel, the Indian government was developing a biometric identification project focused on identifying families whose incomes were below
the poverty line (BPL), with the aim of improving targeting of public
assistance to poor households. Challenges in establishing citizenship for these
households – and the weak results of the MNIC pilot – led the government to
shift its investment in biometrics away from citizenship and toward welfare
targeting (Misra, 2019).
In the following years, different states in India introduced their own
biometric ID programs to improve last-mile delivery of welfare schemes.
Following the success of some state-level biometric ID programs including
the AP Smartcards project, the union government created the Unique Identification Authority of India (UIDAI) in 2009, charged with implementing a
nationwide biometric identity project. This came to be known as Aadhaar.
The first Aadhaar card was issued in September 2010; and as of 2020, over
one billion Aadhaar cards have been issued to Indian residents – making it the
world’s largest digital identity program (Abraham et al., 2018).
Although the need for a biometric ID card initially emerged out of national
security concerns, Aadhaar is now viewed by the government as a tool to
reduce leakages in social programs and ensure better targeting of welfare
schemes (Government of India, 2015).
1.1 Overview of the Case Study
In this case study, we will examine two different biometric identification systems
in India: a “Smartcards” pilot in the state of Andhra Pradesh (AP) and the fullscale launch of the Aadhaar system in the state of Jharkhand. In each case, the
implementation of the new technology was achieved through partnerships between
state governments and private entities such as banks. Here we will describe the
policy innovations and digital technologies used to form a new digital welfare state
across India. We will also outline results from two large-scale randomized controlled
trials (RCTs) conducted by the Payments and Governance Research Program2
evaluating the social and economic impacts of these systems (Muralidharan et al.,
2 The Payments and Governance Research Program is a team of researchers led by Karthik
Muralidharan, Paul Niehaus, and Sandip Sukhtankar based at the Jameel Poverty Action Lab (JPAL), South Asia (see https://sites.google.com/ucsd.edu/pgrp/home).
538
A. Nair and B. Eskici
2016, 2020b). The RCTs were designed to credibly estimate the impact of programs
implemented by governments at scale. As a result, these studies also document
the complex administrative, logistical, and social factors that can influence the
implementation of large-scale technology initiatives.
The chapter is organized as follows: Section 2 provides contextual details of
welfare schemes in India, including earlier methods of targeting and delivering
benefits. Section 3 describes how biometric identification systems facilitate reforms
in beneficiary authentication and service delivery. Section 4 outlines the main
challenges in implementing biometric ID programs in India. Section 5 presents
results from the large-scale evaluations in two states, and conclusions are provided
in Sect. 6.
2 Implementation Context
Despite rapid economic growth since liberalizing the economy in the early 1990s,
India’s development indicators remain poor. As of 2020, India currently languishes
at 131st (out of 189 countries) in the United Nations’ Human Development Index
(UNDP, 2020). The 2020 Global Hunger Index placed India at 94th out of 107
countries, far behind South Asian peers with slower growth rates. The country also
continues to have one of the highest infant mortality rates in South Asia (second
only to Pakistan) (UNICEF et al., 2020).
It is argued that India’s sub-par development indicators are partly a result of
the government’s weak implementation of welfare schemes (Pritchett, 2009). Lastmile delivery of many government programs has been undermined by low state
capacity (Muralidharan et al., 2016; Sukhtankar & Vaishnav, 2015). In this section,
we motivate the introduction of biometric IDs in India. We describe common modes
of failure in the nation’s service delivery and how these failures undermine India’s
investment in poverty reduction and economic development.
2.1 Public Distribution System
The Government of India’s Public Distribution System (PDS), established at
independence as a way to regulate food prices and prevent famines, provides
subsidized food and fuel to over 800 million beneficiaries in India through a network
of fair price shops (FPS). The Indian government spends approximately 1% of its
GDP and 12% of its social services expenditure on the PDS (Government of India,
2020).
Beneficiaries of the PDS are assigned a ration card which lists household
members and displays a photograph of the household head. They are then assigned
to a geographically close FPS. They visit the FPS in person (ration cards in hand) to
purchase rations each month at a highly subsidized price.
20 Digital Public Services: The Development of Biometric Authentication in India
539
Prior to the introduction of biometric authentication, shopkeepers at the FPS
(known as FPS dealers) were expected to record transactions on both ration cards
and their own paper ledgers, neither of which were regularly audited by the
government. The informal nature of authentication, alongside the dual price system
created by public subsidies, created opportunities for leakage. This resulted in the
diversion of PDS commodities to the open market, both directly from government
warehouses and from trucking networks established to deliver goods to FPS dealers.
In addition, beneficiaries have reported the adulteration of goods, overcharging for
rations, and reduction in their entitlements at FPS (Muralidharan et al., 2020b).
2.2 National Rural Employment Guarantee Scheme
The National Rural Employment Guarantee Scheme (NREGS) was implemented
across India after the enactment of the National Rural Employment Guarantee Act
in 2005. The Act mandated that state governments set up employment programs
guaranteeing 100 days of paid employment per year to any rural household. The
Indian government spends approximately 0.3% of its GDP and 4% of its social
services expenditure on the NREGS (Government of India, 2020).
Work provided through the NREGS can vary across villages but typically
involves minor irrigation work or improvement of marginal lands. There is no
eligibility criterion for the scheme, and those in need of wage labor can access
the scheme (although the poorest households are more likely to self-select into the
program). Households that participate in the scheme receive a job card which lists
household members and has empty spaces for recording employment and payment.
The job cards are issued by the local village or sub-district government offices.
Workers with job cards can apply for work at will, and officials are legally obligated
to provide either work or unemployment benefits (although, in practice, the latter
are rarely provided; see Muralidharan et al., 2016).
Worksites are managed by officials called Field Assistants, who record worker
attendance and output on “muster rolls.” These are then sent up to the sub-district
office for digitization, after which the work records are sent up to the state level.
This triggers the release of funds to pay workers. The state government transfers
money to district offices, which then pass the funds to sub-district offices, which in
turn transfer it to the beneficiary’s post office savings accounts at the village level
(see Fig. 20.1).
Prior to the roll-out of biometric authentication, workers would withdraw funds
by traveling to their village’s post office, where they would establish their identity
using job cards and bank passbooks. In practice, it was common for workers,
especially those who were illiterate, to give their documents to the Field Assistant
who would then control and operate their bank accounts. This would entail taking
sets of bank passbooks to the post office, withdrawing cash in bulk, and returning to
distribute it in villages.
540
A. Nair and B. Eskici
State
Digitized muster roll
data sent to state
financial system
2
1
Paper muster rolls
maintained by GP
and sent to Mandal
computer center
District
Mandal
Gram
Panchayat
Money transferred
electronically from
State to District to
Mandal
Paper money
delivered to GP
(typically, via post
office) and then to
workers
3
4
Worker
Fig. 20.1 Payment mechanism of the NREGS prior to the roll-out of biometric authentication
Note: The black arrows denote the flow of information on beneficiaries of the NREGS. The arrows
in blue denote the flow of funds to the beneficiary. Source: Muralidharan et al. (2016)
The payment mechanism was susceptible to leakage of two forms – overreporting of hours worked and underpayment – with the former being more
prevalent (Niehaus & Sukhtankar, 2013).3 Two extreme forms of over-reporting are
“ghost” workers who do not exist, but against whose names work is reported by
Field Assistants, and “quasi-ghost” workers who exist, but who have not received
any work or payments, even though their work is reported and payments are made.
In both cases, the payments are typically siphoned off by government officials
(Muralidharan et al., 2016). Estimates of leakages in the NREGS have varied
across districts in India, ranging from 5 to 40% (Mookherjee, 2014). Additionally,
payments made to beneficiaries through the NREGS have also been slow and
unreliable. In some extreme cases, delayed payments have led to worker suicides
(Pai, 2013).
2.3 Social Security Pensions
The Social Security Pensions (SSP) scheme, part of the Indian government’s
National Social Assistance Programme, offers monthly payments to vulnerable
populations. Eligible households must live below the poverty line (BPL), meet
an additional vulnerability criterion,4 and not be covered by any other pension
3 To illustrate how over-reporting and underpayment took place in practice, consider a worker who
has genuinely earned Rs. 100; the Field Assistant might report in the muster rolls that he is actually
owed Rs. 150 but pay the worker only Rs. 90 thereby pocketing Rs. 50 through over-reporting and
Rs. 10 through underpayment, resulting in a leakage rate of 40% (Muralidharan et al., 2016).
4 Old age (>65), widow, disabled, or certain displaced traditional occupations.
20 Digital Public Services: The Development of Biometric Authentication in India
541
scheme. Lists of eligible households are prepared by local village assemblies and
sanctioned by the administration at the sub-district level. Pensions pay Rs. 200 per
month except for disability pensions, which pay Rs. 500. A fund flow similar to that
illustrated in Fig. 20.1 existed for the SSP (Muralidharan et al., 2016).
As the scheme mostly has a fixed list of beneficiaries who received a fixed
payment, at a fixed time every month, for every month of the year, the SSP has
been less prone to leakages than the NREGS and the PDS (ibid.). Leakages in
the SSP have mainly taken the form of postmen disbursing less cash than the
beneficiary’s entitlement, the existence of false beneficiaries (including deceased
persons), demand for bribes, or theft. A study in the state of Karnataka found
leakages in the SSP to be relatively lower, at about 17% (Dutta, 2008; Dutta et al.,
2010).
3 Innovation
Biometric authentication technology has the potential to transform the delivery of
public services in resource-poor settings, where state capacity is limited. It promises
to reduce leakages resulting from ghost beneficiaries and improve the quality of
last-mile service delivery. In the case of India, the technology’s adoption took place
over a decade, beginning with initial state-level pilots and eventually scaling up
across the country. This case study covers the pilot phase, in the form of an offline
smartcard biometric system in the state of Andhra Pradesh (referred to as “AP” or
“AP Smartcards”) between 2010 and 2012, as well as the central government’s fully
scaled program, Aadhaar, as implemented in the state of Jharkhand in 2016–2017.
Both state governments introduced biometric ID systems alongside other technology advances and policy reforms. For example, they linked biometric IDs to bank
accounts and to the existing databases of large welfare schemes, complementing
the central government’s push to expand financial inclusion and improve service
delivery (Government of India, 2015). However, the two states differed in the
application of technology: AP used biometric IDs for rural employment (NREGS)
and social security pensions (SSP), while Jharkhand used biometric IDs for food and
fuel subsidies (PDS). The resulting solutions are described here. We first explain
how the solutions modified government identification protocols and then describe
how payment systems and service delivery were reformed.
3.1 Reforms in Identification
As discussed earlier, failures in paper-based government identity systems have
allowed for several forms of leakage from public programs – from the creation
of “ghost” welfare beneficiaries and the exclusion of intended beneficiaries to the
extraction of bribes. Biometric authentication enables more accurate, auditable, and
secure identification and targeting of beneficiaries.
542
Present Biometric
A. Nair and B. Eskici
Capture, Process,
and Match the
biometric data with
the back-end system
Back-end
Database
Unique Entry
Duplication or
Non-Existing
Entry
Successful
Authentication
Failed
Authentication
Fig. 20.2 Process flow of a biometric authentication system
Note: A backend database may be a central server that stores biometric data (such as the Central
Identities Data Repository in the case of Aadhaar) or can also be biometric data that is stored on
the card itself
To establish a biometric ID system, individuals must first be registered or
enrolled. Their physical traits are recorded using devices that contain cameras,
scanners, or other hardware. A backend software system then extracts, encodes,
and stores this information in a database. Any request for authentication of a
registered user compares an “input” provided in person (like a fingerprint) against
the database of encoded biometric data (see Fig. 20.2). As the entire process is
automated, authentication takes only a few seconds in most cases, including for
Internet-connected systems (Xavier et al., 2012).
An important design choice is around the storage location for an individual’s
biometric data. It can be stored centrally on a server or stored locally on a
smartcard.5 If biometric data is stored on the card, authentication can occur offline.
A card reader is used to confirm that the data stored on chip matches the input
presented in person. However, this approach has a number of limitations. First,
each smartcard requires a chip for storing data, making large-scale programs quite
expensive (World Bank, 2019b). Second, without a central database that assigns a
unique ID to each individual, the biometric data stored on a smartcard is prone to
duplication, which can be difficult to discover and remediate. Therefore, stand-alone
biometric smartcards are prone to some of the same issues that affect traditional
paper-based identification processes (Banerjee & Sharma, 2018). Lastly, smartcards
place limits on usability, as the physical smartcard must be presented for access to
5 Another (more costly) option is combining both designs with the use of a chip-based smartcard
with a unique ID linked to a central server. This allows for both online and offline authentication.
National biometric ID cards in Indonesia and the Philippines utilize this design (Asian Development Bank, 2016).
20 Digital Public Services: The Development of Biometric Authentication in India
543
services. If a beneficiary loses or damages their smartcard, there is no backup: they
are now unable to authenticate themselves.
At the time the AP government initiated its biometric ID project in 2007, there
was no universal ID database, and high-speed mobile networks were not universally
available. As a result, the government chose to issue smartcards with local storage
of data. This meant using biometric data to authenticate welfare beneficiaries only
at the point of benefit disbursement (Mukhopadhyay et al., 2013).
In the case of Jharkhand, the state was able to use a newly created central
government database, called the Central Identities Data Repository (CIDR). Each
person’s biometric data, once stored in the CIDR, is linked to a unique ID assigned
to the individual. Biometric data of over a billion Indian residents is now stored on
the CIDR, and the central database is used to match beneficiary biometrics across
the country, at the point of service.
The central government made a conscious design choice to not use smartcards. The Unique Identification Authority of India (UIDAI), a unit established to
implement Aadhaar, did not want to restrict the use of biometric authentication
to applications requiring card readers (Dholabhai, 2012). A disadvantage to this
choice is that the system requires Internet connectivity to match a biometric input
with data stored in the CIDR. Technical errors due to poor Internet connectivity
are therefore a potential source of exclusion. Despite concerns raised by other
government agencies, the UIDAI maintained the view that with the expansion of
high-speed mobile networks, Internet connectivity would grow more reliable with
time, particularly in rural areas (Zelazny, 2012).
Another design choice for both smartcards and Aadhaar is where to set the
target accuracy for biometric authentication. Accuracy is dependent on the quality
of the biometric data that is captured when beneficiaries are enrolled. However, it
is also possible for an individual’s biometrics to change over time. For example,
fingerprints tend to wear off, and eye surgeries can alter iris texture patterns.
These can result in technical errors, due to a mismatch between the original
biometric records (captured during registration) and those being captured in real
time (Ramanathan, 2018; Nigam et al., 2019). Populations such as senior citizens
and casual laborers are particularly vulnerable to such authentication errors (Khera,
2019a, b).
One way to improve the match accuracy is to base authentication on multiple
biometrics rather on a single biometric. Accuracy levels with a combination of
fingerprints and iris scans are an order of magnitude better than using only one
or the other (UIDAI, 2012). With multiple biometrics, vulnerable populations
whose fingerprints have worn off can still authenticate themselves with iris scans.
With each additional biometric, the chances of duplication reduce, increasing the
accuracy of the biometric match.
The AP government based its smartcards project on fingerprints (of eight to
ten fingers). This may have been due to limitations in the storage capacity of
biometric data on smartcards. Aadhaar, on the other hand, is based on a multimodal system of biometric authentication; in addition to fingerprints, iris scans
can also be used. However, authentication through iris scans does depend on an
544
A. Nair and B. Eskici
additional hardware component that can read the iris. Without this, Aadhaar-based
authentication remains dependent on a single biometric.
3.2 Reforms in Payment Systems and Benefits Delivery
Prior to the introduction of biometric IDs, payments and benefits delivery systems
for welfare schemes in India were susceptible to delays and inefficiencies, imposing
significant costs for both households and the government. Beneficiaries incurred
significant time costs in travelling to bank branches and post offices to access
benefits. Governments lacked the ability to track and reconcile transactions in the
paper-based system, exacerbating the problem of leakages.
In contrast, biometric IDs linked to bank accounts allow for remote authentication of beneficiaries and the issuance of digital payments. Banks can also hire
agents (called business correspondents) to make last-mile payments to beneficiaries
using PoS devices that support biometric authentication. This eliminates the need
for beneficiaries of the NREGS or the SSP programs to travel to a bank branch
or a post office. Instead, payments can be made by business correspondents, at
the beneficiary’s doorstep. Figure 20.3 illustrates a sample process flow for a
biometrically enabled payment system.
Present Biometric
BENEFICIARY
Capture, Process,
and Match the
biometric data with
the back-end system
Back-end
Database
Unique Entry
Duplication or
Non-Existing
Entry
Successful
Authentication
Failed
Authentication
Make Payment if
biometric authentication
is successful
Business
Correspondent
Triggers payment
Bank account linked to
Biometric ID
State Government’s Treasury
Fig. 20.3 Process flow of a biometrically enabled payment system
Note: The blue arrows show the flow of funds from the state government’s treasury to the
beneficiary
20 Digital Public Services: The Development of Biometric Authentication in India
545
Biometric authentication on PoS devices also allows for digital record-keeping,
as digital receipts are generated for each transaction (Muralidharan et al., 2020b).
Governments can therefore reconcile each transaction made to beneficiaries. This
is useful particularly in the context of the PDS. The digital transaction records
created at an FPS allow the government to reconcile household purchases with
the subsidized food rations allocated to each shop. If an FPS dealer records
transactions of an amount lesser than the entitlements allocated, the government can
reduce future allocations, to adjust for the previous month’s balance. This penalty
disincentivizes the FPS dealer from over-reporting the volume of goods disbursed
to beneficiaries each month. Regular reconciliation can also, in principle, increase
government savings by restricting expenditures to only the quantity of commodities
required by beneficiaries.
4 Implementation Challenges
As this textbook argues, in order to achieve development impact, basic technologies
need to be modified and adapted for local context. The process of building an
appropriate biometric ID technology, and then implementing it on a large scale,
is not without challenges. As highlighted in the prior section, certain design choices
for biometric technology can lead to the exclusion of significant numbers of genuine
beneficiaries. In this section, we show how these choices resulted in exclusion errors
and how the two state governments in Andhra Pradesh and Jharkhand dealt with
challenges in each of the following steps involved in implementing a biometric
authentication system.
4.1 Enrollment of Beneficiaries
The most resource-intensive step in any biometric ID program is the enrollment
of individuals. In both the AP Smartcards and Jharkhand Aadhaar programs, the
government entered into partnerships with private service providers to execute
enrollment.
In the case of the AP government, it was difficult to incentivize private players
(mainly banks) to participate in the biometric program. Partnership with the
AP government required private service providers to bear the upfront cost of
infrastructure required for biometric smartcards, in return for a 2% commission on
each payment transaction. The government hoped that banks would view this as a
business opportunity, enabling them to establish a foothold in rural areas. However,
banks were uncertain about the profitability of the program and were therefore
reluctant to participate. The banks that did participate most likely did so under
pressure from the state government (Mukhopadhyay et al., 2013).
546
A. Nair and B. Eskici
These service providers faced a number of issues while enrolling beneficiaries.
There was a lack of coordination with local government officials, which resulted in
weak mobilization of beneficiaries at enrollment camps. Technical problems also
cropped up, including hardware and software glitches and errors in the lists of
eligible beneficiaries supplied by the AP government (ibid.).
Because a substantial share of beneficiaries remained unenrolled, the government
was concerned that the high volume of payments to non-enrolled beneficiaries
would re-open the door to corruption and leakages. They deployed two strategies in
response. First, to incentivize beneficiaries to enroll for smartcards, the government
ordered the stoppage of payments to non-enrolled beneficiaries. NREGS and SSP
funds were placed in suspended accounts until beneficiaries completed their enrollment. But due to the slow pace of enrollment, the government finally had to relax
its stance, allowing manual payments as long as beneficiaries were simultaneously
enrolling for biometric IDs. Second, the government tried eliminating commissions
for payments that were not biometrically authenticated. The enforcement of this rule
required government officials to regularly monitor transaction-level data. However,
the government was unable to enforce this rule, as banks were slow to respond to
the government’s requests for detailed transaction-level data (ibid.).
Unlike in AP, enrollment in Jharkhand took place at a rapid pace. The government of Jharkhand’s efforts of introducing biometric authentication in the PDS had
the advantage of being built on top of the national biometric ID program – Aadhaar
which was already being rolled out by the central agency, the UIDAI.
The UIDAI worked through state governments to hire private entities known as
enrollment agencies. These had to be certified by the UIDAI to carry out enrollment
(Sathe, 2014; Sen, 2019). Contracted agencies set up mobile Aadhaar enrollment
centers. At these centers, fingerprints for all ten fingers and iris scans were obtained.
Individuals also were required to submit existing identity documents as proof of
their demographic details (including name, address, date of birth, and gender). The
information collected by the enrollment agency was then encrypted and sent to the
UIDAI, which would compare the incoming data with data already stored on the
CIDR to check for duplicates. If there were no duplicates, the UIDAI would generate
a 12-digit unique ID number (called the Aadhaar number) and issue a card by post,
with the individual’s Aadhaar number and demographic details. If there were any
discrepancies identified in the deduplication step, the individual would be informed
of next steps for remediation (Misra, 2019). The enrollment agencies were paid a
commission for every successful enrollment (Zelazny, 2012).
Over the course of a decade, the UIDAI issued over a billion cards to Indian
residents. This was aided by the incentive structure the UIDAI had put in place
(i.e., a fixed incentive paid for each successful enrollment). The Government of
India also made Aadhaar enrollment mandatory for a number of welfare schemes
(including the PDS and the NREGS) and made the Aadhaar card a legitimate
identity document for a variety of other purposes (Perrigo, 2018).
The Aadhaar incentive structure and rapid pace for enrollments did, however,
have an impact on the quality of data collected by enrollment agencies and made
enrollment vulnerable to malpractice. Demographic data collected by enrollment
20 Digital Public Services: The Development of Biometric Authentication in India
547
agencies were prone to error, since they were dependent on the quality of paper
documents submitted. Misspelt names and incorrect dates of birth have been widely
reported (Khera, 2019a, b). In addition, mix-ups in biometric data were reported,
with the biometrics of one family member mixed together with other family
members’ records (Mohammed, 2018).
Ultimately, the Indian government had to blacklist 34,000 enrollment agencies
in the period 2010–2017 (Hebbar, 2017). Reasons for dismissal from the program
included charging individuals a fee for enrollment (even though enrollment for
Aadhaar was supposed to be free) and using weak security protocols that led to leaks
in the demographic data of a large number of applicants (Khaira, 2018; Surabhi,
2017). As with AP Smartcards, technical issues in enrollment were also common,
especially in remote areas. This made it difficult for individuals in some regions to
apply for Aadhaar cards (Matthew, 2019). Those lacking high-quality biometrics
and those unable to physically travel to an enrollment agency (owing to disability or
old age) found it difficult to enroll (Drolia, 2018).
4.2 Deduplication of Records
To ensure that the same individual is not able to obtain more than one biometric
ID, it is important to run regular deduplication checks using algorithms that can
accurately identify duplicates. In AP, the government made banks responsible
for carrying out deduplication checks. With deduplication, the state hoped to
establish a clean beneficiary database of eligible and legitimate beneficiaries for
its welfare schemes. However, banks made limited progress in implementing robust
deduplication checks. As the development of advanced deduplication software was
still in its early stages, banks were at best able to carry out rudimentary checks, such
as a village-level text deduplication of beneficiaries (Mukhopadhyay et al., 2013).
In comparison, Aadhaar’s software and hardware architecture enabled superior
detection of duplicates. The system uses multiple biometrics (fingerprints and iris
scans) for authentication, and the underlying data are stored in a central server called
the CIDR. While a biometric database of ten fingerprints can ensure a deduplication
accuracy of more than 95%,6 with iris scans, the accuracy can increase to more
than 99%. However, as noted earlier, the accuracy rates are highly dependent on the
quality of data collected during the enrollment stage (UIDAI, 2009).
6 This is referred to as the true acceptance rate (TAR) of a biometric system and is a measure of
the number of times a biometric system can correctly verify an individual’s claim of identity. For
example, a TAR of 95% implies that if 10% of individuals in a population of 1000 try to register
for a biometric ID twice, the system would incorrectly generate duplicate biometric IDs for 5
individuals. Similarly, for a population of 1.2 billion, this would imply duplicate biometric IDs
for 6 million individuals. An increase in the TAR to 99% brings this number down to 1.2 million
individuals.
548
A. Nair and B. Eskici
As deduplication algorithms had never been tested at this scale, the UIDAI
decided to select three vendors rather than one. It hoped that competition among
the three vendors would yield greater accuracy. The vendors were paid according to
the number of deduplication checks they were able to carry out, and the accuracy of
the checks determined the allocation of payments across the three vendors (Sharma,
2016). It is not technically feasible for any deduplication algorithm to achieve 100%
accuracy, so there is always a possibility of duplicate Aadhaar cards being generated
for the same individual (Abraham et al., 2018; Agarwal, 2013). Given the scale
at which the program has been rolled out, and challenges with the quality of the
enrollment process, accuracy rates of more than 99% for a population of over one
billion can still create a substantial number of duplicates7 (Matthews, 2016; Zelazny,
2012).
4.3 Authentication of Identity
Errors in authentication occur when genuine beneficiaries are unable to authenticate themselves using biometric IDs. This can occur for many reasons, and
the consequences can be severe: authentication errors without a manual override
option (which is discussed in the next section) can strip beneficiaries of their legal
entitlements.
In AP, biometric data were stored on the smartcard itself, so authentication could
occur offline. However, the system was still prone to authentication errors, mainly
due to technical problems with the PoS machines used. In some cases, the PoS
reader was unable to recognize fingerprints, despite multiple attempts; in other
cases, intermittent lack of power rendered the POS devices useless. Another source
of authentication errors was the poor quality of biometric and demographic data
collected during enrollment (Mukhopadhyay et al., 2013).
Aadhaar has been vulnerable to some of the same authentication errors experienced in the AP Smartcards program. In addition, it has suffered from poor
Internet connectivity in some regions. With biometric data stored on a central
server (the CIDR), all real-time authentication requests require connectivity to the
Internet. In rural areas with poor Internet connectivity, online authentication proved
a major challenge and a cause for significant exclusion of beneficiaries from welfare
schemes (Dreze et al., 2017; Sneha, 2017).
The UIDAI did create certain alternatives to online authentication, although
their use has been limited. One such alternative is the use of a one-time password
(OTP) sent to the mobile number linked to an individual’s UID. However, the use
of an OTP naturally requires an active mobile phone number with good mobile
connectivity. Early on, mobile phone ownership and connectivity were still lacking
7 The results of an intervention implemented by an NGO at a small scale, for example, may be very
different if the same intervention is rolled out by a state/provincial government at a much larger
scale.
20 Digital Public Services: The Development of Biometric Authentication in India
549
in rural areas in India, especially in states with low teledensity such as Jharkhand.
Administrative errors in the linkage of mobile numbers to Aadhaar IDs – including
the entry of incorrect mobile numbers during enrollment, and the use of “head
of household” mobile numbers rather than individuals’ numbers – reduced the
reliability of the OTP alternative (Dreze et al., 2017; Muralidharan et al., 2020b).
In addition, awareness of this fallback mechanism has been quite low (Abraham
et al., 2018).
A second alternative for offline Aadhaar authentication is the use of offline
PoS devices. Offline PoS devices capture the beneficiary’s fingerprints but cannot
perform real-time authentication. Beneficiaries can still collect their entitlements
after scanning their fingerprints. The operators of the offline PoS devices are
required to regularly synchronize their transaction logs with the central government
server by accessing the Internet. To ensure that logs are regularly synchronized, new
transactions are not authorized if the operator has not synchronized earlier logs.
To minimize inclusion errors (wherein non-eligible beneficiaries access welfare
schemes), the use of PoS devices for offline authentication had been limited to areas
with extremely poor connectivity (Muralidharan et al., 2020b).
Another source of authentication errors in Jharkhand was the incomplete or
incorrect linking of Aadhaar IDs with existing government beneficiary records, such
as that of the PDS. Once beneficiaries of the PDS had obtained an Aadhaar ID, they
were required to link their Aadhaar numbers with their existing PDS ration card
numbers, a process known as “seeding.” This was a non-trivial process and imposed
significant costs on beneficiaries, as they often had to make repeated trips to their
local government offices to ensure that ration cards had been seeded. Families with
even a single member lacking the seeded ration card were unable to access their
PDS benefits. The seeding process was also prone to data entry errors (Dreze et al.,
2017; Sneha, 2017).
4.4 Manual Overrides
Given the many challenges described so far, there have been legitimate concerns
that making biometric IDs mandatory for public benefits can lead to exclusion of
genuine beneficiaries. To reduce exclusion errors, one approach is to create manual
overrides. This entails the use of non-biometric authentication, for use when it is
impossible to biometrically authenticate an individual. However, manual overrides
bring the risk of increased inclusion errors. In the absence of sound protocols for
manual overrides, non-eligible beneficiaries can easily access welfare schemes,
undermining one of the primary benefits of biometric ID programs.
As discussed earlier, a significant proportion of beneficiaries in AP were never
enrolled for biometric smartcards, because the government was unable to incentivize
banks and beneficiaries to increase their participation in the smartcard system.
This resulted in heavy reliance on manual overrides. Business correspondents
continued to make payments (in cash) to unenrolled beneficiaries and to individuals
unable to biometrically authenticate themselves. To minimize inclusion errors, the
550
A. Nair and B. Eskici
override protocol required business correspondents to authenticate using paperbased ID documents, and for record-keeping, beneficiaries were made to stamp their
fingerprints on a pre-filled beneficiary roster (Mukhopadhyay et al., 2013).
In Jharkhand, Aadhaar was in effect a mandatory requirement for accessing
welfare schemes such as the PDS; and compared to AP, the use of manual overrides
was limited. Offline PoS machines and OTPs were the only fallback options
available to those with an Aadhaar ID who could not authenticate biometrically
(Dreze et al., 2017). Those without an Aadhaar card (and those whose entire family
had failed to “seed” their Aadhaar cards with the ration database) were, in effect,
excluded from the PDS. Although the central government did issue notifications to
maintain exemption mechanisms, these mechanisms were rarely used (Dutta, 2019).
4.5 Political Buy-In
The successful implementation of any large-scale reform hinges on strong political
support. This is often hard to achieve, as government officials and frontline service
delivery workers who have benefited under the status quo have little incentive
to ensure that reforms are successfully implemented – even when these reforms
improve welfare outcomes for society as a whole (Hoff & Stiglitz, 2008; Olson,
1965). Fortunately, AP’s smartcard program had strong political support among
senior state government officials. Senior bureaucrats invested significant time and
effort to ensure that the smartcards were successfully rolled out. The AP government
was also strongly committed to making welfare schemes such as the NREGS and
the SSP easily accessible for beneficiaries. This is reflected in the fact that the state
had one of the highest fund utilization rates for welfare schemes in the country
(Mukhopadhyay et al., 2013).
However, support for the program from local government officials (at the district
and sub-district levels) was weak, and this hampered progress in implementing
the reform. In addition, business correspondents (BCs) hired by banks to deliver
payments to beneficiaries became a sought-after position, which politicized the
process of selecting BCs. Politicians would lobby for their own candidates, for
political gains. This stalled the selection process in many villages, affecting the
delivery of payments. There were also instances of active resistance to the smartcard
program from local government officials, and local officials were more likely to
convey negative anecdotes about the reform. In fact, opposition from local officials
was strong enough for the government to consider abandoning the reform in 2013
(ibid.).
Aadhaar, on the other hand, received strong support early on from important
decision-makers in the central government. This helped the program gain political
mileage, despite opposition from prominent politicians and external actors related to
exclusion risks and privacy concerns (Misra, 2019). Importantly, Aadhaar aligned
with the government’s objective of reducing the fiscal burden from leakages
in welfare schemes (Government of India, 2015). Indeed, fiscal savings from
biometric authentication was the primary benefit highlighted in government reports
20 Digital Public Services: The Development of Biometric Authentication in India
551
of Aadhaar pilots in various welfare schemes (Dreze & Khera, 2018; Government
of India, 2016). A change in the central government’s ruling party midway through
the program’s implementation had little impact on the pace at which the Aadhaar
cards were issued to Indian residents and linked with welfare schemes (Sathe, 2014).
State governments that implemented Aadhaar-Based Biometric Authentication
(ABBA) in their welfare schemes devoted significant resources to the reform,
following the central government’s policy priority of reducing leakages. At the
time, state-level reforms were politically popular thanks to strong voter support for
reforms addressing corruption and fraud (Sukhtankar & Vaishnav, 2015). As such,
the Jharkhand government was willing to institute ABBA in its welfare schemes
even if it came at the cost of excluding some genuine beneficiaries (Muralidharan
et al., 2020b).
The Jharkhand government’s main policy priority was to increase fiscal savings
through ABBA, and this is reflected in the limited use of manual overrides. The state
also increased the rate of beneficiary deletion from the PDS rolls shortly before
ABBA was introduced. The government claimed that beneficiary names lacking
an Aadhaar number were primarily “ghost” beneficiaries. The government also
decided to reconcile grain stocks at PDS shops, with the aim of reducing its expenses
on the PDS. Reconciliation entailed adjusting the delivery of commodity grains to
shops based on earlier transaction records. Reconciliation proved quite unpopular, as
FPS dealers generally passed a significant proportion of the government’s reduction
in benefits along to beneficiaries. In fact the government had to temporarily suspend
and relax its reconciliation protocols in the face of opposition from FPS dealers and
beneficiaries (ibid.).
4.6 Innovation and Iteration at Scale
The implementation challenges highlighted here illustrate how biometric ID technology, like any other technological innovation, must be iteratively modified to the
context in which it is being deployed. The digital identity solutions deployed in
AP and Jharkhand were influenced not only by technology design decisions but
also by the broader financial ecosystem and local policy environment. As solutions
were scaled across India by UIDAI, the database architecture and hardware became
somewhat fixed; but variation in delivery was facilitated through policy and protocol
design. Banks needed the right incentives, and state-level agencies needed tools
to monitor implementation to ensure that the gains from innovation were reaching
beneficiaries. In line with the framework for Development Engineering outlined in
this book, the features of the solution were continuously revisited and modified as
implementation expanded.
One lesson from this is the importance of researchers engaging with governments
and not shying away from the politics of implementation. As this case study
demonstrates, the AP and Jharkhand governments weighed the benefits from
reduced leakages against the accompanying increase in exclusion errors resulting
from biometric authentication. Their decisions were ultimately a function of policy
552
A. Nair and B. Eskici
priorities. The AP government’s focus on improving beneficiary experience explains
some of the design details of AP Smartcards, including their commitment to offline
authentication, manual overrides, and payments to non-enrolled beneficiaries. The
Jharkhand government’s focus on fiscal savings explains why Aadhaar was in
effect made mandatory for access to welfare services and why limited override
mechanisms were made available for beneficiaries.
5 Results from Large-Scale Evaluations
Whether a technological innovation can be viewed as contributing to economic
development depends on the rigor with which it is evaluated. A priori, it was
unclear whether welfare beneficiaries in India would be better off with biometric
IDs since these systems can exclude real beneficiaries. They can be very costly,
and faulty implementation can compromise performance. It is important to measure
rates of inclusion and exclusion, and other user experiences, to assess the overall
welfare impacts of such a large-scale program. In addition, the massive scale of
deployment of digital IDs across multiple states of India made evaluation crucial
for understanding impacts on the broader economy. Implementation within large
geographies can create unique dynamics that are never captured by small-scale
evaluations.
Here, we will describe the results of two large-scale randomized evaluations
implemented by the Payments and Governance Research Program (Muralidharan
et al., 2016, 2020b). What makes these evaluations unique is the scale at which they
were conducted, across two varied contexts.
5.1 Experimentation at Scale
The use of RCTs to evaluate the impact of welfare programs has become a common
tool in social science research. RCTs involve randomly assigning a treatment (or
policy intervention) across a population and then comparing outcomes of those who
receive the intervention with those who do not. As treatment and control groups
are randomly assigned, RCTs generate credible estimates of the causal impact of an
intervention, within the context of the population under study.
There have been concerns about the representativeness of results from RCTs
beyond the immediate context of the study sample. If the study’s sample is not
representative of the population a government is interested in, which findings can be
generalized? How should the evidence from a small trial inform a larger-scale policy
intervention? (see footnote 7) Spillover effects – in particular, how the effects of the
intervention interact with those who do not receive the intervention – can become
pronounced at large scale. An evaluation that does not measure how changes in
20 Digital Public Services: The Development of Biometric Authentication in India
553
welfare programs affect the wider economy8 may underestimate the impact of an
intervention like biometric IDs (Muralidharan & Niehaus, 2017).
The researchers on the team dealt with these issues by carrying out RCTs at scale,
which offers the following benefits:
1. The studies consist of samples that are representative of larger populations.
2. The unit of randomization9 is selected such that it is large enough to capture
spillover effects.10
3. The evaluations can credibly estimate the impact of policies that are implemented
by governments at a large scale.
Given the nature of these evaluations, the results can provide valuable input on
the impacts of biometric ID systems for policymakers in other developing countries.
5.2 Results from the Evaluation of AP Smartcards
The evaluation of AP’s smartcards initiative was made possible by an unexpected
glitch in the program’s roll-out. Because of the challenges in beneficiary enrollment
described earlier, there were still pockets in AP where smartcard coverage was
limited circa 2009. In eight districts, the banks responsible for enrollment had
made little progress, so the project needed to be re-launched in these areas. The
re-launch in 2010 provided a unique opportunity to randomize the roll-out of the
intervention, enabling the first randomized evaluation of a large-scale biometric ID
program (Muralidharan et al., 2016).
The study leveraged the phased introduction of biometric smartcards across
20 million beneficiaries in the eight districts; the results would therefore be
representative of a large population. For the study, 112 sub-districts were randomly
assigned to receive smartcards immediately (treatment sub-districts), while 45 subdistricts were randomly selected to receive the smartcards 2 years later (control
sub-districts). In control sub-districts, the status quo mode of non-biometric authentication continued. By selecting a large unit of randomization (i.e., the sub-district
with an average population of 70,000), the study team was able to measure spillover
effects of the Smartcards program on broader economic outcomes.
The main outcomes of interest for the study were (1) beneficiary experience and
satisfaction with NREGS and SSP and (2) leakage from the programs. Beneficiary
experience was captured through household surveys. Leakage was measured as the
difference between the dollar value of welfare benefits disbursed by the government
8 For example, as we show later, an improvement in access to the NREGS forced landowners in
Andhra Pradesh to increase the wages for laborers as the laborers now had better outside options.
9 The unit of randomization essentially refers to the level at which the treatment/policy is
introduced. For example, the policy may be introduced randomly across individuals in which case
the unit of randomization would be at the individual level, or it may be introduced randomly across
sub-districts in which case the unit of randomization is at the sub-district level.
10 For example, if the unit of randomization is the village or the sub-district, then researchers can
capture spillovers at the village or sub-district level.
554
A. Nair and B. Eskici
(obtained from administrative records) and the value received by beneficiaries, net of
transaction costs incurred by beneficiaries in accessing the various welfare schemes
(as reported in surveys).
By July 2012, 2 years after the roll-out of the intervention, only 50% of
payments were being made via biometric smartcards in treatment sub-districts.
However, despite low enrollment, the evaluation found that payments were faster
and more predictable – especially for beneficiaries of the NREGS in treatment
sub-districts. Beneficiaries in treatment sub-districts spent significantly less time
collecting payments, and they received their payments earlier. On the leakage front,
the evaluation found an increase in earnings of NREGS and SSP beneficiaries in
treated areas. This increase in earnings did not coincide with any major increases
in government outlays, suggesting a significant reduction in the leakage of funds.
Indeed, leakage in treatment areas was estimated to have reduced by 12.7 percentage
points for NREGS beneficiaries and 2.7 percentage points for SSP beneficiaries.
These results may be explained by a reduction in government officials pocketing
money for beneficiaries who neither worked nor claimed payments. Biometric
IDs had made it harder for officials to over-report, since biometric authentication
requires beneficiaries to be physically present to verify and receive payment.
Decomposing the effects in treatment areas further, the evaluation found that
improvements in payment timeliness were concentrated entirely in villages that
had shifted to the new smartcard-linked payment system. In these villages, timeliness improved regardless of whether or not beneficiaries had received biometric
smartcards although the reduction in leakages was concentrated entirely among
beneficiaries who had received biometric smartcards. These results suggest that the
organizational reforms associated with the new payment system – which shifted the
responsibility for payments from local government officials over to banks – were
a key factor in improving the quality of service delivery and the possession of a
biometric ID was key to reducing leakages.
Interestingly, the AP Smartcards program also had a positive impact on the wider
economy. In treatment sub-districts, the introduction of smartcards led to broad
increases in the earnings of the poor. Most of this came from sources other than
the NREGS, suggesting increases in market wages and employment. This helped
increase the bargaining power of workers in the labor market, who now had better
outside options (Muralidharan et al., 2020a). The evaluation was instrumental in
showing that biometric ID systems can have a positive impact both directly –
by improving beneficiary experience and reducing leakages – and indirectly, via
positive spillover effects on market wages.
5.3 Results from the Evaluation of Aadhaar in Jharkhand
As Aadhaar was rolled out across India, Jharkhand (and its state PDS program)
became one of the frontrunners in completing the prerequisites for participation.
After being satisfied with the results from small-scale pilot deployments, the Jhark-
20 Digital Public Services: The Development of Biometric Authentication in India
555
hand government scaled up biometric authentication to ten districts. To evaluate the
impacts of the reform, Jharkhand’s government agreed to randomize the ordering
of the roll-out across 15 million beneficiaries in the 10 districts. This was after the
results of the AP experiment had been shared, building interest of the government
in collaborating with the research team (Muralidharan et al., 2020b).
Similar to AP, the roll-out was randomized at the level of a large administrative
unit, to capture spillover effects. In the experiment, 132 sub-districts were randomly
selected to receive ePoS devices supporting ABBA, of which 87 sub-districts
(treatment) would receive the ePoS devices first and the remaining 45 sub-districts
(control) would receive the ePoS devices at a later stage.
The first phase of the study consisted of introducing ABBA into the PDS
treatment group, without any reconciliation based on FPS transaction data. Despite
Jharkhand being a relatively low capacity state, by the time of the follow-up surveys,
96% of the shops in treatment areas had introduced ePoS devices, and 91% reported
regularly using the devices to biometrically authenticate and record transactions.11
The evaluation results demonstrated a limited impact of ABBA on leakage:
the value of food entitlements received by beneficiaries did not vary significantly
between treatment and control groups. In addition, the reform did not decrease
government spend on food entitlements in treatment areas, suggesting the reform did
not reduce diversion of goods to the black market. However, the use of ABBA came
at a cost to beneficiaries. Many beneficiaries made multiple unsuccessful trips to the
FPS before they were able to authenticate and access food entitlements, resulting in
a 17% increase in transaction costs for those in treatment sub-districts. The reform
also had a significant negative impact on the value of food entitlements for certain
subgroups. For households with a single member failing to seed their Aadhaar card
with a ration card, the reform led to a significant drop in the value of rice and wheat
received and increased the probability of receiving no commodities at all.
Shortly after ABBA was introduced in the control districts, the state government
introduced stricter reconciliation protocols. This “second phase” of intervention
involved the government adjusting downward the amount of grain disbursed to
each FPS, reflecting stocks that the FPS should have maintained (based on digitized
transaction records from prior months). Reconciliation was introduced at the same
time in both control and treatment sub-districts, but treatment areas had ePoS
devices for a longer period of time (11 months) than control sub-districts (2 months).
So in treatment areas, 11 months’ worth of commodities diverted away from
beneficiaries would have been adjusted for at the introduction of reconciliation. The
analysis suggests that stricter reconciliation of commodities did reduce leakage.
11 This difference was mainly because enrollment rates for Aadhaar cards were already quite high
prior to it being introduced in Jharkhand’s PDS. The central government had made high Aadhaar
coverage and ABBA for welfare schemes a nationwide priority. In AP, there was no supporting
infrastructure such as Aadhaar that was available to the state government (Muralidharan et al.,
2020b).
556
A. Nair and B. Eskici
In treatment sub-districts, reconciliation led to a sharper decrease in the value of
food grains disbursed by the government, relative to control sub-districts. It also
coincided with a sharp reduction in the value of goods received by households
in treatment sub-districts. According to the reconciliation protocols used by the
government, since FPS dealers in treatment areas had ePoS devices for longer,
they were more likely to have undisbursed food grains captured in transaction
records. But in practice, it was more likely that FPS dealers had already diverted
the undisbursed grains to the open market. This explains why there was a sharper
decrease in grains disbursed to households in the treatment sub-districts after
reconciliation.
Had the government decided not to hold FPS dealers accountable for past
diversions – and had the government given all dealers a “fresh start” – a more
favorable outcome may have been obtained. Starting reconciliation on a “clean
slate” basis (rather than basing disbursements on past transaction records) would
have achieved a more modest reduction in leakage, with minimal impact on the value
received by beneficiaries. These results show that the introduction of biometric IDs
in Jharkhand, on its own, did not reduce leakage. But combined with reconciliation,
there was a reduction in leakage that coincided with a sharp reduction in the value
of benefits received by beneficiaries of the PDS.
5.4 Summary
In both states, the introduction of biometric IDs coupled with other reforms (such
as reconciliation in Jharkhand) did lead to a substantial reduction in leakage of
benefits. However, in AP, the benefits from the reduction of leakage were passed
onto beneficiaries, whereas in Jharkhand, the main policy priority was to increase
fiscal savings, which ultimately resulted in beneficiary loss. The policy implication
is that while biometric IDs can bring down leakages, differences in program and
technology design can have an important bearing on whether beneficiaries gain or
lose.
6 Conclusions
The studies discussed in this chapter demonstrate that technological interventions
like biometric IDs have the potential to increase state capacity and improve last-mile
service delivery in developing countries. However, differences in policy priorities
and the details of solution design influence the extent to which households benefit
from the digitization of welfare schemes.
20 Digital Public Services: The Development of Biometric Authentication in India
557
Results from two large-scale evaluations find that more accurate biometric ID
systems, coupled with payments and policy reforms, reduced leakages in welfare
schemes in two different states in India. However, there were varying results.
In Jharkhand, reduced fiscal leakage came at the expense of excluding genuine
beneficiaries who were unable to meet new standards for identification. Exclusion of
beneficiaries was low in Andhra Pradesh, where the government was more focused
on improving beneficiary experience with welfare programs.
Differences in policy priorities of the two states are reflected in differences
in the design of the two ID programs. Manual overrides were available for
those unable to biometrically authenticate themselves in AP, but limited overrides
were made available to beneficiaries of the PDS in Jharkhand. The use of past
transaction records to reconcile grain stocks, combined with the deletion of ration
cards from old beneficiary rolls, underlines the Jharkhand government’s priority
of fiscal savings. These policies are arguably legitimate political choices. ABBA
was introduced into Jharkhand at a time when there was a strong public movement
in India against corruption and there was a push from the central government
to roll out ABBA in social service delivery. Despite reports of exclusion and
preventable starvation deaths, surveys of beneficiaries indicated that while views
were polarized,12 there was still strong support for Aadhaar reforms to the PDS
(Muralidharan et al., 2020b). This highlights that reforms that are harmful to a
significant minority can still be politically viable, if they are perceived as being
in the larger public interest.
The evaluations also highlight the importance of incorporating regular data
collection on beneficiary experience as part of any large-scale technology reform.
For example, in AP with access to only administrative data, one may have
mistakenly concluded that there was no reduction in leakage, as there was no change
in government expenditure. Households’ surveys showed otherwise. Conversely, in
Jharkhand, one might conclude that there was a sharp reduction in leakage due
to the reduction in government expenditure post-reconciliation. As we now know,
Jharkhand’s reduction in government expenditure post-reconciliation came at the
cost of excluding eligible beneficiaries and reducing their overall benefits.
Ultimately, the design of technologies for public service delivery is highly
political. There are many non-technical failures in the performance of digital
identity solutions, and these expose the governance challenges underlying any
public sector technology solution.
Discussion Questions
1. Is there a trade-off between inclusion (which leads to leakage) and exclusion
errors? If yes, how should governments weigh the trade-off between inclusion
and exclusion errors?
12 The ruling government in Jharkhand at the time ABBA was introduced in fact lost its majority
in the next elections.
558
A. Nair and B. Eskici
2. In addition to the manual overrides discussed in this chapter, are there any other
technical/non-technical solutions to the problem of exclusion errors?
3. What role can civil society play in protecting citizens from potential misuse of
biometric data?
4. Should the Government of Jharkhand have introduced a “clean slate” reconciliation of PDS stocks, to protect beneficiaries from loss of benefits? Could they
have known, ex ante, that it would have disadvantaged beneficiaries?
5. The AP Smartcards program has since been replaced with Aadhaar. Was the state
government wise to experiment with a local, offline smartcards solution, given
the high costs of transitioning to the central government’s Aadhaar technology?
References
Abraham, R., Bennett, E. S., Bhushal, R., Dubey, S., Li, Q., Pattanayak, A., & Shah, N. B. (2018).
State of Aadhaar report 2017–18. Technical report, IDinsight.
Agarwal, S. (2013, March 5). Duplicate Aadhaar numbers within estimates: UIDAI. Mint.
Alkire, S., & Seth, S. (2013). Selecting a targeting method to identify BPL households in India.
Social Indicators Research, 112(2), 417–446. https://doi.org/10.1007/s11205-013-0254-6
Asian Development Bank. (2016). Identity for development in Asia and the Pacific. Asian
Development Bank.
Banerjee, S., & Sharma, S. (2018). An offline alternative for Aadhaar-based biometric authentication. Ideas for India. https://www.ideasforindia.in/topics/productivity-innovation/an-offlinealternative-for-aadhaar-based-biometric-authentication.html
Bardhan, P. (1997). Corruption and development: A review of issues. Journal of Economic
Literature, 35(3), 1320–1346.
Bhatia, R. (2018, October 5). The Indian Government’s astonishing hunger for citizen data. The
New York Times.
Census of India. (2003). Project review: Multi-purpose national identity card. eCensus India. Issue
17.
Dahir, A. L. (2020, January 28). Kenya’s new digital IDs may exclude millions of minorities. The
New York Times.
Dholabhai, N. (2012, January 8). Unique ID better than PC smart card: Montek. The Telegraph.
Dreze, J. (2016, March 15). The Aadhaar Coup. The Hindu.
Dreze, J., Khalid, N., Khera, R., & Somanchi, A. (2017). Aadhaar and food security in Jharkhand
pain without gain? Economic & Political Weekly, 52(50), 50–59.
Dreze, J., & Khera, R. (2015). Understanding leakages in the public distribution system. Economic
& Political Weekly, 50(7), 39–42.
Dreze, J., & Khera, R. (2018, February 8). Aadhaar’s $11-bn question. The Economic Times.
Drolia, R. (2018, February 15). 81 year old seeks exemption for super elderly. The Times of India.
Dutta, P. (2008). The performance of social pensions in India: The case of Rajasthan. SP
Discussion Paper No. 0834. World Bank.
Dutta, P., Murgai, R., & Howes, S. (2010). Small but effective: India’s targeted unconditional cash
transfers. Economic & Political Weekly, 45(52), 63–70.
Dutta, S. (2019, February 8). Refusing to learn from tragedy, Jharkhand Demands Aadhaar for
rations. The Wire.
Ferraz, C., Finan, F., & Moreira, D. B. (2012). Corrupting learning. Journal of Public Economics,
96(9–10), 712–726. https://doi.org/10.1016/j.jpubeco.2012.05.012
Gelb, A., & Metz, D. A. (2018). Identification revolution: Can digital ID be harnessed for
development? Center for Global Development.
20 Digital Public Services: The Development of Biometric Authentication in India
559
Global Hunger Index Scores by 2020 GHI Rank. https://www.globalhungerindex.org/ranking.html.
Accessed 28 Dec 2020.
Goldberg, J., Gine, X., & Yang, D. (2010). Identification strategy: A field experiment on dynamic
incentives in rural credit markets. Policy Research Working Papers. https://doi.org/10.1596/
1813-9450-5438
Government of India. (2001). Report of the Group of Ministers on National Security.
Government of India, Ministry of Finance. (2015). Economic Survey 2014–15.
Government of India, Ministry of Finance. (2016). Economic Survey 2015–16.
Government of India, Ministry of Finance. (2020). Economic Survey 2019–20.
Hebbar, N. (2017, April 12). Aadhaar robust; the poor have no complaints about it: Ravi Shankar
Prasad. The Hindu.
Hoff, K., & Stiglitz, J. E. (2008). Exiting a lawless state. The Economic Journal, 118(531), 1474–
1497. https://doi.org/10.1111/j.1468-0297.2008.02177.x
Khaira, R. (2018, January 3). Rs 500, 10 minutes, and you have access to billion Aadhaar details.
The Tribune.
Khera, R. (2019a, March 10). The many pitfalls of Aadhaar. The Hindu Business Line.
Khera, R. (2019b). Aadhaar failures: A tragedy of errors. Economic and Political Weekly. https://
www.epw.in/engage/article/aadhaar-failures-food-services-welfare
Matthew, A. (2019, October 21). Aadhaar failure: Several thousands in three districts in Odisha
denied ration for two months. National Herald.
Matthews, H. V. (2016). Flaws in the UIDAI process. Economic & Political Weekly, 51(9), 74–78.
Misra, P. (2019). Lessons from Aadhaar: Analog aspects of digital governance shouldn’t be
overlooked. Pathways for Prosperity Commission.
Mohammed, A. (2018, July 26). Biometric mix-up affects nearly 2 crore Aadhaar holders. The
New Indian Express.
Mookherjee, D. (2014). MNREGA: Populist leaky bucket or successful anti-poverty Programme?
Ideas for India. https://www.ideasforindia.in/topics/poverty-inequality/mnrega-populist-leakybucket-or-successful-anti-poverty-programme.html
Mukhopadhyay, P., Muralidharan, K., Niehaus, P., & Sukhtankar, S. (2013). Implementing a
biometric payment system: The Andhra Pradesh experience. Technical Report. University of
California, San Diego.
Muralidharan, K., Das, J., Holla, A., & Mohpal, A. (2017). The fiscal cost of weak governance:
Evidence from teacher absence in India. Journal of Public Economics, 145, 116–135. https://
doi.org/10.1016/j.jpubeco.2016.11.005
Muralidharan, K., & Niehaus, P. (2017). Experimentation at scale. Journal of Economic Perspectives, 31(4), 103–124. https://doi.org/10.1257/jep.31.4.103
Muralidharan, K., Niehaus, P., & Sukhtankar, S. (2016). Building state capacity: Evidence from
biometric smartcards in India. American Economic Review, 106(10), 2895–2929. https://
doi.org/10.1257/aer.20141346
Muralidharan, K., Niehaus, P., & Sukhtankar, S. (2020a, March). General equilibrium effects of
(improving) public employment programs: Experimental evidence from India. Working paper
23838, National Bureau of Economic Research.
Muralidharan, K., Niehaus, P., & Sukhtankar, S. (2020b). Identity verification standards in welfare
programs: Experimental evidence from India. https://doi.org/10.3386/w26744.
Niehaus, P., Atanassova, A., Bertrand, M., & Mullainathan, S. (2013). Targeting with agents. American Economic Journal: Economic Policy, 5(1), 206–238. https://doi.org/10.1257/pol.5.1.206
Niehaus, P., & Sukhtankar, S. (2013). The marginal rate of corruption in public programs:
Evidence from India. Journal of Public Economics, 104, 52–64. https://doi.org/10.1016/
j.jpubeco.2013.05.001
Nigam, I., Keshari, R., Vatsa, M., Singh, R., & Bowyer, K. (2019). Phacoemulsification cataract
surgery affects the discriminative capacity of iris pattern recognition. Scientific Reports, 9(1).
https://doi.org/10.1038/s41598-019-47222-4
560
A. Nair and B. Eskici
Olken, B. A. (2006). Corruption and the costs of redistribution: Micro evidence from
Indonesia. Journal of Public Economics, 90(4–5), 853–870. https://doi.org/10.1016/
j.jpubeco.2005.05.004
Olken, B. A., & Pande, R. (2012). Corruption in developing countries. Annual Review of
Economics, 4(1), 479–509. https://doi.org/10.1146/annurev-economics-080511-110917
Olson, M. (1965). Logic of collective action: Public goods and the theory of groups (Harvard
economic studies. v. 124). Harvard University Press.
Pai, S. (2013, December 29). Delayed NREGA payments drive workers to suicide. Hindustan
Times.
Perrigo, B. (2018, September 28). India has been collecting eye scans and fingerprint records from
every citizen. Here’s what to know. Time.
Pritchett, L. (2009). Is India a flailing state?: Detours on the four lane highway to modernization.
HKS Faculty Research Working Paper Series RWP09-013.
Ramanathan, U. (2018, September 29). More equal than others. The Indian Express.
Reinikka, R., & Svensson, J. (2001). Explaining leakage of public funds. Policy Research Working
Papers. https://doi.org/10.1596/1813-9450-2709.
Sathe, V. (2014). Managing massive change: India’s Aadhaar, the world’s most ambitious ID
project (innovations case narrative: Project Aadhaar). Innovations: Technology, Governance,
Globalization, 9(1–2), 85–111. https://doi.org/10.1162/inov_a_00204
Sen, S. (2019). A decade of Aadhaar: Lessons in implementing a foundational ID system. ORF
Issue Brief No. 292. Observer Research Foundation.
Sharma, R. S. (2016). UIDAI’s public policy innovations. NIPFP Working Paper Series No. 176.
National Institute of Public Finance and Policy, New Delhi.
Singh, S. (2020, February 9). Once upon a time, a national ID project found: Complicated to prove
citizenship. The Indian Express.
Sneha. (2017). Aadhaar-based biometric authentication for PDS and food security: Observations
on implementation in Jharkhand’s Ranchi District. Indian Journal of Human Development,
11(3), 387–401. https://doi.org/10.1177/0973703017748384
Sukhtankar, S., & Vaishnav, M. (2015). Corruption in India: Bridging research evidence and policy
options. India policy forum. National Council of Applied Economic Research, 11(1), 193–276.
Surabhi. (2017, January 9). Touts cashing in on Aadhaar card rush. The Hindu Business Line.
UNICEF, et al. (2020). Levels and trends in child mortality. UNICEF.
Unique Identification Authority of India. (2009). Biometrics design standards for UID applications. UIAI.
Unique Identification Authority of India. (2012). Role of biometric technology in Aadhaar
enrollment. UIAI.
United Nations Development Programme. (2020). Human development report 2020. UNDP.
World Bank Group. (2003). World development report 2004: Making services work for poor
people. World Bank.
World Bank Group. (2019a). Identification for development (ID4D) 2019 annual report
(English). http://documents.worldbank.org/curated/en/566431581578116247/Identificationfor-Development-ID4D-2019-Annual-Report
World Bank Group. (2019b). Identification for development (ID4D) practitioner’s guide.
http://documents1.worldbank.org/curated/en/248371559325561562/pdf/ID4D-Practitioner-sGuide.pdf
Xavier, G., Goldberg, J., Sankaranarayanan, S., Sheerin, P., & Yang, D. (2012). Use of biometric
technology in developing countries. In R. Cull, A. DemirgucKunt, & J. Morduch (Eds.),
Banking the world: Empirical foundations of financial inclusion. MIT Press.
Zelazny, F. (2012). The evolution of India’s UID program: Lessons learned and implications for
other developing countries (CGD policy paper 008). Center for Global Development. http://
www.cgdev.org/content/publications/detail/1426371
20 Digital Public Services: The Development of Biometric Authentication in India
561
Open Access This chapter is licensed under the terms of the Creative Commons Attribution 4.0
International License (http://creativecommons.org/licenses/by/4.0/), which permits use, sharing,
adaptation, distribution and reproduction in any medium or format, as long as you give appropriate
credit to the original author(s) and the source, provide a link to the Creative Commons license and
indicate if changes were made.
The images or other third party material in this chapter are included in the chapter’s Creative
Commons license, unless indicated otherwise in a credit line to the material. If material is not
included in the chapter’s Creative Commons license and your intended use is not permitted by
statutory regulation or exceeds the permitted use, you will need to obtain permission directly from
the copyright holder.
Part VI
Connectivity: Digital Communication
Technology
Richard Anderson
Introduction
One of the most important technological revolutions of the early twenty-first century
is digital communication technology. While this is, in fact, multiple technologies
maturing simultaneously—mobile broadband, smartphones, social networks, and
cloud infrastructure—the combined impact has transformed the way that people
live. The impact of digital communication technologies is arguably greater in
developing countries than developed ones. This is because technologies brought
new services to people, as opposed to upgrading existing services. For example,
basic mobile phones have been the first telephone connection for the majority of
people in the world, with phone access (measured as subscriptions per 100 people)
growing from 12 to 106 between 2000 and 2018.
Smartphone penetration has also become a global phenomenon which started
with the iPhone launch in 2007 and the release of Android in 2008. With the
development of low-cost smartphones from countries such as China, smartphones
have become widely used in emerging countries, with smartphones being 37% of
the market in India and 44% of the market in Africa. The combined effect of these
technologies has changed how people interact with information and communicate.
The reader is directed to many good references on the subject including the book
After Access by Jonathan Donner.
With these advances, digital communication technologies have become important to development engineering projects. These technologies allow different types
of things to be included in interventions; for example, it is now possible to provide
remote monitoring of systems and to get real-time reporting of system failures.
The ability to contact people in the field by mobile phone had a profound impact
in reducing the need for expensive field visits and to support processes such as
R. Anderson
Department of Computer Science and Engineering, University of Washington, Seattle, WA, USA
e-mail: anderson@cs.washington.edu
564
VI Connectivity: Digital Communication Technology
troubleshooting. There are also a range of development engineering interventions
that can be based directly on communication technologies, such as citizen reporting
on services or crowdsourcing of information. As multiple chapters in this text
demonstrate, digital communication technologies are now core to development
engineering.
This section focuses on how development engineering can be applied to communication technologies. The emphasis is on how to extend these new communication
technologies to make them appropriate for the development context. In particular,
the chapters identify innovations that can complement and extend the activities of
mobile network operators (MNOs) and the global technology companies.
Kurtis Heimerl and co-authors look at the problem of expanding the reach of
mobile cellular networks to populations that are not currently served by the global
MNOs. While a very large population is reached by cellular communication, even
in the poorest countries, there are still areas with no cellular service. Economics
requires an “economic density” for a company to profitably deploy infrastructure.
Standard estimates for the cost of a cell tower are about $200,000 USD when
set up by a mobile network operator. The technology idea is to develop low-cost
cellular systems which can be locally run, replacing the tower with a lower-cost
cellular radio and establishing a backhaul connection to support connections with
global networks. There are technology questions related to implementation, and
there are also very important economic questions on sustainability and political
questions on administration. The chapter reports on deployments in the Philippines
and discusses the full range of considerations for implementation—ranging from
spectrum negotiations to managing customer payments.
Aditya Vashistha and Agha Ali Raza present work on voice-based social media.
Social media has enormous impact, both for personal access to entertainment and
information and society-wide implication on politics and economy. However, there
is a divide in access to the global social media platforms, with a large number
of people in developing countries excluded. There are many barriers, including
technological barriers such as access to devices and connectivity as well as others,
such as literacy and language. The idea pursued by Vashistha and Raza is to
develop social media technology that can be accessed using a basic mobile phone
through voice and the keypad, with users leaving voice messages and navigating
messages with menus. They present multiple examples and field experiences and
address technological and social challenges. A key question is how to scale these
services and manage audio content as the number of users increases. They describe
how community moderation can be used to prioritize and edit user submission.
The financial sustainability of voice-based social networks is a big question, with
advertising models being difficult to maintain, but other creative models such as
microwork are considered. A final challenge is managing behavior of users and the
risk of creating hostile environment to different groups of users.
Finally, Waylon Brunette and Carl Hartung discuss mobile data management
tools for development organizations. They focus on the Open Data Kit (ODK)
project which has developed a collection of widely used open-source tools for
mobile data collection and management. The original challenge was to provide data
VI
Connectivity: Digital Communication Technology
565
collection tools to organizations that worked in remote areas with limited network
connectivity and had limited technical capacity for managing technology. When the
ODK project started in 2008, the team made the technology bet that smartphones
would be a viable technology for use in development settings. At the time, this
was a controversial notion—but turned out to be correct. The chapter traces the
history of Open Data Kit and discusses the different types of data management
that are conducted with mobile devices, explaining why multiple iterations of the
system have been deployed to handle dramatically different use cases. The system
has been deployed globally, and applications to various disaster management and
immunization logistics scenarios are discussed. An important meta-issue discussed
in the chapter is the process of developing, deploying, and maintaining global goods
software with a complicated network of stakeholder organizations.
Reference
Donner, J. (2015). After access: Inclusion, development, and a more mobile internet.
MIT Press.
Chapter 21
Connecting Communities Through
Mobile Networks: A Case Study
of Implementing Community Cellular
Networks in the Philippines
Mary Claire Barela, Maria Theresa Cunanan, Cedric Angelo Festin,
Kurtis Heimerl, Esther Jang, Matthew William Johnson, Philip Martinez,
and Ronel Vincent Vistal
1 Introduction
No recent technology has had a greater impact on economic development than
mobile networks, which comprise the largest networks on Earth and cover over
five billion subscribers. Cellular networks have allowed easier access to communication and information crucial in making informed decisions about education,
employment, social and entrepreneurial activities, and other aspects of daily life.
Mobile coverage gaps often exist in remote, rural areas, sometimes called the “last
mile” (or “first mile”) of connectivity, where the typical economics of providing
network service do not hold (Cherry, 2003). For-profit companies often find it
difficult to justify expanding coverage to areas where profits are low due to the
large investments required for traditional cellular infrastructure, for example, places
where the potential subscriber base is not large or wealthy enough to recover the
total capital and operational expenditures (CapEx and OpEx) involved in ongoing
operation. In addition, many remote rural areas lack the supporting infrastructure
needed for cell networks, such as stable grid electricity and a network connection
back to the global Internet, called “backhaul.” Furthermore, technical support and
maintenance for these networks is often slow and difficult due to the long distances
that network support engineers, typically based in city centers, must travel to provide
service.
M. C. Barela () · M. T. Cunanan · C. A. Festin · P. Martinez · R. V. Vistal
University of the Philippines Diliman, Quezon City, Philippines
e-mail: mabarela@up.edu.ph; theresa.cunanan@upd.edu.ph; cmfestin@up.edu.ph;
philip.martinez@up.edu.ph; ronelvincent.vistal@eee.upd.edu.ph
K. Heimerl · E. Jang · M. W. Johnson
Paul G. Allen School of Computer Science and Engineering, Seattle, WA, USA
e-mail: kheimerl@cs.washington.edu; infrared@cs.washington.edu; matt9j@cs.washington.edu
© The Author(s) 2023
T. Madon et al. (eds.), Introduction to Development Engineering,
https://doi.org/10.1007/978-3-030-86065-3_21
567
568
M. C. Barela et al.
To address these coverage gaps, the cellular infrastructure and operational
model must be redesigned, taking the aforementioned issues into account to make
deployment in remote areas more economically viable. The CoCoMoNets project
(Connecting Communities through Mobile Networks), implemented jointly by
researchers at the University of the Philippines Diliman (UPD) and international
research partners, tackled the challenge through community cellular networks
(CCNs). CCNs fall under the broader domain of community networking – an
alternative approach to standard telecom service in which communication infrastructure is built by or with local people who will use the network (Song, 2017).
The researchers designed a low-cost GSM base station that allows voice calls
and text messaging at a fraction of the capital and operational costs of traditional
cell networks. To address the challenges around maintenance and support, local
community members and community structures were involved in the deployment,
operations, management, and ownership of the network (Bidwell & Jensen, 2019).
This chapter documents the research team’s experiences and challenges as they
attempted to pilot community cellular networks in the Philippines from 2015 to
2019. Despite initial successes, they encountered barriers to continued operation
which led them to ultimately shut down sites or pivot to Wi-Fi Internet access
networks.
This chapter is organized as follows. First, Sect. 2 presents an overview of
the project and its context. Section 3 narrates the challenges and implementation
experiences, and a discussion of open challenges for CCNs follows in Sect. 4.
Section 5 closes with a summary and conclusion.
2 Innovation
2.1 Technology
Designing cellular network infrastructure for rural areas requires careful consideration of its context. First, many remote areas in the Philippines do not have access
to reliable grid electricity, so the network equipment’s power consumption must be
low enough to be supported by off-grid renewable energy systems. Second, backhaul
Internet connectivity is expensive and intermittent in remote areas, especially those
prone to bad weather such as typhoons. Ideally, the network must be able to provide
service locally even with an unstable or non-existent Internet connection. These
requirements led the researchers to develop a low-cost 2G GSM cellular base station
for community cellular networks (CCNs).
To reduce the capital expenditures for the equipment, the base station was
built using off-the-shelf hardware and open-source software. It is able to run on
renewable energy sources such as solar power to reduce the reliance of the service
on grid electricity. Each CCN has a satellite (very small aperture terminal or VSAT)
21 Connecting Communities Through Mobile Networks: A Case Study. . .
569
Fig. 21.1 A typical installation of a community cellular network cell site piloted in the Philippines
backhaul via which it eventually connects to the broader public telephone network.
A typical installation is shown in Fig. 21.1.
Unlike other community network deployments using Wi-Fi as the access technology, 2G GSM cellular technology was chosen because there is still a large 2G
subscriber base in the Philippines, especially among low-income and rural residents.
GSM is supported by most handsets, even basic feature or “candybar” phones, so
most people already owned devices compatible with the network at the time of
deployment.
Given the absence of available radio frequency spectrum and regulatory frameworks for last-mile initiatives such as CCNs, legal network operation in GSM
frequencies relied on a public-private partnership with the Philippines’ leading
mobile network operator (MNO), Globe Telecom, for sharing permission to broadcast in their nationally licensed cellular spectrum. Globe also allowed the project to
use their SIM cards, phone number allocations, and cloud services which provided
interconnection services between the CoCoMoNets network and other telephone
networks.
To allow the co-existence of the community cellular networks alongside the
mainstream Globe network, the researchers used the CommunityCellularManager
(CCM) software stack, a novel IP-based cellular core network that allows multiple
separate community networks to be managed (i.e., configured, monitored, and
provided with interconnection and billing services) under one technical domain.
570
M. C. Barela et al.
The CCM system is divided into two modules: the Client and the Cloud. In this
deployment, Globe managed a CCM Cloud instance and provided the researchers
at UPD with an account for the project’s Client networks. The CCM Cloud handled
integration with the Globe network, which provided routing, interconnect, and
phone numbers. The CCM Client was installed on the remote base stations. Network
installations were then handled independently of Globe by the researchers and
community partners.
2.2 Operational Model
The project team partnered with several local institutions and organizations in the
deployment sites for network operation. At the grassroots level, local business
cooperatives were recruited for day-to-day technical and business operations. Local
government units (LGUs) at higher municipal and barangay levels were also
engaged, as they had administrative jurisdiction over the deployment areas. Finally,
faculty and students at the nearby Aurora State College of Technology (ASCOT)
were onboarded for more advanced technical support of the community cellular
networks.
The community-based operational model had two aspects: technical and commercial operations. Each aspect employed a three-tiered structure for scoping the
roles and responsibilities of the actors. The three tiers, simply referred to as
Level 1 (L1), Level 2 (L2), and Level 3 (L3), are detailed in Table 21.1. L1
comprised community partners, L2 comprised cooperative and LGU partners, and
L3 comprised the researchers, who acted as the liaison with Globe Telecom (see
Fig. 21.4).
For the technical operations, the tiers were defined according to foreseen
maintenance, troubleshooting, and repair activities. The simplest and most frequent
issues (e.g., power failure) were designed to be resolvable at the community level
(L1). This eliminated the need for the research team to travel to the sites all the way
from Manila (a full day’s journey) for simple checks or repairs, ensuring quicker
service restoration.
For the commercial operations, the tiers were defined based on the reach and
resources of the relevant actors to carry out the needed business operations. The
L1 tier was assigned to local store owners, leveraging their existing infrastructure,
capability, and capital to perform retail transactions. A local business cooperative
filled the role of L2, using its capacity to coordinate with multiple L1 retailers within
its base municipality. The MNO (Globe) filled the role of L3, tasked with provision
of SIM cards and wholesale sale of prepaid airtime (also called electronic load or eload). A revenue-sharing agreement was set up between Globe and the cooperatives,
so that revenues could be funneled back to the community to finance the network’s
operating expenses.
21 Connecting Communities Through Mobile Networks: A Case Study. . .
571
Table 21.1 Technical and commercial operational structure
Technical
Tier level Actors
L1
On-ground
partners
(maintenance
officer, security
personnel, site
leader)
Commercial
Responsibilities
Basic day-to-day
upkeep of system
Site security
Reporting to L2 and
L3
L2
SUC,
cooperative, and
representatives
from LGU
L3
Research team
and MNO
Intermediate
troubleshooting and
repair tasks beyond
L1 capability and
resources
Coordination
between L1 and L3
Remote monitoring
of the network
Interfacing between
local actors and
Manila-based
stakeholders
Fig. 21.2 Map of the deployment sites
Actors
Retailers
Cooperative
Research team
and MNO
Responsibilities
Sell e-load to
subscribers
Buy e-load from
cooperative
Distribute remaining
SIM cards to
identified subscribers
Receive subscribers’
concerns
Sell e-load to retailers
Buy wholesale e-load
from MNO
Pay off maintenance
and security personnel
Sell wholesale e-load
to coop
Process revenue share
Provide SIM cards
572
M. C. Barela et al.
3 Implementation
3.1 Deployment Context
The CCN deployments, shown in Fig. 21.2, are located in the province of Aurora,
in barangays scattered across three municipalities along the Pacific coastline and
Sierra Madre mountain range. From Manila, it takes 8 to 10 hours of land travel
to reach Baler, the provincial capital. From Baler, several hours’ travel by sea or
unpaved roads is required to reach these remote and isolated coastal communities,
a trip sometimes made hazardous or impossible by seasonal typhoons. Community
members mainly depend on fishing and farming for income and sustenance. A few
locals earn their living by reselling retail goods brought from the town centers to
their respective communities. Owing to their geographic location, these sites do not
have access to terrestrial radio and television broadcasts. Prior to the commencement
Fig. 21.3 SIM card distribution during community network launch event
21 Connecting Communities Through Mobile Networks: A Case Study. . .
573
Table 21.2 Final list of sites and their status as of March 2020
Population
estimate (as
Site no. Treatment site
Municipality of 2016)
1
Sabang-Limbok
Dingalan
450
2
Dikapinisan
San Luis
2177
3
Dibut
San Luis
1032
4
Diotorin
San Luis
578
5
Bacong-Market-Ferry Dingalan
500
6
Dianao
Dilasag
300
7
Dipasaleng
Dilasag
500
Date launched
Sept. 13, 2017
Oct. 25, 2017
Feb. 1, 2018
May 30, 2018
Aug. 29, 2018
Oct. 17, 2018
Jan. 25, 2019
Status as of Feb
2020
Inactive
Active (Wi-Fi)
Active (Wi-Fi)
Active (Wi-Fi)
Inactive
Inactive
Inactive
of the CCN deployments, they were beyond the reach of cellular coverage; locals
would need to travel several hours to use cellular services like calls, SMS, and data.
The project installed seven community cellular networks in Aurora from September 2017 to January 2019. These sites were randomly selected from a pool of 14
candidate sites as part of a randomized controlled trial (RCT) impact assessment
study.
Prior to the networks’ installation, all candidate sites underwent a householdlevel baseline survey in December 2016. The baseline survey involved three parts:
(1) a household survey, (2) a listing of all adults 15 years or older, and (3) a
one-on-one adult survey. The household survey queried household demographic
composition, asset ownership, and economic activity. The core adult survey asked
about social networks and included a travel diary. Across the 7 CCN sites, 1131
households were interviewed, and we listed 3057 adults (Keleher et al., 2020).
The survey data was used as input to a pairwise matching procedure as described
in Bruhn and McKenzie (2009). First, potential cell tower locations were sorted into
pairs that were as similar as possible along observable characteristics, and then one
location within each pair was randomly selected to receive a cell tower in the first
wave (treatment) of deployments. The other would receive a cell tower in the second
wave (control). Specifically, pairs were formed so as to minimize the Mahalanobis
distance between the values of all selected characteristics within pairs, using an
optimal greedy algorithm. The research design required the CCNs to be deployed
in a specific order.1 Table 21.2 shows the final list of pilot sites. Several months
after a site’s network was launched, a household-level randomized experiment was
performed on promotional pricing such as free credits and discounted rates.
Finally, from May and September 2019, surveyors returned to all 14 candidate
sites to conduct an end line survey to measure changes after the network installations. Surveyors administered the same household and adult surveys, prioritizing
interviews with the same individuals as in the baseline.
1 Throughout
the chapter, sites may be referred to by either their site number or name.
574
M. C. Barela et al.
Fig. 21.4 An illustration of the operational tiers
As part of the RCT study, SIM card distribution was tightly controlled as shown
in Fig. 21.3. While SIM cards were given for free, only eligible individuals could
receive them. Eligible individuals were defined to be 15 years old and above,
residing in the community for at least 6 months at the time of site launch. The
impact evaluation team had initially wanted to limit SIM cards only to residents
of the barangay. However, upon request, exemptions were given to civil workers
such as public school teachers and soldiers, as they were often assigned from other
municipalities.
The network was dubbed “VBTS (Village Base Transceiver Station) Konekt
Barangay” and branded separately to differentiate it from the mainstream Globe
network. Pricing for the network services was already set by Globe Telecom and the
national regulator. As the CCN was categorized as an experimental network, the perminute or per-SMS service rates were lower than those of the mainstream network.
Any price changes (such as the time-limited promotional pricing or “promos”) were
to be approved by Globe first and then by the national regulator. Service rates are
shown in Table 21.3.
21 Connecting Communities Through Mobile Networks: A Case Study. . .
575
Table 21.3 Table of service rates
Traffic stream
Calls from a VBTS barangay number to another VBTS barangay
number
Calls from a VBTS barangay number to a regular Globe number
Calls from a VBTS barangay number to a non-Globe/VBTS
barangay number
Call from a VBTS barangay number to an NDD number
Text/SMS from a VBTS barangay number to another VBTS
barangay number
Text/SMS from a VBTS barangay number to a regular Globe
number
Text/SMS from a VBTS barangay number to a non-Globe/VBTS
barangay number
Tariff (in PHP)
1.00
Unit
Per min
3.00
5.50
Per min
Per min
5.50
0.25
Per min
Per SMS
0.50
Per SMS
1.00
Per SMS
3.2 Implementation Challenges
Aside from developing the technical intervention, the project required coordination
and work with a wide variety of stakeholders. These included a national mobile
network operator (Globe), the national regulatory agency (National Telecommunications Commission – NTC), local government units, research collaborators in the
academe, local cooperatives, and network end users within the remote communities.
A large amount of time and resources were invested to establish the necessary
partnerships and agreements with these stakeholders.
3.3 Spectrum Negotiations
With the core technical pieces in place, the researchers quickly discovered that
starting these community cellular networks was not as straightforward as they
had originally envisioned. The Philippines does not have a dedicated spectrum
policy for last-mile service delivery, and the current regulatory framework forces
small operators to adapt to the model used for national telecoms and other large
organizations. MNOs are given licenses that span the whole country, even in areas
where they are not providing service. Furthermore, current regulations on radio
equipment use, SIM card production, and interconnect limit these activities to only
MNOs.
There was no path for community networks to apply for their own licenses. In
response, the project team first attempted to acquire a license exemption from the
national regulator, the NTC. However, the regulatory officers advised the researchers
to instead reach out to any of the current license holders and ask if they would
allow co-use of frequencies under their respective licenses. The NTC would allow
the project, provided an official agreement was acquired with a current licensee.
576
M. C. Barela et al.
The researchers sent out proposals to the major Philippine MNOs, to which Globe
Telecom responded.
The long negotiation process with Globe took more than 2 years to close.2
The project worked its way internally through various departments, explaining how
different components of the project would pan out upon deployment. The research
team also had to reassure Globe that the project would shoulder the CCN’s capital
and operational expenses. Eventually, the project was taken under Globe’s corporate
social responsibility arm and was granted approval to use Globe’s spectrum for an
initial 1-year pilot period. One of the risks the project took on due to this spectrum
arrangement was that the CCNs’ operation was critically dependent on Globe’s
continued support.
3.4 Stakeholder Needs and Interests
Over the course of discussions and consultations between the researchers, Globe,
and LGUs, we determined that local community partners would be needed to handle
the day-to-day operations, management, and first-level maintenance for the CCN
installations. The researchers initially wanted to recruit only local organizations
based in the same communities as the installations, but were not always able to find
organizations that fit these criteria. We enlisted the help of the LGU to nominate
cooperatives and organizations and ended up with cooperatives not based in any
of the target communities, but local to the municipality. Table 21.4 describes the
partnership setup per municipality.
Moreover, the researchers wanted to maximize community involvement to
create an operational model for the network that was as close as possible to the
ideals of community networking yet that would also satisfy the other partners’
requirements. While the team had past deployment experience on which to base the
operational model, Globe’s stipulations had to be accommodated. Globe preferred
to have a single point of contact, rather than dealing with many independent
communities. Its existing trade and distribution processes also relied heavily on
partners having easy access to financial institutions such as banks and means of
electronic communications such as email.
The cooperatives were primarily worried about the capital and potential financial
liability that this venture could bring should the project not become sustainable.
They also recognized that they would need to visit the retailers at the sites often,
which might become inconvenient or infeasible due to the danger of travel in bad
weather. They were skeptical about the business viability, as some of the treatment
sites were very small in population. These were all valid concerns, especially
as these deployments would be a test of the CCN model. However, they were
convinced to participate primarily by the 80% revenue share they would eventually
2 https://www.up.edu.ph/index.php/up-globe-sign-moa-for-village-base-station-project/
21 Connecting Communities Through Mobile Networks: A Case Study. . .
577
Table 21.4 Cooperative setup per municipality
Municipality and sites covered
Dingalan, Aurora
Site 1: Sabang-Limbok
Site 5: Bacong-Market-Ferry
San Luis, Aurora
Site 2: Dikapinisan
Site 3: Dibut
Site 4: Diotorin
Dilasag, Aurora
Site 6: Dianao
Site 7: Dipasaleng
Partnership setup
The nominated cooperative is the Paltic Mangingisdang
Nagkakaisa Producers Cooperative (PAMANA). However,
PAMANA is not based in the same barangay as the site
installations, so another local group named the Samahan ng
Mangingisda ng Sitio Limbok at Sabang (SAMAHAN) was
engaged. These two groups are already acquainted with each
other and have already worked together for a previous
government project. SAMAHAN performed the day-to-day
operations and maintenance duties for the sites, while
PAMANA is in charge of the distribution of load to the
on-ground retailers
The nominated cooperative is the Dibayabay Primary
Multipurpose Cooperative (DPMC). The cooperative is
based in Barangay Dibayabay, which currently has no VBTS
installation, but has extended membership in Sitio Diotorin,
one of the current VBTS sites. The DPMC performs the
distribution of load to the on-ground retailers, as well as
other functions
The nominated cooperative is the Dilasag Municipal
Employees Credit Cooperative (DMECC), which is based in
the town proper. The sites are 20–30 min away. DMECC has
members residing in sites 6 and 7
receive from the network’s gross revenues. As L2 actors, the cooperatives would
also receive a discount on the wholesale e-load purchases from Globe as well as
their 80% share. Finally, the project team assured the cooperative that all initial
investments for the infrastructure were funded by the project.
3.5 Unexpected Changes in the Field
While the spectrum negotiations were taking place, the deployment team from UPD
had been visiting and surveying potential sites where little to no cellular coverage
existed. The team had set criteria for selecting pilot sites for CCN deployments. A
primary consideration was for a village to be outside existing cellular coverage.
Initially, five isolated coastal barangays in San Luis, Aurora, were selected as
deployment sites. However, the introduction of the RCT study required additional
sites to meet the minimum requirement for the matched pairs design (at least 14
sites). Hence, the search was extended to include nearby coastal communities in the
town of Dingalan.
The initial site listing was vetted by Globe to ensure that they were indeed
excluded on their existing coverage map. At the time, the Dingalan sites were on
the fringes of existing cellular coverage. This meant that coverage was not present
578
M. C. Barela et al.
in the village, but residents had identified spots several kilometers outside the village
where they could acquire a signal by walking.
The data gathered from the site surveys were then passed to the impact assessment study team for evaluation. The researchers then generated a final listing of
seven treatment sites, with the research design necessitating that the CCNs had to be
installed and deployed in a specific order. As a result of this process, the sites were
primarily selected according to RCT requirements and not for business viability.
Some of the target sites were very small in population and had been identified from
the onset as having potential difficulty with generating enough revenue to cover
recurring costs without external support.
Over the course of site preparations (mid-2017), two of the treatment sites in
Dingalan needed to be relocated due to unforeseen security threats from military
insurgent groups in the area. This forced the research team to abort some of the
initially selected sites, and the deployment team had to scout other nearby areas for
candidate locations, prompting a re-evaluation of the control-treatment pairs. The
project team then had to forge new partnerships with local stakeholders in these
locations.
Once the treatment sites were identified, the next step was to secure a small lot
(7 m × 7 m) in each site where the CCN tower and equipment shelter would be built.
If possible, the project team preferred to have the CCNs erected on government land,
as the project already had partnerships with the LGUs that had assisted in expediting
site clearances and other permits.
However, the project team had a hard time acquiring land for the sites in
Dingalan, as a private corporation, Green Square Properties, claimed ownership over
almost the whole municipality. The team initially attempted to seek permission with
this private entity, but the company wanted lease payments in exchange. As we could
not guarantee that income would be generated, the negotiations with them failed.
The team tried by all possible means, including leveraging the land-use agreement
that the Dingalan LGU had with Green Square. The negotiations for land use took
a considerable amount of time and was further complicated when sites had to be
re-randomized. In the end, the team ended up making informal arrangements with
private homeowners in the area.
In subsequent visits to Dingalan, the researchers observed that network coverage
from mainstream networks had improved since these locations were first assessed.
By mid-2018, mainstream network coverage had expanded so that residents could
now utilize them in the comfort of their homes. With this change, residents in
Dingalan preferred to use the mainstream networks over the community network
since residents perceived them as more reliable and affordable, and they offered
additional services such as mobile data and promos for “unlimited” usage. The
community network could not compete with the incumbent MNOs. While the
coverage expansion was detrimental to the survival of the community network, we
acknowledge that it ultimately brought benefits to the community.
21 Connecting Communities Through Mobile Networks: A Case Study. . .
579
4 Evaluation
4.1 Subscription and Usage
At their peak, the CCNs had about 2000 subscribers, equivalent to about 90% of
the total eligible population across all sites. We believe the high adoption rate can
be attributed to the RCT study giving away SIM cards for free. About 40% of
subscribers topped up monthly, spending $1.20 per month. Monthly ARPU (average
revenue per user) across all sites was around $0.60. Voice calls dominated the overall
traffic, with 15 times more inbound call minutes to subscribers on the network
than outbound call minutes. On the other hand, subscribers made three times more
outbound text messages compared to inbound text messages. This was indicative of
a “call-me” behavior, since subscribers were only charged for user-initiated calls or
SMS.
4.2 Technical Operations
Stable network performance is crucial to smooth network operations. While the
technical team took measures to make the systems robust to rural conditions, the
system is still not fault-proof and occasionally encounters technical issues that
disrupt service. During the first few months of operation, subscribers considered
such service disruptions and downtime acceptable, from the viewpoint of their
prior condition where they had no network coverage at all. However, their service
expectations and attitudes changed throughout the course of the project. Subscribers
started to expect continuous and reliable operation similar to their experience with
mainstream cellular networks in Baler.
The deployed systems had occasional hardware issues, which were most frequently power-related. Most power failures were due to low battery charge during
the rainy season (May–November). The system’s battery bank was designed to be
sufficient for 3 days of autonomous operation, but limited sun hours prolonged the
duration to fully charge the battery bank. The technical team initially tried to operate
the network 24/7, but this became very challenging once the rainy season arrived.
In response, the researchers and community maintenance staff agreed to limit the
operational hours from 5 AM to 10 PM. Initially, the staff had to manually turn off
the system, but it turned out that sometimes they forgot to perform the shutdown
routine or found it too inconvenient. To resolve this, a digital timer switch was
installed that turned the system off and on at the specified times. The switch could
be manually overridden by the local staff, in case the community needed extended
hours or for emergencies.
Another common cause of network failure was broken inverters, which required
replacement hardware to be shipped from L3 or L2. For worst-case scenarios, the
researchers were pleased to discover instances where the local maintenance staff had
580
M. C. Barela et al.
taken the initiative and coordinated with the barangay council to allow powering the
CCN hardware using the barangay’s electric grid connection or emergency power
systems.
In the event that a network hardware component fails, it can take weeks to get
replaced or repaired. Specialized equipment is almost impossible to procure in Baler
and most often needs to be supplied from Manila. Anticipating this, the project team
practiced providing backup inventory for commonly failing components. To expedite replacement of commonly available off-the-shelf hardware, an arrangement was
made with the partner LGUs so that they would supply the needed hardware and
ship it off to the sites. The on-ground personnel at the site would then perform the
hardware installation.
4.3 Commercial Operations
The local business cooperatives were responsible for e-load replenishment, a twopart process that required them to (a) remit payments to the MNO through banks
or remittance centers and (b) travel to the sites to provide load to the retailers.
Replenishment was challenging primarily because these tasks required personnel
travel, which varied in feasibility (e.g., favorable weather conditions and available
transportation). Banks and remittance centers were only located in municipal town
centers, and the CCN sites were also separated from the cooperative’s home base.
While e-load transactions can be done electronically, payments and remittances
were particularly difficult for cooperatives to receive due to the geographical
distances of the sites from the town centers. Payments needed to be remitted
regularly for the prescribed commercial model to run smoothly, as cooperatives had
a very limited amount of capital to circulate for commercial operations.
As a result of the challenges of travel, some hard-to-reach sites experienced eload shortages lasting 1–2 weeks, with the worst one lasting for about a month.
A straightforward solution was to increase inventory capacity per retailer, also
preferred by the cooperative partners as it would require fewer visits for payment
collection. However, some retailers expressed an inability to spend larger amounts
of capital at a time for more e-load. The retailers and the cooperative were able to
work out possible schemes to optimize their process and ease capital requirements.
Schemes included setting larger load orders to reduce the frequency of cooperative
visits while using a consignment-based structure to reduce capital requirements on
retailers. In the “consignment” scheme, the cooperative agreed to transfer the retailer
a large amount of e-load for a 50% down payment and 50% balance to be paid on
the next collection date.
21 Connecting Communities Through Mobile Networks: A Case Study. . .
581
4.4 Community Response
In general, community buy-in was not that difficult to gain since locals immediately
saw the benefits that the project would bring to their respective communities. In
informal interviews during the site survey phase, locals highlighted that the network
would be useful for emergencies and for contacting loved ones far away. There were
a few concerns about radiation and potential negative health effects, but residents
were assured that the community base stations transmit at a fraction of the power
that typical base stations use. Eventually, the positive benefits of being able to
communicate long distance, i.e., make a call without needing to leave their villages,
outweighed these concerns.
Though the CCNs were made possible by the partnership with Globe, the
researchers wanted to emphasize to the community that this was a separate initiative
whose primary purpose was research and not income generation. Specifically, the
project team wanted to avoid the risk of insurgents misidentifying the community
network as a commercial enterprise and possibly extort “revolutionary taxes” from
the project.3 As a response to frequent queries about the project and to avoid
misinformation, the research team held town hall meetings prior to and during the
CCN’s inauguration and formal launch.
The network launch was conducted as a whole community event where the team
had a chance to formally introduce the project and explain the details of the research
and network operation. The team explained the capabilities and limitations of the
system, tariff rates, and information about future promotions. As an experimental
network, the VBTS-CoCoMoNets network could be expected to suffer downtime or
outages and would not guarantee the same grade of service as mainstream cellular
networks. This and other capacity limitations were communicated clearly to all
stakeholders, especially to subscribers prior to their sign-up. The event was also an
opportunity to address questions and concerns from the community, which included
the privacy of their communications, potential health effects of radiation from CCN
towers, value-added services such as mobile Internet, and other comparisons of the
CCN to mainstream networks.
Subscribers’ appreciation of the project depended highly on their distance to
existing coverage and the effort required to reach it. The communities of San
Luis, Aurora (including Dikapinisan, Dibut, and Diotorin), who are extremely
geographically isolated from the rest of the world, were highly appreciative of the
community network even though the service offerings were not perfect. Network
adoption was also highest in San Luis.
Resistance to the project was most salient in the Dingalan sites. Some community
members outspokenly mentioned that VBTS-CoCoMoNets did not have a positive
impact on them at all, as it allegedly did not keep its promise of improving
mobile reception, and actually weakened the scant signal of the networks they
3 Philippine Institute for Development Studies. 2018. “The telco duopoly has become the CPPNPA’s biggest funder” https://pids.gov.ph/pids-in-the-news/2247
582
M. C. Barela et al.
had been using prior to the CCN’s installation. To make matters worse, the
delegated maintenance personnel took a job elsewhere, leaving no one to maintain
the equipment. Maintenance and repair had to originate from Manila, making
the upkeep of the site much more difficult. The team made several attempts to
explain the situation to the community, but the subscribers had lost interest. Due
to the dissatisfaction, the team received requests from community members to pull
out the equipment, as they did not want liability in the case of theft or damage.
Unfortunately, they could not act on the pullout request until the end line survey
was completed.
4.5 Personnel Retention
Personnel retention has remained a challenge for CCNs, as delegated personnel
find better opportunities beyond their village, limiting their long-term participation.
In the designation of tasks, the project team had initially hoped that the required
effort and frequency of maintenance (e.g., checking battery voltage daily) would
be of little consequence to the personnel everyday routines. However, keeping
the L1 and even L2 presence failed in several sites, severely affecting operations
and sustainability. In sites with low network traffic and adoption, L1 personnel
understandably did not exhibit enthusiasm in fulfilling their duties, as perhaps the
subscribers’ behavior indicated the CCN’s lack of value to them. L1’s failure to
perform maintenance may have led to further degradation of the service, so that
disappointed subscribers returned to their old usage of the mainstream network if
available.
The researchers looked deeper into the reasons behind L1 absence and found the
following: (a) insufficient compensation and (b) unappreciation of the network’s
value. Although L1 personnel received an allowance from the LGU or cooperative,
they often opted to venture to more rewarding livelihoods for higher compensation.
Some allocated more of their time to their fishing or farming activities, while some
accepted better jobs outside their community. This tendency to relocate to “greener
pastures” for work echoes the overseas Filipino worker (OFW) phenomenon,
wherein Filipinos resort to opportunities in more developed countries due to the
unavailability of local high-paying jobs. For the context of the project’s CCN
sites, this translates to migration to more urban areas. The researchers accept the
L1 personnel standpoint, as they need to provide for their families. While these
migrations are often not permanent, with workers shuffling intermittently between
their hometowns and Baler, unavoidable gaps are created when those left behind
lack the knowledge to maintain the network. While there is certainly promise
and value in providing training to produce local expertise, this training must be
consistently available and repeated to be effective. Issues related to personnel
turnover can be expected to continue until the community as a whole becomes more
technically savvy.
21 Connecting Communities Through Mobile Networks: A Case Study. . .
583
Fig. 21.5 System diagram created by L1 personnel
In one case of L1 absence, the project team was fortunate enough to have a local
resident step up to understand the system and take over operations. The formerly
untrained resident, with a high school/early college level background in electrical
principles, received cursory instructions from the former personnel when he left
for work in Baler and took up his functions. He was in charge of the system’s
upkeep for several weeks before receiving official training from the project team,
performing well on his own through self-study of the reference operational manuals
and deployed equipment layout. A diagram from the manuals with his own drawing
and labels, produced before training, is shown in Fig. 21.5.
4.6 Trust and Community Relations
Forming partnerships and trust with the communities required a tremendous amount
of effort and time. The project encountered instances where negotiations took much
longer to close than expected, causing delays in the installation and deployment
timelines. The team also wanted to ensure participation of local partners and
584
M. C. Barela et al.
give them the opportunity to exercise their decision-making rights. Moreover,
local politics and leadership changes interrupted the continuity of community
relationships that had taken a long time to build. In some cases, the project had
to re-introduce itself to new local leaders after a new administration was elected.
In Philippine politics, it is common to replace or reshuffle all staff when a new
administration takes office, so the team had to re-establish connections and reidentify liaisons or L2 personnel for the project.
Despite the difficulties, gaining and maintaining trust with local stakeholders is
highly important, as it will influence an intervention’s ultimate value and impact for
the community. A sense of distrust, as arose in Dingalan, meant that the community
would never use and appreciate the network. Building trust requires researchers
to spend significant time with the communities and try to understand their way of
life. While most of the researchers were Filipinos and understood the local context,
they were still living in Manila. Unfortunately, the difficulty of travel and the RCT
requirement to minimize survey/response bias limited the researchers’ ability to
maximize their presence in the communities.
5 Adaptation
By September 2019, four CCN sites had been terminated due to non-performance.
They were Site 1 (Sabang-Limbok), Site 5 (Bacong-Market-Ferry), Site 6 (Dianao),
and Site 7 (Dipasaleng). “Non-performance” in these cases referred to a lack of
subscriber activity, lack of L1 maintenance support, and lack of cooperative business
support. While the research team strove to keep these sites running, for example,
by performing L1 repairs, replacing any defunct equipment, or initiating pricing
promos, the lack of interest from stakeholders signaled that the intervention was not
useful for these sites.
In November 2019, a contact at Globe notified the researchers that Globe would
be terminating their own parallel set of small-scale cellular deployments based on
the same CCM software stack. This was due to various technical and business
reasons including hardware vendor problems, target revenues not being met, and
lack of support from Facebook, another peripherally involved partner adopting the
CCM software. Corporate supports for the existing VBTS-CoCoMoNets sites were
bundled with this initiative, and thus they would also be terminated.
With this news, the project team decided to install community Wi-Fi networks
alongside the existing 2G cellular networks. Although this intervention was beyond
the scope of the current project, the researchers felt the need to provide an alternative
for communities that had become reliant on CCN services. Both networks operated
in parallel until March 2020, when the 2G networks were taken offline.
Several community consultations were held in the remaining sites of Dikapinisan, Diotorin, and Dibut to discuss the status and future of the project. Inputs
from the communities were gathered regarding operation beyond the project period.
The main concern for these sites’ sustainability was the high cost of the satellite
21 Connecting Communities Through Mobile Networks: A Case Study. . .
585
backhaul. Two main proposals surfaced from these discussions. The first was to
let the network be free and open for anyone to use, the catch being that the
service would eventually end once the VSAT contract paid for by the project
ended, if no subsidies were acquired from the local government. The second was
to accumulate funds for the monthly recurring costs through sales of Wi-Fi voucher
codes to community members wishing to access the Internet. Two out of the three
communities (Dikapinisan and Dibut) decided right away to adopt the management
of the Wi-Fi network. They would sell voucher codes for Wi-Fi Internet access for
PHP 10/h. Sales would be accumulated to pay for the VSAT backhaul starting in
August 2020.
Community reception of the Wi-Fi service has been mixed. Some are happy
about the introduction of the Internet to their communities, as they had been
longing to use the Internet for Facebook, research, or other purposes. Dikapinisan,
being the most populous and urban of the three communities, has received the
Wi-Fi service very well; residents largely have a prior understanding about what
Wi-Fi is and how it can be used. However, some feature phone users were
dismayed because their phones do not have Wi-Fi capability, or they still find
voice and text easier to use over video calls and chat. Wi-Fi also has shorter
propagation characteristics compared to cellular 2G, meaning the coverage area
of the community network is now smaller. Community members who were not
covered by the Wi-Fi signal coverage would have to walk or congregate near the
community access point. Finally, the termination of 2G service has disenfranchised
some community members who do not have the capacity to upgrade to Wi-Fienabled devices. The situation has been difficult for the research team to accept,
but we have had to acknowledge our own limited capacity as well.
In spite of this outcome, efforts initiated by the CoCoMoNets project are
being continued through other research initiatives. Researchers from UPD and
the Department of Science and Technology Advanced Science and Technology –
Institute (DOST-ASTI) saw an opportunity with the planned digital TV migration
and proposed the opening of the 600 MHz spectrum for use of community cellular
networks, and thereby addressing the challenges encountered by the CoCoMoNets
project revolving around spectrum usage. To support this proposition, researchers
from DOST-ASTI have developed an LTE base station prototype operating at
600 MHz (Hilario et al., 2020). Recently, the ongoing COVID-19 pandemic has
brought again to spotlight the long-standing problem of last-mile connectivity
access in the Philippines. As part of the government response to address the connectivity gap, the Philippine’s Department of Science and Technology announced
that it is planning to build community cellular networks in remote areas across
the country to provide Internet connectivity that could aid in distance learning.4
This pronouncement is a positive step forward as community networks are being
4 Jaehwa Bernardo. September 2020. ABS-CBN News. “DOST plans to build community-based
cellular networks in remote areas” https://news.abs-cbn.com/news/09/29/20/dost-plans-to-buildcommunity-based-cellular-networks-in-remote-areas
586
M. C. Barela et al.
acknowledged as a solution to last-mile access. Moreover, the government’s adoption of community networks is expected to bring the necessary support for crafting
responsive regulatory policies and additional spectrum reform that will help narrow
the digital gap in the country and resolve some of the issues surfaced through this
study.
6 Discussion: Open Challenges
The geographical remoteness of the sites, while important for the networks’ business
success, resulted in a number of setbacks in creating a feasible trade and distribution
process. The sites are far away from formal financial institutions like banks and
remittance centers; travel time and difficulty reaching the sites also pose ongoing
dangers to local intermediaries.
MNOs operating at massive scale are not well suited to using iterative or rapid
design processes, which may be crucial when working with new technologies
or marginalized populations to make interventions appropriate for adoption. For
example, during negotiations with Globe, it was agreed that co-ops would receive
80% of the revenue share, which would be used to cover operating costs of the site
beyond the project duration. However, the co-ops’ receipt of their share was delayed,
as Globe later required them to enter into separate contracts directly with Globe.
These contracts took almost another 2 years to get approved. Moreover, executing
the revenue share in practice was a longer process than initially expected. Globe’s
revenue share disbursement was not completed until July 2020.
While our counterparts at Globe were committed and worked hard to complete
the disbursement, most of the delays were due to procedural precedents in a massive
organization attuned to working with other similarly large enterprises. The project
team recognized the administrative challenges and potential concerns that arose
from this delay, so the team constantly kept lines of communications open for
coordination between Globe and the cooperative. Unfortunately, the delays broke
the projected operational model, as it was assumed that cooperatives would be
able to tap into this revenue for their operational expenses or for additional capital
for e-load distribution. To help alleviate their concerns during this unfortunate
development, persistent and continuous communication with both the cooperatives
and Globe was important and necessary. The team also extended assistance to
both parties to expedite completion of the requirements (e.g., getting required
documentation or assisting cooperatives in digital account setup).
7 Summary and Conclusion
Despite all the operational challenges, the researchers still believe that community networks will play an important role in rural communications, especially
21 Connecting Communities Through Mobile Networks: A Case Study. . .
587
when market forces fail to deliver service in last-mile areas. However, CCNs
will continue to face challenges without supportive and enabling environments,
requiring coordination and commitment from government, academia, industry, and
community. A systematic review of community network strategy by policy makers
and stakeholders will be required to allow CCNs to flourish. Finally, meaningful
and sustainable impact requires more than a 2-year pilot project. To achieve largerscale, more holistic development impacts in rural areas, we will need long-term
roadmaps for rural development with respect to both physical infrastructure and
human resources.
References
Bidwell, N., & Jensen, M. (2019). Bottom-up connectivity strategies: Community-led smallscale telecommunication infrastructure in the global South. Association for Progressive
Communications, Technical Report.
Bruhn, M., & McKenzie, D. (2009). In pursuit of balance: Randomization in practice in
development field experiments. American Economic Journal: Applied Economics, 1(4), 200–
232.
Cherry, S. M. (2003). The wireless last mile. IEEE Spectrum, 40(9), 18–22.
Hilario, C. A. G., Barela, M. C., De Guzman, M. F. D., Loquias, R. T., Raro, R. V. C. B., Quitayen,
J. J. J., & Marciano, J. J. S., Jr. (2020). LokaLTE: 600 MHz community LTE networks for rural
areas in the Philippines. IEEE global humanitarian technology conference (GHTC 2020).
Keleher, N., Barela, M. C., Blumenstock, J., Festin, C., Podolsky, M., Troland, E., Rezaee, A.,
& Heimerl, K. (2020, June). Connecting isolated communities: Quantitative evidence on the
adoption of community cellular networks in the Philippines. In Proceedings of the 2020
international conference on information and communication technologies and development
(pp. 1–16).
Song, S. (2017, October). Policy brief: Spectrum approaches for community networks. Internet
Society, Technical Report. [Online]. Available: https://www.internetsociety.org/wp-content/
uploads/2017/10/Spectrum-Approaches-for-Community-Networks_20171010.pdf
Open Access This chapter is licensed under the terms of the Creative Commons Attribution 4.0
International License (http://creativecommons.org/licenses/by/4.0/), which permits use, sharing,
adaptation, distribution and reproduction in any medium or format, as long as you give appropriate
credit to the original author(s) and the source, provide a link to the Creative Commons license and
indicate if changes were made.
The images or other third party material in this chapter are included in the chapter’s Creative
Commons license, unless indicated otherwise in a credit line to the material. If material is not
included in the chapter’s Creative Commons license and your intended use is not permitted by
statutory regulation or exceeds the permitted use, you will need to obtain permission directly from
the copyright holder.
Chapter 22
Voice Interfaces for Underserved
Communities
Aditya Vashistha and Agha Ali Raza
1 Evolution of Voice Forums
Information and Communications Technologies (ICTs) have the potential to enable
socioeconomic development where information and connectivity are the missing
components. ICT-based interventions can lead to better management of available
resources, improved monitoring and reporting of corruption, and more awareness
and connectivity among people. To achieve impact at such a large scale, such
solutions need to be robust enough to reach the target populations using available
means with minimum resource expenditures. The Internet is a phenomenon that has
enabled this enormous metamorphosis, and services like social media and online
discussion forums have transformed how people participate in the information
ecology and digital economy.
Unfortunately, most Internet services currently only empower urban, affluent,
and literate people and exclude billions of “othered” people who are too poor
to afford Internet-enabled devices, too remote to access the Internet, or too lowliterate to navigate the mostly text-driven Internet. Up to 81% of the people
living in developing countries are offline (compared to the 13% in the developed
world).1 This disproportionate access is even worse for marginalized populations
1 “Measuring Digital Development – Offline population.” https://itu.foleon.com/itu/measuringdigital-development/offline-population/ (accessed Aug. 31, 2020).
A. Vashistha ()
Cornell University, Ithaca, NY, USA
e-mail: adityav@cornell.edu
A. A. Raza
Lahore University of Management Sciences (LUMS), Lahore, Punjab, Pakistan
e-mail: agha.ali.raza@lums.edu.pk
© The Author(s) 2023
T. Madon et al. (eds.), Introduction to Development Engineering,
https://doi.org/10.1007/978-3-030-86065-3_22
589
590
A. Vashistha and A. A. Raza
within these countries. The Internet access gender gap is as high as 43% in
developing countries (compared to 2.3% in developed countries).2 Also among
these offline communities are low-literates and native speakers of languages that
do not have written forms (46% of all languages3 ). Hence, lack of access is strongly
associated with poverty, low literacy, tech naivety, and being marginalized. This
makes mainstream Internet services inadequate to meet the needs of billions of
people living in underserved settings. Sadly, many of these communities are unable
to find alternate means of communication as television and radio are non-interactive,
print media assumes literacy, and computers require stable electricity and Internet
connectivity.
Clearly, textual interfaces and Internet access cannot be relied upon to provide
information access to the populations identified above. Speech as an alternate communication medium is more suitable especially because speech-based information
can even be provided over simple phone calls without any Internet connectivity.
Given the rapid proliferation of mobile phones in developing countries, speechover-simple mobile phones is a viable way to connect underserved populations. In
light of these considerations, global development researchers and practitioners have
used interactive voice response (IVR) technology to create voice-based services that
overcome connectivity barriers by using ordinary phone calls, literacy barriers by
using local language speaking and listening skills, and socioeconomic barriers by
using toll-free (1–800) lines. These services assume no more than the capability to
make and receive a voice call from users and let them call a phone number to record
and listen to voice messages in their local languages. Over the last two decades, such
services have included efficient marketplaces; common interest groups; message
boards, blogs, mailing lists, and social networks that facilitate social and political
activism; information campaigns on themes of education, training, employment
opportunities, health, agriculture, and emergency response; citizen journalism; and
automated surveys and polls to gather information. Because of their accessible and
usable design, these services have found applications in diverse domains and have
profoundly impacted underserved communities in low-resource environments. This
section follows the evolution of these services over the last decade and their big
challenges and new frontiers.
Voice forums can be designed as (1) top-down information push services where
the content is developed by experts and the interface simply allows individuals to
consume the content, (2) peer-to-peer services where individuals can communicate
with other individuals via audio messages, and (3) social services where users
can record and broadcast content to the community. The first wave of voicebased services focused on improving information access for people in low-resource
communities. The target audience of Project HealthLine – one of the first such
2 “Measuring Digital Development – Gender gap.” https://itu.foleon.com/itu/measuring-digitaldevelopment/gender-gap/ (accessed Aug. 31, 2020).
3 “How many languages in the world are unwritten? | Ethnologue” https://www.ethnologue.com/
enterprise-faq/how-many-languages-world-are-unwritten-0 (accessed Aug. 31, 2020).
22 Voice Interfaces for Underserved Communities
591
endeavors – was low-literate community health workers in rural Sindh Province,
Pakistan (Sherwani et al., 2007). It enabled them to retrieve relevant information by
speaking out predefined commands. The goal was to provide telephone-based access
to reliable and up-to-date health information, and the speech interface performed
well once the health workers were trained to use it via human-guided tutorials.
This project also highlighted the challenges in eliciting informative feedback from
low-literate users. While services like HealthLine allowed users to only consume
information, subsequent services took the form of voice forums and enabled
marginalized communities to also produce and share information.
The impact of the community involvement in voice forums has been thoroughly
studied and has been shown to promote social inclusion among underserved
communities. Notable research in this direction includes Avaaj Otalo (an agriculture
discussion forum in India), CGNet Swara (a citizen journalism service in India),
Mobile Vaani (a social media service in India), Ila Dhageyso (a civic engagement
portal in Somaliland), and IBM’s Spoken Web (a user-generated information
directory in India) (Patel et al., 2010; Mudliar et al., 2012; Moitra et al., 2016; Gulaid
& Vashistha, 2013). For example, Avaaj Otalo was designed to connect farmers in
Gujarat, India, and offered three features: an open forum where users could post
and answer questions, a top-down announcement board, and a radio archive that
allowed users to listen to previously broadcast radio program episodes. The most
popular service turned out to be the open forum, constituting 60% of the total
traffic, and users found interesting unintended uses for it like business consulting
and advertisement. Mudliar et al. examined participation of rural communities in
India on CGNet Swara, an interactive voice forum to record and listen to local
news, grievances, and cultural content, and found that it serves as a vehicle for
digital inclusion for indigenous communities. Koradia et al. (2012) integrated voice
forums with community radio technology to amplify its reach and involve radio
listeners in content creation, feedback, and station management. The influence of
peer-generated content available on social platforms on the target communities has
been compared against expert-generated content by Patel et al. (2012). In a 2week trial, 7 agricultural tips were disseminated to 305 farmers in Gujarat, India.
Each tip was recorded in the voices of university scientists and farmers. The study
showed that farmers preferred to hear agricultural tips in the voice of their peers,
even though in interviews they maintained their more socially acceptable inclination
toward scientists. Table 22.1 provides a summary of the comparison of popular voice
forums that have been deployed in various developing regions (Fig. 22.1).
An important question in developing voice forums has been that of the input
modality: speech vs. key press. Project HealthLine found that speech input performed better than key press in terms of task completion, for both literate and
low-literate users (Sherwani et al., 2007). However, it provided no clear answer
in terms of subjective user preference. Lee et al. reported key press input to be more
efficient for linear and simple tasks and speech input to be better for nonlinear tasks.
Grover et al. found task completion rates for speech and key press input modes to
be similar; and tech literacy is a more important factor than overall literacy for
task completion. Patel et al. (2009) found key press input to be more intuitive and
Avaaj Otalo CGNet Swara
Citizen
Domain
Agriculture journalism
Subsidized airtime Yes
Yes
Voting
No
No
Audio comments
Yes
No
Sharing posts
No
No
Deployment length 7 months
2009–now
Calls
6975
137,000
Users
45
100,000
Posts
896
13,595
Female users
0%
21%
Users with visual N/A
N/A
impairment
Mobile Vaani
Grievance
Civic engagement redressal
Yes
Yes
No
Yes
Yes
Yes
No
Yes
5 months
2012–now
N/A
10,000/day
N/A
1.5 million
4300
300/day
15%
N/A
N/A
N/A
Ila Dhageyso
Table 22.1 Summarized comparison of major voice forums
Polly
Social
Social media Social media media
No
N/A
Yes
Yes
No
No
No
No
No
No
No
Yes
1 month
4 months
1 year
306
20,499
636,000
252
976
165,000
31
2532
387,301
Low
N/A
11%
N/A
N/A
< 1%
Gurgaon Idol VoiKiosk
Social media
Yes
Yes
No
Yes
4 months
25,000
13,500
5000+
6%
26%+
Social media
Yes
Yes
Yes
Yes
8 months
269,468
10,721
44,178
10%
69%
Sangeet Swara Baang
592
A. Vashistha and A. A. Raza
22 Voice Interfaces for Underserved Communities
593
Fig. 22.1 High-level user interface design of CGNet Swara
reliable than speech. Over the subsequent years, key press input became the de facto
standard for IVR services targeting developing regions.
The success of these initial services demonstrated their great potential to enable
information access and connectivity among underserved populations in diverse
contexts. However, voice forums also presented a wide array of implementation,
scalability, and sustainability challenges, including how to (1) train the users to
use speech interfaces, (2) spread and advertise these services to tech-novice and
poorly connected masses, and (3) engage users in potentially involved voice-based
interactions while keeping them oriented, motivated, and grounded. These traits of
training, spread, engagement, and retention were found to be necessary for effective
transmission of knowledge but were very hard to achieve simultaneously.
2 Scaling Voice-Based Services
In 2010, the biggest roadblocks to scaling voice forums among underserved populations were usability, motivation, and spread. Target populations faced difficulties
in using even the simplest of voice forums, they did not exhibit interest or trust
in using such services, and it was hard to advertise and spread these services to
under-connected people. Researchers tried to overcome these barriers by conducting
lab trainings, demo sessions, and door-to-door field campaigns, but it was quickly
realized that these approaches too are not scalable. The identified challenge was
to inform and train the users without the benefit of explicit, in-person sessions. To
reach people at a large scale, a need to advertise and promote these voice services
was also identified that was challenging using traditional advertising mechanisms
as these populations are low-literate and not very well connected with technology.
The way forward, unexpectedly, was found to be entertainment!
In 2010, Smyth et al. described the remarkable ingenuity exhibited by lowliterate users when they are motivated by the desire to be entertained and concluded
594
A. Vashistha and A. A. Raza
Fig. 22.2 High-level simplified user interface design of Polly
that such powerful motivation “turns UI (user interface) barriers into mere speed
bumps” (Smyth et al., 2010). Inspired by this powerful demonstration, Raza
et al. set out to systematically develop practices for entertainment-driven mass
familiarization and training of low-literate users in the use of telephone-based
services and created Polly (Raza et al., 2013a). Polly engaged low-literate and
non-tech-savvy users in light entertainment to spread useful development-related
information to them as they became more comfortable with the voice interface.
Polly allowed users to record their voice, modify it using funny voice modifications,
and send the modified recording to their friends (as shown in Fig. 22.2). The
entertainment appealed to the target users and allowed Polly to spread virally. It
acted as a soft incentive for users to train themselves and overcomes the scalability
hurdle of explicit user training and motivation. It also allowed Polly to organically
spread among the population through the word of mouth as well as scheduled
message deliveries from one user to another. As users became more comfortable
with the interface, Polly introduced them to development-related services like job
search and health information.
Polly was first pilot-tested in 2011 with 32 low-literate users who were handed
out Polly’s phone number and were asked to explore its functionality. Within
3 weeks, Polly had organically reached over 2000 users and logged more than
10,000 calls before it was shut down due to insufficient telephone capacity and
unsustainable cellular airtime cost. In 2012, Polly was relaunched in Pakistan with
an increased telephone capacity. The system was seeded via automated phone
calls to five users from the pilot launch. Within 1 week, the 30 phone lines were
saturated, and usage quotas had to be imposed. A job audio browser had also been
introduced in Polly that allowed users to listen to entry-level job ads from local
newspapers in their local language. Callers could browse job opportunities and
22 Voice Interfaces for Underserved Communities
595
could even forward promising ones to friends. Polly remained online for a year
and amassed 165,000 users who participated in 636,000 interactions, including over
200,000 forwarded voice messages and 22,000 forwarded job ads. At its peak, it
was spreading to a thousand new users every day. The 728 job ads were listened to
386,000 times by 34,000 users. Polly was used primarily by low-educated young
men for entertainment and other creative uses like voicemail, group messaging, and
telemarketing. Its viral spread crossed gender and age boundaries and also attracted
a large number of visually impaired users but remained primarily in the similar
socioeconomic strata.
Raza et al. showed that Polly’s users improved at using speech interfaces
with time. A behavior study of the 165,000 users of Polly revealed that with
more experience, users responded faster to menus (using more intentional menu
interruptions aka barge-ins) and made fewer mistakes and abortive attempts (Raza et
al., 2013a, b). Users’ choice of activity also evolved over time, and with experience,
they showed an increasing interest in message sending, became more explorative
of the system’s capabilities, and better adapted themselves to its constraints. Longterm users engaged in lengthier calls from the start and took a more active interest
in voice modification and forwarding features. The forwarding feature that allowed
users to send audio messages to friends brought 85% of all new users to the service.
An analysis of the geographical spread of Polly showed that there were calls from
all over Pakistan (Raza et al., 2013a, b).
Since 2010, Polly has been successfully used in three countries to rapidly
spread useful information to underserved populations at a large scale. In 2014,
at the peak of the Ebola crisis in West Africa, Polly-Santé (Polly-Health) was
deployed as an emergency disaster response service in Guinea to spread reliable
information about prevention, symptoms, and cure of Ebola (Wolfe et al., 2015).
The information originated from the US Centers for Disease Control and Prevention
(CDC), and the service was funded by the US Embassy in Conakry. A hurdle to
scale information dissemination in the Guinean context was great linguistic diversity
and the lack of a widely understood common language. This did not turn out to
be a major impediment for voice forums, and Polly-Santé was launched in 11
local languages and reached more than 7000 users within a few months. In India,
Polly was used by Babajob.com to advertise a voice directory of available jobs to
thousands of low-literate job seekers and by Jharkhand Mobile Vaani, a popular
citizen-radio-over-phone platform, to spread awareness about their platform using
a “cross-selling” model of advertisement (Raza et al., 2016). These deployments
highlighted the significance of committed local partners and showed that seeding
via promos and advertisements has the potential to induce viral spread and that
the content, mood, and tone of the promos play a vital role in influencing a user’s
understanding of the service and its capabilities.
Despite their demonstrated impact on user training, trust, and service spread,
voice forums like Polly face three major challenges that significantly impede their
scalability and sustainability: (1) how to moderate, filter, and manage the massive
user-generated local language audio content in near real time; (2) how to retain the
users of the service for long-term interactions, as most users of Polly just stop using
596
A. Vashistha and A. A. Raza
the platform within days as the novelty of the simple entertainment wears off; and
(3) how to manage the high call costs required to subsidize these voice forums for
the target users who are mostly not able to afford such expenses on their own. These
challenges were further amplified as voice forums evolved from being peer-to-peer
(individual) to broadcast (social) platforms.
3 Managing Local Language Audio Content
Voice forums quickly evolved to be a de facto social media platform for basic
phone users where they record, listen to, and vote on audio messages generated
in local languages. However, since such voice forums generate a large amount
of audio content in low-resource languages and accents that are unsupported by
advancements in natural language processing, it is very difficult to automate categorization and moderation of posts and responses, which are needed for respectful
use of the service. Lack of categorization makes it very hard for users to browse
data and providers to regulate these services. This is a major hurdle for voice
modality where users must listen to audio content in a sequential manner and cannot
skim it like textual content. Also, voice forums are often deployed in low-resource
environments where most people lack technical know-how of social media, making
them particularly vulnerable to disinformation and fake news. For example, recent
acts of mob violence in India have been attributed to fake WhatsApp4 messages,5
which can also be easily recorded and shared on voice forums. These reasons make
content moderation critical to present users with respectful, accurate, and highquality recordings.
Large voice forums typically employ a dedicated team of moderators, who
screen posts, offer feedback to contributors, and perform tagging, categorization,
and moderation of audio posts. For example, both CGNet Swara and Mobile Vaani
currently employ 10–15 full-time moderators who carefully review each submitted
post. Although manual moderation is highly accurate, it becomes difficult to scale
as these services grow, due to high cost, delayed response, and challenges in hiring
moderators who are familiar with local context.
Several news and social networking sites like Reddit and Stack Overflow draw
on collaborative filtering and community moderation algorithms to manage usergenerated content. They use community votes and recency to determine high-quality
and contextually relevant user-generated content. Since most of the content on these
platforms is textual, a number of natural language processing techniques have been
employed to categorize, annotate, and moderate content and even predict emotions.
However, no prior work has focused on using community moderation on a voice
4 S.
Biswas, “How WhatsApp helped turn a village into a mob,” BBC News, July 19, 2018.
Goel, S. Raj, and P. Ravichandran, “How WhatsApp Leads Mobs to Murder in India,” The
New York Times, July 18, 2018.
5 V.
22 Voice Interfaces for Underserved Communities
597
forum, which is different in several ways from community moderation on a textbased forum. For example, audio content is more difficult to skim than textual
content, meaning that users may lose patience in hearing and ranking lower-ranked
posts. An IVR system can track exactly what a user listened to and what content
they skipped, which is difficult to do on a webpage. Finally, the limited affordances
of an IVR interface and the limited digital skills of voice forum users add more
constraints to the design of community moderation algorithms.
To address the content moderation challenge, Vashistha et al. harnessed collaborative filtering and community sourcing and showed that the users of voice forums,
although socioeconomically marginalized and technologically inexperienced, can
themselves be entrusted with the tasks of audio content moderation and categorization (Vashistha et al., 2015a). Recognizing that entertainment drives technology
adoption by low-income people, they built a new voice forum called Sangeet Swara,
a community-moderated social media service that enabled users to record, listen
to, and vote on songs, poems, and other cultural content. Figure 22.3 shows the
high-level user interface design of the voice forum. As users listened to messages,
Sangeet Swara requested them to annotate the quality and category of the content by
pressing phone keys (e.g., press 1 to upvote or 2 to downvote the message) and used
collaborative filtering techniques to rank, order, and categorize audio posts based
on users’ votes. A key aspect of the system was that it ranked the posts based on
feedback from the community. The ranking aimed to order the posts according to
what was most likely to be enjoyed and appreciated by listeners. There was a single,
global ranking computed across all posts and all listeners in the system. In addition
to the rank order, the system calculated a separate playback order that determined
which post a listener heard at a given time. The playback order balanced the interests
of listeners (who desired to hear high-quality posts) with the interests of content
contributors (who desired to have as large of an audience as possible). Both the rank
order and playback order were dynamically updated based on listeners’ ratings of
the content.
Fig. 22.3 High-level simplified user interface design of Swara and Baang. Additional components
in Baang’s UI design are represented in red color
598
A. Vashistha and A. A. Raza
To create awareness about Sangeet Swara in rural and small-town India,
Vashistha et al. seeded Sangeet Swara with 15 songs and poems that appeared
previously on CGNet Swara and posted a message on CGNet Swara to invite
participation from its users. The post was accessible to CGNet Swara callers for
2 days, during which time it was heard by 393 unique callers. Out of those, 73 people
placed a call to Sangeet Swara. In an 8-month deployment in India, Sangeet Swara
received 53,000 phone calls from 13,000 users who submitted 6000 voice messages
in 11 languages as well as 150,000 votes. Nearly 80% of users had never used any
social media platform before, 50% lived in low-income environments in rural India,
and 25% were people with visual impairments (Vashistha et al., 2015a, b). Many
users attributed great value to their interactions on Sangeet Swara. They recorded
strong positive sentiments about the service and shared interesting anecdotes about
how the service was impacting their lives. They considered it to be a platform where
people show their creativity, voice their opinions, and record interesting content.
This sentiment was often strongest among visually impaired users. The findings
indicate that users took an active role in policing the system, for example, by urging
others to record cultural content, to follow community guidelines, and to avoid
posting abusive comments. Community moderation was 98% accurate in content
categorization, made meaningful distinctions between high- and low-quality posts,
and performed judgments that were in 90% agreement with expert moderators. The
ability to vote, comment, and share led to viral spread, deeper engagement, and
the emergence of true dialog among participants. Beyond connectivity, Sangeet
Swara provided its users with a voice and a social identity as well as a means to
share information and get community support. Moreover, it demonstrated that a
community of low-income, low-literate people can moderate themselves without
any outside support, thereby addressing the content management challenge of these
voice forums.
Although Sangeet Swara demonstrated the feasibility, acceptability, usability,
and efficacy of community moderation, several aspects of community moderation
remain untested. For example, Sangeet Swara focused on the domain of entertainment, where the content is relatively uncontroversial. Extending to domains such
as politics and citizen journalism will require sensitivity to stronger disagreements
between callers, which could impact their ratings as well as their flagging of posts
for deletion. Similarly, the community moderation algorithm can be improved
by making it more sensitive to who is voting and when they are voting. For
example, discounting votes of users who acted too soon or those who deviated
from community standards (e.g., people who abused other users) could reduce
randomness in moderation. Similarly, assigning higher weights to votes of users
who call consistently and record high-quality posts could improve the quality
of moderation. Future work should identify features to predict casual voting by
community members.
22 Voice Interfaces for Underserved Communities
599
4 Increasing User Retention
Unlike Polly users that churn at a high rate as the novelty wears off, Sangeet Swara
saw much lower churn rate and high user engagement throughout its deployment.
To investigate these effects more systematically, Raza et al. created Baang, a social
media voice forum with in-built mechanisms to achieve greater spread and uptake as
well as deeper and long-term engagement (Raza et al., 2018). The interface of Baang
was inspired by both Polly and Sangeet Swara and included two novel features.
Like Sangeet Swara, Baang allowed users to create and consume audio content and
express their feedback via likes and dislikes (see Fig. 22.3). Similar to Polly, users
could share audio content with friends, and Baang actively called up the recipients
to deliver the messages. In addition to these features, Baang also allowed users to
record audio comments on posted messages and also allowed them multiple options
to control the order of playback of messages (popularity, recency, and trending).
Deployed in Pakistan in 2015, Baang organically reached 10,000 users (69%
of them were blind) within 8 months who participated in nearly 270,000 calls
and contributed more than 44,000 voice messages that were played more than 2.8
million times and received 340,000 votes, 124,000 audio comments, and about
95,000 shares. The user retention of Baang was significantly higher compared to
Polly. The differences between the two services became more pronounced after a
week when more than 20% of users returned to Baang, while Polly only retained less
than 5% of its users beyond the initial week of exposure. Up to 20% of Baang’s users
(compared to 1% to 3% in case of Polly) kept returning after 4 weeks. Quantitative
analysis of usage patterns revealed that the user retention was highly associated with
the act of posting audio comments. Interestingly, posting of comments was found
to be a better predictor of continued use compared to any other single action of the
platform including posting of messages. The viral spread of Baang was found to
be largely through the message sharing feature where 60% of all new users were
introduced to the platform through forwarded messages.
The analysis found that Baang created a community of users from diverse socioeconomic and linguistic backgrounds including 69% blind people, 10% females,
and mostly low-educated, unemployed, young men from all over Pakistan. Baang’s
open community included people from remote areas and linguistic minorities. Social
network features like voting, content sharing, and voice comments led to viral and
enthusiastic uptake of the service, high user engagement and retention, and true
dialog among the community. Baang provided a window into the collective values of
a community as they raised their voice against disability abuse, female harassment,
foul language, hatred, and terrorism and united for their rights and in support of the
oppressed. Like Sangeet Swara, Baang showed that orality-driven social platforms
have the potential to provide under-connected and tech-naive individuals with a
voice and social identity.
600
A. Vashistha and A. A. Raza
5 Managing Cost
Although the success of services like Polly, Sangeet Swara, and Baang is very
encouraging, there is a growing concern among global development researchers and
practitioners about the high operating costs of voice forums especially when they
reach a large scale. Providers of these services often pay for the cost of acquiring
toll-free lines so that low-income people can access these services for free. However,
this cost becomes prohibitive as the usage increases, often putting these services
at risk of being shut down. For example, Polly was discontinued several times
because of the lack of resources to meet growing call volumes. Many voice forums
rely on external funding in the form of grants and awards to subsidize the cost
of voice calls; however, the non-deterministic nature of such opportunities makes
this approach unsustainable. For example, the founder of CGNet Swara expressed
frustrations about how limited funding to subsidize phone calls may cause them
to “shut down completely”.6 Some voice forums, including Sangeet Swara, have
conducted experiments to examine users’ willingness to bear the cost of voice calls;
however, the outcome of such experiments have consistently shown that low-income
users are unable to afford the cost of voice calls regardless of the benefits offered by
the service (Vashistha et al., 2015a, b).
A few voice-based services such as Kan Khajura Tesan7 and Mobile Vaani
have used advertising revenues to subsidize the cost of voice calls. These services
advertise products and services that cater to low-income consumers in rural and periurban areas (e.g., small sachets of washing powder, toothpaste, and soap). Although
these services are existential proof of advertising as a viable approach to financially
sustain large-scale voice forums, the initial investment required to gain critical mass
for advertising is often beyond the reach of most bottom-up, development-focused
voice forums.
Some voice forums such as Ila Dhageyso and 3-2-1 Service8 have partnered
with government agencies and mobile network operators to subsidize the cost of
voice calls. Although such partnerships greatly reduce the burden of voice call costs,
building and maintaining such partnerships is seldom possible due to mismatch in
goals, expectations, and values. Given these limitations in existing approaches to
financially sustain voice forums, there is an urgent need to find alternatives to reduce
the burden of phone calls on voice forum providers.
Recently, Vashistha et al. examined an alternative approach to address the
financial sustainability challenge. They investigated whether low-income users of
6 A. S. Writer, “Amid fund crunch, CGNet Swara eyes shift to Bluetooth radio
tech,” https://www.livemint.com/, Sep. 25, 2016. https://www.livemint.com/Politics/
UcrYsrB8fIAGTDiIoC452N/Amid-fund-crunch-CGNet-Swara-eyes-shift-to-Bluetooth-radio.
html (accessed Sep. 04, 2018).
7 “Kan Khajura Tesan.” http://www.kankhajuratesan.com/ (accessed Feb. 23, 2017).
8 “3-2-1 – On-Demand Messaging for Development.” http://hni.org/what-we-do/3-2-1-service/
(accessed Sep. 04, 2018).
22 Voice Interfaces for Underserved Communities
601
these services could complete useful work on their mobile phones to offset their
participation costs on services like Sangeet Swara. To do so, they designed and built
Respeak, a new crowdsourcing marketplace that works on basic mobile phones and
offers tasks that do not require familiarity with English language and advanced skills
like typing, unlike mainstream crowdsourcing marketplaces like Mechanical Turk
and CrowdFlower. Respeak is a voice-based, crowd-powered speech transcription
system that pays users to transcribe audio files vocally (Vashistha et al., 2017,
2018, 2019a, b). To obtain transcription of an audio file, Respeak partitions the
file into small audio segments and sends these segments to multiple users. Instead
of typing the transcript on a phone’s keyboard with constrained physical space,
users re-speak (i.e., repeat) audio content into an off-the-shelf speech recognition
engine and submit the speech recognition output as a transcript. Once multiple users
submit transcripts for a particular segment, Respeak combines the transcripts using
sequence alignment algorithms to reduce random speech recognition errors. Based
on the overlap between aligned transcript and individual transcripts, Respeak sends
rewards to users via mobile airtime or mobile payment, thereby incentivizing them
to complete more tasks accurately. Figure 22.4 shows the high-level illustration of
Respeak’s design.
Before launching the Respeak system widely, Vashistha et al. conducted a range
of cognitive experiments, usability studies, and experimental evaluations to assess
its feasibility, usability, and acceptability. For example, they investigated how audio
segment length and presentation order affect content retention and cognitive load
on Respeak users, whether speaking is indeed a more efficient and usable output
medium for transcription than typing, and how different phone types, channel types,
and modes to review transcripts affect task accuracy and completion time. After
iteratively incorporating insights from these evaluations into Respeak’s design, they
deployed it to 73 low-income students, blind people, and rural residents in India
for nearly 2 months by partnering with Indian Institute of Technology Bombay
Fig. 22.4 A high-level illustration of Respeak’s design. Areas inside dotted lines represent the
processes of the engine
602
A. Vashistha and A. A. Raza
(IIT Bombay), Enable India, and Nehru Yuva Sangathan Tisi (NYST), respectively.
Collectively, users transcribed 70 hours of audio data by completing 50,000 micro
tasks with an average accuracy of 70% and earned INR 31,000 at an hourly rate that
exceeds the average hourly wage in India. Respeak then merged transcripts from
multiple users to produce the transcript with over 90% accuracy at one-fourth of
the market rate, generating sufficient profit to subsidize participation costs of other
voice-based services. The analysis indicated that 1 min of crowd work on Respeak
could subsidize 8 min of airtime on services like Sangeet Swara. User evaluations
also indicated that voice forum users were willing to do tasks on Respeak to get
subsidized airtime to use other voice-based services like Sangeet Swara. Also,
switching between these two services – Respeak to complete crowd work and
Sangeet Swara to use free credits – did not affect the usability and experience
of users on both services. Although Vashistha et al. demonstrated the promise of
using crowd work to financially sustain voice forums, future work should look
at conducting long-term deployments, large-scale field evaluations, and real-time
integration with existing voice forums like CGNet Swara and Mobile Vaani to
uncover issues that may arise at scale.
6 Replication and Scale
Despite the enthusiasm surrounding voice forums, the unfortunate reality is that it
remains quite complex to install and configure them. Many services like CGNet
Swara, Avaaj Otalo, and PhonePeti utilize open-source platforms like Asterisk9
or FreeSWITCH10 for the telephony interface and require hosting a web server to
connect with moderators (Koradia & Seth, 2012). Although tractable for technology
researchers, using these platforms requires Linux expertise that is usually beyond
the reach of many grassroots and non-governmental organizations that have no inhouse developers.
Another issue in scaling voice forums is the implementation of the underlying
architecture. Most voice forums have a centralized architecture that provides a single
access point (or calling number) for users, making it difficult to scale the service to
new geographic locations. For example, if an organization would like to scale a
voice forum operating in region A to another region B, then either users living in
B need to make an expensive long-distance phone call to the access point in region
A or the organization needs to set up a local service in B, thereby disconnecting
people in the two locations. Also, most voice forums currently operate in silos and
are disconnected from mainstream social media platforms, impairing information
exchange between different local communities as well as global audience, which
might be desirable in cases like political activism, human rights violation reporting,
etc.
9 “Asterisk.org,”
Asterisk.org. http://www.asterisk.org/ (accessed Sep. 15, 2016).
| Communication Consolidation.” https://freeswitch.org/ (accessed Sep. 15,
10 “FreeSWITCH.org
2016).
22 Voice Interfaces for Underserved Communities
603
Current toolkits to build voice forums like Asterisk and FreeSWITCH do not
offer such features to support distributed, scalable, and connected operations.
Although cloud telephony systems – like Twilio, Tropo, Exotel, KooKoo, and
engageSPARK – make it easy for organizations that lack technical expertise to
build and maintain voice forums, these services are very expensive to use, are
disconnected from social media platforms, and do not synchronize content across
distributed call centers, making them less scalable and disconnected.
To address these bottlenecks in building, replicating, and maintaining voice
forums at scale, Vashistha et al. built IVR Junction: a free and open-source toolkit
that enables organizations to build and replicate voice forums (Vashistha & Thies,
2012). IVR Junction has three main advantages over existing IVR toolkits like
Asterisk, Freedom Fone,11 and FreeSWITCH:
1. Easy to build and set up: IVR Junction makes it easier for organizations with
limited technical skills to build, set up, and maintain voice forums. Using IVR
Junction, anyone with basic computer literacy can use templates and configure
simple options to set up a robust voice forum as an ordinary program on a
Window-based commodity machine.
2. Distributed architecture: IVR Junction enables distributed access points, thereby
connecting multiple geographically distributed communities via inexpensive
local calls as well as enabling robustness to regional power outages or crackdowns by repressive regimes.
3. Global reach: IVR Junction integrates voice forums with free Internet services
and social media platforms – recordings contributed over the phone are immediately broadcast on YouTube and Facebook, and posts made on the Internet
can also be listened to over the phone. Thus, IVR Junction enables anyone with a
basic mobile phone to participate in global social media; low-income populations
can record and listen to posts via mobile phone, while the global community can
access and contribute recordings via the Internet. This capability enables remote
communities to create their own repositories of highly relevant information while
also sharing them with audiences worldwide.
In the last few years, IVR Junction has been used by many organizations to
connect people in low-resource environments and provide them access to information, news, and governance. For example, in Somaliland, IVR Junction was used to
build a voice forum that established a direct communication channel between the
rural tribal population and government officials to bring transparency and trust in
the political processes (Gulaid & Vashistha, 2013). Somaliland – an autonomous
region of Somalia – has fragile political institutions, fragmented and polarized
media, and unstable government. Parliamentarians in the capital city were unable
to convey their policies and receive feedback from low-literate constituents living
in remote, rural, disconnected regions due to misinformation by partisan media.
The solution to this intractable problem appeared simple: connect parliamentarians
11 “Freedom
Fone.” http://www.freedomfone.org/
604
A. Vashistha and A. A. Raza
directly with their communities. However, Facebook and Twitter were infeasible
solutions in a region with extremely low Internet penetration and adult literacy rate.
To overcome these challenges, IVR Junction was used to build Ila Dhageyso, a
voice forum that enabled parliamentarians and constituents to call a phone number
and record and listen to asynchronous audio posts in a discussion forum format. Ila
Dhageyso also automatically posted these audio messages to a YouTube channel to
engage with Somaliland’s diaspora. The voice forum was supported by the Office
of the Communication of the President and Telesom (the largest telecommunication
company in Somaliland) and was launched as a toll-free line so that people living
in poverty could participate. The deployment received an enthusiastic response both
from the constituents and parliamentarians who recorded over 4300 audio messages
in just 5 months.
In war-torn Mali, the Broadcasting Board of Governors and Voice of America
used IVR Junction to provide on-demand, reliable, and up-to-date news in the local
language. People in Mali called the service to listen to a 3-minute news broadcast by
Voice of America, thereby getting access to breaking news and health information
as well as sharing their feedback.
In India, IVR Junction was used by women’s rights activists in response to a
gang rape incident in New Delhi that sparked international outrage. They built
a voice petition forum where supporters from all economic backgrounds and
varied literacy levels raised their voice for women’s safety and empowerment. The
recordings, which spanned from support for the victim to plans for sensitizing local
communities, were available not only on the voice forum but also on a YouTube
channel and Facebook page, thereby dramatically amplifying the local voices.
7 Mechanisms of User Acquisition
Until now we have discussed the unique advantages of voice forums in isolation without establishing a comparison between such forums and other available
means in developing regions to reach various development goals. As discussed,
technology-based interventions typically require significant resources to achieve
scale beyond the pilot stage. Spreading awareness, acquiring users, and retaining
them over time are all significant barriers to scale. While we have discussed that
voice-based entertainment services can be used as vehicles for spreading development services, it is not clear how well such entertainment-driven proliferation
performs in comparison with traditional advertising channels in terms of cost, extent
of spread, and quality of user engagement.
Raza et al. compared various advertisement channels side by side as they attempt
to scale the same development service – a maternal health hotline, Super Abbu,
connecting expectant parents anonymously to trained gynecologists (Naseem et al.,
2020). They also show how users acquired through various channels fare in terms
of overall activity, engagement, seriousness of purpose, and IVR sophistication.
An 11-week campaign was conducted where users were acquired for Super Abbu
22 Voice Interfaces for Underserved Communities
605
through seven different advertising channels: (1) paper flyers, (2) banners displayed
at the back of auto rickshaws, (3) cable TV ads, (4) radio ads, (5) robocalls, (6)
sponsored Facebook ads, and (7) an IVR-based entertainment service. Across these
channels, they reached 21,770 users who engaged in over 32,500 interactions on
Super Abbu. To assess the efficacy of the channels, three main user acquisition
metrics were considered: conversion rate, cost of user acquisition, and retention
rate. Furthermore, to understand whether the IVR users interact with Super Abbu
differently from users acquired through other channels, users were compared in
terms of their activity, engagement, and IVR use sophistication.
The results show that IVR platforms (robocalls and Polly) performed better than
other platforms (Facebook, flyers, radio, cable TV, and rickshaw ads) in terms
of user acquisition. Users acquired through the IVR entertainment service (Polly)
performed better than other channels in all interface-related measures (activity,
feature engagement, use of sophisticated interface features, and retention). Only
robocalls, Facebook, and the entertainment service were able to acquire users at
relatively low cost per user (around $1 or less). In contrast, most users acquired from
outside of the entertainment service did not end up becoming long-term users of the
development service. Their findings also show the comparatively lower performance
of increasingly popular social media advertising platforms (Facebook) to recruit
low-income users (91 recruits out of over 100,000 people reached).
This study established that voice forums perform better compared to other means
as advertisement channels that recruit users for development intervention. It also
revealed the surprising lack of success of mainstream social media platforms for
user acquisition in developing regions.
8 Measuring Impact
Generally, impact assessment of information campaigns is carried out via followup surveys to measure knowledge retention. However, measuring impact presents a
unique set of challenges when information is mass disseminated using voice forums.
To encourage spread, inclusiveness, and anonymity, such services do not require
users to go through any formal recruitment or registration, and a significant fraction
of users only engage with a handful of calls. As a result, manual or telephonic
baseline and end line surveys are not feasible. In addition, such surveys are hard to
scale and prone to delays. Consequently, despite a growing number of telephonic
campaigns, there has been little focus on the measurement of retention of the
delivered information. Due to a lack of rapid, scalable, and reliable mechanisms to
quantify and measure knowledge retention, campaigns mostly resort to measuring
only the extent of delivered information (for instance, number of calls and number
of users who listened to the information content).
The services described in this section make use of voice-based quizzes to
simultaneously spread information and measure its impact on the knowledge of
the target users. These services use various incentives to engage the users in
606
A. Vashistha and A. A. Raza
answering multiple-choice questions over IVR interactions. As the users provide
their responses, they are informed about the correct answers to these questions.
Such interactions allow the users to actively participate in learning about topics that
are instrumental for their development. Their score as they keep engaging with the
quizzes acts as an indicator of how well the information dissemination influences
their knowledge and beliefs.
Raza et al. merge knowledge gap discovery, information dissemination, and
knowledge retention measurement into one service, using voice-based quizzes. They
show that voice-based quizzes over simple mobile phones, consisting of multiplechoice questions, can be used to simultaneously measure the existing knowledge
gaps as well as to disseminate information. Rephrased versions of quiz questions
are repeated at regular intervals to measure retention of conveyed information.
Long-term user engagement is encouraged by allowing users to contribute their
own questions and with social connectivity, gamification, and spirit of competition
that make the service engaging and fun for the target audience. The resulting
service, Sawaal, allowed its open community of users to post and attempt multiplechoice questions and to vote and comment on them (Raza et al., 2019). Sawaal
was designed to spread virally as users challenge friends via shared quizzes
and compete for high scores. Administrator-posted questions allowed discovering
knowledge gaps, spreading correct information, and measuring knowledge retention
via rephrased, repeated questions. Community-contributed quiz content and an
ability to play against friends for high scores led to inclusion and ownership,
active collaborative learning, and a spirit of competition among the users. Sawaal
spread organically among the target audience, received an enthusiastic response,
and successfully retained a significant fraction of the users for several weeks. In
14 weeks and with no advertisement, Sawaal reached 3400 users (120,000 calls) in
Pakistan, who contributed 13,000 questions that were attempted over 450,000 times
by 2000 users. Knowledge retention remained significant for up to 2 weeks. Surveys
revealed that 71% of the mostly low-literate, young, male users were blind.
Along a similar theme, Swaminathan et al. created Learn2Earn to spread
awareness in rural areas of developing regions about critical issues in health,
governance, and other instrumental topics (Swaminathan et al., 2019). While Sawaal
incentivized platform usage through gamification, competition, and social media
soft incentives of likes and votes, Learn2Earn leveraged mobile payments to bolster
public awareness campaigns in rural India. Users who interacted with the service
listened to a brief tutorial followed by a multiple-choice quiz. Users who passed
the quiz received a mobile top-up (approximately $0.14) and got the opportunity to
earn additional credits by referring others to the service. The pilot deployment of
Learn2Earn reached 15,000 people within 7 weeks via word of mouth. Most of the
users were young men including a large fraction of students. Learn2Earn was shown
as a viable way of building awareness among target users about important topics.
While these techniques of remotely contacting low-income, low-literate populations, engaging them in interactive quizzes, and gauging their awareness around
important topics were created originally in the development context, the lessons
learned from these services have a broader appeal during crises like COVID-19
22 Voice Interfaces for Underserved Communities
607
where it is difficult to conduct door-to-door surveys. Services like Sawaal and
Learn2Earn may be employed to remotely examine knowledge gaps and gather user
feedback in such crisis scenarios.
9 Open Challenges
Most of the work focusing on voice forums demonstrates their promise to serve
as instruments of inclusion for low-literate people, rural residents, indigenous
communities, and people with visual impairments. However, like any other social
platform, voice forums come with their own pitfalls. They end up reflecting the
existing sociocultural norms and values of the society, including its shortcomings
and biases. For example, evaluation of several voice forums revealed extremely
low participation of women despite that these services are designed to be inclusive,
accessible, and usable for everyone: CGNet Swara and Sangeet Swara in India have
only 12% and 6% female contributors, respectively; Baang and Polly in Pakistan
have only 10% and 11% female contributors, respectively; and Ila Dhageyso, a
voice forum to connect government officials and tribal people in Somaliland, has
only 15% female users. Table 22.2 shows the usage of Sangeet Swara and Baang by
male and female users.
To examine why the participation of women is almost non-existent on social
media voice forums that are designed to be inclusive, accessible, and usable for
everyone, Vashistha et al. examined Sangeet Swara and Baang, two widely popular
social media voice forums in India and Pakistan, respectively (Vashistha et al.,
2019a, b). Using a mixed methods approach spanning quantitative analysis of usage
logs, content analysis of 10,361 posts containing 140 h of audio data, and qualitative
analysis of 50 surveys and interviews, they investigated how men and women
interacted with each other on these services, what content they posted and voted,
and what factors affected their participation.
The analysis found that female users of Sangeet Swara and Baang faced systemic
discrimination and harassment in the form of abusive, threatening, and flirty posts
directed at them. Most women lacked agency to retaliate due to deep-rooted
patriarchal values that discourage them from arguing and questioning others. They
were worried of backlash, on the service from predatory men and in real life from
family members, if they record threatening responses or responded to flirty posts. On
Table 22.2 Usage statistics by gender for Sangeet Swara and Baang for random 5000 posts
Voice forum
Gender Total posts
Sangeet Swara Male 4764
Female 275
Baang
Male 4142
Female 325
Unique
users
419
31
376
31
Likes
21,630
270
8181
508
Dislikes
58,644
2636
5541
253
Shares
189
15
778
2
Comments
Reports
Not applicable
1942
25
2061
25
608
A. Vashistha and A. A. Raza
the other hand, many male users perceived women as objects of desire, reinforcing
patriarchy in these digital social spaces. Male users who behaved inappropriately
ganged up on those who criticized their behavior. Although only a fraction of male
users recorded objectionable comments, most other male users condoned the unruly
behavior of other men and disapproved of objectionable messages less strongly than
women did.
A large fraction of women in low-income communities only have access to
shared mobile devices where usage is directed by male family members. Social
media voice forums like Sangeet Swara and Baang have been only marginally
successful in reaching to some women in these communities; however, they are still
a long way from providing a welcoming, vibrant, safe, and enriching environment to
women. The experience of women users of Sangeet Swara and Baang demonstrates
that access is just a first step toward actual and meaningful social inclusion, and
more is required to address secondary barriers to women’s digital inclusion beyond
the basic hurdles of literacy, connectivity, and poverty. There is an urgent need to
re-think the design of these services and use participatory design approaches to
ensure that we provide equitable and inclusive social platforms for women. We
also emphasize the importance of using the intersectionality lens while designing
technologies aiming for inclusion to ensure that they do not widen existing
economic, racial, cultural, and societal inequalities.
Like mainstream social media platforms, voice forums also face grand challenges
when tackling misinformation and disinformation, especially since the posts are
audio recordings in local languages that are unsupported by the advances in natural
language processing. Our ongoing investigations have uncovered the presence of a
significant amount of false posts, misinformation, and hoaxes related to the COVID19 pandemic on Baang. It is important to note that voice forums like Baang differ
greatly from mainstream social media platforms like Facebook in terms of scale,
features, interfaces, supported languages, and target users. Consequently, solutions
to tackle these challenges on a platform like Facebook might be ineffective for
voice forums and vice versa. This presents interesting research challenges of understanding the composition of misinformation on voice forums, measuring diffusion
properties of false posts, examining interaction of low-literate users with suspicious
posts, understanding strategies users employ to verify information, and designing
new tools and techniques to combat misinformation. The HCI4D community needs
to tackle grand challenges like harassment, abuse, and misinformation to make these
services truly diverse, inclusive, and impactful.
10 Summary
While Internet services have transformed how people participate in the information ecology and digital economy, these services have discounted the needs and
wants of billions of people who experience literacy, language, socioeconomic,
and connectivity barriers. To address the information and instrumental needs of
22 Voice Interfaces for Underserved Communities
609
these people, several HCI4D practitioners and researchers have designed voice
forums that enable users to interact with others via ordinary phone calls in local
languages. Although voice forums have had a demonstrated impact on marginalized
communities, most forums operate at a pilot scale because of known challenges
in training and retaining users, managing local language content and costs of
voice calls, difficulties in building and deploying these services, and measuring
impact. This chapter discussed the innovation, implementation, and adaption of
voice forums along with several approaches used to scale, sustain, and replicate
them.
Discussion Questions
1. Why is speech-over-simple phones a viable strategy to provide information and
connectivity to low-literate, non-tech-savvy, visually impaired, and marginalized
segments of the society? How does this strategy compare with other modalities
like television, radio, newspapers, websites, and smartphone apps?
2. Using the case studies discussed in the chapter as an inspiration, identify the
features of voice forums that can help attain the following objectives:
(a)
(b)
(c)
(d)
The service should spread virally among users.
The service should promote user engagement.
The interface should promote improvements in usage patterns of the users.
Users should keep returning to the service for a long time (several weeks,
months, or years).
(e) Users should retain the information delivered by the service.
3. How does viral (person-to-person) spread compare with broadcast spread?
Assume that you need to spread a voice forum among people in a rural
developing region. You have two options: schedule automated calls (robocalls) to
every phone number in the village or create a viral service and recruit a handful
of initial users to seed the spread. Discuss the benefits and shortcomings of each
of these approaches.
4. If you have a high accuracy speech recognizer for languages of developing
regions, would speech input be preferable over touch-tone (key press) input in
voice forums? Discuss the benefits and shortcomings.
5. In addition to speech transcription, which other tasks are suitable for voice forum
users to gain airtime and earn money?
6. Would voice forums become obsolete when underserved people gain access to
low-cost smartphones and affordable Internet access?
7. How could voice forums be designed to be more inclusive, safe, and welcoming
to women?
8. What lessons could be used from this chapter to design a voice-based social
media platform for people in developed regions of the world?
610
A. Vashistha and A. A. Raza
References
Gulaid, M., & Vashistha, A. (2013, December). Ila Dhageyso: An interactive voice forum to foster
transparent governance in Somaliland. In Proceedings of the sixth international conference on
information and communications technologies and development: Notes-volume 2 (pp. 41–44).
Koradia, Z., Balachandran, C., Dadheech, K., Shivam, M., & Seth, A. (2012, March). Experiences
of deploying and commercializing a community radio automation system in India. In Proceedings of the 2nd ACM symposium on computing for development (pp. 1–10).
Koradia, Z., & Seth, A. (2012). PhonePeti: Exploring the role of an answering machine system
in a community radio station in India. In Proceedings of the fifth international conference on
information and communication technologies and development.
Mudliar, P., Donner, J., & Thies, W. (2012, March). Emergent practices around CGNet Swara,
voice forum for citizen journalism in rural India. In Proceedings of the fifth international
conference on information and communication technologies and development (pp. 159–168).
Moitra, A., Das, V., Vaani, G., Kumar, A., & Seth, A. (2016, June). Design lessons from
creating a mobile-based community media platform in rural India. In Proceedings of the eighth
international conference on information and communication technologies and development
(pp. 1–11).
Naseem, M., Saleem, B., St-Onge Ahmad, S., Chen, J., & Raza, A. A. (2020, April). An
empirical comparison of technologically mediated advertising in under-connected populations.
In Proceedings of the 2020 CHI conference on human factors in computing systems (pp. 1–13).
Patel, N., Chittamuru, D., Jain, A., Dave, P., & Parikh, T. S. (2010, April). Avaaj otalo: A field study
of an interactive voice forum for small farmers in rural India. In Proceedings of the SIGCHI
conference on human factors in computing systems (pp. 733–742).
Patel, N., Shah, K., Savani, K., Klemmer, S. R., Dave, P., & Parikh, T. S. (2012, March). Power to
the peers: Authority of source effects for a voice-based agricultural information service in rural
India. In Proceedings of the fifth international conference on information and communication
technologies and development (pp. 169–178).
Patel, N., Agarwal, S., Rajput, N., Nanavati, A., Dave, P., & Parikh, T. S. (2009, April). A
comparative study of speech and dialed input voice interfaces in rural India. In Proceedings
of the SIGCHI conference on human factors in computing systems (pp. 51–54).
Smyth, T. N., Kumar, S., Medhi, I., & Toyama, K. (2010, April). Where there’s a will there’s a
way: Mobile media sharing in urban India. In Proceedings of the SIGCHI conference on human
factors in computing systems (pp. 753–762).
Raza, A. A., Ul Haq, F., Tariq, Z., Pervaiz, M., Razaq, S., Saif, U., & Rosenfeld, R. (2013b, April).
Job opportunities through entertainment: Virally spread speech-based services for low-literate
users. In Proceedings of the SIGCHI conference on human factors in computing systems (pp.
2803–2812).
Raza, A. A., Rosenfeld, R., Haq, F. U., Tariq, Z., & Saif, U. (2013a, January). Spread and
sustainability: The geography and economics of speech-based services. In Proceedings of the
3rd ACM symposium on computing for development (pp. 1–2).
Raza, A. A., Kulshreshtha, R., Gella, S., Blagsvedt, S., Chandrasekaran, M., Raj, B., & Rosenfeld,
R. (2016, June). Viral spread via entertainment and voice-messaging among telephone users in
India. In Proceedings of the eighth international conference on information and communication
technologies and development (pp. 1–10).
Raza, A. A., Saleem, B., Randhawa, S., Tariq, Z., Athar, A., Saif, U., & Rosenfeld, R. (2018, April).
Baang: A viral speech-based social platform for under-connected populations. In Proceedings
of the 2018 CHI conference on human factors in computing systems (pp. 1–12).
Raza, A. A., Tariq, Z., Randhawa, S., Saleem, B., Athar, A., Saif, U., & Rosenfeld, R. (2019,
May). Voice-based quizzes for measuring knowledge retention in under-connected populations.
In Proceedings of the 2019 CHI conference on human factors in computing systems (pp. 1–14).
22 Voice Interfaces for Underserved Communities
611
Swaminathan, S., Medhi Thies, I., Mehta, D., Cutrell, E., Sharma, A., & Thies, W. (2019).
Learn2Earn: Using mobile airtime incentives to bolster public awareness campaigns. In
Proceedings of the ACM on human-computer interaction, 3(CSCW) (pp. 1–20).
Sherwani, J., Ali, N., Mirza, S., Fatma, A., Memon, Y., Karim, M., Tongia, R., & Rosenfeld,
R. (2007, December). Healthline: Speech-based access to health information by low-literate
users. In 2007 international conference on information and communication technologies and
development (pp. 1–9). IEEE.
Vashistha, A., & Thies, W. (2012). {IVR} junction: Building scalable and distributed voice forums
in the developing world. In Presented as part of the 6th USENIX/ACM workshop on networked
systems for developing regions.
Vashistha, A., Garg, A., & Anderson, R. (2019a, May). ReCall: Crowdsourcing on basic phones to
financially sustain voice forums. In Proceedings of the 2019 CHI conference on human factors
in computing systems (pp. 1–13).
Vashistha, A., Garg, A., Anderson, R., & Raza, A. A. (2019b, May). Threats, abuses, flirting, and
blackmail: Gender inequity in social media voice forums. In Proceedings of the 2019 CHI
conference on human factors in computing systems (pp. 1–13).
Vashistha, A., Sethi, P., & Anderson, R. (2017, May). Respeak: A voice-based, crowd-powered
speech transcription system. In Proceedings of the 2017 CHI conference on human factors in
computing systems (pp. 1855–1866).
Vashistha, A., Sethi, P., & Anderson, R. (2018, April). BSpeak: An accessible voice-based
crowdsourcing marketplace for low-income blind people. In Proceedings of the 2018 CHI
conference on human factors in computing systems (pp. 1–13).
Vashistha, A., Cutrell, E., Borriello, G., & Thies, W. (2015a, April). Sangeet swara: A communitymoderated voice forum in rural India. In Proceedings of the 33rd annual ACM conference on
human factors in computing systems (pp. 417–426).
Vashistha, A., Cutrell, E., Dell, N., & Anderson, R. (2015b, October). Social media platforms for
low-income blind people in India. In Proceedings of the 17th international ACM SIGACCESS
conference on computers & accessibility (pp. 259–272).
Wolfe, N., Hong, J., Raza, A. A., Raj, B., & Rosenfeld, R. (2015, September). Rapid development
of public health education systems in low-literacy multilingual environments: Combating Ebola
through voice messaging. In SLaTE (pp. 131–136).
Open Access This chapter is licensed under the terms of the Creative Commons Attribution 4.0
International License (http://creativecommons.org/licenses/by/4.0/), which permits use, sharing,
adaptation, distribution and reproduction in any medium or format, as long as you give appropriate
credit to the original author(s) and the source, provide a link to the Creative Commons license and
indicate if changes were made.
The images or other third party material in this chapter are included in the chapter’s Creative
Commons license, unless indicated otherwise in a credit line to the material. If material is not
included in the chapter’s Creative Commons license and your intended use is not permitted by
statutory regulation or exceeds the permitted use, you will need to obtain permission directly from
the copyright holder.
Chapter 23
The Open Data Kit Project
Waylon Brunette and Carl Hartung
1 Introduction
Advances in information and communication technologies (ICTs) have transformed
the way people create, retrieve, and update information. Despite the digital
revolution during the “Information Age,” much of the world’s population was not
directly benefiting from ICTs in the 2000s. At the Millennium Summit in 2000, the
United Nations established the Millennium Development Goals (MDGs) (Jensen
2010) to combat global issues such as poverty, disease, environmental degradation,
and illiteracy. Many organizations, ranging from non-profits to governments,
began collaborating on a variety of projects that aimed to help achieve the
MDGs. The success of data-driven decision-making during the “Information
Age” led development agencies and donors to advocate for using evidence-based
development to inform future interventions. However, the scarcity of digital
technologies designed to operate in environments with limited infrastructure
slowed international development organizations’ progress in gathering timely data
for evidence-based decision-making. Additionally, the unavailability of suitable
software tools for mobile data management was a limiting factor to the types of
services organizations could provide in low-resource contexts.
Even though modern computing devices were transforming data collection
workflows, many global development organizations continued to use paper solutions because mobile digital solutions were designed with assumptions that were
problematic for remote locations. Examples of problematic design assumptions
include available Internet connectivity, available resources, and the existence of
infrastructure. The expansion of cellular telephone infrastructure, combined with
W. Brunette () · C. Hartung
Paul G Allen School of Computer Science & Engineering, University of Washington, Seattle,
WA, USA
e-mail: wrb@cs.washington.edu
© The Author(s) 2023
T. Madon et al. (eds.), Introduction to Development Engineering,
https://doi.org/10.1007/978-3-030-86065-3_23
613
614
W. Brunette and C. Hartung
the decline of mobile devices’ cost, presented organizations with an opportunity to
leverage mobile devices to replace paper data collection. In 2008, the Open Data
Kit (ODK) project was established to empower global development organizations
working in resourced-constrained contexts to build information services. ODK
provides a suite of scalable data collection tools by leveraging commercially
available mobile devices and cloud platforms. Using mobile devices to digitize data
in the field has been shown to decrease latency, improve data accuracy, and enable
richer data types to be collected than with paper, such as pictures, video, or GPS
traces.
2 Development Challenge and Initial Design Decisions
A challenge for many global development organizations was finding “appropriate”
technology that could operate effectively in a variety of locations where vulnerable
populations require assistance. Mobile devices are among the few technologies
that can operate in most locations because of their lower power requirements
and multiple networking options to connect to the Internet. Even in places with
abundant connectivity, infrastructure can be damaged or destroyed during natural
disasters, thus demonstrating the need for technology to function in disconnected
environments. The lack of suitable software tools to create mobile information services in resource-constrained contexts disrupted global humanitarian organizations’
efforts to leverage ICTs to improve services provided to beneficiaries. The ODK
project started with an investigation into “why information services technology was
not being leveraged in international development?” The problem was that many
information technologies were built for high-resource locations, leading to flawed
design assumptions about connectivity, available resources, technical expertise,
and infrastructure constraints. An “appropriate” technology provides the necessary
functionality to meet organizational requirements and is capable of operating within
the constraints of the deployment context.
For technology to assist international development organizations, the technology
should be usable by minimally-trained users, should be configurable by people with
average computer skills (e.g., not software developers), and should operate robustly
despite intermittent power and connectivity. Dr. Gaetano Borriello, the Open Data
Kit project’s visionary leader, wanted to design ICTs that focused on magnifying
human resources by leveraging technology to address global development problems. Dr. Borriello and his team at the University of Washington’s Department
of Computer Science & Engineering (UW-CSE) perceived an opportunity to
accomplish this using Google’s open-source Android operating system (OS) for
mobile devices. The challenge was to create a reusable data collection system
that was adaptable to any context so that international development organizations
could use the technology wherever they operated. The three design decisions that
shaped the ODK project were: (1) perform co-design with field organizations to
23 The Open Data Kit Project
615
test assumptions, (2) follow technology trends to leverage market forces and avoid
early obsolescence, and (3) use modular design with open source and standards to
encourage community.
To ensure that ODK would be an “appropriate” technology for global development, ODK was designed and implemented using an iterative design process.
Researchers gathered feedback from stakeholders at multiple stages for validation
and refinement. The iterative process began by listening to organizations about the
problems they experienced when attempting to use technology in their deployment
context. After identifying the technology issues, researchers would build a prototype
and then travel to the deployment context to perform co-design with the field
partners. While the researchers were in situ with field workers, they would work
side by side with field workers to make iterative changes. These co-design stages
would often last for weeks with multiple iterative changes tested in situ.
The ODK project leveraged technology trends to avoid premature obsolescence
and take advantage of global market forces. Dr. Borriello believed that by using
“appropriate” cutting-edge technology to solve global development problems, it
would be possible to leverage global technology trends to drive innovation and keep
costs low. Therefore, the ODK project focused on building a data collection platform
using commercially available mobile devices and cloud services to simplify an
organization’s ability to scale its information systems. In 2008, Dr. Borriello decided
to ignore many global development experts’ advice and chose Android devices as
an “appropriate” cutting-edge technology for low-resource contexts. He identified
a logic inconsistency by global development experts who had a relentless focus
on “low-cost” solutions without examining how technology becomes a “low-cost”
solution. The ODK project took a different approach and chose Android because
it was a new cutting-edge, open-source software platform that was encouraging
various companies to manufacture a variety of mobile devices that would run the
Android OS. The goal was that companies would design different device models
with different form factors and prices for different local markets. The hypothesis
was that global market forces would be applied to solve problems for international
development organizations as companies sought to adapt Android devices to
various local markets. The companies would use their resource to localize the
technology with appropriate language and price points for communities. Different
companies created multiple form factors that targeted different use cases, including
high-cost devices that incorporated more processing power, improved cameras,
and more accurate GPS systems. The variety of Android device form factors
enabled global development organizations to find appropriate hardware for various
interventions, contexts, and requirements. Leveraging “appropriate technology” to
enable economies of scale from the global market was one of the unconventional
decisions that contributed to the ODK project’s success.
Dr. Borriello believed the diversity of requirements from the variety of global
development organizations necessitated a modular design to encourage a community of practice to form. The ODK project’s goal was to build an open-source
community that would enable organizations to contribute both their experiences
616
W. Brunette and C. Hartung
and software code to expand and refine the project. With many different world
contexts, having an open and modular design was key to the ODK project’s
goal of engaging people to contribute their ideas. Therefore, to encourage the
creation of multiple modules, the ODK project uses a permissive, open-source
software license. The modular design and open-interface standards promote the
creation of modules that either complement or compete with the existing modules.
Additionally, by being open and modular, the barriers to contribution are lower
as developers can reuse most of the ODK frameworks’ functionality, thus saving
time and resources. The ODK project uses a free and open-source software (FOSS)
model to allow organizations with limited resources to leverage the project’s
software with minimal or no cost. In 2008, the free and open reuse model focused
on a community-building philosophy was a different operational approach for
many global development organizations. Many organizations were using custom
software built by companies, and when the intervention’s funding was depleted, the
software was often abandoned. In contrast, the ODK project focused on creating a
community that would build reusable software for many different subject domains
that organizations could leverage without purchasing the software.
3 Implementation Context
Organizations working in developing regions rely on data to determine what projects
to implement and to evaluate their program’s effectiveness. For a long time, the
most common data collection approach was to send workers into the field to collect
data on paper forms. While paper is almost universally available, inexpensive,
and requires very little training for use, it comes with several drawbacks. The
first drawback is that paper forms suffer from a lag between the time the data is
collected and the time the data is actionable by an organization. With field workers
often working in remote regions, the time between when the data is collected and
when it is delivered to a centralized location to be processed can be months. Paper
records can be lost or destroyed during transport, costing an organization months
of progress. Once gathered, more time is needed to digitize the data so that it
can be analyzed. Another issue is that paper forms can be error-prone since user
input cannot be constrained. Data entry clerks must often interpret handwriting or
determine the meaning and can introduce their own typographic errors. Lastly, data
in paper format is hard to query, retrieve, or aggregate if not carefully organized.
As portable digital devices became more available, organizations seized the
opportunity to digitize many of these data collection workflows from end to end.
These digital solutions allowed organizations to address many of the paper issues.
Digitally captured data is more accurate due to standardized inputs and input
constraints. Digital information can be instantly transferred, copied, or backed up
wirelessly. Additionally, digital data collection enables a richer set of data types to
be collected than what is possible with paper. For example, a smartphone allows the
23 The Open Data Kit Project
617
collection of digital data such as pictures, video recordings, or GPS traces. Finally, it
is much easier to categorize, sort, and aggregate digital data to spot trends, outliers,
fake data, and problems that need immediate attention.
3.1 History
The first mobile data collection solutions were implemented on Personal Digital
Assistants (PDAs) such as the Compaq iPAQ or Palm OS. These devices were
around the same size as a modern smartphone but had minimal computational power
and storage, and most lacked wireless communication. Many of the initial systems
developed by organizations targeted very specific use cases such as collecting
data about Malaria patients, providing decision support, or paramedics working in
remote regions. Eventually, platforms emerged that could be used for more general
data collection, such as EpiHandy and Pendragon Forms. However, many of these
initial systems implemented proprietary data protocols to communicate between
mobile devices and data storage servers, which resulted in tightly coupled, siloed
systems. Updating seemingly small items like the data type of a field in a form often
required hiring software developers to make changes to the code. As PDAs started
to become obsolete, this monolithic architectural approach caused entire systems to
be scrapped. Organizations found it was not worth the cost or effort to implement
new data collection clients from scratch on new platforms in order to be compatible
with the existing data storage components of deployed systems.
As mobile phones started to proliferate, new opportunities presented themselves
for using wireless connectivity like SMS to send data. The first generation of these
“dumb” phones did not allow external applications, so solutions were limited to calland-response SMS solutions or sending of one-way unstructured data. The second
generation of phones, dubbed “feature phones,” provided limited application development capabilities. One of the first data collection applications for feature phones,
JavaRosa, allowed organizations to design forms using the XForms specification,
eliminating the need to hire programmers to make updates to forms.
Noting the success of the iPhone, Dr. Borriello and his team at UW-CSE saw an
opportunity with the pending release of Android, an open-source operating system
for smartphones. The goal was to try to address many of the shortcomings noted
in previous mobile data collection systems. In late 2008, coinciding with the initial
release of Android, the idea for the ODK project was created in collaboration with
UW-CSE, the Android team at Google, and Google.org. ODK’s design focused on
taking an open and modular approach for creating information services that could be
deployed to address a wide variety of issues for global development/humanitarian
organizations. Android was chosen because it had multiple flexible inter-process
communication methods that enabled ODK frameworks to leverage the existing
apps for additional functionality (e.g., taking pictures, scanning barcodes, determining location), thus speeding development.
618
W. Brunette and C. Hartung
4 Innovation: The Open Data Kit Project
The Open Data Kit project aims to empower resource-constrained organizations to
build information services in under-resourced contexts through the creation of an
extensible suite of open-source tools. The ODK project supports the convergence of
computing and mobility to create an information services platform that specifically
targets global humanitarian organizations (Brunette et al. 2013b; Hartung et al.
2010). However, an organization’s tasks can vary widely across subject domains,
locations, and cultures. To enable broad use by a variety of organizations, ODK
tools are designed without prior knowledge of the application domain or deployment conditions. To empower a variety of users, the ODK project focuses on
creating interfaces that minimize the technical skills needed to build mobile data
applications. Its modular design and open standards enable organizations to create
information systems solutions using composable software frameworks. The ODK
project leverages Android mobile devices and cloud platforms to simplify scaling
interventions. Android compatible devices were chosen because of the variety of
device form factors and price points make them a popular device in economically
constrained environments.
Microsoft (MS) Office is an example of a suite of tools that are designed without
prior knowledge of the data or subject domain. Global development organizations
often use MS Office (e.g., MS Excel, MS Word) or other productivity software
to digitize data because data can be customized by staff with little programming
expertise. For example, MS Excel is commonly used to build tables of data by
workers with intermediate technology skills. Additionally, desktop versions of MS
Office operate offline, allowing workers to perform most of their work offline and
share their files when connectivity is available. While mobile devices were well
suited to operate in contexts with sporadic grid power and Internet connectivity,
their software applications did not provide the diverse features of conventional PC
productivity software (e.g., MS Office). Often mobile apps are designed for a single
purpose; thus, users often use multiple mobile apps to perform complex tasks. These
focused apps often have minimal customizability to other subject domains, thus
making it difficult to create custom reusable templates that are common to MS Word
or MS Excel.
The ODK project’s development was guided by a few simple principles (Brunette
et al. 2013b):
• Modularity: Create composable components that can be easily mixed and
matched and can be used separately or together. This allows organizations to
take a “best-of-breed” approach to create information systems that meet their
needs.
• Interoperability: Encourage the use of standard file formats and data transfer
protocols to support customization and connection to other tools.
• Community: Foster the building of an open-source community that would
continue to contribute experiences and code to expand and refine the software
framework.
23 The Open Data Kit Project
619
• Realism: deal with the realities of infrastructure and connectivity in the developing world and always support asynchronous operation and multiple modes of
data transfer.
• Rich user interfaces: Focus on minimizing user training and supporting rich
data types like GPS coordinates and photos.
• Follow technology trends: Use consumer devices to take advantage of multiple
suppliers, falling device costs, and a growing pool of software developers.
4.1 ODK 1 Tool Suite
The first set of ODK tools, “ODK 1” (Hartung et al. 2010), focused on replacing
paper-based data collection with enhanced digital data collection. Released in 2009,
ODK 1 has been used by a variety of organizations working in different global
development domains. Field workers collected data via digital surveys on mobile
devices, and the survey responses are then aggregated on a server for analysis. When
first released, it consisted of three primary tools: ODK Build, ODK Collect, and
ODK Aggregate. These tools provide the ability to design forms (Build), collect
data on mobile devices (Collect), and organize data into a persistent store where it
can be analyzed (Aggregate).
To enable organizations to customize the data being collected, the questionnaires
in ODK 1 are specified using the JavaRosa variant of the W3C XForms standard
defined by the OpenRosa Consortium (OpenRosa 2011). The JavaRosa XForm
specifies the data types, navigation logic, and input constraints. While the XForm
specification helped the ODK project separate the organization’s deploymentspecific configuration from a reusable domain-independent rendering framework,
organizations felt it was too complicated for a user to configure the system. Build
provides a graphical drag-and-drop interface for users to design a questionnaire that
will automatically generate an XForm specification. To collect data, field workers
use the Collect app to record data by navigating a variety of question prompts
(e.g., text, pictures, numbers, location, barcodes) specified in the XForm Fig. 23.1.
Fig. 23.1 ODK Collect provides multiple data input options including text, GPS, selection, and
sound
620
W. Brunette and C. Hartung
By default, Collect operates disconnected from the Internet to enable use in any
environment.
Aggregate provided an easy-to-deploy server that stored and aggregated collected
data to make it easy to export the data to a diverse set of data analysis and visualization tools. To export data for analysis, Aggregate provided interfaces to query
and extract data in standard formats (e.g., CSVs, KML) and directly integrate with
various web services, allowing Aggregate to act as a store and forward system to
other software services. Aggregate was designed as a “container-agnostic” platform
to enable organizations to deploy it on an “appropriate” hosting infrastructure for the
intervention or project based on the type of data to be stored and other constraints.
Aggregate could be deployed to a cloud hosting service to enable an organization to
take advantage of the cloud infrastructure’s highly-available and scalable services.
However, some organizations collect sensitive data creating data hosting locality
and security concerns. Organizations are often constrained by local policies or laws
that require data to not leave the country of origin, require the prevention of hosting
company employees from viewing the data, or prohibit the collection of high-risk
data that contains sensitive information.
While Build was created to simplify the creation of XForms by enabling users
to graphically compose surveys, some users felt the graphical interface was too
burdensome for creating lengthy or complex questionnaires. Additionally, some
users found that Build was inconvenient for sharing forms across their organization,
especially when reusing the majority of the form and only needing to make minor
adjustments for the deployment context. To solve this problem, “pyxforms” was
created by Columbia University to give users in the ODK community an option
of designing their form in an MS Excel spreadsheet. The spreadsheet was then
automatically converted into an XForm by “pyxforms.” After “pyxforms” popularity
in the community grew, “pyxforms” was transferred to the ODK project and was
renamed XLSForm to reflect the connection of an XLS file becoming an XForm.
XLSForm became the most popular method of creating XForms for ODK. The
creation of XLSForm is an example of how the ODK project’s open standards
and modular design enabled contribution to the project. The modular design also
provides options to users as it enables users to choose an appropriate tool for their
use case or skill level. Users can choose between Build’s graphical interface and
XLSForm’s Excel spreadsheet interface to design their XForm.
4.2 Iterative Design with Users
Much of the success of ODK results from performing co-design in the field with
the researchers working side by side with field workers who would later use the
software. This interaction with field workers gave ODK researchers real-time, in
situ feedback that would not have emerged or been considered in a typical western
research university development environment. One of the most important types of
feedback received in the co-design process concerned the cultural appropriateness
23 The Open Data Kit Project
621
of the solution to the community that would be using the mobile devices. The rest of
this section gives several examples illustrating the benefits of in-the-field iterative
design with actual target users.
For the first trial deployment of ODK, two graduate student researchers went
to Kampala, Uganda, to work with the Grameen Foundation to collect data about
several SMS information services they were piloting in the country. In this pilot,
the users were a group of rural farmers who owned “dumb” cell phones and used
those phones to run secondary businesses as communication services for their
villages. The farmers could all read and speak in their local languages. For the
project, the farmers were provided an HTC G1 touch screen smartphone in order
to fill out survey information whenever any of their customers used Grameen’s
SMS information services. During the training, the graduate student researchers
encountered several unexpected issues. After entering the information, the farmers
were given the instruction to “touch the button” to send the information. At this
point, most of the room stared in confusion at the phones in their hands. Since it
was the first time any of them had used a device with a touch screen, they were
looking for a physical button instead of the virtual image of a button on the screen.
Later during the instruction, several farmers alerted the instructors that they felt
the phones were broken because the phones would not respond to their touch.
The instructors used the phone, and the phone worked as expected. Upon handing
the phones back to the farmers, the same non-functional behavior was observed.
It turned out that farmers often had very rough, calloused fingertips that did not
interact well with the capacitive touch screens. However, the farmers could use the
larger pad of their fingers to interact with the phone, which led the graduate students
to significantly increase the size of all the buttons that very night.
Another example occurred when a developer who was working on ODK from
Kenya emailed asking if he could swap the main color scheme in Collect from white
text on a black background to black text on a white background. The reasoning was
that it was easier to see black text when working in bright sunlight. Up to this point,
much of the software development had occurred in Seattle, where bright sunlight
is not often a problem. The default text and background colors were switched and
have remained that way ever since.
4.3 Example ODK 1 Deployments
Two examples of ODK 1 deployments are:
HIV Treatment and Prevention in Kenya One of the first large-scale deployments of ODK was by the Academic Model Providing Access to Healthcare
(AMPATH) in western Kenya. Their goal was to reach two million people in the
AMPATH’s catchment area to test and counsel all eligible individuals for HIV,
identify pregnant women not in antenatal care, identify orphaned and vulnerable
children, and identify people at high risk for tuberculosis. AMPATH stored their
patient information in OpenMRS, an open-source medical record system. Because
622
W. Brunette and C. Hartung
of ODK’s and OpenMRS’ open and modular designs, AMPATH was able to use
Collect for their data collection client. They simply implemented a module for
OpenMRS that converted the XForm answers into the OpenMRS concept format.
This allowed them to switch from using PDAs to using Android smartphones with
very little effort. During deployment, AMPATH also ran a study comparing the
deployment cost of ODK to that of a previous tablet-based system and a paper-based
system. They found that the per-patient cost of deploying the systems was $0.21 for
paper, $0.15 using the PDAs, and $0.13 using Collect on Android smartphones.
To date, AMPATH has reached more than one million patients through home-based
counseling and testing, they have over 160,000 patients in active HIV treatment, and
90% of the HIV-positive people found via the program have enrolled in their care
program.
Monitoring Forests in East Africa The Jane Goodall Institute (JGI) has been
using ODK in Uganda and Tanzania to monitor forest reserves. Local community
members are selected as Village Forest Monitors to patrol selected forest reserve
areas. Monitors used Collect to gather information on deforestation using smartphone features, such as GPS and images, and can send that information for real-time
plotting on maps. The data is used to inform conservation decisions relating to the
health of forests and habitats for chimpanzees.
5 Evaluation and User Feedback
Millions of people have used the ODK 1 tool suite to perform data collection
activities in the majority of the world’s countries. Its modular design successfully
enabled multiple organizations to deploy customized application-specific mobile
data collection solutions. ODK 1 has been used in a diverse set of subject domains,
including disaster response, public health interventions, and election monitoring.
Although the ODK 1 tool suite was experiencing success as a data collection
platform, the UW-CSE research team wanted to understand how well it met generic
mobile information system requirements. Thus a survey of 73 organizations was
conducted in 2012 to determine the adequacy of current mobile data collection and
management frameworks in meeting the needs of the organizations. The goal was
to identify limitations that were preventing mobile information systems usage in the
field. The respondents were from a broad range of organizations working in over 30
countries. From the survey responses and field observations, there were four focus
areas that users thought should be improved (Brunette et al. 2013b):
• Support data aggregation, cleansing, and analysis/visualization functions
directly on the mobile device by allowing users to view and edit collected
data.
• Increase the ability to change the presentation of the applications and data
so that the mobile app can be easily specialized to different situations without
requiring a recompilation.
23 The Open Data Kit Project
623
• Expand the types of information that can be collected from sensing devices, while
maintaining usability by non-IT professionals.
• Incorporate cheaper technologies such as paper and SMS into the data collection
pipeline.
ODK 1’s original focus on enabling resource-constrained organizations to
replace paper data collection with enhanced mobile data collection meant that
many design decisions were made to leave out unnecessary functionality in order
to create a solution that was configurable by users with limited technical skills. This
purposeful simplicity meant ODK 1 lacked features required for certain use cases.
For example, ODK 1 focused on collecting survey data and uploading completed
surveys to a server for aggregation and analysis. It did not provide functionality
for distributing data back out to mobile devices for review and updating. However,
feedback showed that many organizations need to access previously collected
data on the device. Many organizations reported being unable to use ODK 1 for
usage scenarios that rely on previously collected data. For example, organizations
performing logistics management, public health interventions, and environment
monitoring often have workflows that require workers to return to a location and
reference previously collected data. The worker verifies whether the previously
collected data is still accurate and updates the data to reflect the current state. In
usage scenarios with follow-up data collections to track progress, organizations
requested the ability to use data from previous surveys to complete new entries,
as workers complained about having to re-enter information from the previous visit
(e.g., patient demographics, refrigerator information).
After gathering feedback from users, it became clear that there were some feature
deficiencies in ODK 1 for supporting data management use cases. Incorporating
new tools to contribute the missing functionalities into the existing ODK suite was
proposed. New tools would maintain the modular design and add new functionality.
However, if too many features were added, there were concerns that a core strength
of enabling users with limited technical knowledge to create mobile data collection
systems could be lost. Additional features often lead to additional complexity for
users as they have more choices and more controls to manage. Dr. Borriello decided
that instead of jeopardizing the first tool suite’s success, a second tool suite should
be made that targeted different use cases. The second parallel tool suite would
maintain the ODK project’s goal of creating domain-independent tools that operate
in disconnected environments but would address a different set of constraints and
requirements. Organizations could then choose which of the parallel tool suites to
use based on their constraints and requirements. Both tool suites would continue to
target low-resource contexts that have limited availability of resources, power, and
expertise. UW-CSE continued to improve and expand ODK 1 and began to explore
the creation of a second tool suite to address use cases where ODK 1 functionality
was insufficient.
624
W. Brunette and C. Hartung
5.1 Creation of the Second Tool Suite
ODK 1’s focus on replacing and enhancing paper-based data collection led to a
unidirectional data flow design (similar to paper). Research showed that many
organizations wanted bidirectional synchronization of data to enable users to update
previously collected data and conduct follow-up longitudinal studies. Additionally,
bidirectional synchronization of data can provide field workers with continually
updated data to make better decisions in the field and support more complex
workflows based on previous data inputs. The feedback from organizations about
missing features led to the creation of a second tool suite called “ODK 2.” The
new generation of tools would focus on bidirectional data management applications
instead of unidirectional data collection (Brunette et al. 2017). ODK 2 was a
response to the need of humanitarian organizations for a free, reusable platform
capable of bidirectional data management. The four areas of desired improvements
as well as other user research and feedback gave four design principles for ODK 2
(Brunette et al. 2013b):
• When possible, user interface elements should be designed using a more widely
understood runtime language instead of a compile-time language, thereby
making it easier for individuals with limited programming experience to make
customizations.
• The basic data structures should be easily expressible in a single row, and nested
structures should be avoided when data is in display, transmission, or storage
states.
• Data should be stored in a database that can be shared across devices and can
be easily extractable to a variety of common data formats.
• New sensors, data input methods, and data types should be easy to incorporate
into the data collection pipeline by individuals with limited technical experience.
After the initial evaluation in 2012, the UW-CSE research continued to perform
iterative development and evaluation with global development organizations. This
iterative development cycle led to the identification of additional feature requirements beyond the four basic ODK 2 design principles (Brunette et al. 2017).
For example, dynamic value checking based on previous data was requested to
improve data integrity. Improving data integrity was seen as a benefit of digitizing
data collection; thus, organizations requested an expansion in data verification
capabilities. An example use case that demonstrates the limitations of static
constraint checks versus dynamic constraint checks is an agricultural longitudinal
study. Generally, in these agricultural studies, workers travel to crop fields multiple
times during a growing season. During these visits, the workers record the growing
conditions and track the crop’s progress over time by recording the crop height.
By recording the growing conditions and crop heights of different crop locations,
research can be conducted to ascertain the effects of different conditions on crop
yields. Organizations requested the crop height value inputted be validated to make
sure the field worker entered a reasonable value to avoid typing mistakes or other
23 The Open Data Kit Project
625
data entry errors. Unfortunately, the ODK 1 tool suite uses static formulas for
validation, so the values used during the data integrity check are the same value
at the beginning and end of the growing season, as the check is a static absolute
min or max crop height value. Organizations desired a data integrity check that
would dynamically adjust over time based on the previously collected crop data.
The min and max values used to verify the reasonableness of the crop height
would be calculated based on previous crop height measurements taken earlier in
the growing season. As with any ODK functionality, this dynamic data integrity
check needs to be performed during disconnected operation. ODK 2’s bidirectional
data synchronization enables organizations to support this type of longitudinal study
by enabling disconnected access to previous crop heights allowing the creation
of dynamic data checks that can automatically adjust to catch data anomalies.
Thus, ODK 2 expanded the ODK project’s ability to create mobile information
systems by having a data collection platform (ODK 1) and a data management
platform (ODK 2). The following list describes the key design goals of the ODK 2
frameworks based on research findings (Brunette et al. 2017):
• Workflow navigation should use intuitive procedural constructs that function
independently of data validation and allow for user-directed navigation of the
form.
• The presentation layer must be independent of the navigation and validation
logic.
• The presentation layer must be customizable without recompiling Android apps
via HTML, JavaScript, and CSS.
• Partial validation of collected data should be possible and the validation logic
should be able to be dynamic.
• Local storage should be robust and performant for data curation and for
longitudinal survey workflows using a relational data model.
• Multiple data collection forms should be able to modify data within a single,
shared data table.
• Foreground and background sensors should be supported for data collection.
• Should support adding new sensing and other methods of input.
• Disconnected operation should be assumed as data must be able to be collected,
queried, and stored without a reliable Internet connection. When the Internet
becomes available, the framework and cloud components should efficiently
replicate data across all devices.
• User and group permissions are needed to limit data access.
• Cloud components should be able to fully configure the data management
application remotely as well as preserve a change log of all collected data.
Multiple pilot deployments were conducted to investigate, test, and verify the
requirements gathered for ODK 2. A diverse set of field partners working on global
health interventions, disaster response management, and other areas were involved
in validating the suitability of the ODK 2 frameworks in resource-constrained
environments. These iterative pilots identified necessary features for ODK 2 that
were not fulfilled by ODK 1. Table 23.1 presents a list of case studies and the
626
W. Brunette and C. Hartung
Table 23.1 ODK 2 case study feature requirement summary (Brunette et al. 2017)
corresponding ODK 2 features that were necessary to create a data management
solution for the use case.
5.2 Multi-Perspective Design
One of the ODK project’s challenges was accounting for the many different “users”
of the ODK frameworks. During the evaluation of the ODK project, there was
a recognition that the classic roles of software where the “software developers”
role creates a software application for the “users” role did not adequately explain
the various people involved in configuring reusable frameworks like ODK. Since
the ODK project seeks to design configurable software frameworks that enable
organizations to adapt to their specific subject-domain needs, the classic tworole model did not fit properly. Instead, the “software developers” are creating
frameworks for an intermediate set of persons who configure the frameworks to
fulfill an organization’s data collection workflow. The specified data collection
workflow defines the interface the field workers use to collect the data. This is
in contrast to standard software development, when “software developers” make
assumptions when designing the system that determines and limits the functionality for “end-users.” Unfortunately, when making these decisions, the “software
developer” may not fully understand the implications on how future software
“users” may need to adapt the software for usage in different contexts with varying
connectivity, laws, data policies, budgets, etc. During the evaluation process, the
research team identified multiple roles of various ODK actors that create, configure,
extend, deploy, and customize mobile data management applications. Identifying
the various actors was needed to ensure that the proper features and interfaces were
23 The Open Data Kit Project
627
being created to support the various roles. The establishment of roles came from
a multi-perspective analysis (Brunette et al. 2015) performed to create appropriate
framework abstractions. ODK 2’s interfaces and abstractions are designed to target
the skill levels of the following four roles (Brunette 2020):
• End users—Often field workers who have been deployed by an organization to
perform remote tasks such as providing services to beneficiaries.
• Deployment Architects—These are often employees of the organization who are
subject-domain experts who customize the technology to satisfy meet organizational requirements. They are often non-programmers who are responsible
for adapting an ensemble of off-the-shelf software to meet an organization’s
information management needs and impose constraints derived from deployment
considerations.
• Programmers—Skilled programmers who have been employed by organizations
to customize the look, feel, or workflow of the ODK 2 frameworks to meet
an organization’s deployment requirements. Example tasks include adding new
sensors, data input methods, custom prompts, and custom data types.
• ODK Framework Developers—Those who create the core reusable ODK 2
frameworks that are behind reusable abstractions targeted at the other three
roles.
The focus on four distinct roles shaped the design of ODK 2’s framework
abstractions (e.g., communication resources, complex workflows). It is difficult to
design a single abstraction that is usable by a wide range of technical skills. The
four roles have different expectations for their technical skills. The ODK 2 design
splits the traditional “user” role into three roles end users, deployment architects,
and programmers to recognize that there are multiple “users” with different roles. To
avoid confusion between the “software developers” who build the ODK frameworks
and “software developers” who use the ODK frameworks’ interfaces to customize
an organization’s workflow, two developer roles were established ODK framework
developers and programmers. Both programmers and ODK framework developers
are expected to know how to program; however, the programmer role is not expected
to understand how ODK 2 frameworks are implemented, instead simply how to
use the ODK programming abstractions for customization. Both the end users
and deployment architects are assumed to have no software programming skills.
However, deployment architects are assumed to be computer literate so that they
can enter enough information about the deployment to customize ODK frameworks
using high-level abstractions.
6 Adaptation: ODK 2 and Extensibility Exploration
Based on the evaluation, researchers at UW-CSE began an exploration of extending
the functionality of the ODK project by creating additional mobile frameworks.
After years of research focused on creating information systems for global devel-
628
W. Brunette and C. Hartung
opment organizations, UW-CSE released part of the ODK 2 tool suite in 2017
as a parallel effort to the ODK 1 tool suite. The 8 years between the initial
release of ODK 1 and the initial release of ODK 2 were spent performing iterative
development with multiple cycles of innovation, adaptation, and evaluation of
both ODK 1 and ODK 2. Key aspects of ODK 2 are (Brunette et al. 2017):
(1) a modular design that enables individual software frameworks designed for
particular tasks to be used together to achieve complex workflows, (2) data and
configuration management that enables data protection, storage, and sharing of
data across mobile devices and cloud components, (3) a synchronization protocol
that is designed to operate in challenged networking conditions, and (4) a servicesbased architecture that abstracts common functionalities behind a consolidated
unifying services layer.
A usability problem is often created by having a single interface that targets
multiple types of users. Users with basic computer skills often want something
simple and can feel overwhelmed with too many options; conversely, a user with
programming skills can feel frustrated when functionality is not exposed. Instead of
one size fits all for the interfaces, ODK 2 frameworks were created with multiple
interfaces and abstractions that can perform similar functionalities to help users
with different skill levels configure their system. These multiple interfaces follow
some of the ideas of design scaffolding (as demonstrated in Anderson et al. (2012);
Quintana et al. (2004)) by providing an interface for users to learn about the ODK 2
frameworks without having to understand the full details of the entire system. The
goal was to ramp up a user’s ODK 2 knowledge through the use of simple interfaces
that are less confusing or intimidating than more advanced interfaces that provide
additional functionality. For example, in ODK 2 there are multiple ways for a
deployment architect to create a database table. One method of database creation
completely hides the database details from a deployment architect. Based on the
success of the XLSForm in ODK 1, Excel was chosen again as a method to configure
the ODK 2 frameworks, although with different syntax and structures to account
for the new functionality. ODK 2 will take a questionnaire designed in an XLSX
workbook by a deployment architect and will automatically generate all needed
database tables. This automation removes the need for a deployment architect to
understand databases. Alternatively, if the deployment architect wants to customize
the structure of the database, a spreadsheet can be added to the XLSX workbook
to manually define the database table by supplying column names and column
types. The deployment architect has a third option to create the database table
pragmatically by using ODK 2’s JavaScript functions.
6.1 ODK 2 Mobile Frameworks
ODK 2 frameworks provide a diverse feature set that enables organizations to
create customized data management applications. Since ODK 2 was designed to
handle be use cases with additional complexity, there was concern that a single
23 The Open Data Kit Project
629
Fig. 23.2 This architecture diagram shows how six ODK 2 mobile frameworks work together to
create what can appear to be a single customized mobile data management application (Brunette
et al. 2017). The ODK 2 tool suite mobile apps are Scan, Tables, Survey, Sensors, Services, and
Submit
app could have overwhelming complexity if it provided abstractions for every
usage scenario. Therefore, to simplify customization interfaces, ODK 2 was built
as multiple reusable frameworks that focus on specific areas of functionality. To
give an end user the look and feel of a unified application, the multiple frameworks
are designed to smoothly transition between each other. The six Android apps
(shown in Fig. 23.2) each contribute configurable software frameworks that provide
specific functionality to ODK 2. The frameworks isolate the deployment architect’s
configurable interfaces from the reusable system components to create abstractions
that are flexible enough to support varying types of workflows from different subject
domains.
Tables - Tables (Brunette et al. 2013a) is a data management framework that
enables users to view, update, and curate the entire data set with optional user
permission enforcement. Tables is designed to render custom user workflows for
use cases where previously collected data is viewed and updated (e.g., logistics
management, medical care). Data can be viewed in either tabular or graphical format
depending on the context, and views are customizable by modifying or extending
the HTML, CSS, and JavaScript files. Since Tables uses runtime web rendering
for its user interface, the user interface can be customized without recompiling the
entire framework. The flexibility provided by Tables framework greatly increases
the usability of the ODK 2 tool suite, as it enables organizations to encode complex
workflows and decision logic outside the question workflow of Survey. It is also the
creation of workflows for use cases where users often return to locations and need
to reference multiple pieces of previously collected data.
630
W. Brunette and C. Hartung
Survey - Survey expands the possibilities of data collection through its dynamic
question-rendering and constraint-verification framework that allows for interactive,
non-linear navigation that enables organizations to customize workflow complexity.
Survey collects data through the use of questions similar to Collect. However,
Survey uses a runtime web rendering framework for its user interface. Since
runtime languages (e.g., JavaScript) are used to define the prompt widgets, rendering
logic, and event handling, the entire user interface and flow of Survey can be
customized by an organization. The runtime customization permits a wider variety
of customization possibilities than XForm’s linear navigation flow used by ODK 1.
The runtime flexibility is another example of providing multiple interfaces to
deployment architects, as Survey’s XLSX definition structure provides a simpler
customization method that can allow someone to ramp up their web scripting
knowledge as they require more advanced features.
Submit - Experiences from the field demonstrate that not all the data that organizations collect are considered equally valuable. Data has different priorities, and
the system may need to be flexible when selecting the method of data transmission
by accounting for inherent data properties, contextual data properties, and network
properties (Brunette et al. 2015). Existing networking paradigms often assume that
inherent data properties (e.g., size, type) are sufficient. However, data is not uniform
and has both inherent data qualities and contextual data qualities. The inherent data
properties are independent of the application domain, while the contextual data
properties (e.g., priority, importance, deadline) are determined by the application
usage scenario and deployment context. An important contextual data property
is data public or private (e.g., private medical records vs. sports scores). Local
laws and an organization’s data policies often dictate how data can be stored and
transmitted depending on if the data is public or private. Submit (Brunette et al.
2015) is an experimental communication framework built to enhance performance
in disconnected environments. It allows organizations to adapt their applications to
share data in various network conditions to match their data communication needs.
Submit also provides a modified peer-to-peer synchronization protocol.
Services - Services (Brunette et al. 2017) provides the common functionality to
other ODK 2 mobile apps to maintain a modular design and avoid re-implementing
core functionality within each tool, thus creating a services-based architecture. For
example, Services abstracts the database access to a single-shared service interface
that enforces consistent data semantics and provides data-access restrictions. Other
examples of the core functionality provided by Services include the data synchronization protocol, a web server, framework preferences, and user authentication.
Sensors - Sensors (Brunett et al. 2012) is a device-connection framework designed
for Android devices. Sensors simplifies connecting and integrating external sensors
into an organization’s data collection workflow by providing reusable functionality
for sensor connection and processing. Sensors is a modular framework that simplifies both the application and sensor-driver development by creating abstractions
23 The Open Data Kit Project
631
that separate functionalities between the sensor framework, device-driver, and user
application.
Scan - Many organizations still rely on paper forms, as the cost of providing a
mobile device for every field worker can be problematic for organizations with
limited financial resources. During the evaluation, some organizations requested
that the ODK project provide the ability to use a hybrid approach that integrates
paper forms with mobile devices. The idea was that field workers could use paper
forms to collect data and then use a few mobile devices in the field to digitize the
data. Scan is a paper digitization framework that explored how to combine paper
and digital data collection (Dell et al. 2012, 2015). Scan enables organizations to
digitize paper forms in disconnected environments by adding Scan-compatible data
input components to their forms. Mobile devices have the computing resources
necessary to locally process QR codes, check boxes, multiple-choice bubbles,
and structured handwritten number boxes. Scan digitizes paper forms using the
Android’s camera and computer vision algorithms that run on the device into
snippets corresponding to the individual data components (Dell et al. 2012, 2015).
Additional information can be collected using handwritten text boxes that Scan
cannot digitize programmatically. These handwritten text boxes are presented to
the field worker as an image through an automatically generated Survey form to
enable the field worker to manually transcribe the data by looking at an image and
manually transcribing the handwritten text.
6.2 Example ODK 2 Deployments
Two examples of ODK 2 deployments that at the time of publication have ongoing
field evaluations and iterations to improve the “data management platform” are:
Humanitarian Disaster Response The International Federation of Red Cross and
Red Crescent (IFRC) partnered with UW-CSE to create an innovative humanitarian
relief platform called “RC2 Relief” (Fig. 23.3). RC2 Relief leverages ODK 2 frameworks to simplify distributing relief items or providing cash assistance in response
to disasters or humanitarian crises. The IFRC had previously leveraged ODK 1
to collect information without Internet connectivity during disaster responses.
However, the IFRC found ODK 1’s unidirectional dataflow limited their ability
to use ODK as a humanitarian information platform. The issue was that ODK 1
could not provide the field worker with updated data to perform relief tasks. This
limitation created a worker efficiency issue as field workers had to use both (1)
a mobile device with ODK 1 for data entry and (2) either a paper or a laptop
to obtain information about relief assistance. Using ODK 2’s mobile information
management frameworks, field workers can view what relief assistance should
be delivered as well as the beneficiary’s complete history. Since ODK 2 is a
customizable framework, it was a natural fit for the Red Cross movement allowing
the reuse of core technology and training materials between National Societies while
632
W. Brunette and C. Hartung
Fig. 23.3 The IFRC brochure about RC2 Relief (IFRC 2020)
also empowering National Societies to customize the system to their particular use
cases. Since ODK 2 is a rendering framework, a volunteer’s workflow can be easily
updated to adapt to the dynamic conditions of a humanitarian relief operation.
Vaccine Cold Chain Inventory Immunization programs depend on a network of
vaccine refrigerators and cold rooms to keep vaccines within a narrow temperature
range to maintain the vaccine’s potency. This network of temperature-controlled
storage is called a vaccine cold chain. Management of the vaccine cold chain
depends on having an accurate understanding of equipment’s status at different
facilities, including which vaccine refrigerators are broken and needing repair.
Previous attempts to use ODK 1 to perform regular inventory updates were met
with resistance because field workers objected to re-entering the same information
about the refrigerator during each visit. Instead, workers simply wanted to make
updates to the data that they previously entered. With ODK 2’s data synchronization,
remote field workers can view and update the most recent cold chain inventory data
on their mobile devices (Brunette et al. 2020). Synchronizing data helps decrease
work duplication between field workers as each field worker has the most current
information when Internet connectivity is available.
23 The Open Data Kit Project
633
7 Challenges and Lessons
Technology designed for reusability and flexibility can act as an innovation catalyst
because of its applicability to a diverse set of use cases. By providing reusable
frameworks, the ODK project seeks to enable global development organizations to
leverage computing technologies to innovate and improve the organization’s ability
to deliver services to combat global issues such as poverty, disease, environmental
degradation, and illiteracy. The ODK project focuses on creating information
services that are configurable by non-programmers and deployable by resourceconstrained organizations (including both financial and technical resource constraints) to address a broad variety of issues for global development organizations.
ODK’s modular design allows an organization to leverage different modules to
create flexible information technology solutions that can be customized to satisfy
an organization’s contextual requirements. Designing a reusable system without
prior knowledge of the type of data that will be stored requires a flexible design,
as organizations are often constrained by local policies or laws that dictate how
data can be stored and transmitted. The ODK project was designed to leverage
“appropriate” cutting-edge technology to solve global development problems and
to take advantage of the global technology trends that drive innovation. The project
targets commercial cloud platforms and Android devices to enable organizations
to take advantage of global market forces. The choice of Android smartphones
and tablets in 2008 as an “appropriate” cutting-edge technology for low-resource
contexts was because of Android’s flexible and open architecture. Choosing Android
led the majority of people in the global development space to ridicule the ODK
project, with many global development experts stating that Android devices would
never be sold in Africa or Asia. The critics insisted that an Android device would
never have a price point below $400 USD, and therefore, Androids would only be
sold in North America and Europe. At the time of publication of this textbook,
Android is the dominant mobile device operating system in the world with devices
being sold below $40 USD. A key lesson from the ODK project was identifying the
logic inconsistency from global development experts that were exclusively focused
on “low-cost” solutions while not examining how technology becomes a “low-cost”
solution through market forces. The ODK project seeks to identify and leverage
“appropriate” technology that can operate in low-resource contexts to exploit future
research and development by the global marketplace.
The ODK project tries to avoid leveraging technology that is not supported by
the global marketplace because lacking such support there will likely be minimal
momentum to lower prices. By following technology trends, the market solved
problems for global development organizations by localizing the technology to
users, creating different types of mobile computing devices, and creating devices
with prices appropriate to the context. To avoid early obsolescence, ODK used
“appropriate” cutting-edge technology to leverage advancements by commercial
companies, universities, and governments. Additionally, the timeline of scaling
global development interventions often does not align with information technol-
634
W. Brunette and C. Hartung
ogy’s life cycles. The cheapest devices are often discontinued when newer, more
capable technologies can be produced at a similar or lower cost. Unfortunately,
technology obsolescence creates churn, as organizations have to find replacement
technologies and often conduct new pilots to verify that the replacement technology
will meet organizational requirements. Additionally, depending on how different the
replacing technology is, organizations may need to produce new training material
and resource mobilization strategies. Therefore, if the lowest-priced technology
does not remain available for purchase through an organization’s scaling timeline,
it may not have the lowest overall cost. For organizations to scale technology to
multiple countries, locations, and contexts, it often takes years, thus requiring the
technology to remain available for purchase for 5 to 10 years to provide ample time
for the technical solution to be adapted, tested, and deployed to the various locations.
While ODK has been successful, there have been many struggles with opensource adoption and management. From the beginning, it was obvious that a few
people working together at a public research university would not scale to meet
the needs of supporting hundreds of organizations and their field workers deployed
around the world. To mitigate the problems of a small research team scaling,
an open-source model was used to build an ecosystem of technology innovation.
Three approaches were used to build a community of practice: (1) modularity—to
make it easy for alternative solutions to be developed in parallel, (2) community
building—establish an open-source community for users to contribute experiences
and code, thereby establishing a process to expand and refine the software, and
(3) open-source—to allow organizations with limited finical resources to benefit
from innovations at little or no cost through a free and open-source software
(FOSS) model. A permissive open-source software license was chosen to encourage
commercial enterprises to build features and expand the core ODK technology. The
idea was to embrace the concept of a competing ecosystem where many companies,
consultants, and organizations could take FOSS technology and build products and
services with it. Supporting the diversity of use cases in the field was something
beyond the capability of a few people working at a public research university. The
goal was to create a robust ecosystem that would give organizations choices on the
types of scaling the technical expertise they needed to receive to meet the needs in
a local context.
Many global development software projects, like ODK, rely on donor and grant
funding for software development, expansion, and upkeep. Funding organizations
often have a large influence on the type of features implemented as donor funding
often targets-specific domains, such as health, causing certain use cases to be
emphasized more because of the availability of funding. For a deploying organization, there are still costs associated with using free software. For example,
there are costs associated with procuring and maintaining computer resources.
Additionally, there are costs to configure ODK for the deployment context and to
train field workers. Furthermore, technology is not static; therefore, ODK needs to
be continually upgraded to handle software maintenance tasks, such as library and
operating system API changes, bug fixes, and security fixes. Software maintenance
23 The Open Data Kit Project
635
can be a difficult area to fund because most funding comes with requirements for
innovation with evidence-based outcomes on beneficiaries.
Much of ODK’s success came from the design principle of performing iterative
development that included co-design with field organizations to test assumptions.
Researchers working side by side in the deployment contexts with organizations
gave researchers feedback that helped identify incorrect assumptions and expectations. Building real systems with organizations with challenging constraints helped
reveal problematic design assumptions that were limiting functionality because of
incorrect expectations about deployment contexts. Often small assumptions made
by a developer can make a technology inappropriate for an organization’s use in a
specific context.
8 Summary
Since resource-constrained environments often experience a dearth of technical
personnel capable of building and customizing information systems, the ODK
project was established to provide a configurable set of open-source software
tools for organizations to use in resource-constrained contexts. The ODK project’s
modular software frameworks target a variety of global development use cases. The
ODK tools are designed to be configurable by global development organizations
that have an understanding of the field conditions, the types of workflows and
actions that are necessary, and which tasks are important to complete. Therefore, the
configuration abstractions need to be simple enough for a non-developer to use but
flexible enough to handle various constraints based on the deployment context. ODK
tools are designed for flexibility because they are created without prior knowledge
of the application domain, deployment conditions, or types of data that will be
collected. Five decisions that led to the success of the ODK project were:
• Maintaining functionality when operating disconnected from the Internet
• Identifying “appropriate” technology and leveraging technology trends
• Having partners who are local domain experts and perform iterative development
in situ
• Using a modular design with open standards
• Establishing an open-source community of users and developers to create an
ecosystem of support
After a decade, the Open Data Kit project continues to engage in innovation
cycles that include requirements gathering, iterative development with field partners,
evaluation, and adaption. Academic researchers continue to design, build, and evaluate an ensemble of software frameworks that can be used together or independently
to construct mobile information systems. The impacts of the ODK project have been
diverse in scope and scale. There are several levels of impact including: (1) the
impact on the organizational-level users and whether it meets organizational goals of
636
W. Brunette and C. Hartung
increased efficiency, reduced cost, and more accurate data; (2) the impact on the field
workers and if it helps them to be more efficient; and (3) the impact on the quality
and cost-effectiveness of the services the beneficiaries receive. Additionally, the
cost-savings are multi-faceted in scope and each needs to be measured to understand
the benefits of (1) the interventions themselves, (2) savings from shared software
infrastructure, (3) employee productivity, and (4) reduced costs of data acquisition
for evidence-based decision-making and metrics and evaluation.
9 Discussion Questions
1. What are five advantages and five disadvantages of creating reusable software
frameworks that are designed to be used by different organizations trying to solve
problems in multiple subject domains?
2. What makes software for international development different from other software
projects?
3. What are some current technology trends that can be applied to resourceconstrained contexts to improve global development outcomes?
4. What are some advantages and disadvantages of a free and open-source software
model?
5. What challenges would you expect developing organizational human resources
that are capable of deploying platforms like ODK and how would you address
them?
6. What areas of international development could benefit from applying information
technology solutions?
7. What technology trends will the ODK project likely need to adapt to over the
next 5 years to remain a useful platform for data collection or data management
for low-resource communities?
References
Anderson, R., Kolko, B., Schlenke, L., Brunette, W., Hope, A., Nathan, R., Gerard, W., Keh, J., &
Kawooya, M. (2012). The midwife’s assistant: designing integrated learning tools to scaffold
ultrasound practice. In Proceedings of the Fifth International Conference on Information and
Communication Technologies and Development, ICTD ’12 (pp. 200–210). New York: ACM.
Brunette, W. (2020). Open Data Kit 2: building mobile application frameworks for disconnected
data management. Seattle: University of Washington.
Brunette, W., Larson, C., Jain, S., Langford, A., Low, Y. Y., Siew, A., & Anderson, R. (2020).
Global goods software for the immunization cold chain. In Proceedings of the 3rd ACM
SIGCAS Conference on Computing and Sustainable Societies, COMPASS ’20 (pp. 208–218).
New York: Association for Computing Machinery.
Brunette, W., Sodt, R., Chaudhri, R., Goel, M., Falcone, M., Van Orden, J., & Borriello, G. (2012).
Open Data Kit sensors: a sensor integration framework for android at the application-level.
23 The Open Data Kit Project
637
In Proceedings of the 10th International Conference on Mobile Systems, Applications, and
Services, MobiSys ’12 (pp. 351–364). New York: ACM.
Brunette, W., Sudar, S., Sundt, M., Larson, C., Beorse, J., & Anderson, R. (2017). Open Data Kit
2.0: a services-based application framework for disconnected data management. In Proceedings
of the 15th Annual International Conference on Mobile Systems, Applications, and Services,
MobiSys 2017 (pp. 440–452). New York: ACM.
Brunette, W., Sudar, S., Worden, N., Price, D., Anderson, R., & Borriello, G. (2013a). ODK tables:
building easily customizable information applications on android devices. In Proceedings of
the 3rd ACM Symposium on Computing for Development, ACM DEV ’13 (pp. 12:1–12:10).
New York: ACM.
Brunette, W., Sundt, M., Dell, N., Chaudhri, R., Breit, N., & Borriello, G. (2013b). Open Data Kit
2.0: expanding and refining information services for developing regions. In Proceedings of the
14th Workshop on Mobile Computing Systems and Applications, HotMobile ’13 (pp. 1–6).
Brunette, W., Vigil, M., Pervaiz, F., Levari, S., Borriello, G., & Anderson, R. (2015). Optimizing
mobile application communication for challenged network environments. In Proceedings of the
2015 Annual Symposium on Computing for Development, DEV ’15 (pp. 167–175). New York:
ACM.
Dell, N., Breit, N., Chaluco, T., Crawford, J., & Borriello, G. (2012). Digitizing paper forms with
mobile imaging technologies. In Proceedings of the 2nd ACM Symposium on Computing for
Development, ACM DEV ’12 (pp. 1–10). New York: ACM.
Dell, N., Perrier, T., Kumar, N., Lee, M., Powers, R., & Borriello, G. (2015). Paper-digital
workflows in global development organizations. In Proceedings of the 18th ACM Conference
on Computer Supported Cooperative Work and Social Computing, CSCW ’15 (pp. 1659–1669,
2675145). New York: ACM.
Hartung, C., Anokwa, Y., Brunette, W., Lerer, A., Tseng, C., & Borriello, G. (2010). Open Data Kit:
tools to build information services for developing regions. In Proceedings of the 4th ACM/IEEE
International Conference on Information and Communication Technologies and Development,
ICTD ’10 (pp. 1–12).
Jensen, L. (2010). The millennium development goals report 2010. In New York: United Nations
Department of Economic and Social Affairs.
OpenRosa API WorkGroup. (2011). OpenRosa WorkGroup API Page: OpenRosa 1.0 APIs. https://
bitbucket.org/javarosa/javarosa/wiki/OpenRosaAPI/. Accessed September 2020.
Quintana, C., Reiser, B. J., Davis, E. A., Krajcik, J., Fretz, E., Duncan, R. G., Kyza, E., Edelson, D.,
& Soloway, E. (2004). A scaffolding design framework for software to support science inquiry.
Journal of the Learning Sciences, 13(3), 337–386.
RC2 Relief. https://media.ifrc.org/ifrc/wp-content/uploads/sites/5/2019/12/RCR-Leaflet-V320191206.pdf. Accessed October 2020.
Open Access This chapter is licensed under the terms of the Creative Commons Attribution 4.0
International License (http://creativecommons.org/licenses/by/4.0/), which permits use, sharing,
adaptation, distribution, and reproduction in any medium or format, as long as you give appropriate
credit to the original author(s) and the source, provide a link to the Creative Commons licence, and
indicate if changes were made.
The images or other third party material in this chapter are included in the chapter’s Creative
Commons licence, unless indicated otherwise in a credit line to the material. If material is not
included in the chapter’s Creative Commons licence and your intended use is not permitted by
statutory regulation or exceeds the permitted use, you will need to obtain permission directly from
the copyright holder.
Epilogue
There is no simple solution to the complex challenges of sustainable human development. Just as international development banks are not the only instruments for
financing economic development, “development engineering” (commonly abbreviated to DevEng) is not the only approach for sustainable innovation. Yet the iterative
cycles of research described in this book have resulted in technologies benefiting
millions of people, often with positive spillovers for the natural environment. These
efforts aim to and can blunt the hard edge of inequality, while mitigating the impacts
of global climate change.
The first two chapters of the textbook outlined the historical context of technology and human development and reviewed recent research on the role of technology
through the lens of development economics. The third chapter presented the reader
with a generalizable framework for the design and scaling of technologies that
benefit both people and the planet. The framework defined four key activities –
innovation, implementation, evaluation, and adaptation – that, when woven together
in iterative cycles, can yield significant development impacts. The fourth chapter
discussed the ethical considerations relevant when scientists and engineers engage
in the design of technologies for communities facing resource constraints.
In each of the 19 chapters that follow the first 4, the authors detailed how
a specific technology was designed and adopted, and in some cases scaled up,
through an interdisciplinary and iterative approach. These case studies cover a wide
range of sectors, from water treatment for affordable arsenic removal to information
technology that improves the governance of public services (like electricity or social
protection). Some authors demonstrated how an innovation achieved sustainability
and impact; others have highlighted where their efforts failed or fell apart. The
range in the scale of the case studies highlights how the framework of development
engineering can be applied in small pilots as well as larger research studies. Overall,
we think the textbook presents a versatile framework for designing, developing,
and assessing technologies that can be broadly applied across resource-constrained
settings.
© The Author(s) 2023
T. Madon et al. (eds.), Introduction to Development Engineering,
https://doi.org/10.1007/978-3-030-86065-3
639
640
Epilogue
The challenge of reducing poverty – and doing so in a sustainable manner– is
fundamental to the future of human progress and requires a multi-pronged approach.
The interdisciplinary nature of this text (integrating perspectives from development
economics, engineering, and other fields) helps the reader explore how technology
might help us in this complex task. While we aim to be versatile, the field of
development engineering is just one approach among many seeking sustainable
and equitable development. We do not claim DevEng will solve all problems
that cause or maintain poverty, or DevEng relates to all forms of technological
change. For example, ample scope remains for improving access to markets and
making governments accountable. Meeting these challenges does not always require
the design or adoption of new technologies, and in some cases introducing new
technologies can even set us back.
Similarly, from an intellectual perspective, there are multiple frameworks for
rigorous field-based research, stretching far beyond the approaches presented here.
In defining this discipline, we have focused intensely on understanding the adoption
and impacts of novel solutions. As a result, the textbook proposes a process
of iterative discovery, prototyping, testing, and adaptation of technology-based
solutions – with continuous cycles of movement between the laboratory and the
field. As the case studies highlight, this process situates its interventions within local
contexts, engaging directly with the market, institutional, and behavioral constraints
facing individuals and communities living in resource-constrained settings. This
intellectual approach differs in its objectives from disciplines like political science,
critical development studies, macroeconomics, and global health (to name just
a few allied fields). Broader macroeconomic trends in development, as well as
structural factors and questions of political will and leadership, are not addressed
in the textbook and are better understood and analyzed using other references and
approaches.
We believe that technological change will play a fundamental role in achieving
sustainable development. We also sense that the next generation of researchers,
engineering practitioners, and students interested in sustainable development will
need to draw on insights from multiple fields to successfully design, implement, and
scale solutions to our global challenges – hence the effort to introduce development
engineering to our readers.
Index
A
Aadhaar system, 537–538
Absenteeism, 338, 339, 513, 514
A/B testing, 3
Adaptation, 76–77
Adaption, 505–508
Advanced Stove Usage Monitor (ASUM),
421–422
Affordable arsenic-safe drinking water, 362
African Academy of Sciences, 88
Agent network, 252
Agricultural extension, digital
challenges, 187–194
agricultural information, limits access
to, 190–192
potential of, 192–194
innovations
crowdsourcing, 211–212
customization, 209–212
data-driven customization, 212
existing extension systems, digital
support for, 213–214
to social learning, 212
iterative development, 202–209
continuous experimentation, 204–205
data and measurement issues, 205–209
human-centered design approach,
202–203
impact evaluations, 205
localization vs. generalizability, 205
monitoring, 203
mobile phone-based agricultural extension
services, 194–202
interactive voice responses, 196–197
product considerations, 199–202
smartphones and tablets, 197
technology infrastructure, 197–199
text messages, rely on, 194–196
Agricultural information, 209
Agricultural technology, 1, 22, 190
Agriculture, 20–23, 60
gender, role of, 242–243
Agro-Hub, 231
Air Cathode Assisted Iron Electrocoagulation
(ACAIE), 392
Air pollution, 161
Airtime provider, 154
Aligning incentives, 436–437
Analytical Hierarchical Process (AHP), 259
Android app, 135, 147, 625, 629
Android-enabled smartphone app, 502
Anonymity, 328, 350
Appropriate technology movement, 7
Arsenicosis, 361–363
Arsenic poisoning in India
adapting to new contexts, 391–393
Amirabad experience, 372–374
arsenicosis, 361–363
ARUs, 362, 363
cancer risk, 361
chemistry of arsenic, 361
cost of reducing cancer risk by removing
arsenic from drinking water,
390–391
Critical Effort Zone, 386, 387
ECAR Business Model, 388
groundwater, 360, 361
health burden, 361
© The Author(s) 2023
T. Madon et al. (eds.), Introduction to Development Engineering,
https://doi.org/10.1007/978-3-030-86065-3
641
642
Arsenic poisoning in India (cont.)
implementation challenges
additional engineering work needed
during commissioning, 384
continuity of knowledge within the
team, 383
handoff of Dhapdhapi plant from UCB
and GCP-JU to Livpure, 385
revisiting and correcting early mistakes,
383
safe handling and storage of sludge,
385, 386
training of local operators, 382–383
levels of arsenic, 361
MCL levels, 360
multi-stakeholder management, 388–389
principal investigators, 390
prior experience
arsenic in Bangladesh, 370–372
WaterHealth International, 370
project progression from lab bench to
full-scale pilot
Berkeley-JU team, 368, 369
coalition of partners, 364–366
Development Impact Lab, 366
ECAR, 366
GCP-JU, 366
IUSSTF, 366, 367
LDRD program, 365
safe drinking water for all, 360
scaling up and commissioning
demonstration plant, 378–380
schools as public health concern, 390
600 L prototype, 375–378
technical challenges, 380–381
hot and humid climate, 381–382
intermittent power supply, 382
technology design and debugging, 389
theory of change, 363–364
unexpected changes in stakeholder
leadership, 388–389
Arsenic removal from drinking water, 390–391
Arsenic removal units (ARUs), 362, 363
Arsenic Removal Using Bottom Ash
(ARUBA), 370, 371
Artificial intelligence-based chatbot, 345
Asset-based community development, 85
Asymmetric bargaining model, 237
B
Bangalore Water Supply and Sewerage Board
(BWSSB), 469
Index
Bangladesh University of Engineering and
Technology (BUET), 371
Bargaining spillover, 237
Berkeley-based nonprofit organization, 407
Berkeley-Darfur Stove, 9
Berkeley team, 365, 367, 376, 378, 380
Big data, 162
Blackouts, 118
“Boomerang” effect, 8
C
Case incidence report (CIR), 344
Case manager (CM), 344, 345
Case reporter (CR), 344, 345
Case troubleshooter (CT), 345
Cash transfer plus mobile phone, 255
Cash transfers, 253, 259, 271
Central Pollution Control Board (CPCB),
166–168, 172
impact, estimation, 176–179
technical performance, assessing, 173–175
usefulness, assessing, 175
Chief Executive Officer (CEO), 228
Child-centred apps, 277
China-Pakistan Economic Corridor, 40
Civil and Environmental Engineering
Department, 365
Climate change, 17, 19, 22, 126, 164, 165, 191,
242, 270, 481
Cloud-based analytic system, 136
Co-design, 85
Commodity exchanges, 232–234, 239–240
Community-based participatory design, 85
Community cellular networks (CCNs)
adaptation, 584–586
commercial operations, 580
community response, 581–582
deployment context, 572–575
description, 568
implementation challenges, 575
open challenges, 586
operational model, 570–571
personnel retention, 582–583
spectrum negotiations, 575–576
stakeholder needs and interests, 576–577
subscription and usage, 579
technical operations, 579–580
technology, 568–570
trust and community relations, 583–584
unexpected changes in the field, 577–578
Community-scale water chlorination
technology, 4
Index
Computador Popular, 85
Confederation of Indian Industry (CII), 367
Confederation of Indian Textile Industry
(CITI), 324
Confounding or selection bias, 110
Constraints, low-income households
agricultural income, 60
institutional failures, 62–66
irregular income, 60
market constraints, 61–63
social norms and behavioral constraints,
66, 67
Consultative Group on International
Agricultural Research (CGIAR),
211
Continuous Emissions Monitoring Systems
(CEMS), 162, 164, 166
Continuous operation of sensor network, 152
Conventional nitrogen management, 458
Cooking-event-detection algorithm, 418
Cooperative design, 85
Cost data, 121
Counterfactuals, 499
COVID-19, 35
Credit market failures, 226
Critical Effort Zone, 386, 387
Crowdsourcing, 211–212
Current Population Survey (CPS), 303
Customised e-learning platforms
adaptation
funding model, 284
implementation toolkits, 282
localisation, 283
teacher training, 281–282
challenges and benefits, 287–288
development challenge, 269–272
evaluation, 278–281, 284–288
implementation approach, 277–278
implementation context, 273–275
innovation, 275–277
policy-makers, 289
practitioners, 288
software developers, 288–289
D
Darfuri IDP women, 416
Darfur SUMS program, 418
Darfur SUMS study, 419
Data acquisition system (DAS), 166
Data collection, 403
Data-driven customization, 212
Data loggers, 404, 405
643
Data-logging sensors, 406
Data security and privacy, 199–200
Delvic Sanitation Initiatives (DSI), 455
Demographic dividend, 266
Deshpande Foundation, 468
Development challenge
problem iteration, 432–433
sanitation, 429–431
UC Berkeley and Sanergy, 431–432
Development engineering
appropriate technology movement, 7
aspirations, 85, 86
beneficiaries, 84–86
climate and environment, 3
community organizations, 88
community-scale water chlorination
technology, 4
cost-benefit analysis, 93–94
design process, 488
Digital Green, 87, 88
disadvantaged households, 3
economic growth, 6
ethical research
funding, 90, 91
interaction with people and
communities, 88
research involving people, 89–90
safe research environment, 90
external validity and scale, 92–93
extra-technological challenges, 92
framework for, 70
history, 1–5
humanitarian engineering, 8–9
ICTD, 9–11
long-term economic and social impacts, 3
market-oriented approaches, 7–8
participatory design, 11
path of, 77
postwar era, 6
privilege, 87, 88
problem-focused fields, 4
scalability of technological solutions, 12
technological solutions, 4, 5
toolkit, 487
“top-down” models, 86, 87
unanticipated negative effects, 94–95
Development engineers, 481–484
Development engineer’s paradox, 83–84
Development Impact Lab, 366
Development Innovation Venture (DIV) grant,
492
Dhapdhapi plant, 377–379, 381, 382, 385,
387–392
Digital access, 506
644
Digital agricultural extension
challenges, 187–190
agricultural information, limits access
to, 190–192
potential of, 192–194
costs and financing of, 201–202
innovations
crowdsourcing, 211–212
customization, 209–212
data-driven customization, 212
existing extension systems, digital
support for, 213–214
to social learning, 212–213
iterative development, 202–209
continuous experimentation, 204–205
data and measurement issues, 205–209
human-centered design approach,
202–203
impact evaluations, 205
localization vs. generalizability, 205
monitoring, 203–204
mobile phone-based agricultural extension
services, 194–202
interactive voice responses, 196–197
product considerations, 199–202
smartphones and tablets, 197
technology infrastructure, 197–199
text messages, rely on, 196–197
Digital communication technologies, 563–565
Digital financial services (DFS), 249, 261
Digital Green, 87, 88
Digital networking
adaptation, 313–314
cost-benefit calculation exercise, 318–319
design and implementation, 305–307
development challenge, 293–296
evaluation, 310–311
implementation challenges and iterations
data collection and cleaning, 309–310
survey implementation, 308–309
treatment administration, 307–308
innovation, 303–305
LinkedIn training curriculum, 315
power calculation exercise, 315–318
project formation, 296–297
local context, tailoring solution to,
297–298
local partner, identifying, 298–301
problem boundary, defining and
refining, 301–303
Digital public services, India
Aadhaar system, 537–538
authentication of identity, 548–549
deduplication of records, 547–548
Index
enrollment of beneficiaries, 545–547
evolution of biometric IDs, 536–537
innovation and iteration at scale, 551–552
large-scale evaluations
evaluation of aadhaar in Jharkhand,
554–556
evaluation of AP’s smartcards, 553–554
scale experiment, 552–553
manual overrides, 549–550
National Rural Employment Guarantee
Scheme (NREGS), 539–540
political buy-in, 550–551
Public Distribution System (PDS), 538–539
reforms in benefits delivery, 544–545
reforms in identification, 541–544
reforms in payment systems, 544–545
Social Security Pensions (SSP) scheme,
540–541
Digital technologies, 192
Digital trading and market platforms
commodity exchanges, 239–240
development challenge, 221–222
matching supply and demand, 222–223
price information, 223–225
quality of crops, information on, 225
storage and credit market failures, 226
evaluation, 234–236
ideation, 226–227
implementation context, 227–228
innovation, 227–228
commodity exchanges, 232–234
mobile phone-based trading platforms,
229–232
price alerts services, 228–229
price alerts services, 237–239
Direct-to-community approaches, 282
Donors, 90, 91
Double-Click vs. Single Tap, 413–416
Dow Chemical company, 365
Dropbox, 417, 484
DumsorWatch, 134–137, 139, 141–148, 150,
151, 155, 156
E
Early Grade Mathematics Assessment
(EGMA), 280
Early Grade Reading Assessment (EGRA),
280
EASST Collaborative, 88
Econometric model, 236
Economic industrialization, 129
Edtech, 266
e-Learning platforms, 271
Index
Election day letter, 504
Election infrastructure, 490
Electoral integrity, 46
Electoral integrity in emerging democracies
administrative procedures, 495
adoption, 505–508
aggregation process, 495
bureaucratic organization and process, 494
capacity, 509
case study, 490
collecting data, 490
counterfactuals, 499
election commissioners, 494
election management delegation, 496
evaluation, 503–505
fraudulent vote patterns, 491
gender, 506
hacking, 491
information and communications
technology (ICT), 492
innovation, 496–501
international community, 490
iterative implementation, 501–503
lessons learned, 508–510
photo quick count, 492, 502
pivot, 505
political competition, 493
polling official, 494
responsible research, 508
Tally forms, 500
transmission process, 497
VIP:Voice, 491, 508, 510. 507
Electoral laws, 498
Electricity Company of Ghana (ECG), 131
Electricity grid reliability in Ghana
adaptation from large-scale deployment to
sustainable large-scale deployment,
149–151
adaptation from medium-scale deployment
and evaluation of large-scale
deployment, 148–149
operational, 149
organizational and cultural, 148
technical, 148–149
adaptation from small-scale pilot
experience and evaluation of
medium-scale deployment, 143
cultural, 144
failures and missteps, 147–148
operational, 146
organizational, 144
technical, 145
changing deployment context, 131
continuous monitoring systems, 152–153
645
data collection instruments, 134
sensors, 135
surveys, 136
deployment
dataflow, 153
dependence on participants, 140–141
deployment management tools, 141
methodology for sensors, 139
overview, 138
sampling strategy, 137–138
site selection, 137
and surveying team, 138–140
deployment management meta-systems,
130
energy environment, 131
high-level goals
energy-reliability data quality, 132–133
impacts of reliability, 134
utility-independent measurements,
133–134
importance of, 130
improvements in, 130
local service providers, 153–154
organizational challenges, 141
partners, 132
small-scale pilot, 142
technology usage, 155–156
university lacking financial agility, 154
Electricity in Kenya
blackouts and construction delay, 118–120
connecting households in areas with no
electricians, 116–118
cost data, 121
demand and costs, 121–124
development challenge, 102, 104, 126
electricity access and consumption trends,
127
electricity consumption, 126
electrification impact, 103
lighting, 101–102
meaningful and statistically significant
impacts of electricity access,
124–125
mobile money platforms, 105
MOU, 114, 116
on-grid, off-grid, or under-grid villages,
107–108
pilot microgrid in, 103
potential leakage issues, 121
prepaid, smart metered solar microgrids,
105–106
private vs. public infrastructure, 108–109
randomizing access to grid electricity,
109–110
646
Electricity in Kenya (cont.)
pre-analysis plan, 110–115
transformer communities, 110–114
renewable energy alternatives, 104
rural electrification, 101–104, 109, 113,
120, 122, 123, 126
ElectroChemical Arsenic Remediation
(ECAR), 356, 364, 366–369,
371–373, 376, 378–384, 387–392
Electrochemical stripping, 453
Electronic meters, 40
ElectroSan technologies, 433, 436, 451, 456,
457
Emissions Trading Scheme (ETS), 180
e-money, 33
Employee satisfaction survey, 348
Employer-employee communication channels,
329
Employment Tax Initiative (ETI), 296
Energy environment, Ghana, 131
Energy for all, 17, 127, 132
Energy poverty, 102
Envoie code, 260
Established routine, 286
Ethical research, 88–91
Ethiopian Commodity Exchange (ECX), 228,
239
European Centre for Medium-Range Weather
Forecasts (ECMWF), 211
Evaluation, 75–76, 503–505
External partners, 287
F
Facebook, 313, 342
Fecal waste, 436
Fe-EC with External Oxidizer (FOX), 393
Fertigation, 454
Fintech, for rural markets
adaptation, 259–260
development challenge, 247–250
evaluation, 256–258
implementation, 250–252, 255–256
innovation, 252–255
interpretive text boxes, 262
Firms, 23–24
Fitbit, 403
Formal sector workers, protections for,
324–325
Fresh Life Toilets (FLTs), 432, 435, 459
Frontline workers, 325
Funding model, 284
Index
G
Gadgil Lab, 392
Garment industry, 349
workers in, 324–326
General Data Protection Regulation (GDPR),
310
Geocene, 422–424
Geocene Mobile App, 422
Geocene Studies, 422–423
Geocene Temperature Logger, 422
Ghana Commodity Exchange’s (GCX), 228,
232, 241
Ghana Power Compact, 132, 137, 138, 142,
146, 149
Global Clean Cooking Alliance, 482
Global learning crisis, 269–270
Global Learning XPRIZE, 275
Global precipitation measurement (GPM),
209–210
Global weather prediction models, 191
Good Business Lab (GBL), 328, 339–341
Google, 414
Google Earth Engine, 210
Google Image Search, 405
Google-ranked data loggers, 404
Government accountability, 488
Government agencies, 332
learning through feedback and
experimentation in, 207–209
Government-to-person payments, 34
GPS-equipped mobile phones, 214
Grain Receipt Note, 232
Grand Ethiopian Renaissance Dam, 37
Grid power, 108
GRIT Freedom Chair, 8
G Suite, 342
Gujarat Pollution Control Board (GPCB), 162,
163
H
Hackathon, 346
Harambee Youth Employment Accelerator,
298–299, 305, 310, 313
High-level user interface design
of CGNet Swara, 593
of Polly, 594
Holistic research approach, 279
Honey Bee network, 8
Household Air Pollution Investigation Network
(HAPIN), 423
Human-centered design (HCD), 10–11, 85,
202–203
Index
Human Development Report, 359
Humanitarian disaster response, 631–632
Humanitarian engineering, 8–9
Humility, 84, 89, 91, 288
I
iButton data loggers, 410
ICT-based services, 193
ICT for Development (ICTD/ICT4D), 9–11
IDEO, 60
Impact, 400
Implementation, 74–75, 438–439
Implementation context
civil society and the international
community, 496
election commission, 494
Inaccuracies, 474
Inache, 343, 344
limitations and future developments of,
345–348
Indian garment workers and firms, 326, 327
Indo-US Science and Technology Forum
(IUSSTF), 366, 367, 377, 388
Inductively coupled plasma-mass spectrometry
(ICP-MS), 380
Industrial pollution monitoring, in India
CEMS, 166, 172
impact, estimation, 176–179
technical performance, assessing,
173–175
usefulness, assessing, 175
development challenge, 161–163
evaluation setting up, 167–169
experimental sample identification, 165
implementation challenges in field, 169
installing CEMS, problems
encountered, 169–170
regulatory practice, linking data to, 172
project location, 164–165
Information and Communications Technology
for Development (ICTD), 464
Information and communication technology
(ICT), 9, 192, 237, 238, 492
Innovation, 70–73, 497–501
ElectroSan processes, 439
environmental sustainability, 446–447
fertilizer and agriculture, 443–444
fertilizer production, 441
liquid fertilizers, 439
markets/economic sustainability, 444–446
selective separation processes, 440
technology, 441–443
647
Institutional review board (IRB), 89
Intellectual property (IP), 76
Interactive voice responses (IVR), 10,
196–198, 341, 342, 590
Intermediaries, 482
Internally displaced persons (IDPs), 406
Internal Review Board (IRB), 310
International community, 490
Internet, 304
Internet of Things (IoT) sensors, 399
data collection and interpretation process,
403
data quality in real-time, 406
multiple research studies, 403
recall errors and social-desirability bias,
403
technological interventions, 402
technology’s appropriateness, 403
Internet traffic, 414
Interpretation process, 403
Intertemporal correlation coefficient, 317
Intervention, 5, 88–90, 92–94
Intervention technology, 401
Intracluster correlation coefficient, 317
Intra-household decision-making, 258
Intrinsic value, 333
Invention, 5
Iterative implementation, 501–503
education and funding, 450–451
laboratory research and, 448–450
IVR platforms, 10
J
Japan Aerospace Exploration Agency (JAXA),
210
Job readiness training program, 308
K
Kenya Power office, 107
Kenya’s Rural Electrification Authority
(REA)., 109, 111, 112, 114–118,
120, 122–124
L
Laboratory Directed Research and
Development (LDRD) program, 365
Labor market information channel, 302
Lake Turkana Wind Power farm, 37
Landsat, 210
648
Large-scale evaluations
evaluation of aadhaar in Jharkhand,
554–556
evaluation of AP’s smartcards, 553–554
scale experiment, 552–553
Last Mile Connectivity Project (LMCP), 113,
123–127
Lawrence Berkeley National Lab, 365
Leakage issues, 121
LED lighting, 40
Linear simplicity, 400
LinkedIn, 296–298, 301–304, 307, 310, 312,
313, 315
Livpure, 367–369, 378–380, 385, 388, 389,
393, 394
Luminous Power Technologies (Livpure), 367
M
Macro-environment, 330–331
Malawi, 271–272
customised e-Learning platform in, 274
evaluation, 285
Manual cash, 254
Market constraints, 61–64
Market failures, 221
Market information system (MIS), 237
Market-oriented approaches, 7–8
Marshall Plan, 6
Maximum contaminant level (MCL), 360
Memorandum of Understanding (MOU), 114,
116, 374–376, 393, 470, 479
M-Farm, 230
Microenvironment, 331–333
Microgrids, 38, 40, 100, 101, 103–108, 126
Microsoft Windows, 404
Millennium Challenge Corporation (MCC),
132
Millennium Development Authority (MiDA),
132, 137, 142, 146, 149
Minimum detectable effect size (MDE), 315
Ministry of Drinking Water and Sanitation
(MDWS), 392
Ministry of Education, Science and Technology
(MoEST), 273
Ministry of Energy and Petroleum in Nairobi,
124
Mixed-method approach, 284
M-KOPA, 105
Mobile applications, 60, 134, 155, 230, 239
Mobile frameworks, ODK
scan, 631
sensors, 630–631
services, 630
Index
submit, 630
survey, 630
tables, 629
Mobile money, 251
adoption, 249
agents, 251
cash transfer, 257
program, 257
Mobile network operator (MNO), 199, 248,
251, 256, 564
Mobile phone-based agricultural extension
services, 194
interactive voice responses, 196, 198
product considerations, 199–202
costs to farmers, 202
customer acquisition, 200
digital agricultural systems, costs and
financing of, 201–202
smartphones and tablets, 197, 199
technology infrastructure, 199
text messages, rely on, 195–196
Mobile phone-based trading platforms,
229–232
Mobile phones, 192
developing countries, penetration of, 188
Mobile technology landscape, 351–352
Mobile virtual network operators (MVNO),
154
Moderate Resolution Imaging
Spectroradiometer (MODIS),
210–211
Monitoring the monitors in Punjab, Pakistan
absenteeism, 513, 514
adaptation, 527–529
administrative hierarchy, 517
Basic Health Units (BHUs), 514
development problem, 515
doctor attendance, 515, 524
evaluation, 515
flagging effects, 526
flagging underperformance, 524
ICT-based program, 514, 528
innovation, 518–519
inspection rates, 522
iteration, 520–521
online dashboard screenshots, 516
organization chart, 518
program evaluation, 525
provincial department, 517
public sector management problems, 529
Punjab Health Sector Reform Program
(PHSRP), 514–515
randomized controlled trial (RCT), 521
senior health officials, 517
Index
treatment-on-the-treated (TOT) effects, 523
M-PESA, 9, 29, 33–35, 105, 248
Mwazo Institute, 88
N
National Accreditation Board Labs (NABL),
380
National Electrification Strategy, 123
National Meteorological and Hydrological
Services (NMHS), 192
National Rural Employment Guarantee
Scheme (NREGS), 539–540
Natural monopoly, 121
NextDrop, 464
Pilot in Hubli-Dharwad, 467–469
Scale-Up in Bangalore, 469–470
subsequent status of, 480–481
water supply information, 465
Niger, 249
agricultural production in, 248
Nongovernmental organizations (NGOs), 11,
248, 251, 282, 332
“No toilet, no bride” campaign, 86
O
Off-grid households, 107–108
Off-the-shelf software solution, 335–341
Onebillion, 277, 283
One-laptop per child (OLPC), 10, 85, 270
On-grid households, 107–108
Online platforms, 296
Open Data Kit (ODK), 414, 564, 565
bidirectional data management, 624
challenges and lessons, 633–635
cutting-edge technology, 633
data collection platform, 625
data collection workflows, 613
data management platform, 625
deployments, 621–622, 631–632
design decisions, 614–616
development challenge, 614–616
evaluation and user feedback, 622–623
extensibility exploration, 627–632
feature requirement, 626
history of, 617
iterative design with users, 620–621
leveraging technology, 633
Microsoft (MS) Office, 618
mobile frameworks, 628–631
multi-perspective design, 626–627
multiple pilot deployments, 625
portable digital devices, 616
649
project’s development, 618–619
tool suite, 619–620
unidirectional data collection, 624
UW-CSE research, 624
Organisation for Economic Co-operation and
Development (OECD), 304
Organizational development (OD) teams, 330
Overcoming constraints, 437–438
P
Participatory action research, 85
Participatory design, 11, 85
Particulate matter (PM), 166, 168
Paternalism, 85, 86
PayPal, 484
Pedometer analogy, 404
Personal identification numbers (PINs), 250,
251
Person-to-business payments, 34
Person-to-person (P2P) transfers, 247
Photo quick count, 492, 502
Pivots, 350
Placeholder, 252
The Play Pump, 85
Political accountability, 489
Political landscape, 351–352
Position-optimization process, 412
Potential Energy, 407, 411
Power Africa, 112
Power critical value, 316
Power quality, 133, 134, 136, 137
Power Technics, 119
PowerWatch, 134–143, 145, 146, 148–151,
155, 156
Practical framework research
adaptation, 76–77
evaluation, 75–76
framework for development engineering,
70
implementation, 74–75
innovation, 70–73
Pre-analysis plans (PAPs), 256
Precision agriculture, 189–190
Precision Development (PxD), 189–190, 203
Predatory policing, 60
Prepaid, smart metered solar microgrids,
105–106
Price alerts services, 228–229, 237–239
Price discovery, 224
Primary schools, 276
Privilege, 87, 88
Professional network, 302
“Pro-poor” technologies, 3
650
Provident fund (PF), 342, 350
Public Distribution System (PDS), 538–539
Public extension services, 191
Punjab Department of Health organization
chart, 518
Punjab Health Sector Reform Program
(PHSRP), 514–515
Purchasing power parity (PPP), 359
Q
Quality education, 30–32
R
Radiant MLHub, 211
Randomized control trials (RCTs), 3, 103, 162,
163, 248, 278, 297
Reaching Scale, 452–455
Ready-board solution, 118, 119
Regression analysis, 480
Research
results, 474
sample selection and randomization,
472–473
site selection, 472
two-wave survey and enrollment, 473
Researcher-implementation partner
relationship, 300
Research Ethics Committee (REC), 89
Residual variation, 318
Reuters Market Light (RML), 238
Rozee.pk, 304
Rural electrification process, 120
Rural markets, fintech for
adaptation, 259–260
development challenge, 247–250
evaluation, 256–258
implementation, 250–252, 255–256
innovation, 252–255
interpretive text boxes, 262
Rwamagana Solar Power Plant, 37
S
Sahel, 248, 259
Sanergy, 432, 436, 438
Sanitation, 86
circular economy and resource recovery,
434
decentralized options, 431
and fertilizer, 433–434
global population, 431
Kenya’s informal settlement, 430
Index
public health and environmental quality,
430
school sanitation, 430
valorizing urine, 434–435
water-related disease, 430
Sanitation service providers (SSPs), 455
Satellite-based yield measurement, 207, 208
Scale, 400, 401
Scale up, 62, 69, 75–76, 90, 92, 93
Scaling approach, 281–284
SDG 4, 270
“Second-generation” digital financial services,
249
Second Information Technology in Education
Study (SITES), 270
Self-report vs. SUMS, 420
Sensor-based stove usage monitoring system
(SUMS), 408
Sensor data, 399
Sensor deployment, 152
Sensors, 130, 133–140, 142, 143, 145, 146,
148–152, 155–157
Sentinel-2, 210
Sexual violence, 407
Shahi exports, 326, 327
Short message services (SMS), 194, 195, 230
Shri Hari Industries, 367, 368, 376, 378
Significance, 287
SIM cards, 136, 142, 144, 145, 149, 251, 255,
417, 535, 569–571, 574, 579
Simputer, 85
600 L prototype, 375–378
Smallholder
farmers, 195, 199
farm yields, 187
weather information, 191–192
Small-scale pilot, 142
Smartphone ownership, 298
Smartphones, 195, 197
The Soccket, 85
Social learning, 212
Social Security Pensions (SSP) scheme,
540–541
Socioeconomic status (SES), 477
Soil Health Cards (SHCs), 204
Solar microgrids, 38, 100, 101, 103, 105–106,
108, 126
Southern African Development Community,
313
Southern and Eastern Africa Consortium for
Monitoring Educational Quality
(SACMEQ) III, 271
Speech vs. key press, 591
Stakeholder needs and interests, 576–577
Index
State Public Health Engineering Departments
(PHEDs), 392
Stove usage monitoring system (SUMS), 409
Structural inequalities, 272
Sub-Saharan Africa, 101, 105, 108, 125
SUMSarizer, 420–421
Supervisory control and data acquisition
(SCADA), 132, 133
Supply and demand, 222–223
SurveyCTO, 136, 152
Survey data, 417–418
Sustainable Action Group (SAG), 409
Sustainable Development Goals (SDGs), 1, 12,
50, 270, 360
Sustainable Products and Solutions, 365
Swiss Federal Institute of Aquatic Science and
Technology (EAWAG), 361
System average interruption duration index
(SAIDI), 132
System average interruption frequency index
(SAIFI), 132
T
Tablets, 197
Tally aggregation process, 500
Technological interventions, 482
Technological solution, 4
Technology and development
agriculture, 20–23
energy and environment
guaranteeing sustainability, 39–41
scaling energy access, 36–39
financial technologies
e-money, 33
facilitating firm and government
transactions, 34–36
increasing financial resilience, 33–34
firms, 23–24
healthcare services, 47–49
infrastructure, 22–26
labor markets and structural change
employer-employee information gap,
27–28
new employment opportunities, 26
quality education, 30–32
world of work, 28–30
state capacity and public sector delivery
political participation and electoral
integrity, 45–47
state effectiveness and accountability,
42–45
trade, 24–26
Technology readiness level (TRL), 373
651
Telecom, 351–352
Telecom Regulatory Authority of India
(TRAI), 352
Temperature time series, 419
Text messages, 194–196
Theory of change, 348
Theory of change (ToC), 363–364
Theory, Research, Assessment, Comparison,
Evidence (TRACE) research, 280
Third-party organizations, 326
Toilets, 86
Trade, 24–26
Traditional data loggers, 404
Transformer communities, Western Kenya, 112
Triboelectric effect, 166
Twiga Foods, 231
Twilio SIM cards, 145, 149
Two-way communication, 350
U
UC Berkeley, 437, 448
UC Berkeley campus, 365, 451
UC Berkeley’s Development Impact Lab, 102
Under-grid households, 107–108
Unified Market Platform (UMP), 238
United States Agency for International
Development (USAID), 366
Universal design, 275
Unlocking talent, 278, 281
e-learning platform, 275–277
evaluation, 284
implementation toolkits, 282
localisation, 283
Unstructured supplementary service data
(USSD), 142, 230, 231
Urban Services, 69
Urine-derived fertilizers, 457
Urine-diverting toilets, 432
Urine Summit, 455
USAID Power Africa, 113
US-based SIM Cards, 145
US EPA’s Toxic Characteristic Leachate
Protocol (TCLP), 370
User acquisition mechanism, 604–605
User-centered design, 85
User protection, 199
UV Waterworks, 9, 369, 370
V
Vaccine cold chain inventory, 632
Valorizing urine, 435–436
Variable renewable energy (VRE) sources, 41
652
VIP:Voice, 491, 507, 508, 510
Voice forums
community involvement, 591
comparison of, 592
high-level user interface design, 593
ICT-based interventions, 589
interactive voice response (IVR)
technology, 590
peer-to-peer services, 590
social services, 590
speech-based information, 590
speech vs. key press, 591
textual interfaces and internet access, 590
top-down information push services, 590
Voice interfaces
high-level user interface design
of CGNet Swara, 593
of Polly, 594
local language audio content, 596–598
managing cost, 600–602
measuring impact, 605–607
mechanisms of user acquisition, 604–605
open challenges, 607–608
replication and scale, 602–604
scaling voice-based services, 593–596
voice forums
community involvement, 591
comparison of, 592
high-level user interface design, 593
ICT-based interventions, 589
interactive voice response (IVR)
technology, 590
peer-to-peer services, 590
social services, 590
speech-based information, 590
speech vs. key press, 591
textual interfaces and internet access,
590
top-down information push services,
590
Voluntary Service Overseas (VSO), 273, 274,
277, 278, 281
W
Warehouse receipt system (WRS), 234
Washington Consensus, 85
WaterHealth International (WHI), 369, 370
Water supply unpredictability, 464
Water utilities, 464
Weather forecasts, 191
Index
Women’s Center, 412
Worker voice, with technology and
organizational incentives
custom solution, 341–344
development challenge, 323–324
attrition, voice and worker well-being,
326–327
establishing connection, 324–326
good business, lab for, 327–328
inache, limitations and future developments
of, 345–348
innovation
existing mechanisms for, 329–330
factory environment, modeling,
330–333
off-the-shelf software solution, 335–341
study of, 333–335
WOVO platform, 335, 337–341, 350
Y
Youth unemployment, digital networking and
adaptation, 313–314
cost-benefit calculation exercise, 318–319
design and implementation, 305–307
development challenge, 293–296
evaluation, 310–311
implementation challenges and iterations
data collection and cleaning, 309–310
survey implementation, 308–309
treatment administration, 307–308
innovation, 303–305
LinkedIn training curriculum, 315
power calculation exercise, 315–318
project formation, 296–297
local context, tailoring solution to,
297–298
local partner, identifying, 298–301
problem boundary, defining and
refining, 301–303
Z
Zain, 256
Zap, 248, 250
Zap-enabled mobile phone, 254, 255
Zap program recipients, 258
Zap transfer, 254
Zayed Future Energy Award, 367
Zero liquid discharge (ZLD), 391
Zinder Region, 259