/


































































































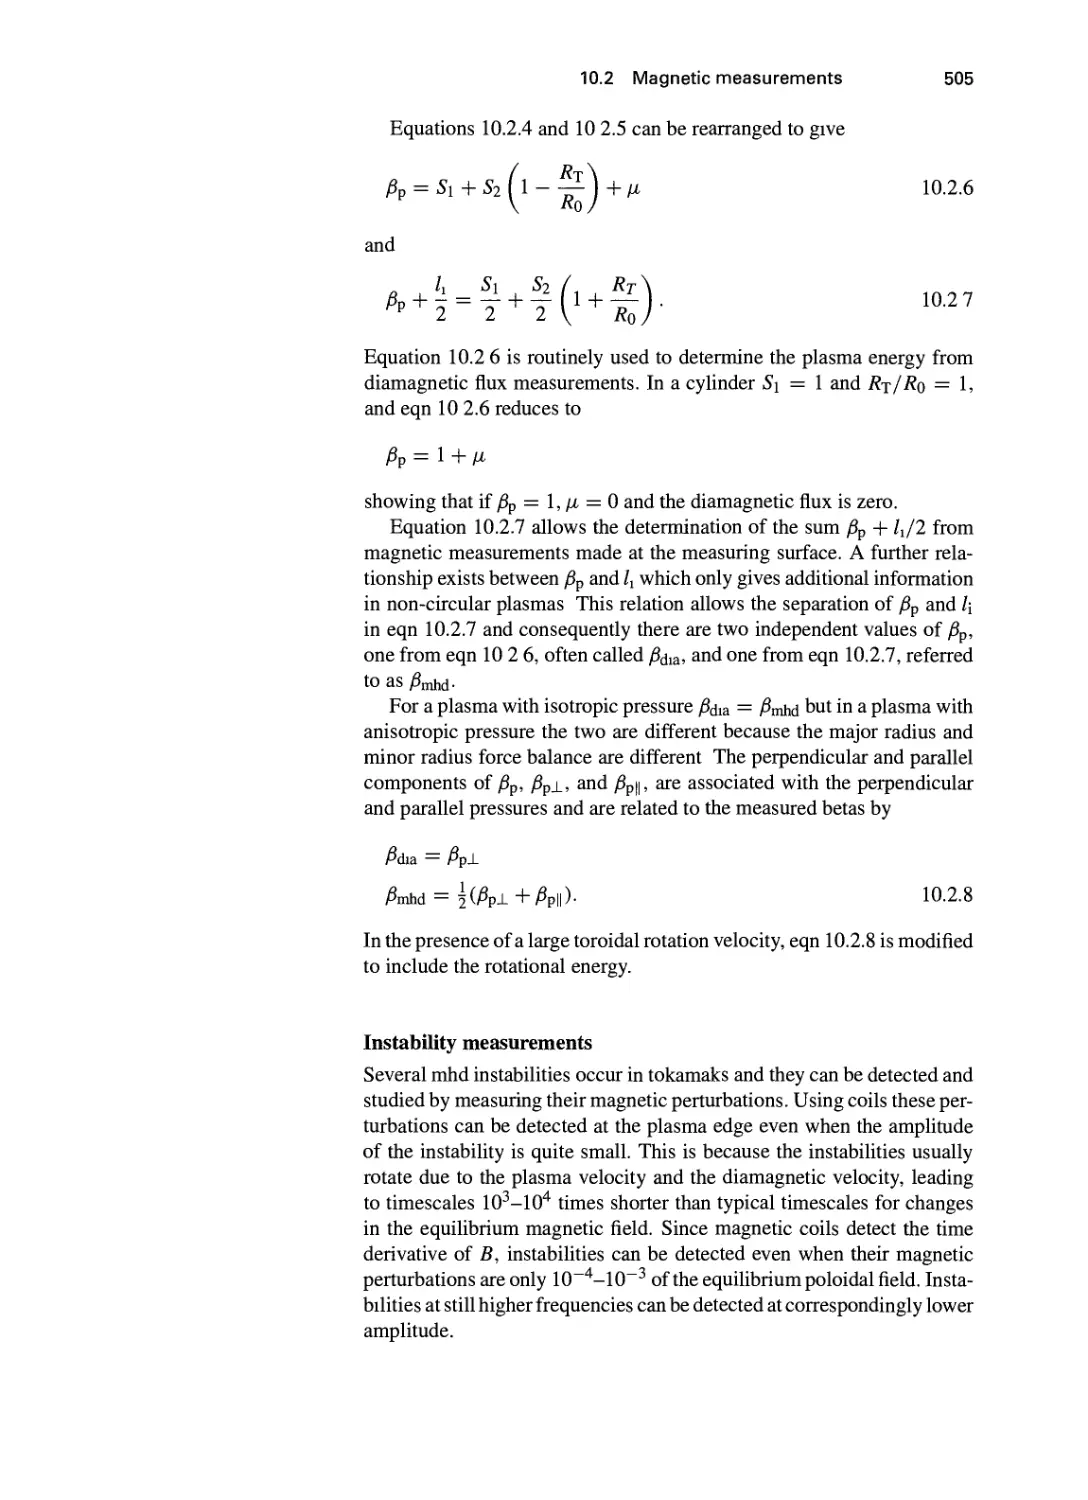
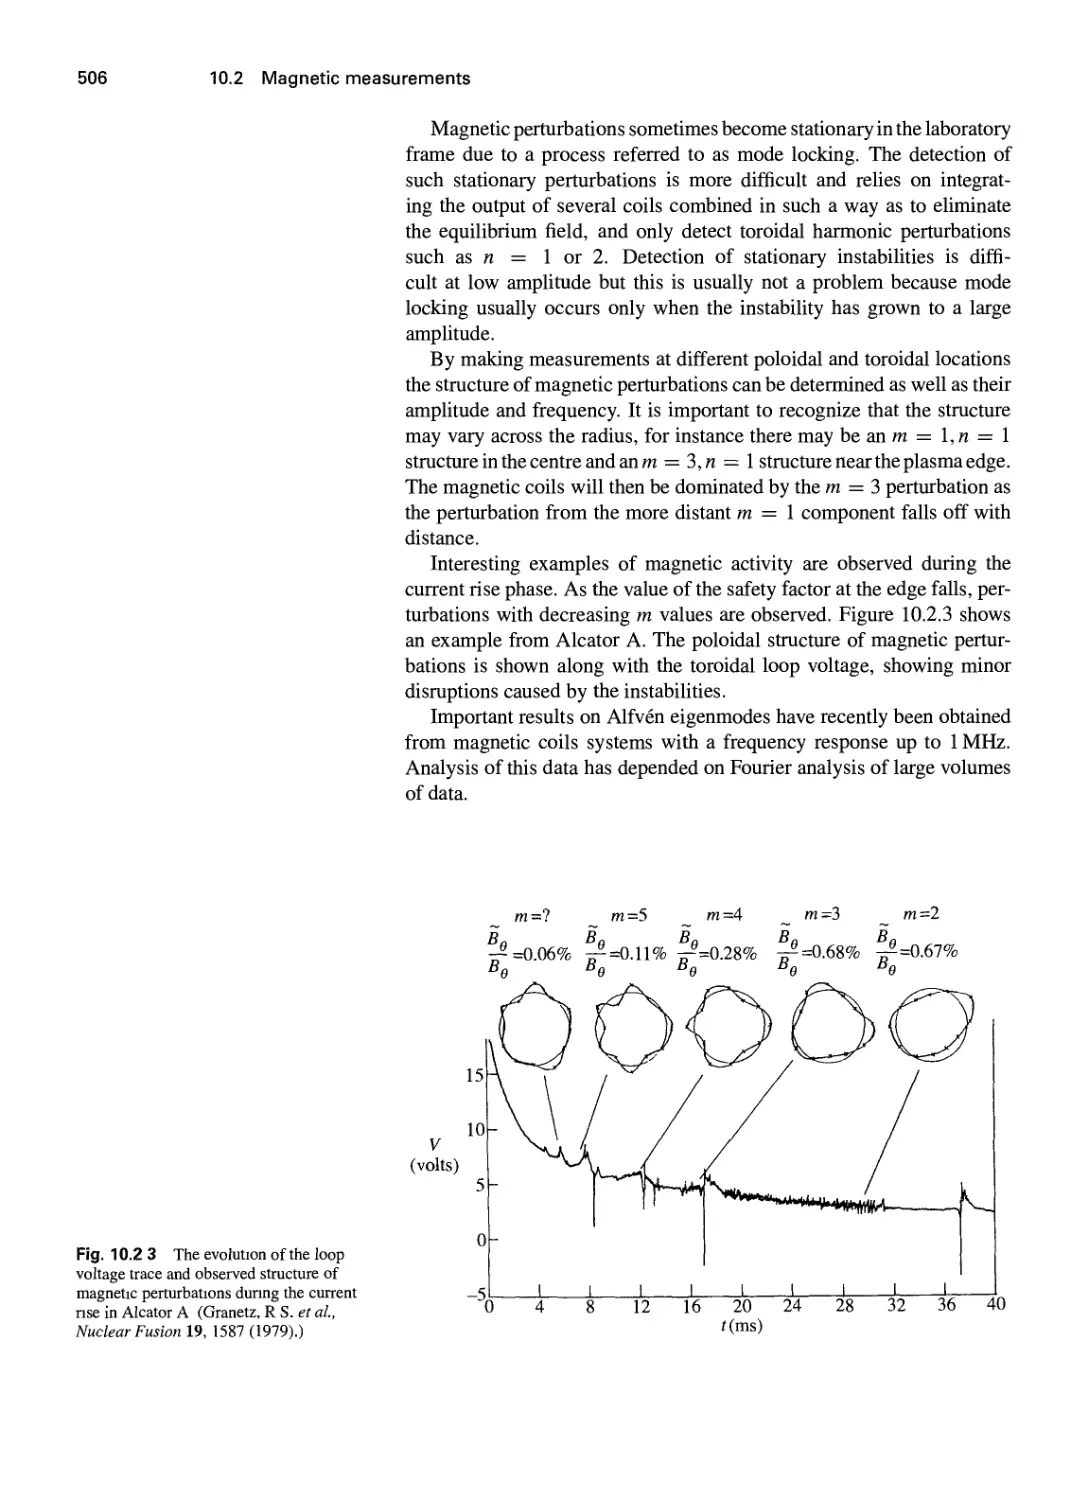
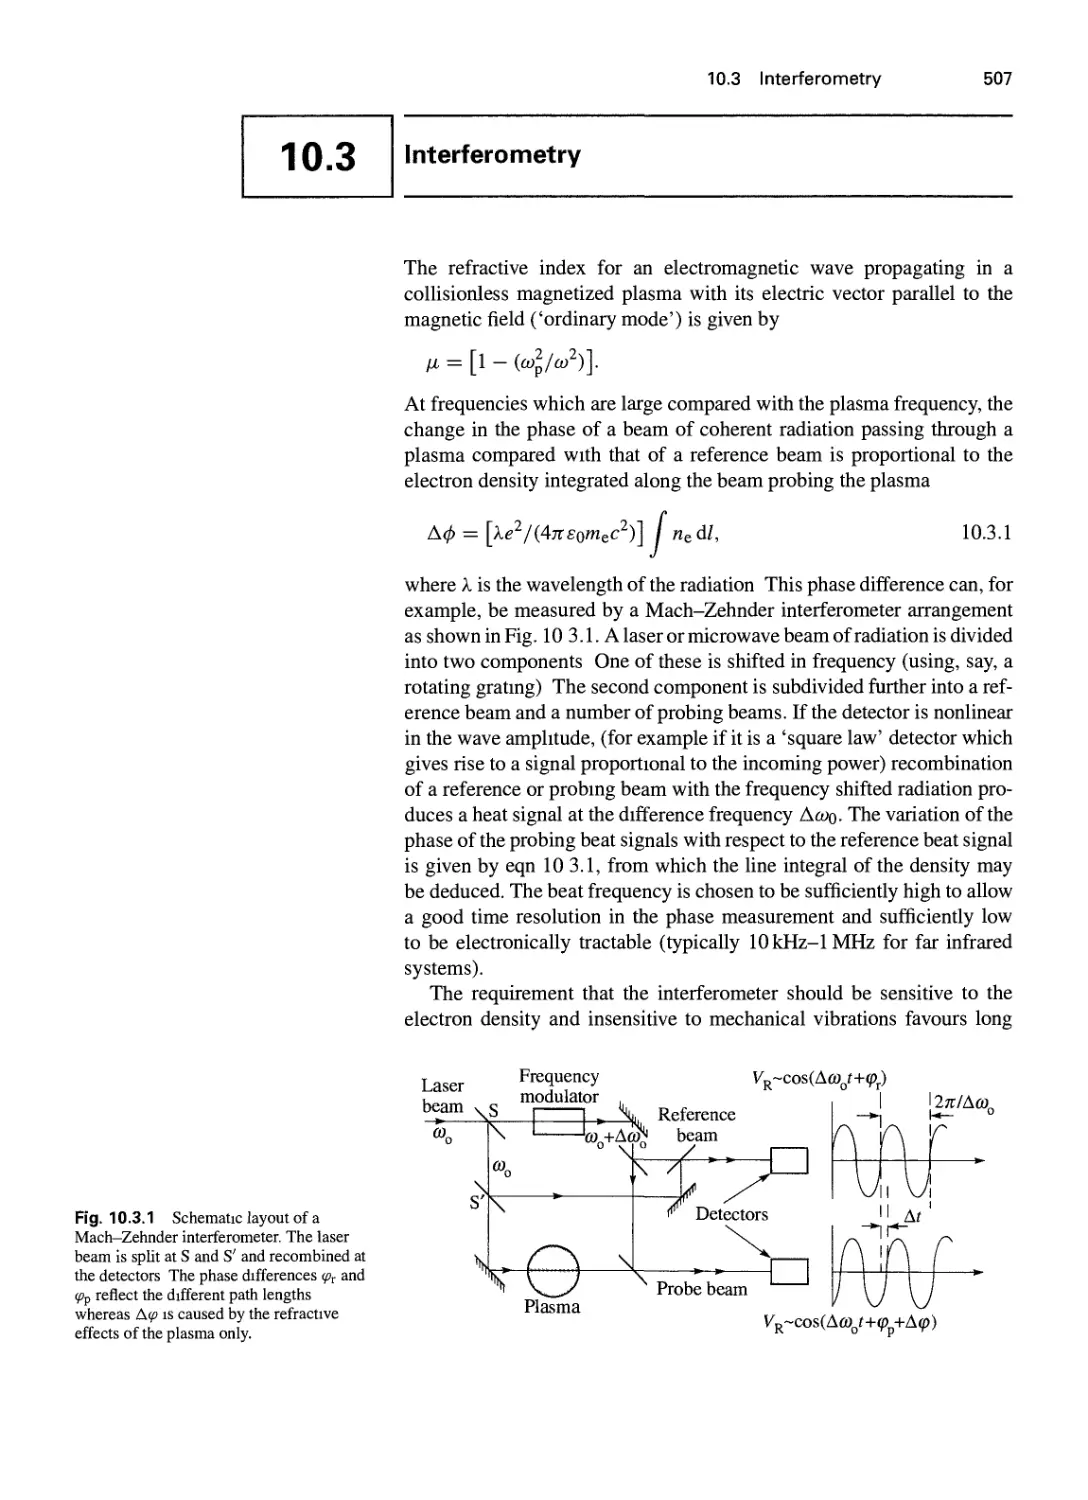
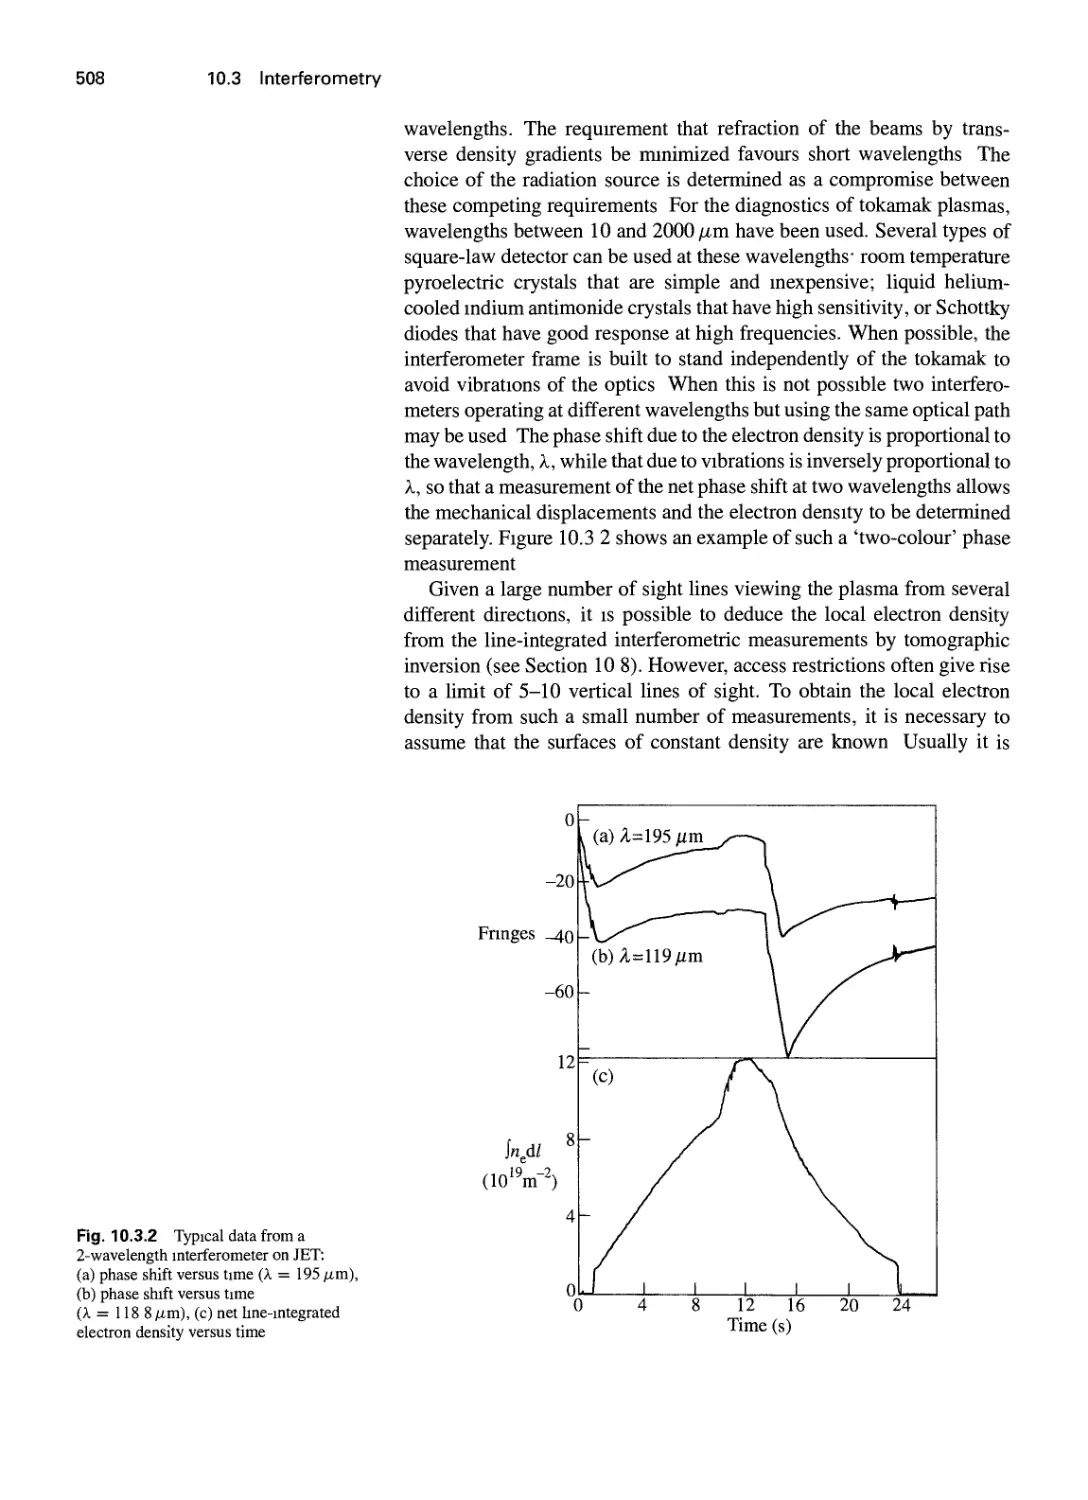






































Text
                    Tokamaki
THIRD EDITION
JOHN WESSON
with contributions from
c.
. E. COSTLEY
. LLOYD
. F. START
D. J. CAMPBELL
J. W. CONNOR
R. D. GILL
J. HUGILL
N. LASHMORE-DAVIES
G. M. Mccracken
H. R. WILSON
and
R. J. HASTIE A. HERRMANN
G. F. MATTHEWS J. J. O'ROURKE
B. J. D. TUTiRTxm r» i wadt-i
CLARENDON PRESS-OXFORD
2004

INTERNATIONAL SERIES OF MONOGRAPHS ON
PHYSICS
118 J WESSON Tokamaks3/e
117 G E VOLOVIK The universe in a helium droplet
116 L PITAEVSKII, S STRINGARI Bose-Einstein condensation
115 G DISSERTORI.I G KNOWLES, M SCHMELLING Quantum chromodynamics
114 B DeWitt The global approach to quantum field theory
113 J ZINN-JUSTIN Quantum field theory and critical phenomena. Fourth edition
112 R M MAZO Brownian motion fluctuations, dynamics, and applications
111 H NISHMORI Statistical physics of spin glasses and mfoimation processing an
introduction
110 N B KOPNIN Theory of nonequilibrium superconductivity
109 A AHARONI. Introduction to the theory offerromagnetism, Second edition
108 R DOBBS Helium three
107 R WIGMANS Calonmetty
106 J KUBLER Theory of itinerant election magnetism
105 Y KURAMOTO, Y KITAOKA Dynamics of heavy electrons
104 D BARJDIN, G R\SSARINO The standard model in the mxikmg
103 G C BRANCO, L LAVOURA, J P SE.VA CP violation
102 T C CHOY Effective medium theory
101 H ARAKI Mathematical theory of quantum fields
100 L M PISMEN Vortices in nonlinear fields
99 L MESTEL Stellar magnetism
98 K H BENNEMANN Nonlinear optics in metals
97 D SALZMANN Atomic physics in hot plamas
96 M BRAMBE.LA Kinetic theory of plasma waves
95 M WAKATANI Stellarator and heliotron devices
94 S CHIKAZUMI Physics of ferromagnetism
91 R A BEKllMMm- Anomalies m quantum field theory
90 P K GOSH Ion traps
89 E SIMANEK Inhomogeneous superconductors
88 S L ADLER Quatemionic quantum mechanics and quantum fields
87 PS JOSHI Global aspects in gravitation and cosmology
86 E R PIKE, S SARKAR The quantum theory of radiation
84 V Z KRESIN, H MORAWITZ, S A WOLF Mechanisms of conventional and high
Tc superconductivity
83 P G DE GENNES, J PROST The physics of liquid crystals
82 B H BRANSDEN, M R C MCDOWELL Charge exchange and the theory of ion-
atom collision
81 J JENSEN, A R MACKINTOSH Rare earth magnetism
80 R GASTMANS, T T Wu The ubiquitous photon
79 P LUCHINI, H MOTZ Undulators and free-electron lasers
78 P WEINBERGER Electron scattering theory
76 H AOKI, H KAMIMURA The physics of interacting electrons in disordered systems
75 J D LAWSON The physics of charged particle beams
73 M DOI, S F EDWARDS The theory of polymer dynamics
71 EL WOLF Principles of electron tunneling spectroscopy
70 H K HENISCH Semiconductor contacts
69 S CHANDRASEKHAR The mathematical theory of black holes
68 G R SATCHLER Direct nuclear reactions
51 C M0LLER The theory of relativity
46 H E STANLEY- Introduction to phase transitions and critical phenomena
32 A ABRAGAM Principles of nuclear magnetism
27 PA M. DIRAC Principles of quantum mechanics
23 R E PEIERLS Quantum theory of solids

OXPORD
UNIVERSITY PRESS
Great Clarendon Street, Oxford 0X2 6DP
Oxford University Press is a department of the Umversity of Oxford.
It furthers the Umversity's objective of excellence in research, scholarship,
and education by publishing worldwide in
Oxford New York
Auckland Bangkok Buenos Aires Cape Town Chennai
Dares Salaam Delhi Hong Kong Istanbul
Karachi Kolkata Kuala Lumpur Madnd Melbourne Mexico City Mumbai
Nairobi SSo Paulo Shanghai Taipei Tokyo Toronto
Oxford IS a registered trade mark of Oxford University P>ress
in the UK and in certain other ci
Published in the United States
by Oxford University Press Inc , New York
©John Wesson, 1987, 1997,2004
The moral nghts of the author have been asserted
Database nght Oxford Umversity Press (maker)
First edition 1987
Second edition 1997
Third edition 2004
All nghts reserved No part of this publication may be reproduced,
stored in a retneval system, or transrmtted, in any form or by any means,
without the pnor permission in wnting of Oxford Umversity Press,
or as expressly permitted by law, or under terms agreed with the appropnate
reprographics nghts organization Enquines concerning reproduction
outside the scope of the above should be sent to the Rights Department,
Oxford University Press, at the address above
You must not circulate this book in any other binding or cover
and you must impose this same condition on any acquirer
A catalogue record for this title is available from the Bntish Library
Library of Congress Cataloging in Publication Data
(Data available)
ISBN 0 19 8509227
10 987654321
Typeset by Newgen Imaging Systems (P) Ltd , Chennai, India
Pnnted in Great Bntain
on acid-free paper by
The Bath Press, Avon

Preface
When I worked on toroidal devices in the early days of fusion research the plasma
temperatures achieved were around 10 eV and the confinement times were perhaps 100
microseconds. In the next thirty years there was steady progress and at the publication of
the first edition of this book in 1987 the temperatures in large tokamaks were several keV
and a confinement time of one second had been reached.
By then the tokamak had become the predominant device in the attempt to achieve a
useful power source from thermonuclear fusion. The accompanying increase in research
activity and general interest in tokamaks led to the need for an introductory account of the
subject and it was the aim of the first edition to provide such an introduction.
In the subsequent decade up to publication of the second edition the subject was
transformed again. There were now areas where the experimental behaviour could be understood
in terms of accepted theory, which was encouraging. There had also been substantial
research on large tokamaks leading to the long awaited achievement of significant amounts
of fusion power. Inevitably this brought us face to face with the problems involved in
designing and building a tokamak reactor. The aim of the second edition was to describe these
advances, and it is perhaps a measure of the developments in the subject that the second
edition was twice the size of the first. When the time came for a reprint the opportunity
was taken of bringing the book up to date in this third edition. In the intervening period the
emphasis has been on preparing the ground for an experimental reactor but there have also
been significant advances in our understanding of the plasma behaviour, for example, the
wider experience of internal transport barriers, the appreciation of the role of tearing modes
driven by neoclassical effects, and insights from turbulence simulations. ^'
Despite the increasing complexity of the subject it is hoped that the book will still prove
useful to those entering the subject, to specialists within tokamak research who wish to
acquire knowledge of other areas in the subject, and to those outside tokamak research who
would like to learn something of the principal concepts, methods, and problems involved.
A further aim is to provide a handbook of equations, formulas, and data which the research
worker frequently needs.
I regard it as an honour to have worked with the distinguished physicists who are my
co-authors. Their spirit of cooperation has made the endeavour a pleasure.
I am grateful to my wife Olive for her support during the time-consuming preparation
of the manuscript. I would like to thank Carol Simmons, Birgitta Croysdale, and Ingrid
Farrelly who typed the earUer editions and Lynda Lee who has been unfailingly helpful in
the preparation of this edition. I must further thank Stuart Morris who produced most of
the figures and Chad Heys who helped with the many new figures required for the present
edition. I am also grateful to Graham O'Connor for his careful reading of the text and for
the resulting corrections.
Finally, I would like to dedicate this book to my friends and colleagues in the
worldwide community of fusion physicists. They have set a splendid example of international
collaboration for others to follow.
England JOHN WESSON
July 2003

Authorship
1 J.A. WESSON
2 J.A. WESSON
2.11R.J.Hastie
3 J.A. WESSON
3.14 D.R Start ai
IB. Lloyd
4 J.W.CONNOR
4.1-^.5 J.A. Wesson
4.8 J.A. Wesson
4.11B.J.D. Tubbing
4.13 J.A. Wesson
4.23-^.25 J.A. Wesson
5 J.A. WESSON E.1-5.5)
C.N. LASHMORE-DAVIES E.6-5.10)
8 H.R. WILSON
9 G.M. McCRACKEN
10 R.D.GILL
10.2 D.J. Ward
10.3 JJ. O'Rourke
10.4 and 10.5 A.E. Costley
10.9 G.R Matthews
11 J.A. WESSON AND J. HUGILL
12 D.J. CAMPBELL
12.6 A. Herrmann
13 J.A. WESSON
13.5 D.J. Ward
6 J.A. WESSON
7 J.A. WESSON
14 J.A. WESSON
14.13 J.W Connor

Acknowledgements
The authors acknowledge the help of many colleagues and in particular as follows:
Tokamak reactor—^Roger Hancox and Terry Martin.
Potato orbits—Bill Core and Per Helander.
Current drive—Martin Cox and Martin O'Brien.
Transport barriers—Barry Alper.
Confinement—Ted Stringer and Geoff Cordey.
Neutral beam heating—Andrew Bickley, Ron Hemsworth, Peter Massmann, and Ernie
Thompson.
RF heating—Lars-Goran Eriksson, Jean Jacquinot, and Franz Soldner.
Neoclassical teanng modes—Richard Buttery and Tim Hender.
TAE modes—Sergei Sharapov.
Plasma surface interactions—Rainer Behrisch, Richard Pitts, and Peter Stangeby.
Diagnostics—Wolfgang Engelhardt, Ian Hutchinson, and George Magyar.
Tokamak experiments—Karl Heinz Finken, Martin Greenwald, Otto Gruber,
Ian Hutchinson, Louis Laurent, Niek Lopes Cardozo, Kent McCormick, William Morris,
Jerome Pamela, Chris Schiiller, Paul Smeulders, Alan Sykes, Paul Thomas, Fritz Wagner,
Henri Weisen, Gerd Wolf and Hartmut Zohm. /
ITER—George Vayakis

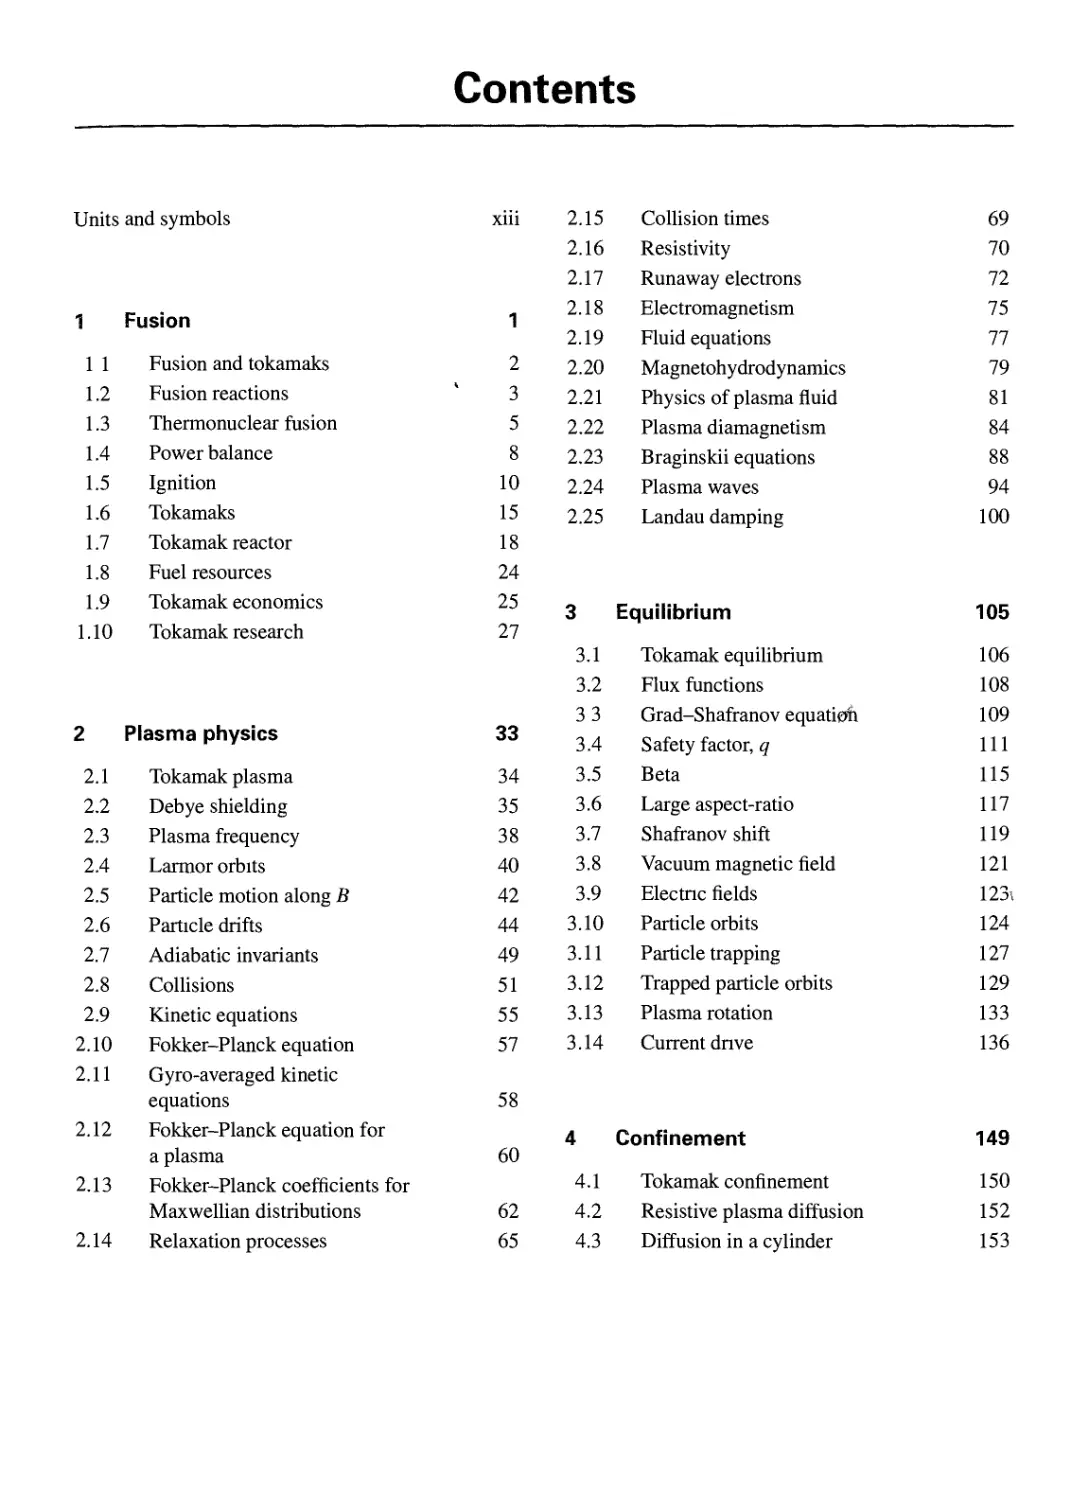
Contents
Units
1
1 1
1.2
1.3
1.4
1.5
1.6
1.7
1.8
1.9
1.10
2
2.1
2.2
2.3
2.4
2.5
2.6
2.7
2.8
2.9
2.10
2.11
2.12
2.13
2.14
and symbols
Fusion
Fusion and tokamaks
Fusion reactions
Thermonuclear fusion
Power balance
Ignition
Tokamaks
Tokamak reactor
Fuel resources
Tokamak economics
Tokamak research
Plasma physics
Tokamak plasma
Debye shielding
Plasma frequency
Larmor orbits
Particle motion along B
Particle drifts
Adiabatic invariants
Collisions
Kinetic equations
Fokker-Planck equation
Gyro-averaged kinetic
equations
Fokker-Planck equation for
a plasma
Fokker-Planck coefficients for
Maxwellian distributions
Relaxation processes
xiii
1
2
3
5
8
10
15
18
24
25
27
33
34
35
38
40
42
44
49
51
55
57
58
60
62
65
2.15
2.16
2.17
2.18
2.19
2.20
2.21
2.22
2.23
2.24
2.25
3
3.1
3.2
33
3.4
3.5
3.6
3.7
3.8
3.9
3.10
3.11
3.12
3.13
3.14
4
4.1
4.2
4.3
Collision times
Resistivity
Runaway electrons
Electromagnetism
Fluid equations
Magnetohydrodynamics
Physics of plasma fluid
Plasma diamagnetism
Braginskii equations
Plasma waves
Landau damping
Equilibrium
Tokamak equilibrium
Rux functions
Grad-Shafranov equaticrfi
Safety factor, q
Beta
Large aspect-ratio
Shafranov shift
Vacuum magnetic field
Electric fields
Particle orbits
Particle trapping
Trapped particle orbits
Plasma rotation
Current drive
Confinement
Tokamak confinement
Resistive plasma diffusion
Diffusion in a cylinder
69
70
72
75
77
79
81
84
88
94
100
105
106
108
109
111
115
117
119
121
123\
124
127
129
133
136
149
150
152
153

X
4.4
4.5
4.6
4.7
4.8
4.9
4.10
4.11
4.12
4.13
4.14
4.15
4.16
4.17
4.18
4,19
4,20
4,21
4.22
4.23
4.24
4.25
5
5.1
5.2
5.3
5.4
5.5
5.6
5.7
5.8
5.9
Contents
Pfirsch-Schliiter current
Pfirsch-Schliiter diffusion
Banana regime transport
Plateau transport
Ware pinch effect
Bootstrap current
Neoclassical resistivity
Ripple transport
Confinement modes and scaling
expressions
H-modes
Internal transport bamers
Scaling laws
Transport coefficients
Fluctuations
Turbulence-induced
transport
Radial electric field shear and
transport
Candidate modes
Turbulence simulations, critical
gradients, and temperature
pedestals
Impurity transport
Experimental discoveries
Radiation losses
Impurity radiation
Heating
Heating
Ohmic heating
Neutral beam injection
Neutral beam heating
Neutral beam production
Radio frequency heating
Physics of radio frequency
heating
Ion cyclotron resonance
heating
Lower hybrid resonance
heating
155
158
159
167
169
172
174
175
180
185
189
191
195
198
202
210
213
217
219
223
227
229
237
238
240
243
246
253
258
261
270
286
5.10
6
6.1
6.2
6.3
6.4
6.5
6.6
6.7
6.8
6.9
6.10
6.11
6.12
6.13
6.14
6.15
6.16
7
7.1
7.2
7.3
7.4
7.5
7.6
7.7
7.8
7.9
7.10
7.11
7.12
7.13
7.14
7.15
Electron cyclotron resonance
heating
Mhd stability
Mhd stability
Stability theory
Growth rates
Energy principle
Tokamak instabilities
Large aspect-ratio tokamak
Kink instability
Tearing modes
Tearing stability
Internal kink
Resistive m = 1 modes
Localized modes
Ballooning modes
Ballooning stability
Axisymmetric modes
;6 limit
Instabilities
Instabilities
Magnetic islands
Tearing modes
Mimov instabilities
Current penetration
Sawtooth oscillations
Disruptions
Causes of disruptions
Physics of disruptions
Mode locking
Error field instability
Vertical instability
Ergodicity
Fishbone instability
Toroidal Alfven
eigenmodes
290
303
304
306
307
309
311
312
313
318
324
329
332
336
337
340
342
343
351
352
354
356
362
364
365
374
376
382
390
394
396
397
399
402

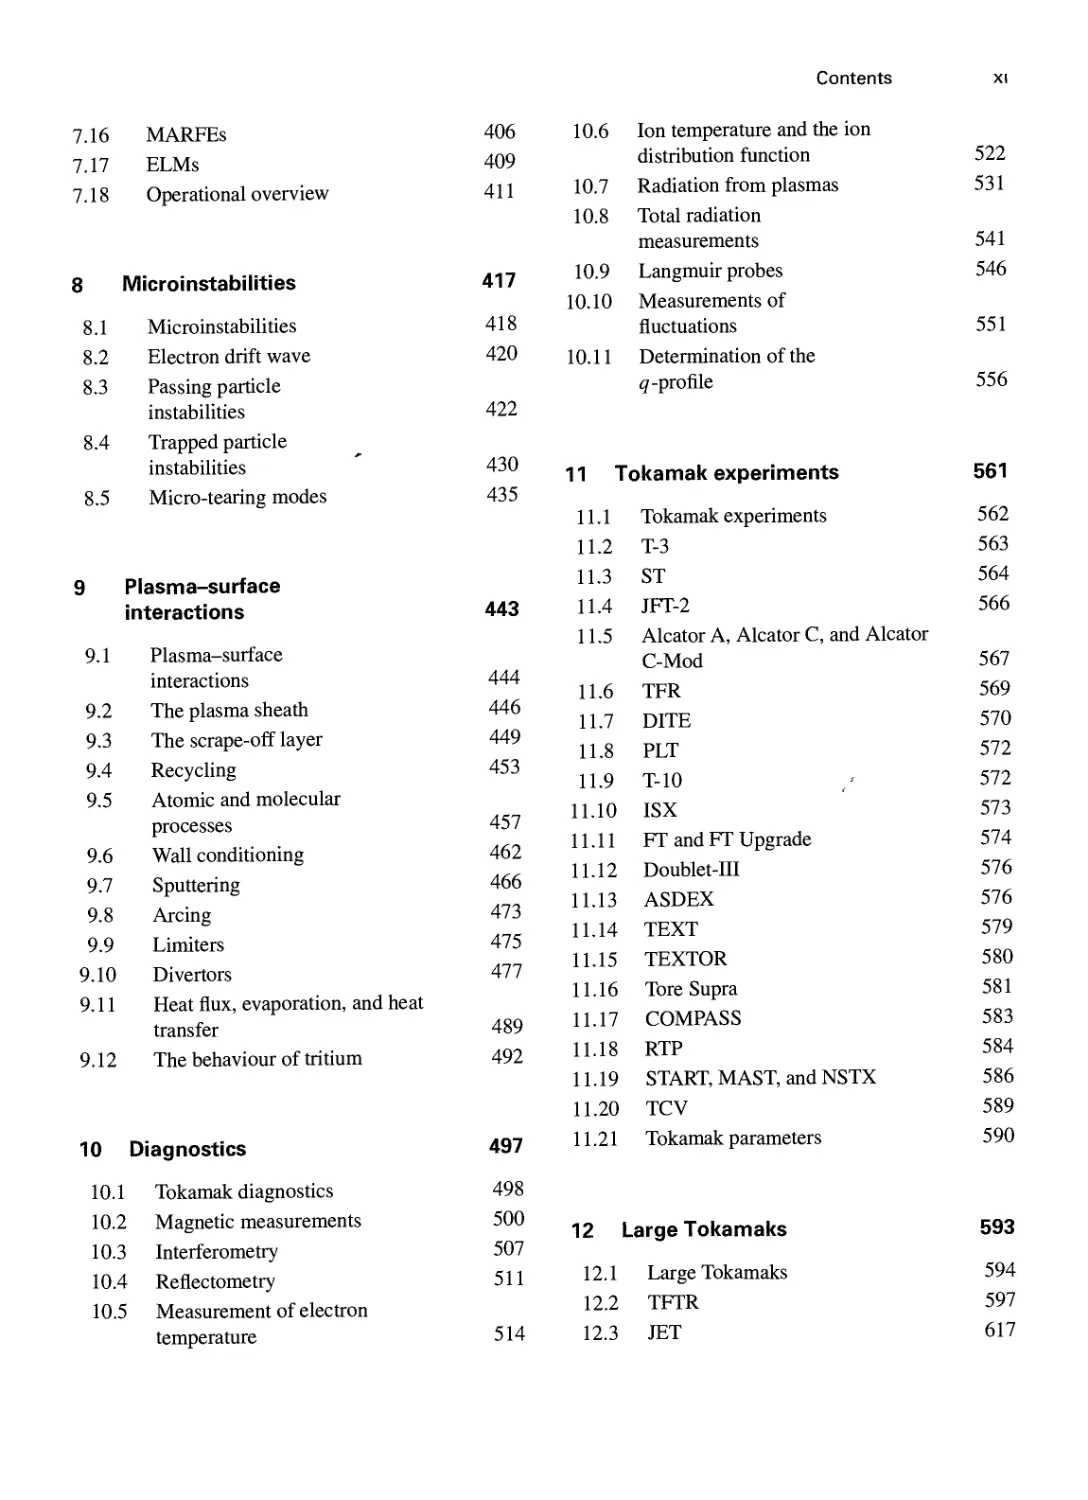
7.16
7.17
7.18
8
8.1
8.2
8.3
8.4
8.5
9
9.1
9.2
9.3
9.4
9.5
9.6
9.7
9.8
9.9
9.10
9.11
9.12
10
10.1
10.2
10.3
10.4
10.5
MARFEs
ELMs
Operational overview
Microinstabilities
Microinstabilities
Electron drift wave
Passing particle
instabilities
Trapped particle
instabilities
Micro-tearing modes
Plasma-surface
nteractions
Plasma-surface
interactions
The plasma sheath
The scrape-off layer
Recycling
Atomic and molecular
processes
Wall conditioning
Sputtering
Arcing
Limiters
Divertors
Heat flux, evaporation, and heat
transfer
The behaviour of tritium
Diagnostics
Tokamak diagnostics
Magnetic measurements
Interferometry
Reflectometry
Measurement of electron
temperature
406
409
411
417
418
420
422
430
435
443
444
446
449
453
457
462
466
473
475
477
489
492
497
498
500
507
511
514
10.6
10.7
10.8
10.9
10.10
10.11
Ion temperature and the ion
distribution function
Radiation from plasmas
Total radiation
measurements
Langmuir probes
Measurements of
fluctuations
Determination of the
(J-profile
11 Tokamai( experiments
11.1
11.2
11.3
11.4
11.5
11.6
11.7
11.8
11.9
11.10
11.11
11.12
11.13
11.14
11.15
11.16
11.17
11.18
11.19
11.20
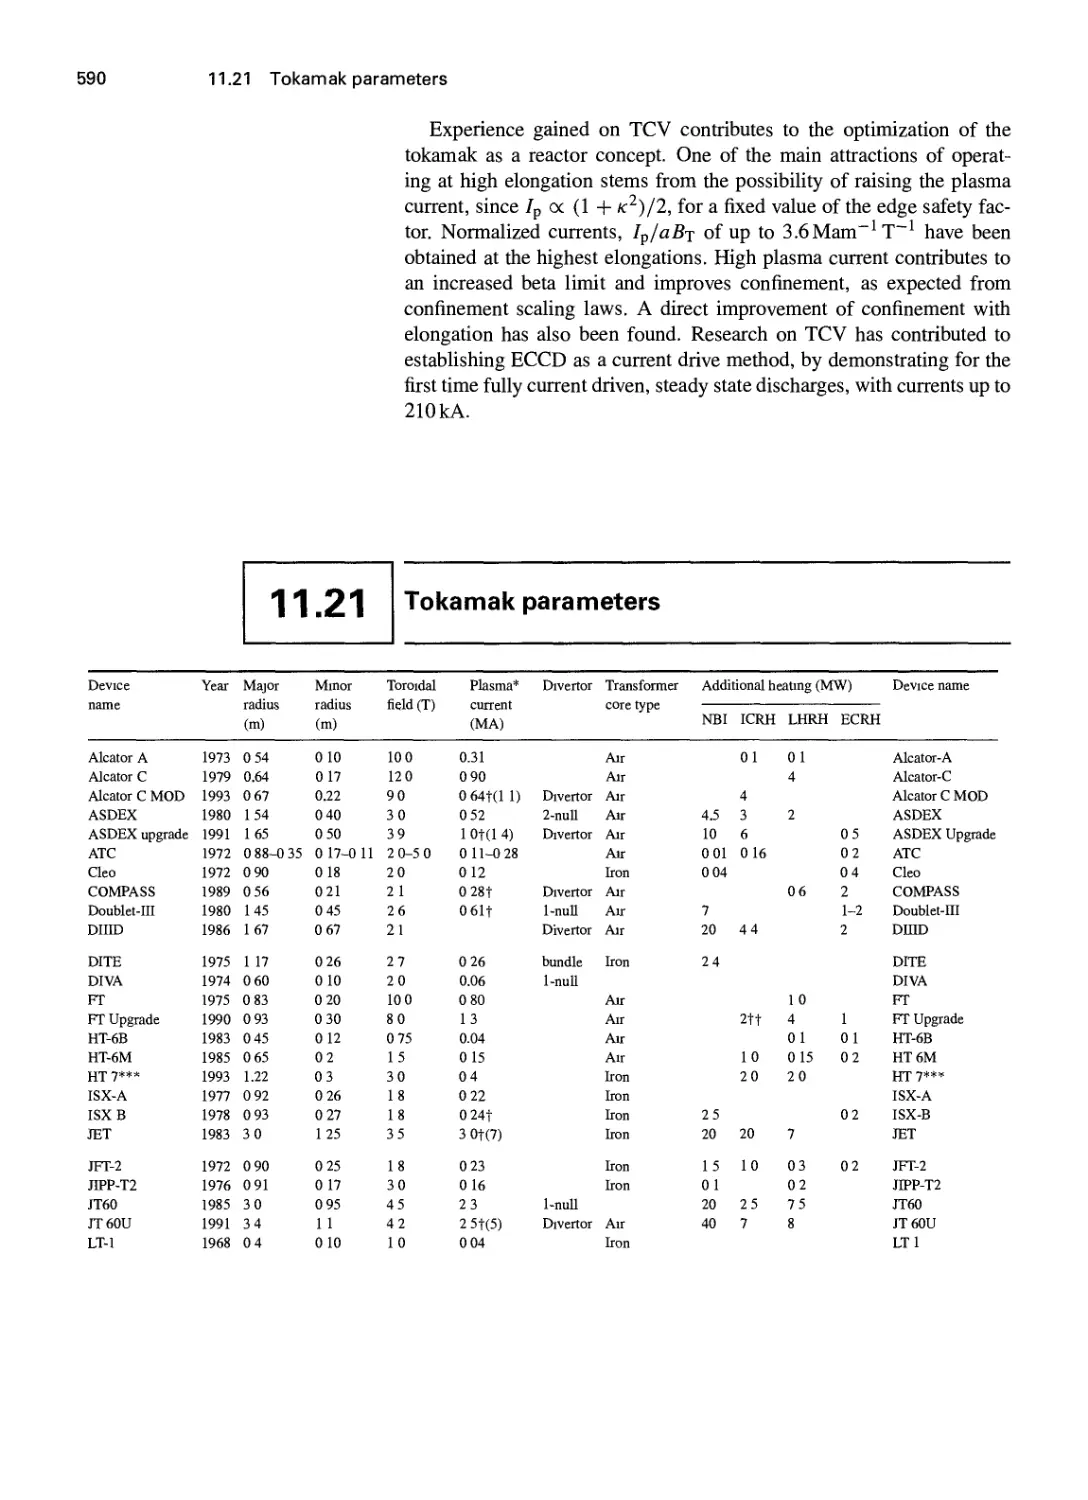
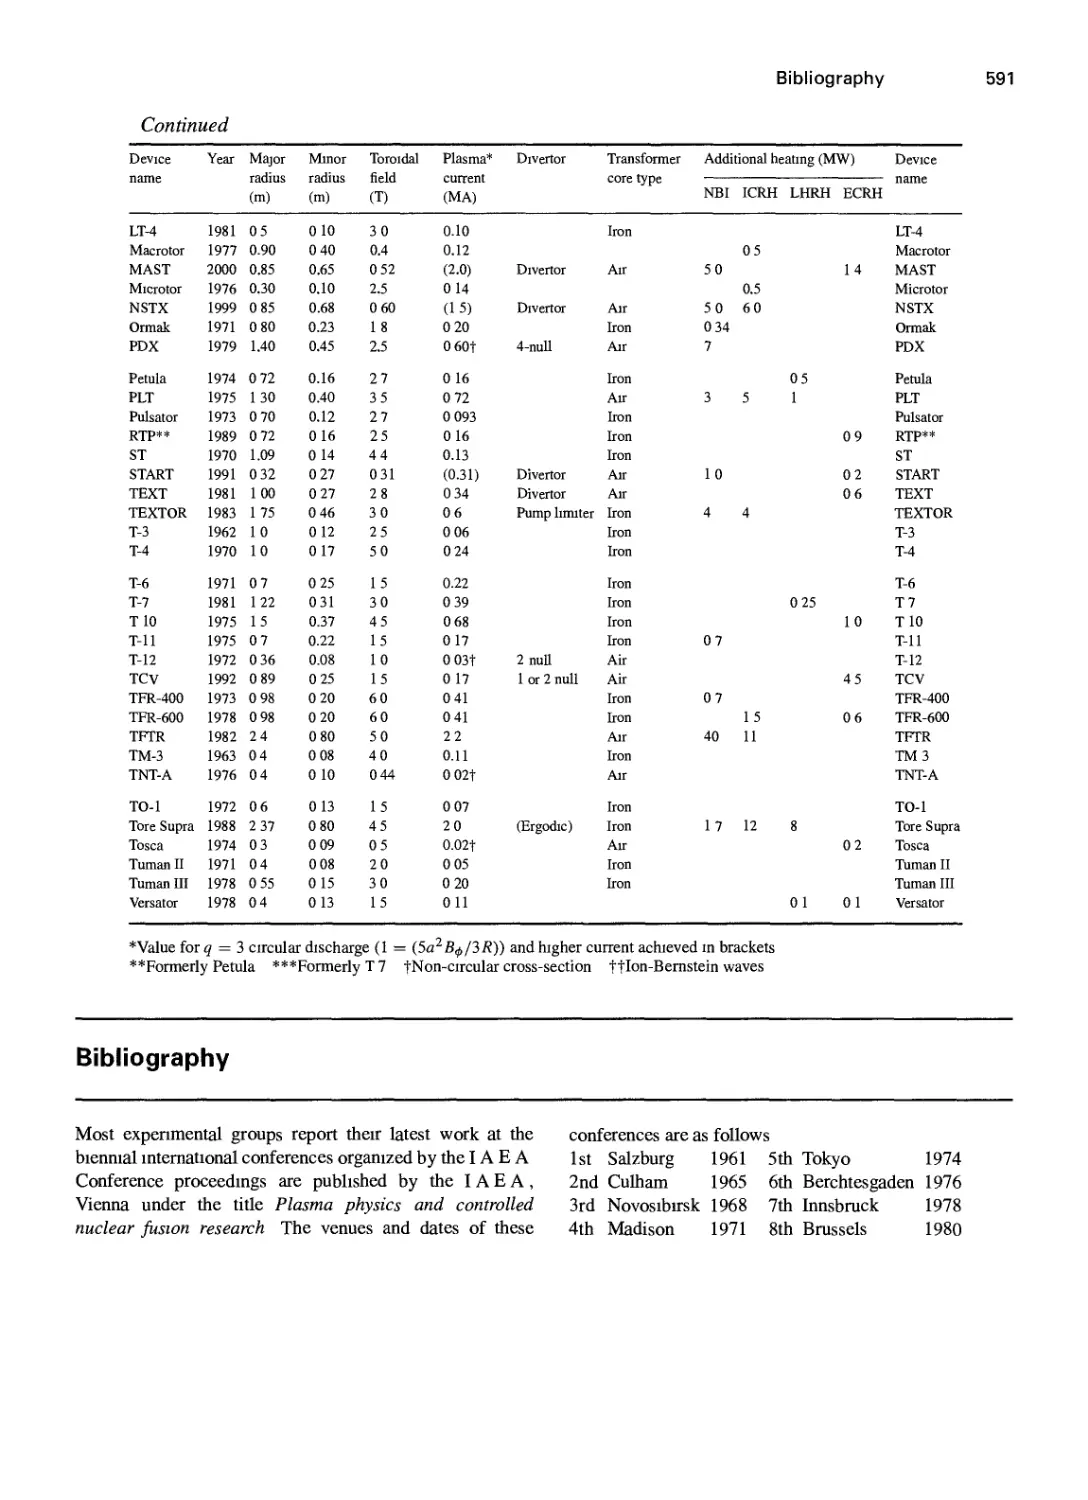
11.21
Tokamak experiments
T-3
ST
JFT-2
Alcator A, Alcator C, and Alcator
C-Mod
TFR
DITE
PLT
T-10
ISX
FT and FT Upgrade
Doublet-Ill
ASDEX
TEXT
TEXTOR
Tore Supra
COMPASS
RTP
START, MAST, and NSTX
TCV
Tokamak parameters
12 Large Tokamaks
12.1
12.2
12.3
Large Tokamaks
TFTR
JET
522
531
541
546
551
556
561
562
563
564
566
567
569
570
572
572
573
574
576
576
579
580
581
583
584
586
589
590
593
594
597
617

12.4 JT-60/JT-60U
12.5 DIII-D
12.6 ASDEX Upgrade
13 The future
13.1 Status
13.2 Strategy
13.3 Reactor requirements
13.4 ITER
13.5 Prospects
14 Appendix
14.1 Vector relations
14.2 Differential operators
645
665
687
705
706
707
708
711
718
721
722
722
14.3
14.4
14.5
14.6
14.7
14.8
14.9
14.10
14.11
14.12
14.13
14.14
14.15
14.16
Index
Units—conversions
Physical constants
Coulomb logarithm
Collision times
Lengths
Frequencies
Velocities
Resistivity
Chang-Hinton formula
forxi
Bootstrap current
Confinement scaling
relations
Plasma shape
Formulae
Symbols
724
725
725
729
731
733
734
735
737
738
740
741
742
743
745

Units and symbols
The system of units used is m.k.s. Following the convention generally accepted in the
subject, temperatures are written either in joules or in electron-volts (or keV). Thus in place
of conventional kT° (where k is Boltzmann's constant and T° is in degrees Kelvin) we
write T (joules), so that T° = T (joules)/1.381 x 10"^-'. The temperature in electron-
volts is defined by the potential difference in volts through which an electron must fall to
acquire an energy T, that is r(eV) = r(joules)/e where e is the electronic charge. Thus
r(eV) = T(joules)/1.602 x 10~^^. Whenever the temperature given is in electron-volts
this is explicitly stated.
To avoid continual redefinition of frequently used symbols a list of such symbols is given
in Section 14.16.

Fusion

1.1 Fusion and tokamaks
Fusion and tokamaks
If a nucleus of deuterium fuses with a nucleus of tritium, an a-particle
is produced and a neutron released. The nuclear rearrangement results
in a reduction in total mass and a consequent release of energy in the
form of the kinetic energy of the reaction products. The energy released
IS 17.6MeV per reaction. In macroscopic terms, just 1 kg of this fuel
would release 10^ kWh of energy and would provide the requirements of
a 1 GW (electrical) power station for a day.
Deuterium is a plentiful resource but tritium does not occur naturally.
It should, however, be possible to use the neutrons released in the fusion
reaction to breed tntium from lithium, of which there are large reserves.
In order to induce the fusion of nuclei of deuterium and tritium it is
necessary to overcome the mutual repulsion due to their positive charges,
and as a result the cross-section for fusion is small at low energies.
However, the cross-section increases with energy, reaching a maximum at
100 keV, and a positive energy balance is possible if the fuel particles
can be made to react before they lose their energy. To achieve this the
particles must retain their energy and remain in the reacting region for a
sufficient time More precisely the product of this time and the density of
reacting particles must be sufficiently large
The simple schemes of firing a beam of particles into a solid target
or through another beam fail to satisfy this criterion. In the first case the
particles lose their energy too rapidly and in the second the density is
too low.
The most promising method of supplying the energy is to heat the
deutenum-tritium fuel to a sufficiently high temperature that the thermal
velocities of the nuclei are high enough to produce the required
reactions. Fusion brought about in this way is called thermonuclear fusion.
The optimum temperature is not as high as that corresponding to the
energy of maximum cross-section because the required reactions occur
in the high energy tail of the Maxwellian distribution of heated particles.
The necessary temperature is around lOkeV, that is about 100 million
degrees centigrade. At such temperatures the fuel is fully ionized. The
electrostatic charge of the nuclear ions is neutralized by the presence of an
equal number of electrons and the resulting neutral gas is called a plasma.
Since such high temperatures preclude confinement by material walls
another method of confinement is needed. The tokamak offers such a
method In a tokamak the plasma particles are confined to a toroidal
region by a magnetic field, being held by the field in small gyrating
orbits. It IS possible by this means to arrange that ions travel a distance a
million times the dimensions of the vessel before reaching the wall.
Although the required temperature, density and confinement time have
all been obtained in tokamaks, they have not been achieved in the same

1.2 Fusion reactions
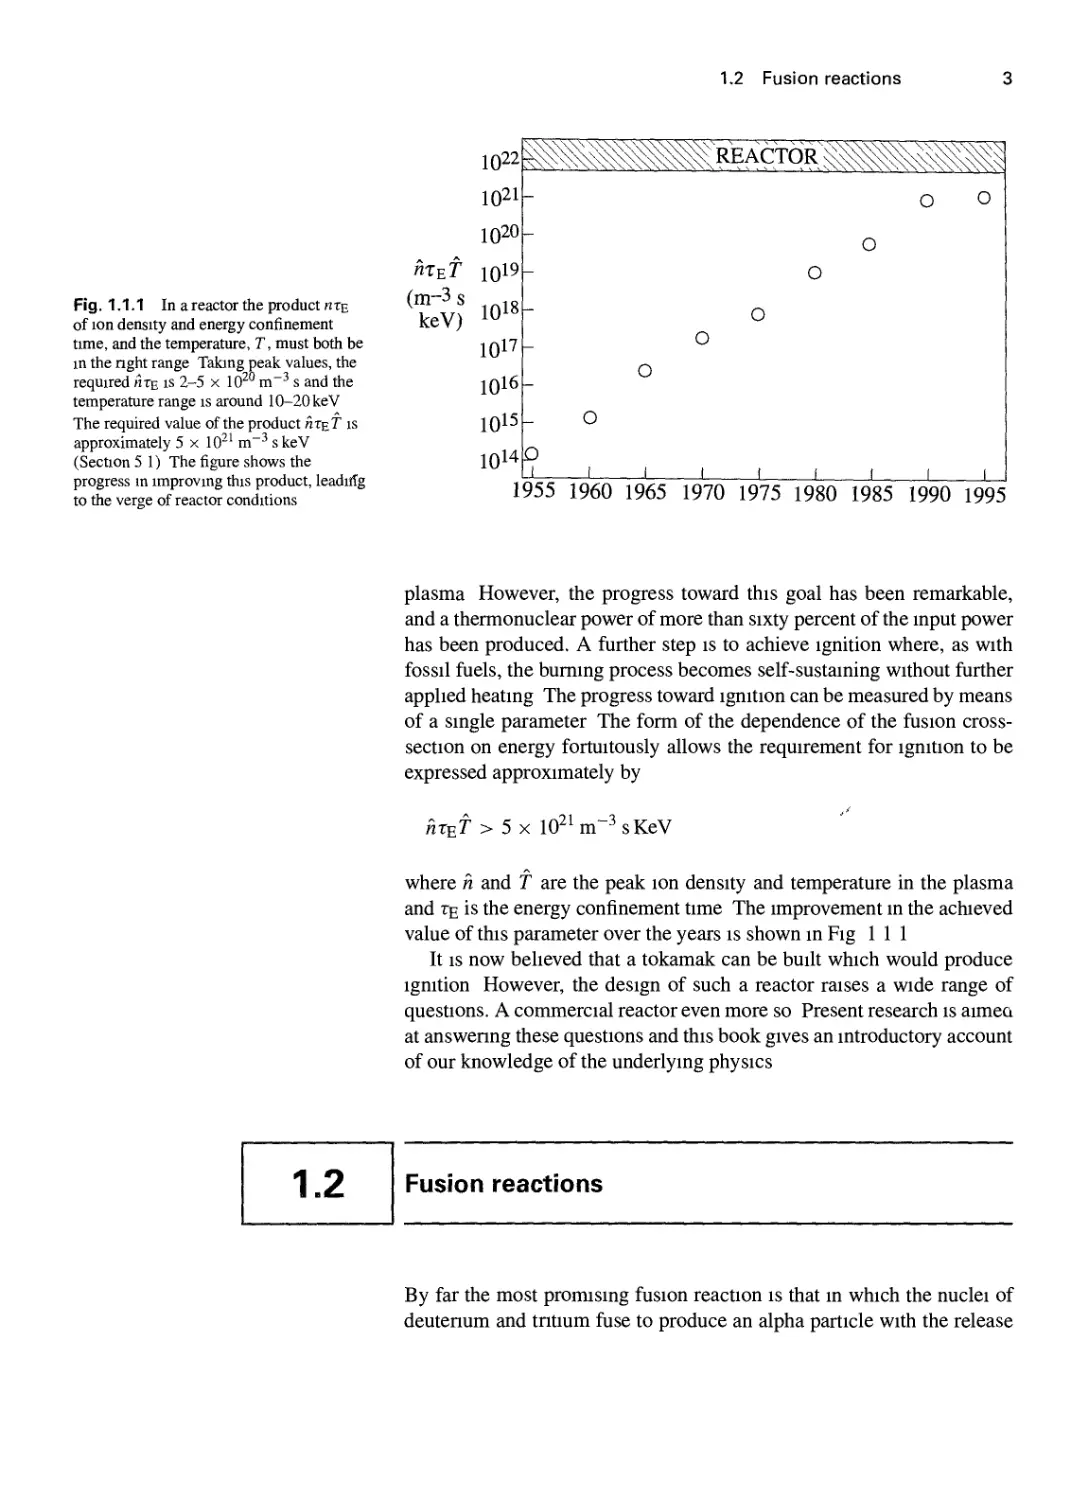
Fig. 1.1.1 In a reactor the product «te
of ion density and energy confinement
time, and the temperature, T, must both be
in the nght range Taking peak values, the
required hte is 2-5 x 10^° m'^ s and the
temperature range is around 10-20keV
The required value of the product Hte f is
approximately 5 x 10-' m~^ s keV
(Section 5 1) The figure shows the
progress in improving this product, leadirfg
to the verge of reactor conditions
1022
1021
1020
hz^f 1019
^^"^^ inl8
keV) 10
1017
1016
1015
'x^
-
-
1014^
^\^
o
1
^^^^MReactor^M^M-^^M.^
o o
o
o
o
o
o
1 1 1 1 1 1 1
1955 I960 1965 1970 1975 1980 1985 1990 1995
plasma However, the progress toward this goal has been remarkable,
and a thermonuclear power of more than sixty percent of the input power
has been produced. A further step is to achieve ignition where, as with
fossil fuels, the burning process becomes self-sustaining without further
applied heating The progress toward ignition can be measured by means
of a single parameter The form of the dependence of the fusion cross-
section on energy fortuitously allows the requirement for ignition to be
expressed approximately by
wtEr >5x 10^1 m-^sKeV
where h and f are the peak ion density and temperature in the plasma
and te is the energy confinement time The improvement in the achieved
value of this parameter over the years is shown in Fig 111
It IS now believed that a tokamak can be built which would produce
Ignition However, the design of such a reactor raises a wide range of
questions, A commercial reactor even more so Present research is aimea
at answering these questions and this book gives an introductory account
of our knowledge of the underlying physics
Fusion reactions
By far the most promising fusion reaction is that in which the nuclei of
deuterium and tntium fuse to produce an alpha particle with the release

1 2 Fusion reactions
of a neutron, that is
iD^ + iT^^iHe^ + on'
I I
3 5MeV + 14 1 MeV = 17 6MeV
where the energies given are the kinetic energies of the reaction products
The mass-energy balance follows from the overall mass deficit Sm in the
reaction
B-0 000994)mp
C-0 006284)mp
a
D-0 027404)mp
(l + 0 001378)mp
where nip is the mass of the proton A.6726
IS 0.018 75mp, and so the energy
= Sm
10-2^ kg). The mass deficit
0 018 75mpc2 = 2.818 X 10~'^ joules = 17 59 MeV
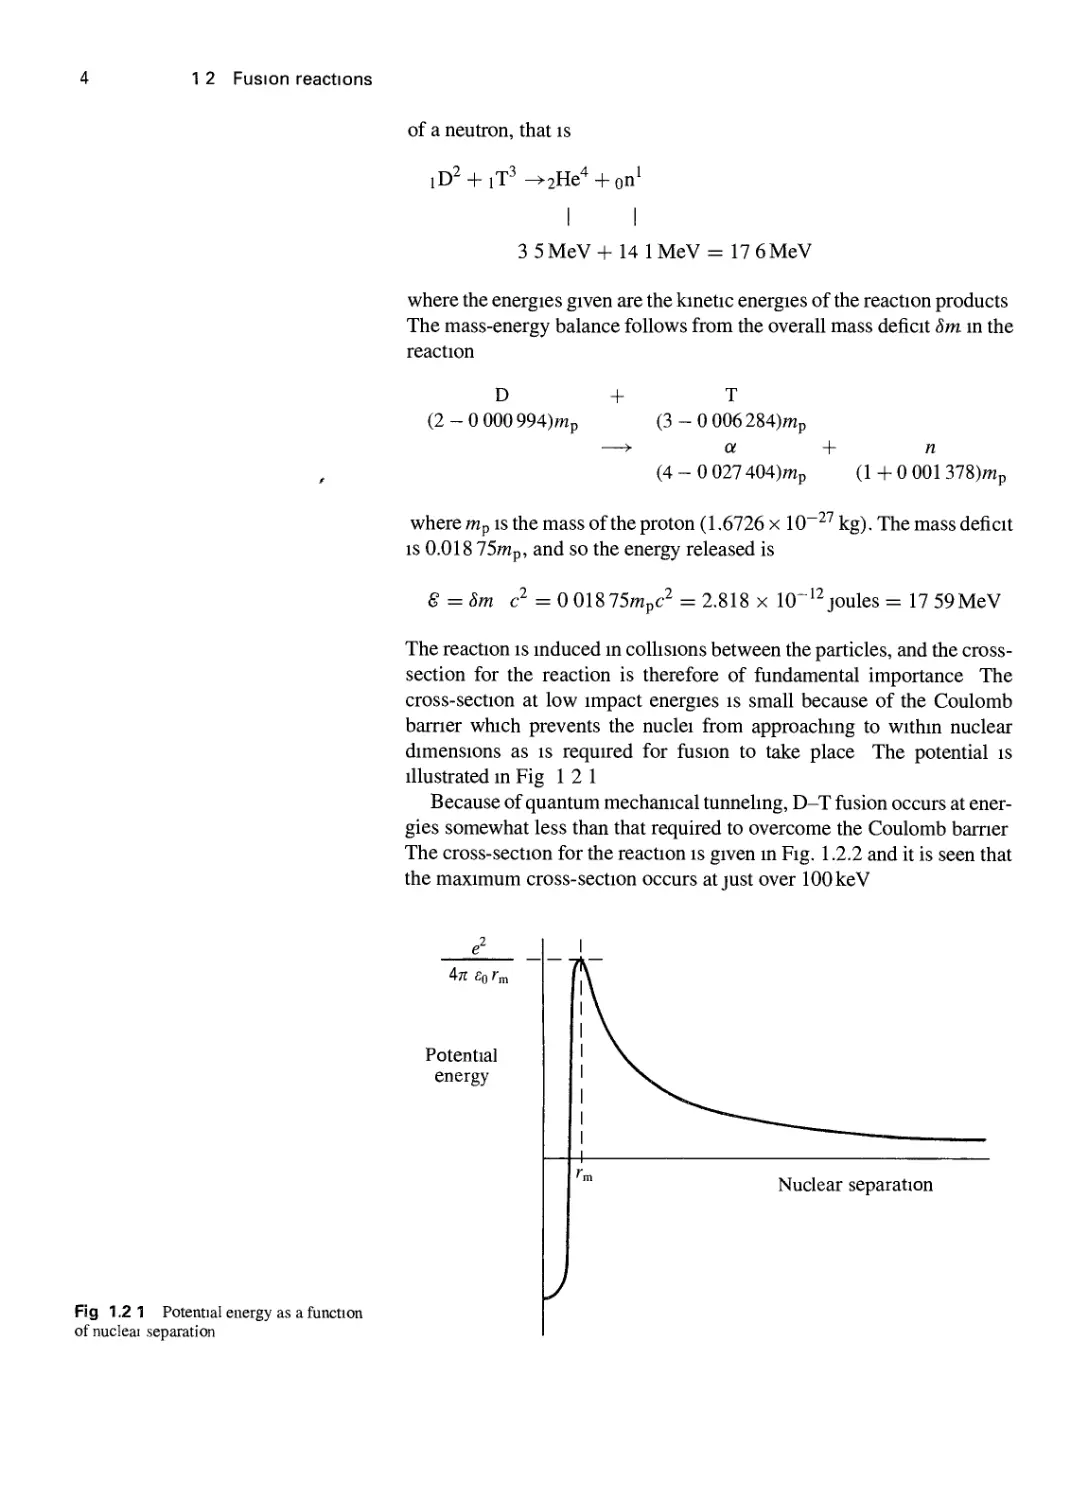
The reaction is induced in collisions between the particles, and the cross-
section for the reaction is therefore of fundamental importance The
cross-section at low impact energies is small because of the Coulomb
bamer which prevents the nuclei from approaching to within nuclear
dimensions as is required for fusion to take place The potential is
illustrated in Fig 12 1
Because of quantum mechanical tunneling, D-T fusion occurs at
energies somewhat less than that required to overcome the Coulomb bamer
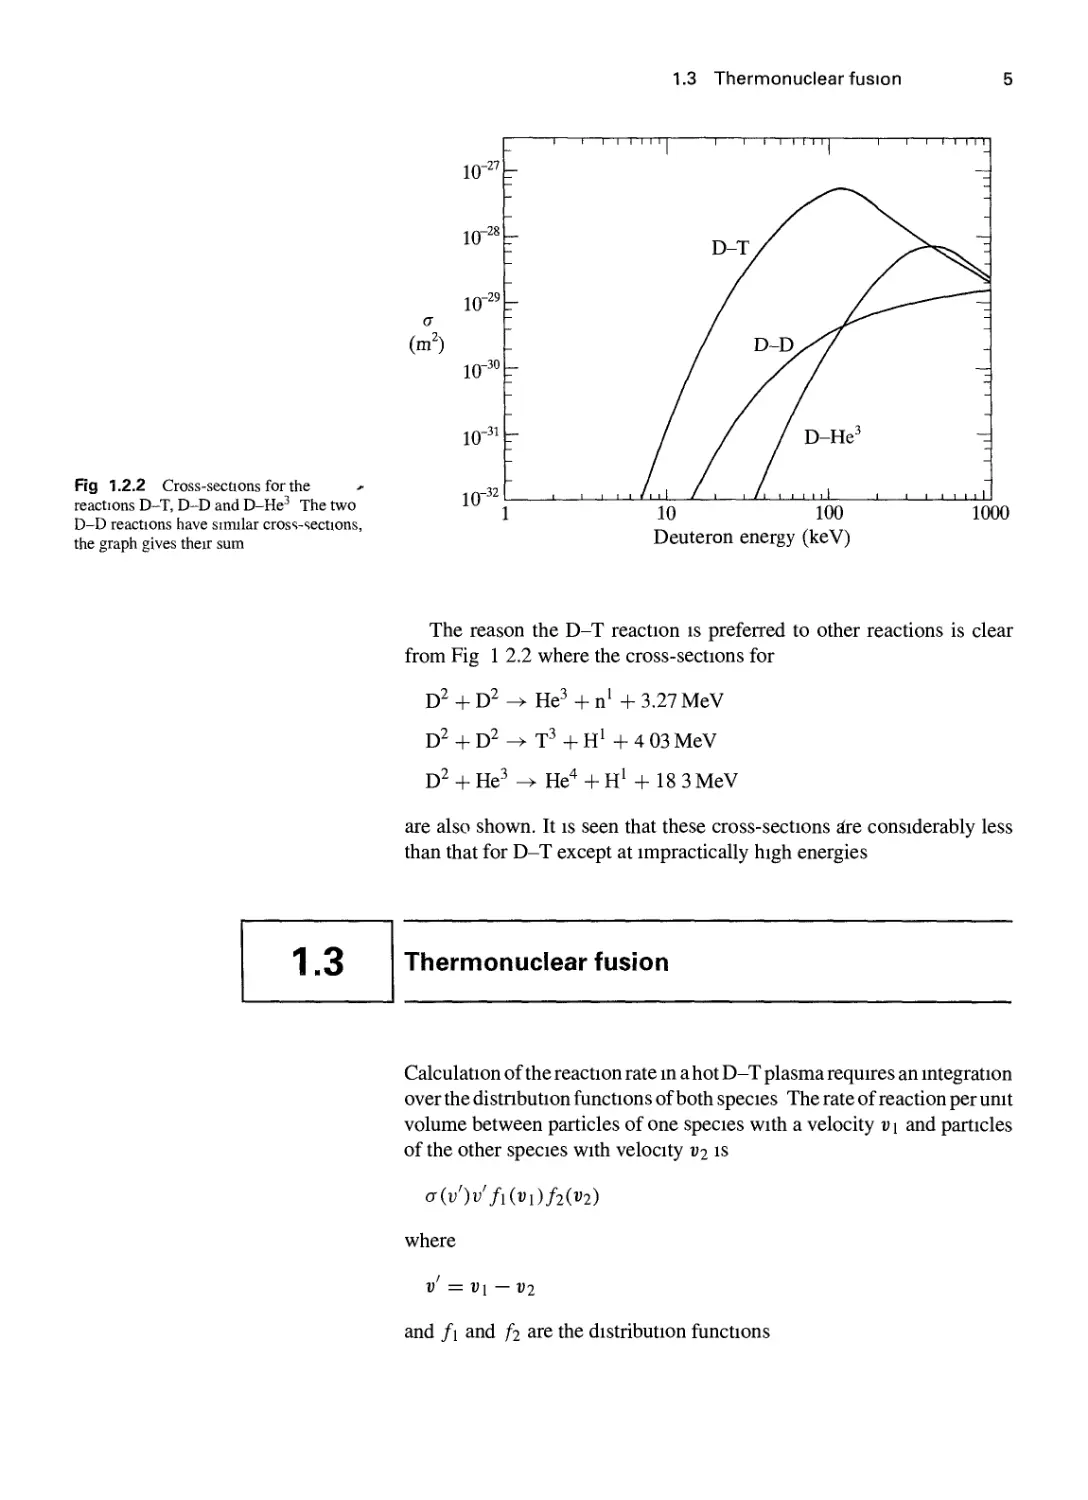
The cross-section for the reaction is given in Fig. 1.2.2 and it is seen that
the maximum cross-section occurs at just over 100 keV
Potential
energy
Fig 1.2 1 Potential energy as a function
of nucleai separation

1.3 Thermonuclear fusion
Fig 1.2.2 Cross-sections for the
reactions D-T, D-D and D-He^ The two
D-D reactions have similar cross-sections,
the graph gives their sum
10 100 1000
Deuteron energy (keV)
The reason the D-T reaction is preferred to other reactions is clear
from Fig 1 2.2 where the cross-sections for
d2 + D^ ^ He^ + n' + 3.27 MeV
D^ + D^ ^ T^ + H' + 4 03 MeV
D^ + He^ -^ He^ + H' + 18 3MeV
are also shown. It is seen that these cross-sections ^e considerably less
than that for D-T except at impractically high energies
1.3
Thermonuclear fusion
Calculation of the reaction rate in a hot D-T plasma requires an integration
over the distribution functions of both species The rate of reaction per unit
volume between particles of one species with a velocity v i and particles
of the other species with velocity vj is
<yiv')v'Mvi)f2iv2)
where
and /i and /i are the distribution functions

1.3 Thermonuclear fusion
If the distributions are Maxwellian,
//".) = ".(^)
3/2 mjV
exp-
IZl
2tcT) ^ 27 '
the total reaction rate per unit volume
may be written
-ih
/x being the reduced mass
The integral over V is B7tT/{mi + mi))^/^ so that
/ a \3/2 /• , ,3 / uv'^\ ,
3i=4nnin2[^j / ct(i;')i;''exp I —^ J du' 13.1
The cross-sections measured in laboratory expenments are usually
given in terms of the energy of the bombarding particle, say type 1,
that IS
so that eqn 1.3 1 may be more conveniently written
^ = © n,n2{^Y'-^Jais)s..p[
If the cross-section cr(s) for D-T reactions given in Section 1 2 is
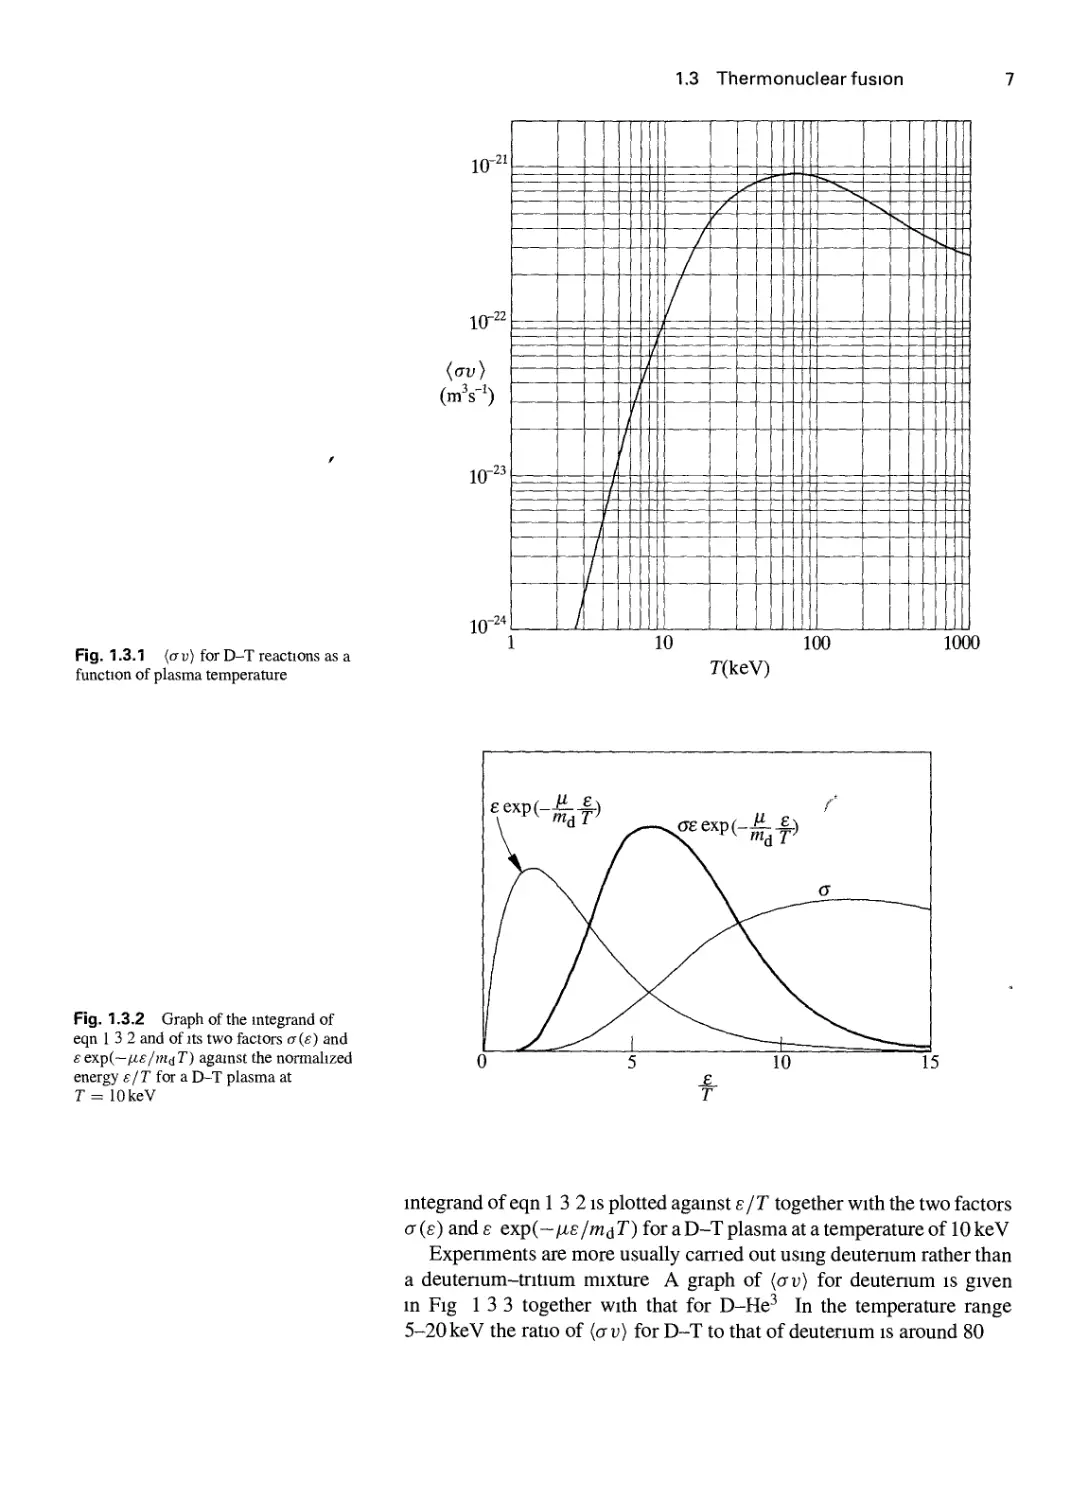
substituted into the integral of eqn 1 3 1, the reaction rate ^ = ndni{av) is
obtained where {av) is given in Fig 1.3 1. For a given ion density the
maximum rate is achieved for n^ = n^
At temperatures of interest the nuclear reactions come predominantly
from the tail of the distribution This is illustrated in Fig 13 2 where the

1.3 Thermonuclear fusion
jO-21
i=zd
/
-444/ilL--
U
/
TIT
/
/
-r-
III
-^
N rnii
rnm
Fig. 1.3.1 {(Tu)forD-T
function of plasma temperature
T(keV)
Fig. 1.3.2 Graph of the integrand of
eqn 1 3 2 and of its two factors a(e) and
£ exp(—/^£/»iciT) against the normahzed
energy e/T for a D-T plasma at
r= lOkeV
integrand of eqn 1 3 2 is plotted against s/T together with the two factors
cr(e) ands exp(~ns/mdT) for a D-T plasma at a temperature of 10 keV
Experiments are more usually carried out using deuterium rather than
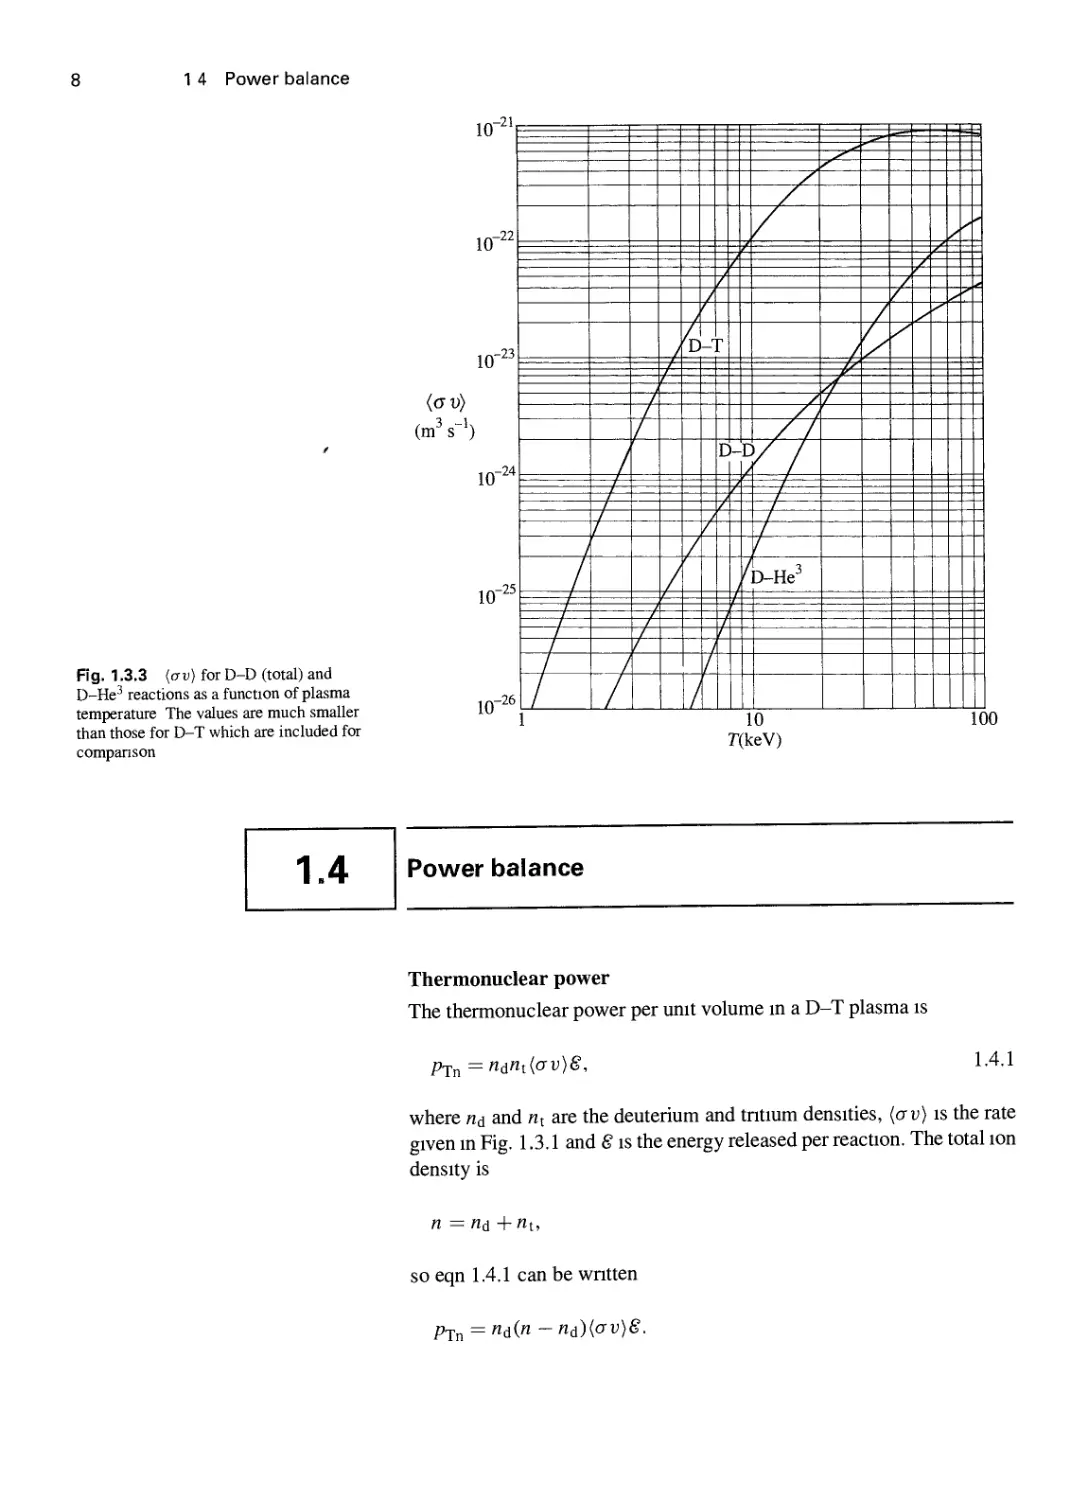
a deutenum-tritium mixture A graph of (ctu) for deuterium is given
in Fig 13 3 together with that for D-He^ In the temperature range
5-20 keV the ratio of (ctu) for D-T to that of deutenum is around 80

1 4 Power balance
Fig. 1.3.3 {av) for D-D (total) and
D-He-' reactions as a function of plasma
temperature The values are much smaller
than those for D-T which are included for
companson
(OV)
/
/
/
\T
\a
4)-T
^
Jr
/.
p-DV /
K
/
/
M
J/o-He^
/
/J
I u^
/ Kr
A\\\\
1.4
Power balance
Thermonuclear power
The thermonuclear power per unit volume in a D-T plasma is
p-Pj^ = n£jnt(CTi))fi', 1.4.1
where «d and «t are the deuterium and tntium densities, (ctu) is the rate
given in Fig. 1.3.1 and g is the energy released per reaction. The total ion
density is
so eqn 1.4.1 can be wntten
PTn = «d(« -ni){av)8.

1.4 Power balance
For a given «this power IS maximized by «d = 5^, that is equal deuterium
and tritium densities. For this optimum mixture the thermonuclear power
density is
Pj^ = \n^{crv)8. 1.4.2
Energy loss
In a tokamak there is a continuous loss of energy from the plasma which
has to be replenished by plasma heating. The average energy of plasma
particles at a temperature T is |r, comprised of jT per degree of
freedom. Since there is an equal number of electrons and ions, the plasma
energy per unit volume is3nT. The total energy in the plasma is therefore
W= j3nTd^x
= 3nTV, 1.4.3
where the bar represents the average value, and V is the plasma volume.
The rate of energy loss, Pl, is characterized by an energy confinement
time defined by the relation
W
In present tokamaks the thermonuclear power is j.i^ually small and in
steady state the energy loss is balanced by externally supplied heating.
Thus if the power supplied is Ph ,
Pu = Pl 1.4 5
and eqns 1.4.4 and 1.4.5 give
This expression provides a means of determining te from experimentally
known quantities.
a-particle heating
The thermonuclear power given by eqnl 4.2 consists of two parts Four
fifths of the reaction energy is carried by the neutrons and the remainder,
8a, IS earned by the a-particles. The neutrons leave the plasma
without interaction but the a-particles, being charged, are confined by the
magnetic field. The a-particles then transfer their 3 5 MeV energy to the

plasma through collisions. Thus the a-particle heating per unit volume is
p„ = ^n^{av)8a 1.4.6
and the total a-particle heating is
Pa= Pa d^JC
= i«2(CTi;)g„V. 1.4.7
Power balance
In the overall power balance the power loss is balanced by the externally
supplied power plus the a-particle power That is
and using eqns 1.4.3, 1.4.4, and 1.4.7 this balance is given by
Ph + ln^{crv)SaV = -^V. 1.4.8
The implications of this equation are described in the next section.
1.5
Ignition
Ignition condition
As a D-T plasma is heated to thermonuclear conditions the a-particle
heating provides an increasing fraction of the total heating. When
adequate confinement conditions are provided, a point is reached where
the plasma temperature can be maintained against the energy losses solely
by a-particle heating. The applied heating can then be removed and the
plasma temperature is sustained by internal heating. By analogy with the
burning of fossil fuels this event is called ignition.
The power balance is described by eqn 1.4.8 and, taking constant
density and temperature for simplicity, this can be written
PH=(^-^^(Mg„)v.
1.5.1
Equation 1.5.1 provides the condition for ignition, the requirement for
the plasma bum to be self-sustaining being
The nght-hand side of inequality 1.5.2 is a function of temperature only
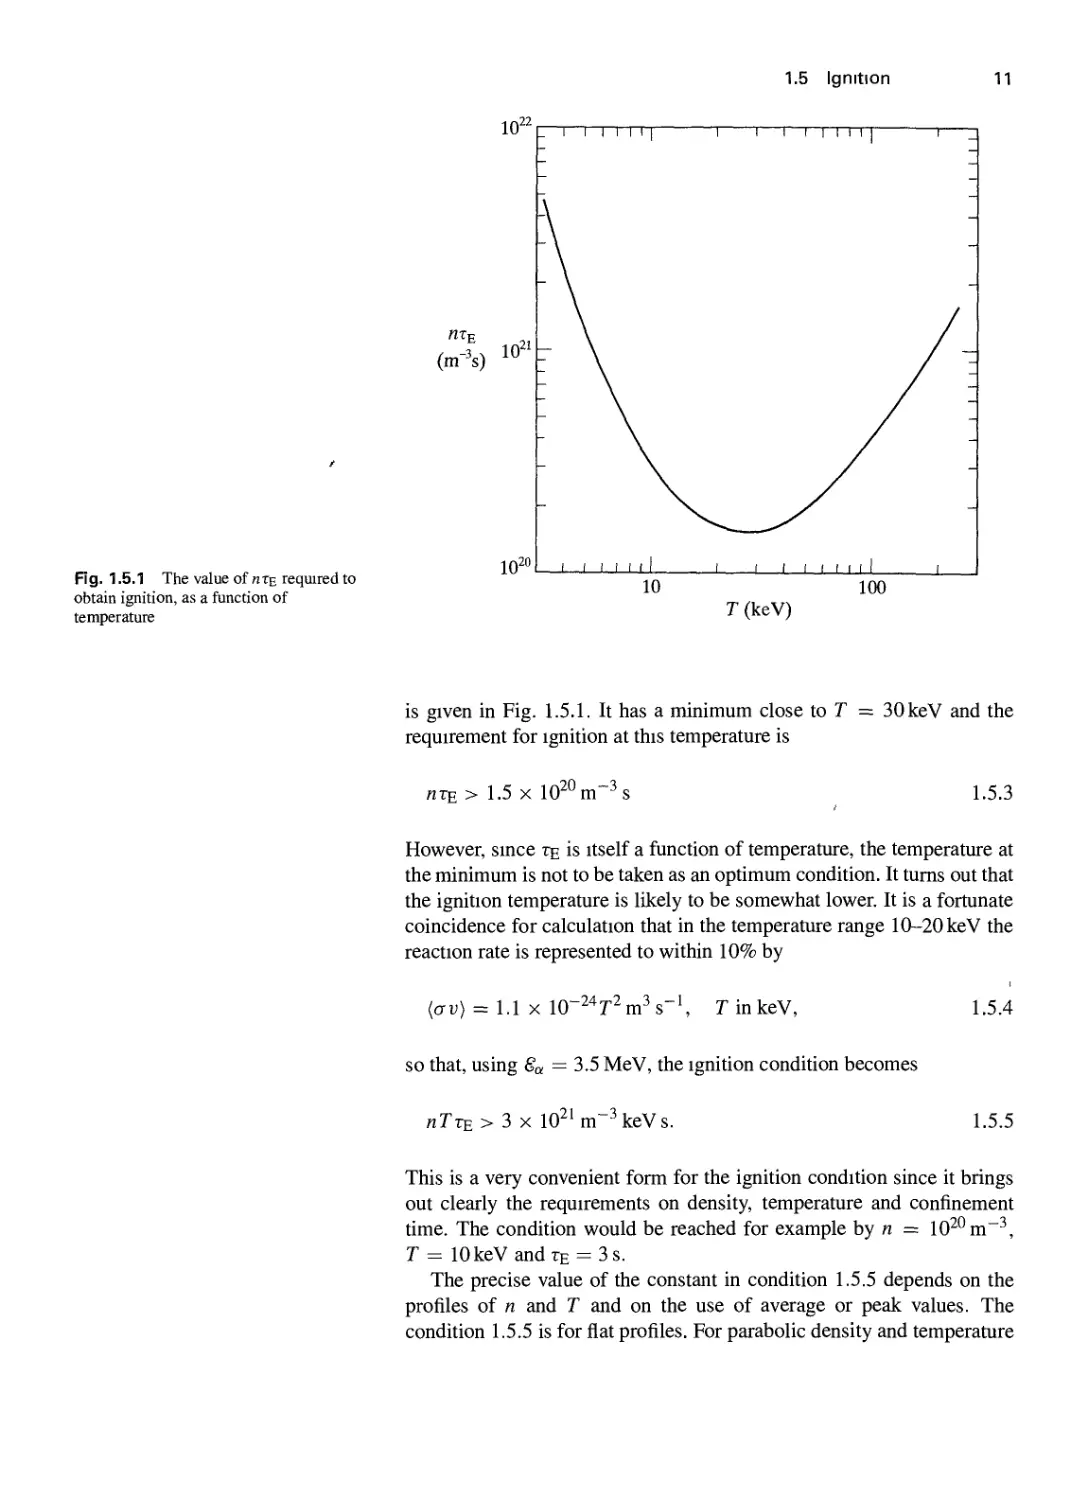
and a graph of the temperature dependence of the required value of «te

Fig. 1.5.1 The value of iite required tc
obtain ignition, as a function of
temperature
(m'h)
is given in Fig. 1.5.1. It has a minimum close to T = 30keV and the
requirement for ignition at this temperature is
«TE> 1.5 X lO^^m-
1.5.3
However, since te is itself a function of temperature, the temperature at
the minimum is not to be taken as an optimum condition. It turns out that
the ignition temperature is likely to be somewhat lower. It is a fortunate
coincidence for calculation that in the temperature range 10-20keV the
reaction rate is represented to within 10% by
{av) = 1.1 X IQ-^^T^m^s
T in keV,
1.5.4
0 that, using 6a = 3.5 MeV, the ignition condition becomes
nTTE> 3 X 10^'m~^keVs,
1.5.5
This is a very convenient form for the ignition condition since it brings
out clearly the requirements on density, temperature and confinement
time. The condition would be reached for example hy n = 10^^ m"^,
r = 10keVandTE = 3s.
The precise value of the constant in condition 1.5.5 depends on the
profiles of n and T and on the use of average or peak values. The
condition 1.5.5 is for flat profiles. For parabolic density and temperature

profiles the ignition requirement on the peak value is
«fTE >5 X lO^'m^^keVs. 1.5.6
Relation 1.5.3 is reminiscent of the Lawson criterion. In the early days of
fusion research Lawson identified the product of density and confinement
time, nr, as a. critical parameter for a thermonuclear reactor. However,
in his calculation he neglected a-particle heating and assumed that the
plasma was heated from an external source. It is then clearly a necessary,
but not sufficient, requirement that the power produced by the reactor,
after the inefficiencies of transforming to electrical power, should be
able to supply the applied heating. In the ignition calculation described
above only the a-particle fraction, 20%, of the total energy is used to heat
the plasma. In Lawson's calculation the corresponding factor is related to
the power station efficiency, rj, with rj ~ 30%. Thus Lawson's necessary
ni turns out to be somewhat less stringent than the ignition criterion 1.5.3,
requiring «T > 0.6 x lO^^m^^s. Lawson also took account of hydrogen
bremsstrahlung radiation but, as will be shown in Section 4.24, this loss
is small for a tokamak plasma.
A measure of the success in approaching reactor conditions is given by
the ratio, Q, of the thermonuclear power produced to the heating power
supplied, that is
\nHav)8V
Since the energy 8 released in each reaction is five times the a-particle
energy 6a, Q may also be written
Thus Q = I corresponds to an a-particle power which is 20% of the
applied heating power. At ignition, where Pu is reduced to zero, Q —S' oo.
It is seen that although an ignited plasma has the desirable feature that
no applied heating is required, it is quite possible to obtain a large Q
without ignition. However, in this case the supplied power /^ is a cost
on the system in that it involves recycling some of the reactor power with
a corresponding loss of efficiency.
Approach to ignition
The approach to ignition can be described by adding the time dependence
toeqn 1.5.1. This gives
dt V 4 ' ' TE{n,T)
If the heating power is increased slowly the solution of eqn 1.5.7 consists
of a sequence of quasi-steady states for which the terms on the right-
hand side balance to give zero. The result depends on the density and

Fig. 1.5.2 a-particle heating and power
loss from the plasma for constant
confinement time, and ignition at lOkeV
The lower graph shows the applied heating
required to balance the excess of power
loss over a-particle heating and sustain a
steady temperature
Hg. 1.5.3 (a) Contours of power needed
to maintain a steady state in the (n, T)
plane. The shaded region corresponds to
the ignited plasma and within this region
the contours give the excess of a-particle
heating over energy losses (b) A two
dimensional graph giving the shape of
P(n, T) corresponding to the ci
Fig (a)
temperature dependence of the confinement time which is uncertain in
the regime of interest.
The general type of behaviour expected is illustrated in Fig. 1.5.2.
This gives the temperature dependence of the a-particle heating and loss
terms together with the required power, for a constant confinement time
and ignition at lOkeV. It is seen that in this case the maximum applied
power is required at about 5 keV and this power is then less than 40% of
the a-particle power at the ignition temperature. ^r
A more general view of the approach to ignition is obtained by
considenng the power balance in the {n,T) plane. Using eqn 1.5.1 it
IS possible to plot contours of equal values of P required to maintain a
given temperature at a given density. Uncertainty over te(«, T) prevents
the drawing of a precise diagram but Fig. 1.5.3(a) illustrates the general
form expected. Figure 1.5.3(b) gives the same information in the form of
a two dimensional graph P(«, T). It is seen that the trajectory to ignition
requiring minimum power is one which goes over the saddle point. This
saddle is often called the Cordey pass.
At Ignition the applied heating can be switched off and there is an
equilibrium between the a-particle heating and the power lost from the
plasma. However, for the case shown in Fig. 1.5.2 this equilibrium is
unstable. A small increase in temperature leads to a positive imbalance
of heating over losses and this enhances the temperature increase.
This instability can be analysed for the more general situation in which
TE IS taken to be a function of temperature and the density is kept constant.
Thus taking the time dependent heating eqn 1.5.7 with Ph = 0,
te(T)
-r?{av)8a.

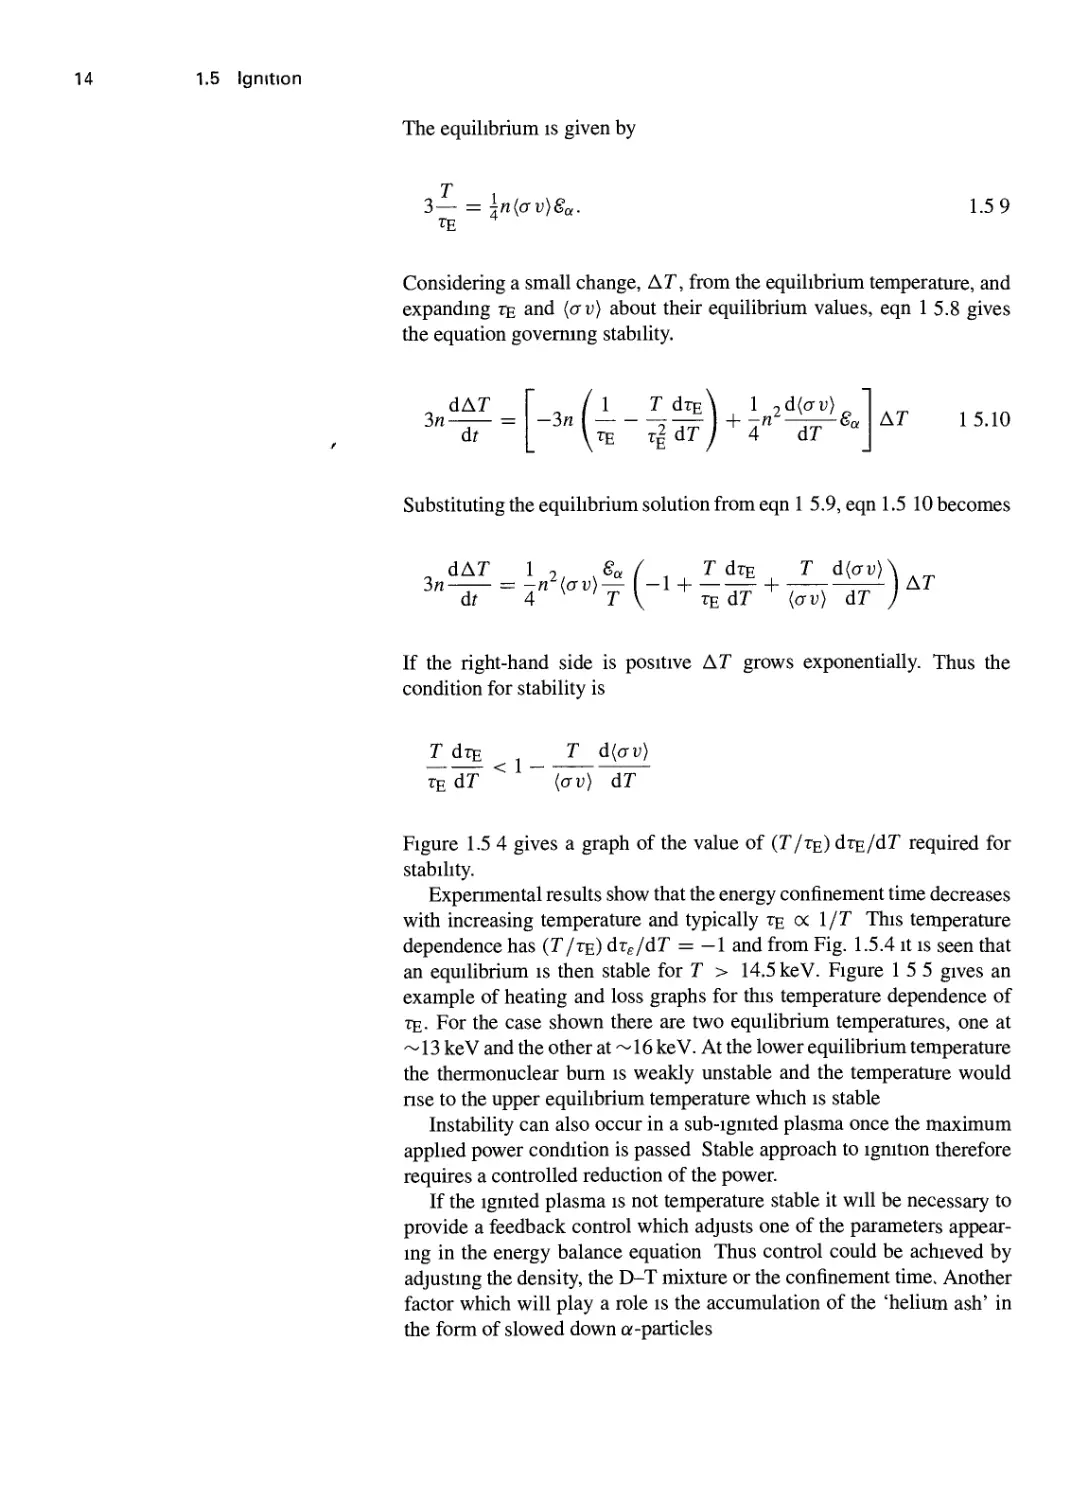
The equilibrium is given by
3- = |n(ai;>e„.
Considering a small change, AT, from the equilibrium temperature, and
expanding te and (ctu) about their equilibrium values, eqn 1 5.8 gives
the equation governing stability.
dAT
-in—--.
( 1 T Ate\ 1 ,d(CTi;> 1
Substituting the equilibrium solution from eqn 1 5.9, eqn 1.5 10 becomes
dAT I . 8, ( T Ate T d(ai;)^
If the right-hand side is positive AT grows exponentially. Thus the
condition for stability is
r dT£ T d(CTU>
^~Af ^ ~Jav) dT
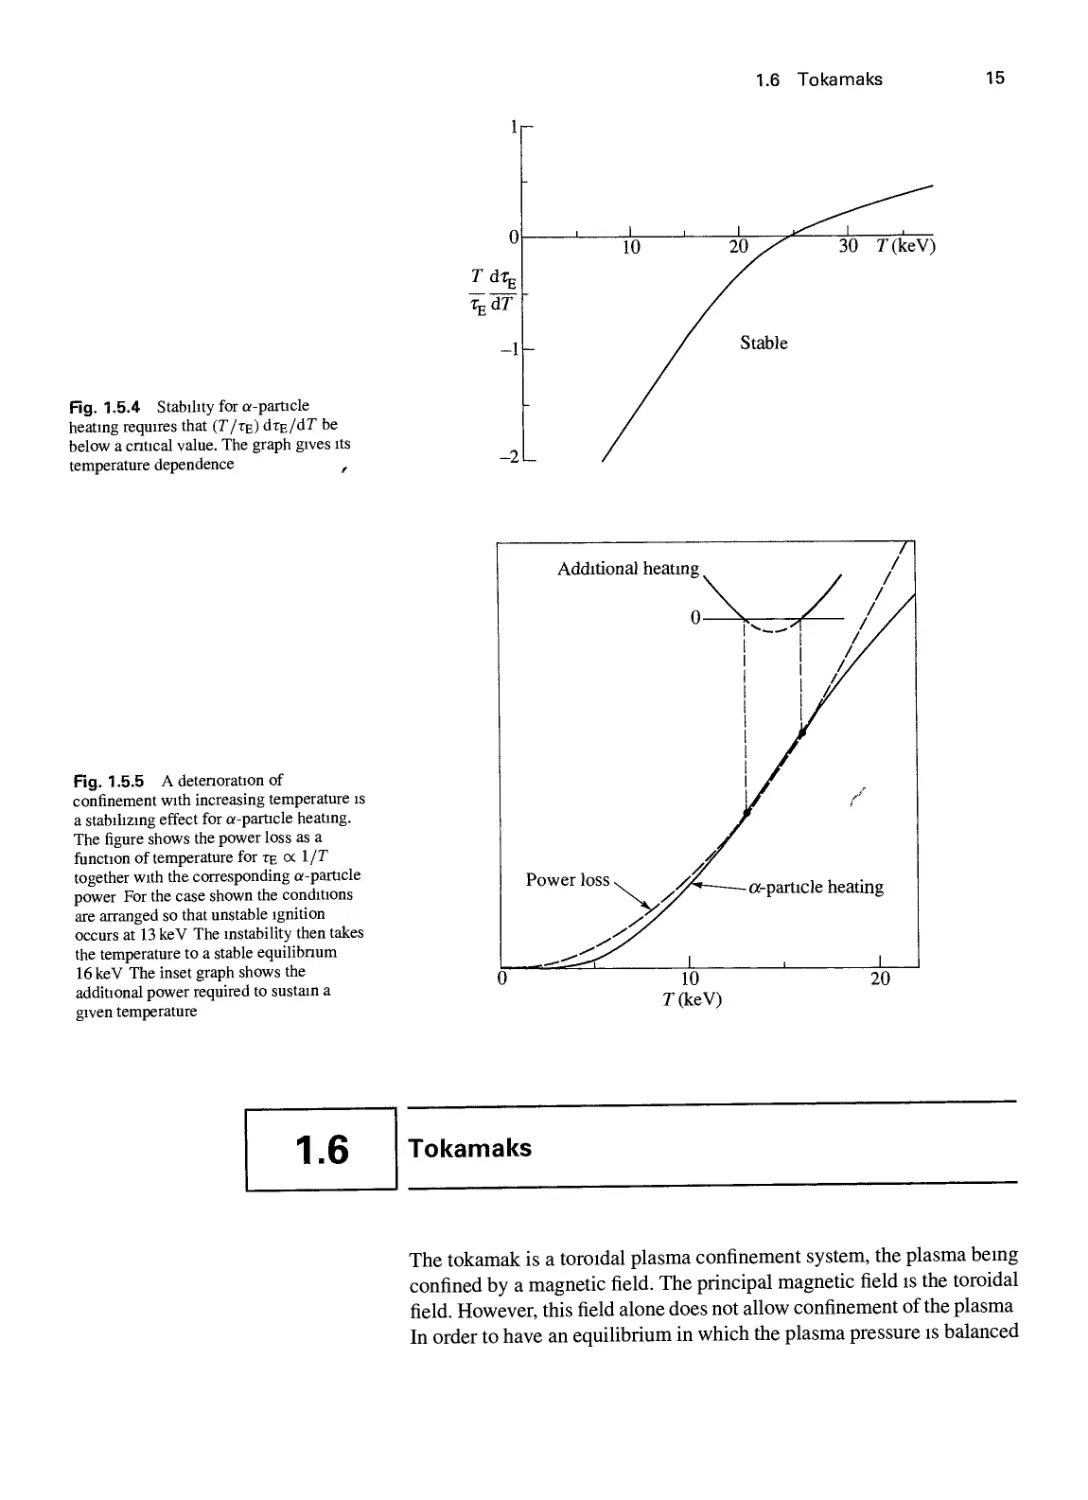
Figure 1.5 4 gives a graph of the value of (T/te) diE/dT required for
stability.
Experimental results show that the energy confinement time decreases
with increasing temperature and typically te oc l/T This temperature
dependence has (T/te) dxg/dT = -1 and from Fig. 1.5.4 it is seen that
an equilibrium is then stable for T > 14.5 keV. Figure 1 5 5 gives an
example of heating and loss graphs for this temperature dependence of
TE. For the case shown there are two equilibrium temperatures, one at
~13 keV and the other at ~16 keV. At the lower equilibrium temperature
the thermonuclear bum is weakly unstable and the temperature would
rise to the upper equilibrium temperature which is stable
Instability can also occur in a sub-ignited plasma once the maximum
applied power condition is passed Stable approach to ignition therefore
requires a controlled reduction of the power.
If the Ignited plasma is not temperature stable it will be necessary to
provide a feedback control which adjusts one of the parameters
appearing in the energy balance equation Thus control could be achieved by
adjusting the density, the D-T mixture or the confinement time. Another
factor which will play a role is the accumulation of the 'helium ash' in
the form of slowed down a-particles

1.6 Tokamaks 15
Hg. 1.5.4 Stability for a-particle
heating requires that (T/xe) dTe/dr be
below a cntical value. The graph gives its
temperature dependence ,
1
-1
-2
-
10
lOy^
^ Stable
30 r(keV)
Fig. 1.5.5 A detenoration of
confinement with increasing temperature is
a stabihzing effect for a-particle heating.
The figure shows the power loss as a
function of temperature for te oc 1/T
together with the corresponding a-particle
power For the case shown the conditions
are arranged so that unstable ignition
occurs at 13 keV The instability then takes
the temperature to a stable equilibnum
16 keV The inset graph shows the
additional power required to sustain a
given temperature
Additional heating ^
0-
Power loss ^ A
Tokamaks
The tokamak is a toroidal plasma confinement system, the plasma being
confined by a magnetic field. The principal magnetic field is the toroidal
field. However, this field alone does not allow confinement of the plasma
In order to have an equilibrium in which the plasma pressure is b

1.6 Tokamaks
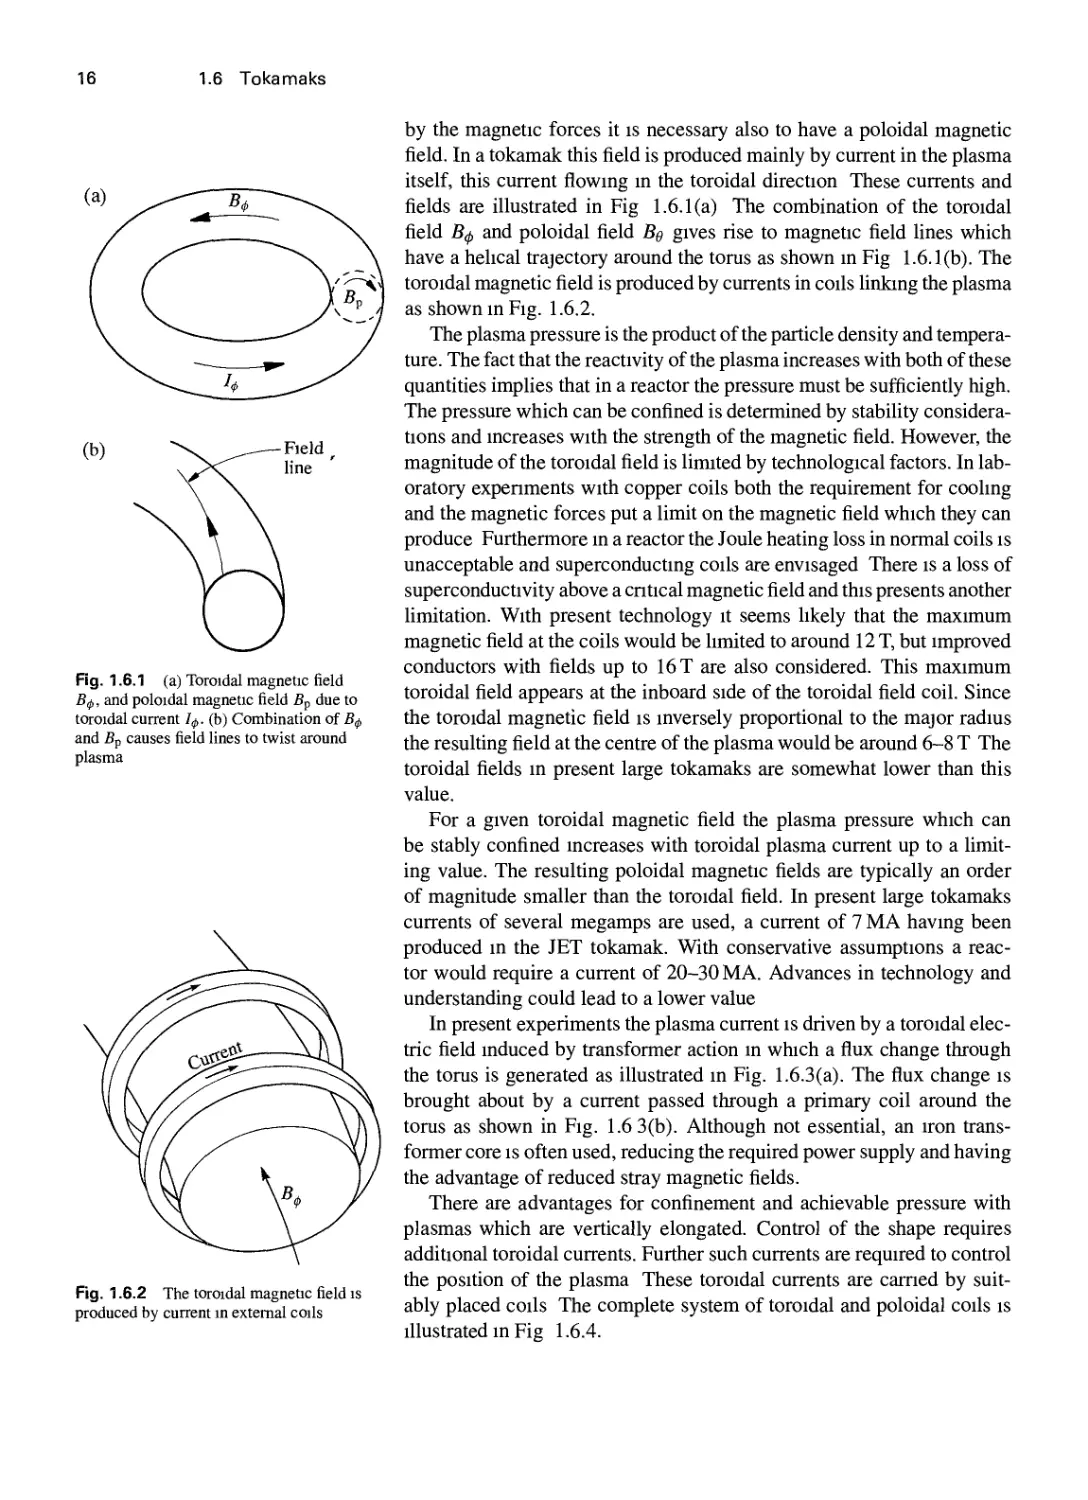
Fig. 1.6.1 (a) Toroidal magnetic field
B^, and poloidal magnetic field Bp due to
toroidal current 1^. (b) Combination of B^
and Bp causes field lines to twist around
plasma
Fig. 1.6.2 The toroidal magnetic field is
produced by current in external coils
by the magnetic forces it is necessary also to have a poloidal magnetic
field. In a tokamak this field is produced mainly by current in the plasma
itself, this current flowing in the toroidal direction These currents and
fields are illustrated in Fig 1.6.1(a) The combination of the toroidal
field fi0 and poloidal field Be gives rise to magnetic field lines which
have a helical trajectory around the torus as shown in Fig 1.6.1(b). The
toroidal magnetic field is produced by currents in coils linking the plasma
as shown in Fig. 1.6.2.
The plasma pressure is the product of the particle density and
temperature. The fact that the reactivity of the plasma increases with both of these
quantities implies that in a reactor the pressure must be sufficiently high.
The pressure which can be confined is determined by stability
considerations and increases with the strength of the magnetic field. However, the
magnitude of the toroidal field is limited by technological factors. In
laboratory experiments with copper coils both the requirement for cooling
and the magnetic forces put a limit on the magnetic field which they can
produce Furthermore in a reactor the Joule heating loss in normal coils is
unacceptable and superconducting coils are envisaged There is a loss of
superconductivity above a critical magnetic field and this presents another
limitation. With present technology it seems likely that the maximum
magnetic field at the coils would be limited to around 12 T, but improved
conductors with fields up to 16 T are also considered. This maximum
toroidal field appears at the inboard side of the toroidal field coil. Since
the toroidal magnetic field is inversely proportional to the major radius
the resulting field at the centre of the plasma would be around 6-8 T The
toroidal fields in present large tokamaks are somewhat lower than this
value.
For a given toroidal magnetic field the plasma pressure which can
be stably confined increases with toroidal plasma current up to a
limiting value. The resulting poloidal magnetic fields are typically an order
of magnitude smaller than the toroidal field. In present large tokamaks
currents of several megamps are used, a current of 7 MA having been
produced in the JET tokamak. With conservative assumptions a
reactor would require a current of 20-30 MA. Advances in technology and
understanding could lead to a lower value
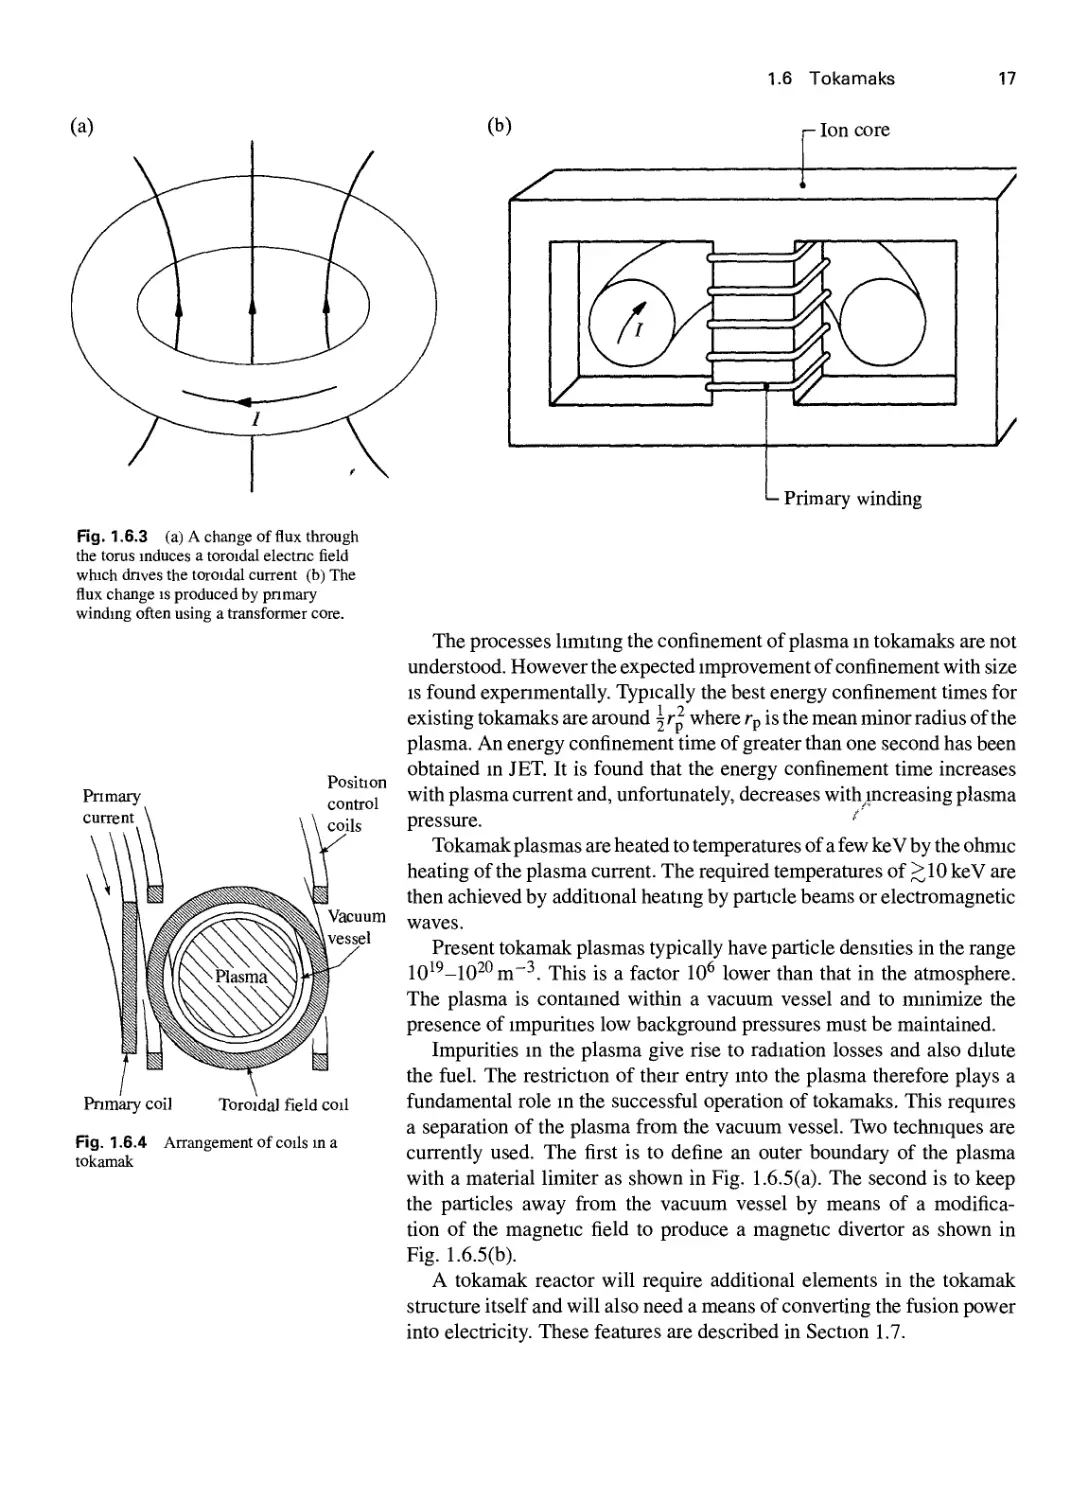
In present experiments the plasma current is driven by a toroidal
electric field induced by transformer action in which a flux change through
the torus is generated as illustrated in Fig. 1.6.3(a). The flux change is
brought about by a current passed through a primary coil around the
torus as shown in Fig. 1.6 3(b). Although not essential, an iron
transformer core IS often used, reducing the required power supply and having
the advantage of reduced stray magnetic fields.
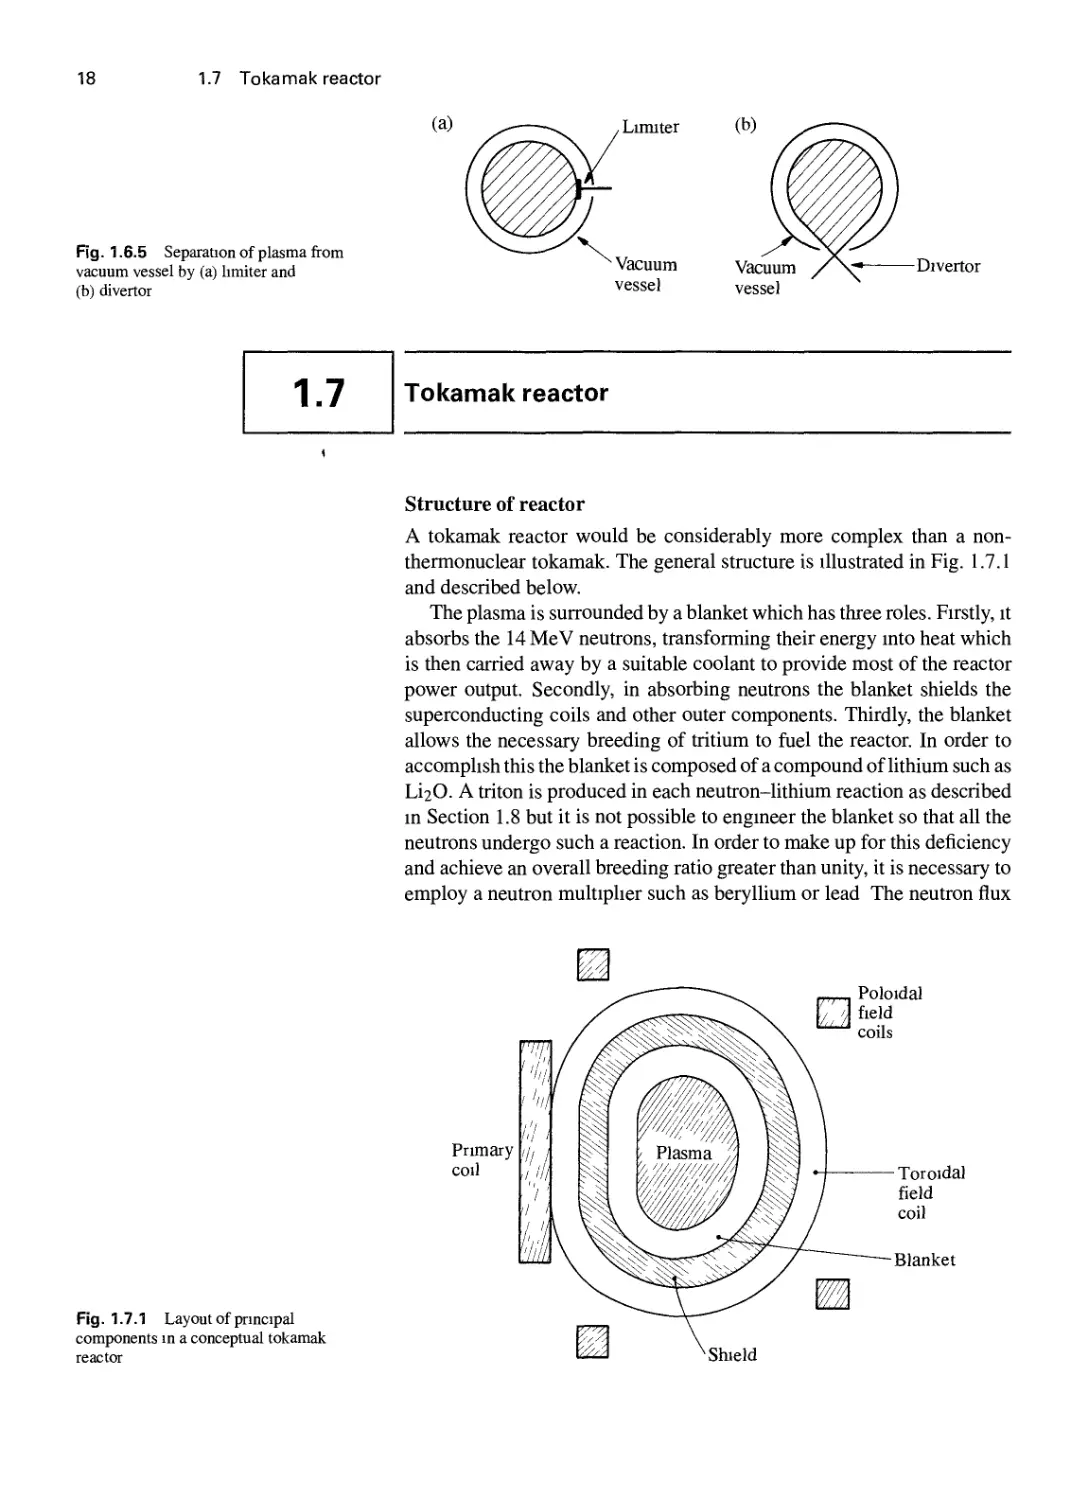
There are advantages for confinement and achievable pressure with
plasmas which are vertically elongated. Control of the shape requires
additional toroidal currents. Further such currents are required to control
the position of the plasma These toroidal currents are earned by
suitably placed coils The complete system of toroidal and poloidal coils is
illustrated in Fig 1.6.4.

Fig. 1.6.3 (a) A change of flux through
the torus induces a toroidal electnc field
which dnves the toroidal current (b) The
flux change is produced by pnmary
winding often using a transformer core.
Toroidal field coil
Primary winding
The processes limiting the confinement of plasma in tokamaks are not
understood. However the expected improvement of confinement with size
IS found experimentally. Typically the best energy confinement times for
existing tokamaks are around ^r^ where rp is the mean minor radius of the
plasma. An energy confinement time of greater than one second has been
obtained in JET. It is found that the energy confinement time increases
with plasma current and, unfortunately, decreases with^increasing plasma
pressure. ''
Tokamak plasmas are heated to temperatures of a few ke V by the ohmic
heating of the plasma current. The required temperatures of > 10 keV are
then achieved by additional heating by particle beams or electromagnetic
waves.
Present tokamak plasmas typically have particle densities in the range
10^^-10^^m~^. This is a factor 10^ lower than that in the atmosphere.
The plasma is contained within a vacuum vessel and to minimize the
presence of impurities low background pressures must be maintained.
Impurities in the plasma give rise to radiation losses and also dilute
the fuel. The restriction of their entry into the plasma therefore plays a
fundamental role in the successful operation of tokamaks. This requires
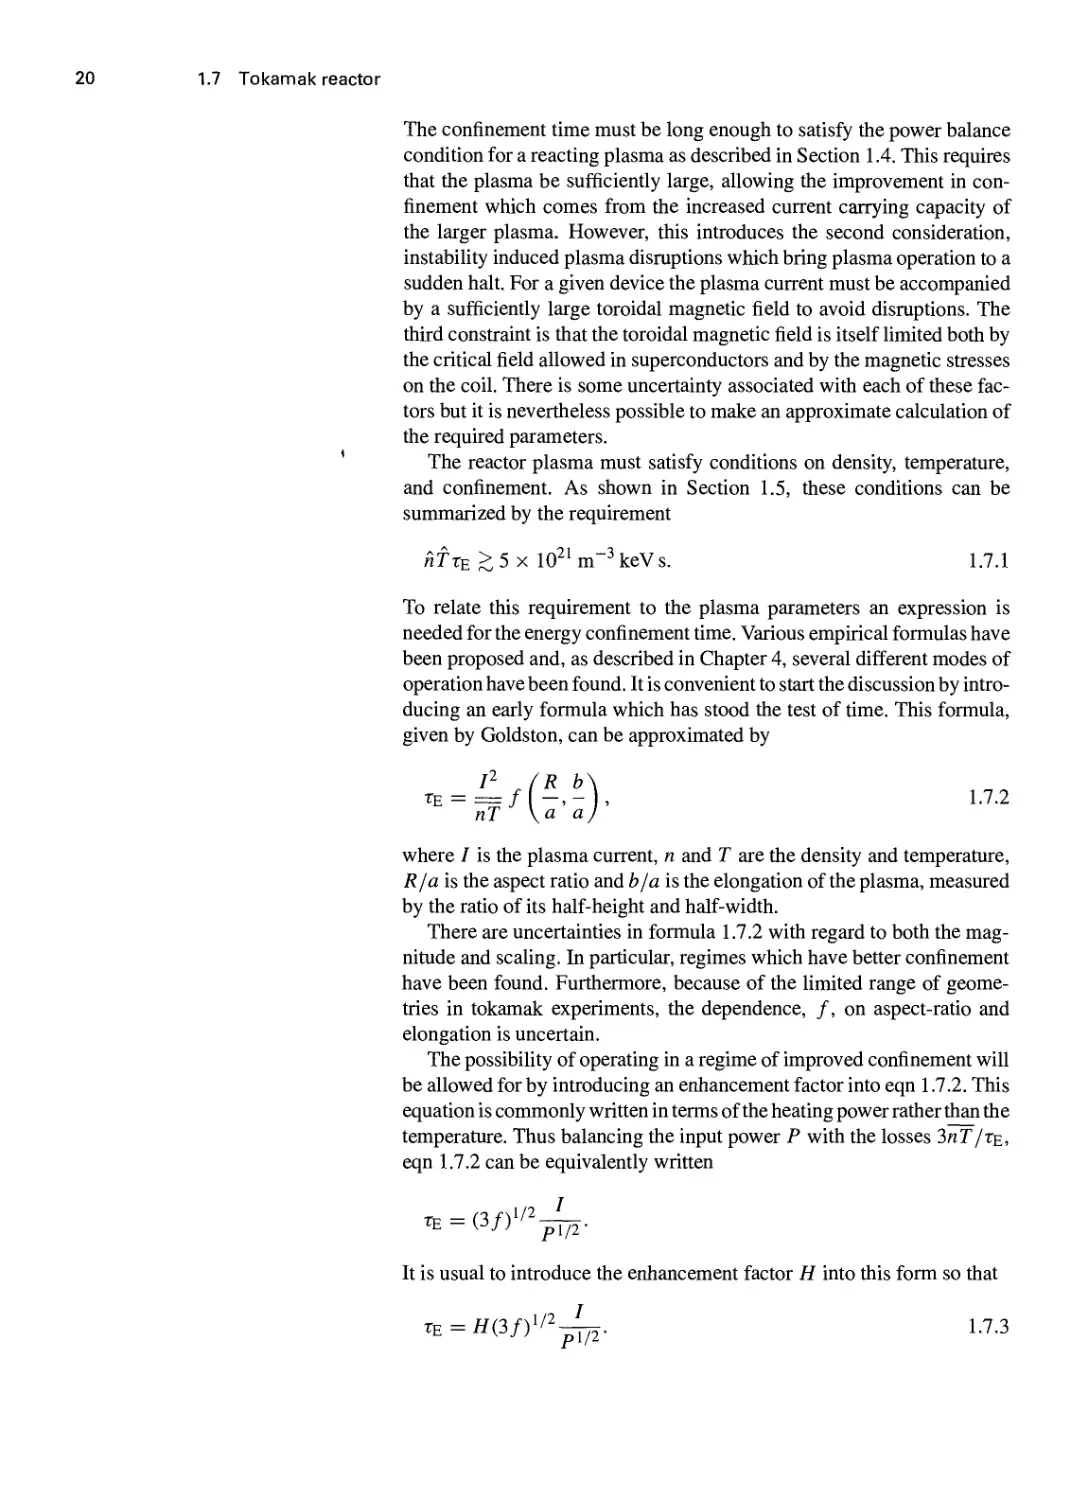
a separation of the plasma from the vacuum vessel. Two techniques are
currently used. The first is to define an outer boundary of the plasma
with a material limiter as shown in Fig. 1.6.5(a). The second is to keep
the particles away from the vacuum vessel by means of a
modification of the magnetic field to produce a magnetic divertor as shown in
Fig. 1.6.5(b).
A tokamak reactor will require additional elements in the tokamak
structure itself and will also need a means of converting the fusion power
into electricity. These features are described in Section 1.7.

1.7 Tokamak reactor
Fig. 1.6.5 Separation of plasma from
vacuum vessel by (a) limiter and
(b) divertor
Tokamak reactor
structure of reactor
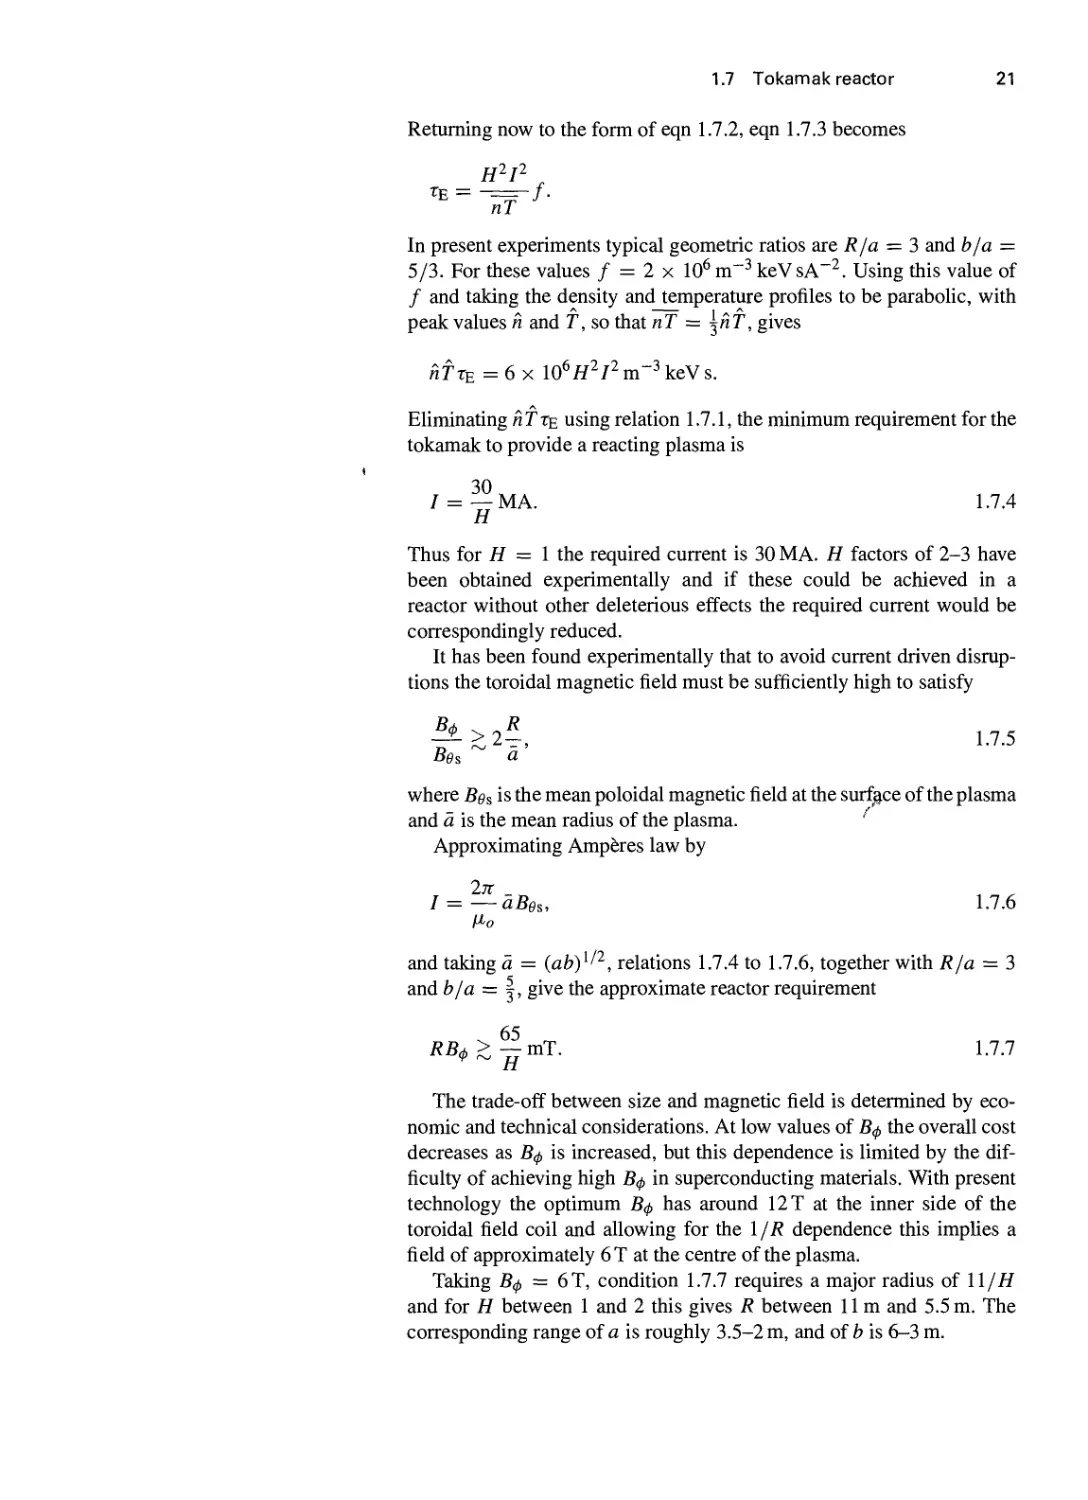
A tokamak reactor would be considerably more complex than a non-
thermonuclear tokamak. The general structure is illustrated in Fig. 1.7.1
and described below.
The plasma is surrounded by a blanket which has three roles. Firstly, it
absorbs the 14 MeV neutrons, transforming their energy into heat which
is then carried away by a suitable coolant to provide most of the reactor
power output. Secondly, in absorbing neutrons the blanket shields the
superconducting coils and other outer components. Thirdly, the blanket
allows the necessary breeding of tritium to fuel the reactor. In order to
accomplish this the blanket is composed of a compound of lithium such as
LiiO. A triton is produced in each neutron-lithium reaction as described
in Section 1.8 but it is not possible to engineer the blanket so that all the
neutrons undergo such a reaction. In order to make up for this deficiency
and achieve an overall breeding ratio greater than unity, it is necessary to
employ a neutron multiplier such as beryllium or lead The neutron flux
Fig. 1.7.1 Layout of pnncipal
components in a conceptual tokamak

1.7 Tokamak reactor
from the plasma decays with distance into the blanket, a blanket thickness
of 0.6-1.Om being adequate to absorb most of the neutrons.
The energy flux of the neutrons which pass through the outer wall of the
blanket must be reduced by a factor 10^-10^ before reaching the
superconducting coils to avoid both radiation damage and heating of the coils.
This protection is achieved by placing a shield of about 1 m thickness of
high Z material such as steel between the blanket and the coils.
In experimental tokamaks direct contact between the plasma and the
first wall is avoided by means of either a material limiter or by a divertor
which leads magnetic field lines away from the surface of the plasma to
a dump plate more remote from the plasma as described in Section 9.10.
In a reactor the power load on the material surfaces will be substantially
higher and the need to minimize the flow of impurities into the plasma,
together with a greater flexibility of design, appears to favour the divertor
system.
Ideally the toroidal current in the plasma would be continuous in time.
However with the transformer action, the driving electric field is induced
by increasing the magnetic flux linking the torus, and this can only be
continued for a limited period. The transformer action might allows pulses
of, say, one hour. Although not entirely satisfactory it is possible to accept
such pulsed operation provided the shut-down period is sufficiently brief
that the repeated thermal stresses arising from cooling are acceptable.
The alternative solution is to arrange that a continuous current is driven
by other means than an electric field. The current drive requirement is
substantially lessened by the fact that the plasma itself will generate part
of the required current through a mechanism called the bootstrap effect.
The remaining currents would be driven by injected neuffal particle beams
or electromagnetic waves. These methods of current drive are described
in Section 3.14.
The heat leaving the plasma and that produced in the blanket, would
be removed by a liquid or gaseous coolant. It would then be transformed
into electrical power by conventional means as illustrated in Fig. 1.7.2.
Fig. 1.7.2 Thermonuclear power
absorbed in blanket would be converted
into electnc power by conventional means
Reactor parameters
Sufficient information is now available from experimental tokamaks to
be able to estimate the general parameters of a tokamak reactor.
The size and plasma current required for a reactor are basically
determined by three considerations. The first is the energy confinement time.

1.7 Tokamak reactor
The confinement time must be long enough to satisfy the power balance
condition for a reacting plasma as described in Section 1.4. This requires
that the plasma be sufficiently large, allowing the improvement in
confinement which comes from the increased current carrying capacity of
the larger plasma. However, this introduces the second consideration,
instability induced plasma disruptions which bring plasma operation to a
sudden halt. For a given device the plasma current must be accompanied
by a sufficiently large toroidal magnetic field to avoid disruptions. The
third constraint is that the toroidal magnetic field is itself limited both by
the critical field allowed in superconductors and by the magnetic stresses
on the coil. There is some uncertainty associated with each of these
factors but it is nevertheless possible to make an approximate calculation of
the required parameters.
The reactor plasma must satisfy conditions on density, temperature,
and confinement. As shown in Section 1.5, these conditions can be
summarized by the requirement
«frE >5x lO^'m-^keVs. 1.7.1
To relate this requirement to the plasma parameters an expression is
needed for the energy confinement time. Various empirical formulas have
been proposed and, as described in Chapter 4, several different modes of
operation have been found. It is convenient to start the discussion by
introducing an early formula which has stood the test of time. This formula,
given by Goldston, can be approximated by
where / is the plasma current, n and T are the density and temperature,
R/a is the aspect ratio and b/a is the elongation of the plasma, measured
by the ratio of its half-height and half-width.
There are uncertainties in formula 1.7.2 with regard to both the
magnitude and scaling. In particular, regimes which have better confinement
have been found. Furthermore, because of the limited range of
geometries in tokamak experiments, the dependence, /, on aspect-ratio and
elongation is uncertain.
The possibility of operating in a regime of improved confinement will
be allowed for by introducing an enhancement factor into eqn 1.7.2. This
equation is commonly written in terms of the heating power rather than the
temperature. Thus balancing the input power P with the losses 3nT/TE,
eqn 1.7.2 can be equivalently written
It is usual to introduce the enhancement factor H into this form so that

1.7 Tokamak reactor
Returning now to the form of eqn 1.7.2, eqn 1.7.3 becomes
In present experiments typical geometric ratios are R/a — 3 and b/a —
5/3. For these values / = 2 x 10^ m"^ keVsA"^. Using this value of
/ and taking the density and temperature profiles to be parabolic, with
peak values h and T, so that nT = ^nf, gives
hfxE = 6 X 10^//2/2 m-^ keV s.
EHminating ntte using relation 1.7.1, the minimum requirement for the
tokamak to provide a reacting plasma is
/ = —MA. 1.7.4
Thus forH — l the required current is 30 MA. H factors of 2-3 have
been obtained experimentally and if these could be achieved in a
reactor without other deleterious effects the required current would be
correspondingly reduced.
It has been found experimentally that to avoid current driven
disruptions the toroidal magnetic field must be sufficiently high to satisfy
^>2?, 1.7.5
where figs is the mean poloidal magnetic field at the surface of the plasma
and a is the mean radius of the plasma. ''
Approximating Amperes law by
I = ~aBe„ 1.7.6
and taking a = {ab^l'^, relations 1.7.4 to 1.7.6, together with R/a = 3
and b/a = |, give the approximate reactor requirement
i?fi0>^mT. 1.7.7
The trade-off between size and magnetic field is determined by
economic and technical considerations. At low values of fi^ the overall cost
decreases as fi^ is increased, but this dependence is limited by the
difficulty of achieving high B,p in superconducting materials. With present
technology the optimum fi^ has around 12T at the inner side of the
toroidal field coil and allowing for the l/R dependence this implies a
field of approximately 6 T at the centre of the plasma.
Taking fi^ = 6T, condition 1.7.7 requires a major radius of 11///
and for H between 1 and 2 this gives R between 11m and 5.5 m. The
corresponding range of a is roughly 3.5-2 m, and of b is 6-3 m.

1.7 Tokamak reactor
However, other considerations enter into the decision as to the best
plasma parameters. The avoidance of pulsed operation by exploiting the
bootstrap current leads to a higher aspect-ratio design. The condition 1.7.5
for the avoidance of disruptions then implies a higher toroidal magnetic
field. This in turn requires the development of advanced superconducting
magnets. It is also an advantage to have a lower current to increase the
bootstrap current fraction. The possibility of a lower current depends
on having a sufficiently high confinement improvement, either through
the enhancement factor H or from an improvement with the increased
aspect-ratio.
Reactor power
The thermonuclear power density for equal deuterium and tritium
densities is given by eqn 1.4.2 and so the total reactor power is
= yg / n^{av)R
AS 1.7.8
where dS is an area element of the poloidal cross-section. This power
can clearly be calculated numerically for any particular case but it is
instructive to derive an analytic expression by making simplifying
approximations. The geometry is simplified by taking R to be its central value,
and the elongated plasma is represented by an equivalent circular plasma
with a radius a = {ab)^l'^. Equation 1.7.8 then becomes
Jo
For the temperatures of interest (crv) is well represented by eqn 1.5.4.
Using this approximation and taking the pressure profile to be of the
form
nT^fiTll-^]
eqn 1.7.9 gives
0-15 _^,Y n Y
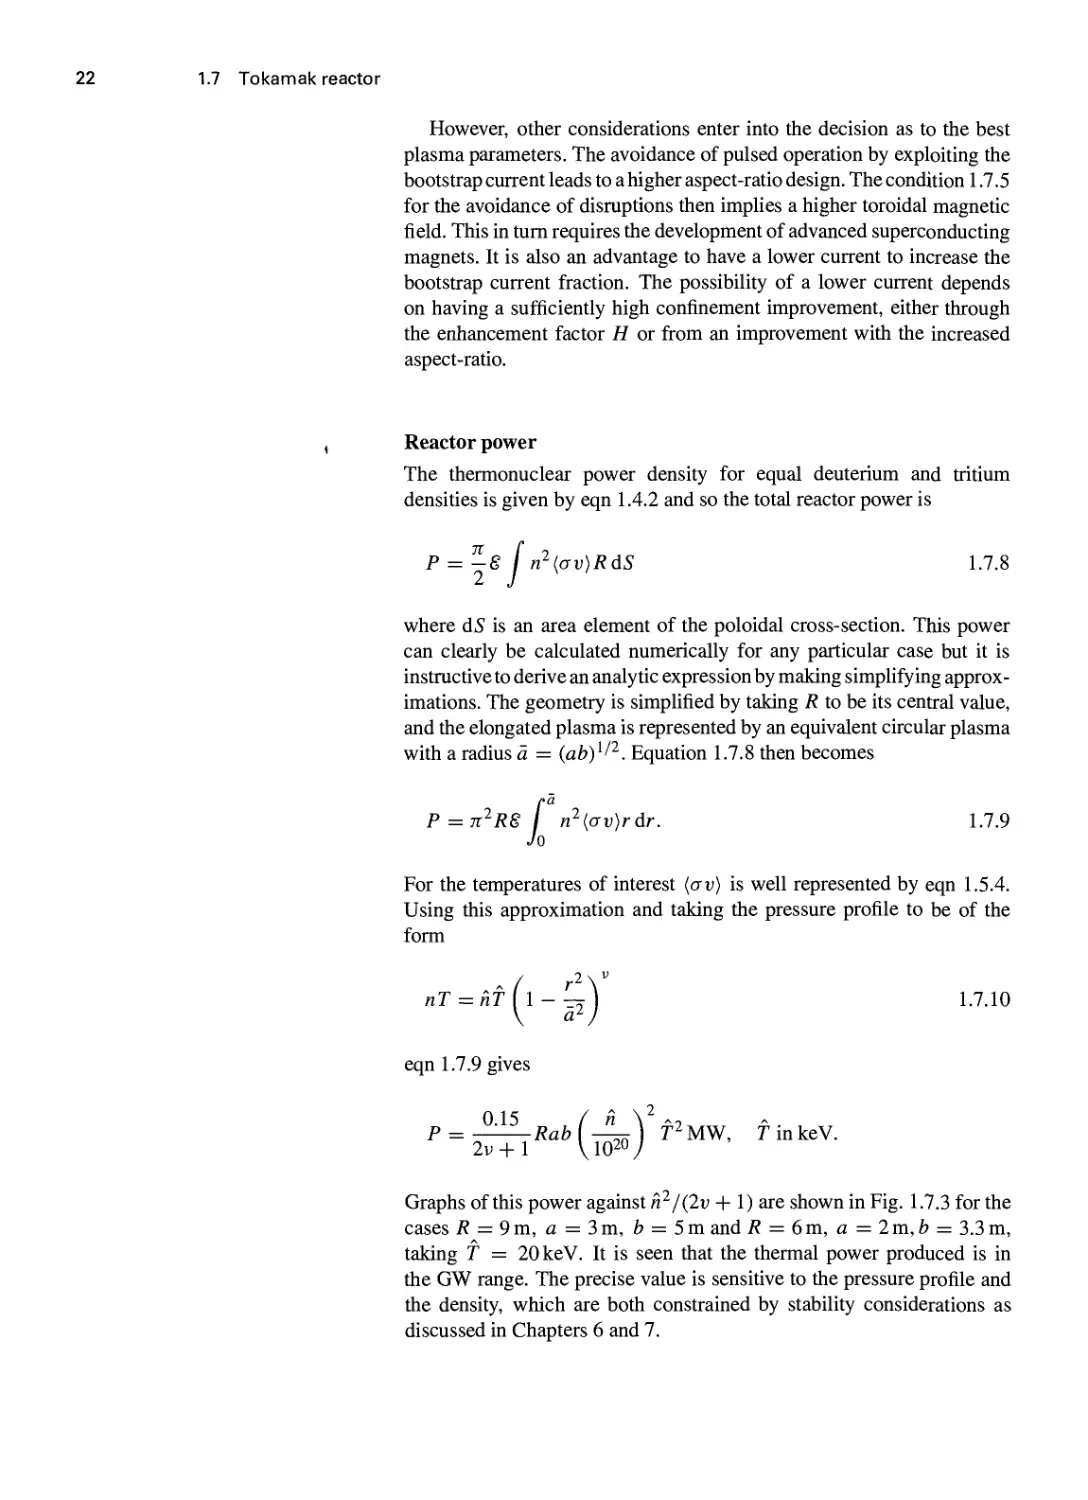
P = ^r^-^Rab\--^\ T^MW, TinkeV.
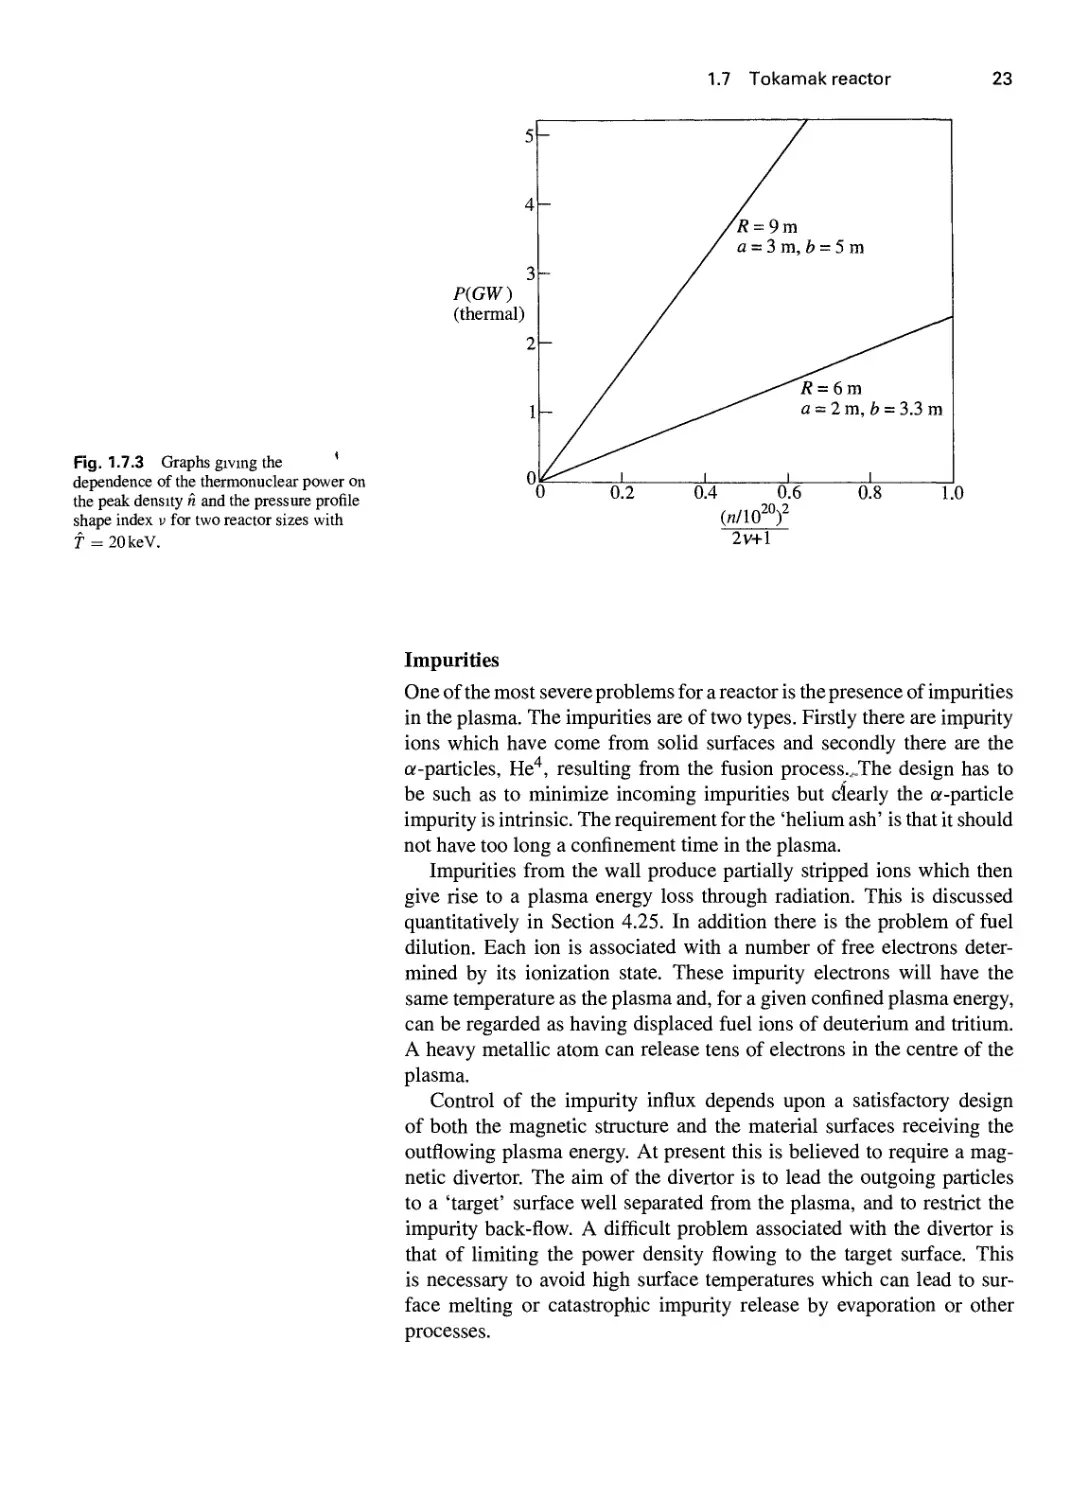
Graphs of this power against rr-l(lv + 1) are shown in Fig. 1.7.3 for the
cases i? = 9m, a = 3m, fc = 5m and i? = 6m, a = 2m,fc = 3.3m,
taking T = 20 keV. It is seen that the thermal power produced is in
the GW range. The precise value is sensitive to the pressure profile and
the density, which are both constrained by stability considerations as
discussed in Chapters 6 and 7.

1.7 Tokamak reactor
Fig. 1.7.3 Graphs giving the
dependence of the thermonuclear power on
the peak density h and the pressure profile
shape index v for two reactor sizes with
7' = 20keV.
Impurities
One of the most severe problems for a reactor is the presence of impurities
in the plasma. The impurities are of two types. Firstly there are impurity
ions which have come from solid surfaces and secondly there are the
a-particles, He'^, resulting from the fusion process.^The design has to
be such as to minimize incoming impurities but clearly the a-particle
impurity is intrinsic. The requirement for the 'helium ash' is that it should
not have too long a confinement time in the plasma.
Impurities from the wall produce partially stripped ions which then
give rise to a plasma energy loss through radiation. This is discussed
quantitatively in Section 4.25. In addition there is the problem of fuel
dilution. Each ion is associated with a number of free electrons
determined by its ionization state. These impurity electrons will have the
same temperature as the plasma and, for a given confined plasma energy,
can be regarded as having displaced fuel ions of deuterium and tritium.
A heavy metallic atom can release tens of electrons in the centre of the
plasma.
Control of the impurity influx depends upon a satisfactory design
of both the magnetic structure and the material surfaces receiving the
outflowing plasma energy. At present this is believed to require a
magnetic divertor. The aim of the divertor is to lead the outgoing particles
to a 'target' surface well separated from the plasma, and to restrict the
impurity back-flow. A difficult problem associated with the divertor is
that of limiting the power density flowing to the target surface. This
is necessary to avoid high surface temperatures which can lead to
surface melting or catastrophic impurity release by evaporation or other
processes.

1.8 Fuel resources
Fuel resources
There are two basic questions in judging the availability of fuel resources
for a fusion reactor. The first is the size of the natural reserves of the basic
fuels and the second is the cost of production. In a complete treatment
of the subject the reserves should be regarded as a function of cost but
for present purposes this is unnecessary. The answers to these questions
must be set against the requirements for power and the cost of that power.
The world annual primary energy consumption is about 3 x lO" GJ.
The world annual electrical energy consumption is about 3 x lO"^ GJ.
The consumer cost of electricity is typically $30 per GJ.
The natural abundance of deuterium in hydrogen is one part in 6700.
The mass of water in the oceans is 1.4 x 10^' kg and the mass of
deuterium is therefore 4 x 10'^ kg. In D-T reactors with a thermal efficiency
of 1/3 this would allow the production of D x lO'^/md) A7.6/3) MeV,
that is 10^^ GJ (el). This is about 3 x lO" times the world's armual
electrical energy consumption. Clearly there is no problem with deuterium
resources.
The cost of deuterium is of the order $1 per gram. One gram of
deuterium allows the production of A0~^/md) A7.6/3) MeV, that is
300 GJ (el). The cost contribution of the deuterium fuel is therefore
$0,003 per GJ(el), which is negligible compared to the $30 per GJ cost
of electricity.
The situation regarding tritium is more complex. Tritium has a half-
life of only 12.3 years and is virtually non-existent in nature. Tritium,
however, can be bred from lithium using the neutron induced fission
reactions.
Li^ + n^ T + He'^ + 4.8MeV
Li^ + n^ T + He'^ + n-2.5MeV.
The natural abundances are 7.4% Li^ and 92.6% Li''. With this system
the basic fuels are deuterium and lithium.
It is Li^ which is principally consumed in the blanket and the energy
potentially available from 1 kg of Li^ is roughly 22 MeV/mLi, that is
3 X 10^ GJ. At a thermal efficiency of 1/3 this gives 1 x 10^ GJ(el). Thus,
allowing for the natural abundance of Li^, 1 kg of lithium would provide
around 7x10^ GJ(el). The cost of lithium is of the order of $40 per kg
and so the contribution of the lithium fuel to the cost is less than $0,001
per GJ(el). This cost is very small compared to the cost of electricity and
it is clear that it would be possible to tolerate a large increase in the cost
of lithium before it became a significant factor.
The estimated United States reserves of lithium at prices comparable
to present prices is 5 x 10^ kg. This amount of lithium could produce

1.9 Tokamak e
25
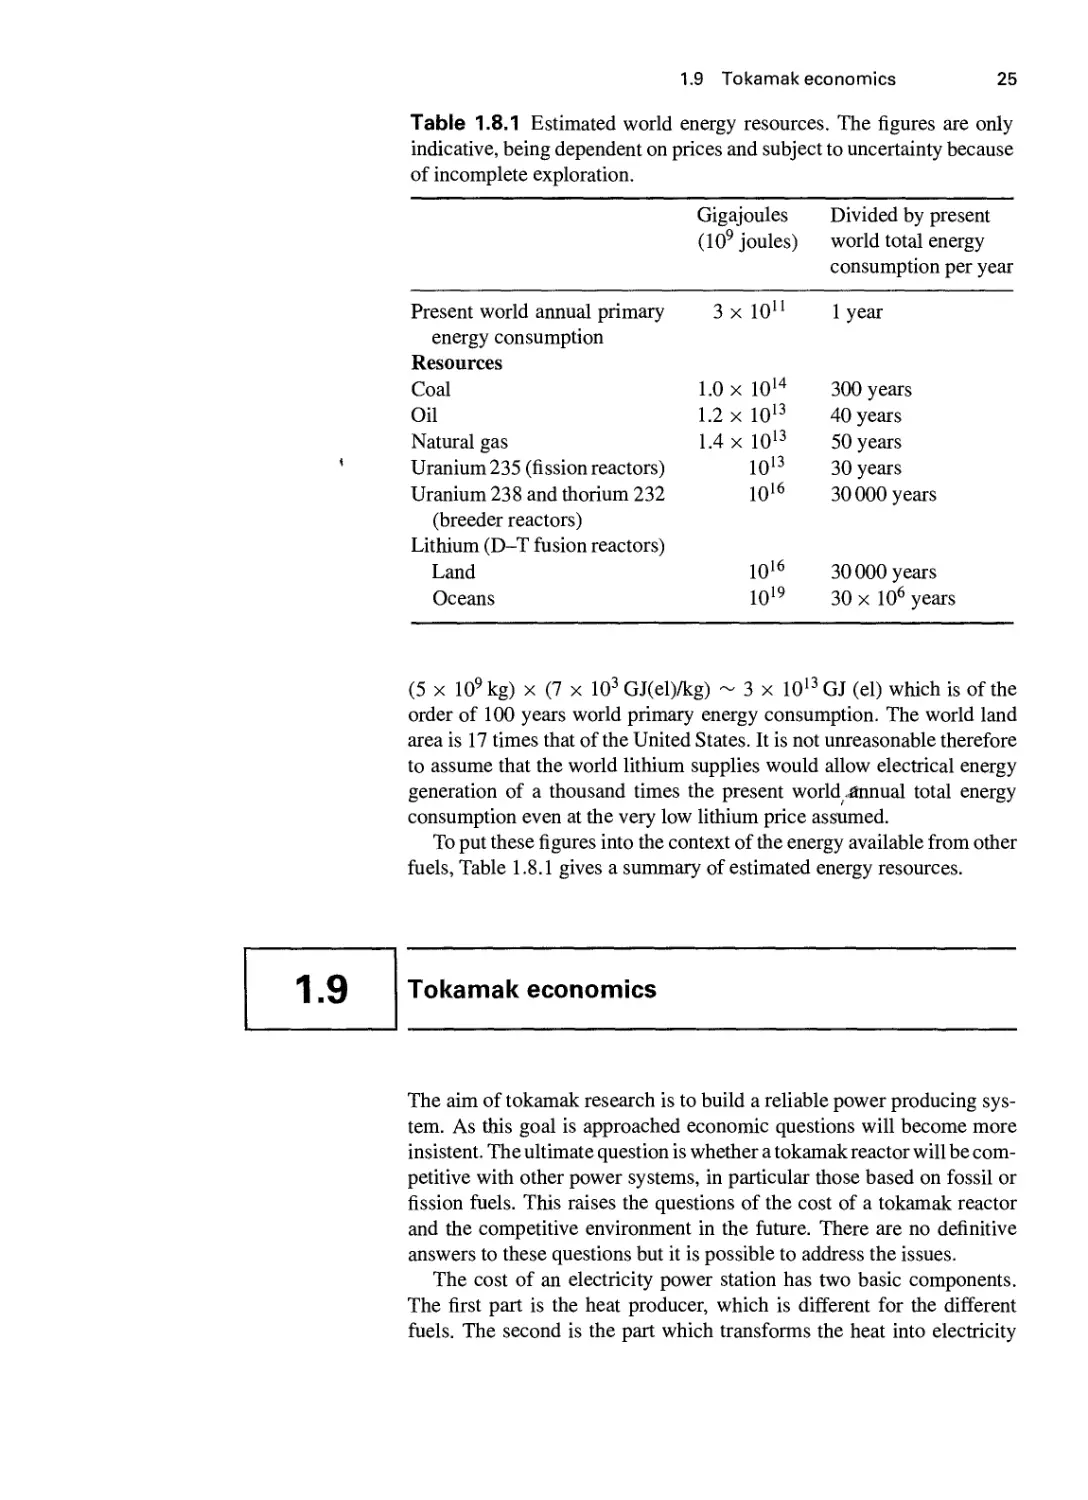
Table 1.8.1 Estimated world energy resources. The figures are only
indicative, being dependent on prices and subject to uncertainty because
of incomplete exploration.
Gigajoules Divided by present
A0^ j oules) world total energy
consumption per year
Present world annual primary
energy consumption
Resources
Coal
Oil
Natural gas
Uranium 235 (fission reactors)
Uranium 238 and thorium 232
(breeder reactors)
Lithium (D-T fusion reactors)
Land
Oceans
3
1.0
1.2
1.4
X 10"
xl0i4
xlO'3
X 10'3
10'3
1016
1016
1019
1 year
300 years
40 years
50 years
30 years
30 000 years
30 000 years
30 X 10^ years
E X 10^ kg) X G X 10^ GJ(el)/kg) ~ 3 x lOi^ GJ (el) which is of the
order of 100 years world primary energy consumption. The world land
area is 17 times that of the United States. It is not unreasonable therefore
to assume that the world lithium supplies would allow electrical energy
generation of a thousand times the present world .annual total energy
consumption even at the very low lithium price assumed.
To put these figures into the context of the energy available from other
fuels, Table 1.8.1 gives a summary of estimated energy resources.
Tokamak economics
The aim of tokamak research is to build a reliable power producing
system. As this goal is approached economic questions will become more
insistent. The ultimate question is whether a tokamak reactor will be
competitive with other power systems, in particular those based on fossil or
fission fuels. This raises the questions of the cost of a tokamak reactor
and the competitive environment in the future. There are no definitive
answers to these questions but it is possible to address the issues.
The cost of an electricity power station has two basic components.
The first part is the heat producer, which is different for the different
fuels. The second is the part which transforms the heat into electricity

1.9 Tokamak economics
and consists basically of turbines and generators. In the case of a tokamak
fusion station the cost of the reactor itself will dominate that of the
conventional plant.
The cost of the components is strongly dependent on their size and
therefore on the overall dimensions of the reactor. For a given overall
size of reactor the blanket volume is given by the thickness required to
stop the neutrons. For coils the size is related to the magnetic forces
associated with their currents. The vacuum vessel has to withstand
the force of atmospheric pressure and also the force due to currents
induced in the vessel by possible rapid changes in the plasma current.
Further costs arise from the generators required to drive the coil
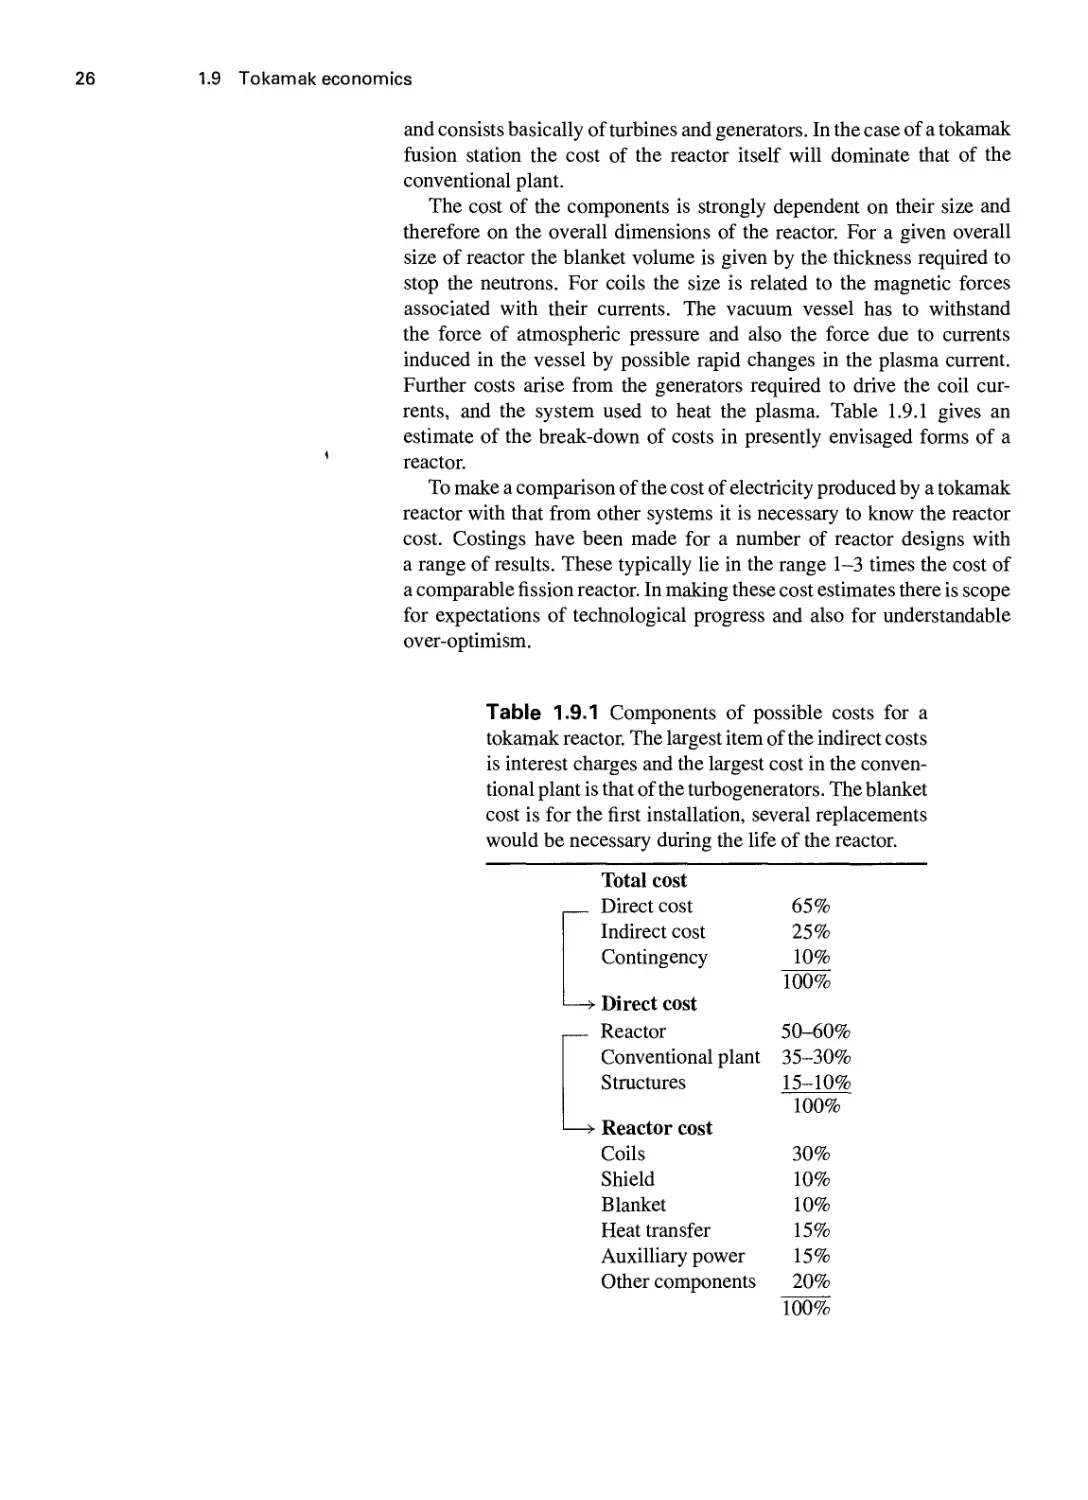
currents, and the system used to heat the plasma. Table 1.9.1 gives an
estimate of the break-down of costs in presently envisaged forms of a
reactor.
To make a comparison of the cost of electricity produced by a tokamak
reactor with that from other systems it is necessary to know the reactor
cost. Costings have been made for a number of reactor designs with
a range of results. These typically lie in the range 1-3 times the cost of
a comparable fission reactor. In making these cost estimates there is scope
for expectations of technological progress and also for understandable
over-optimism.
Table 1.9.1 Components of possible costs for a
tokamak reactor. The largest item of the indirect costs
is interest charges and the largest cost in the
conventional plant is that of the turbogenerators. The blanket
cost is for the first installation, several replacements
would be necessary during the life of the reactor.
Total cost
Direct cost
Indirect cost
Contingency
—> Direct cost
1— Reactor
Conventional plant
Structures
—> Reactor cost
Coils
Shield
Blanket
Heat transfer
Auxilliary power
Other components
65%
25%
10%
100%
50-60%
35-30%
15-10%
100%
30%
10%
10%
15%
15%
20%
100%

1.10 Tokamak research 27
A further piece of information is provided by the first proposed form
of ITER the planned International Toroidal Experimental Reactor which
was designed to ignite. Its estimated cost was ~6 billion $A989). Since
this costing was related to an actual project it is reasonable to take it
seriously. A thermonuclear reactor of this size would produce several
thermal gigawatts.
The current capital cost of fission power stations including the
conventional plant is around $0.7 billion per thermal gigawatt.
However, a comparison is not straightforward since ITER would be the first
experimental tokamak reactor whereas fission reactors have had several
decades of development.
The other main economic issue is the economic environment which a
tokamak reactor would face. Projections tend to place the first
commercial reactor around the middle of the twenty-first century. It is difficult
to predict what developments will have taken place by then. The present
concerns are with the pollution and CO2 emission from fossil fueled
stations, and with uncontrolled reactions and radioactive waste
associated with fission reactors. It is possible that factors such as these will
either make such stations unacceptable or that necessary modifications
will increase the cost, making fusion reactors more competitive.
Perhaps a reasonable view of the situation is that a tokamak reactor
looks rather expensive, but given the small cost of a tokamak
development programme compared to the world-wide expenditure on
electricity power production, the possible benefits justify the expenditure.
It is worth reflecting that our inability to predict the future is well
established.
Tokamak research
The word 'tokamak' is derived from the Russian words, toroidalnaya
kamera and magnitnaya katushka, meaning 'toroidal chamber' and
'magnetic coil'.
The device was invented in the Soviet Union, the early development
taking place in the late 1950s. At this time research on the toroidal pinch
configuration was being strongly pursued in the United Kingdom and
the United States. The advantage of the tokamak comes simply from the
increased stability provided by its larger toroidal magnetic field.
The successful development of the tokamak was principally the result
of the careful attention paid to the reduction of impurities and the
separation of the plasma from the vacuum vessel by means of a 'limiter'.
This led, during the 1960s, to comparatively pure plasmas with
electron temperatures of around 1 keV. By 1970 these results were generally
accepted and their significance appreciated.

1.10 Tokamak research
The early tokamaks had energy confinement times of several
milliseconds and ion temperatures of a few hundred eV. The evident need for the
1970s was to find out whether these conditions could be improved. This
task was undertaken in several countries and many tokamaks were built.
It soon became apparent that the energy confinement was anomalous.
The electron energy losses exceed the collisional transport rate by roughly
two orders of magnitude and the ion energy loss is typically several times
the collisional rate. Thus, although collisional theory predicts that the
energy loss rate will be dominated by the faster ion thermal conduction,
in practice the electron and ion energy are typically comparable. It was
further found that whereas theoretically the collisional confinement time
would fall as l/n, where n is the electron density, experimentally the
confinement time increased with n.
As larger tokamaks were built the expected improvement in
confinement was achieved and confinement times approaching 100 ms had been
obtained by 1980. Since a confinement time of the order of a second is
needed for a reactor, it was important to make the best estimate of the
conditions required for this. The simplest model consistent with
experimental results gave Te cx: na^, where a is the minor radius of the plasma,
and an extrapolation of the experimental data indicated that a minor radius
~2 m might be adequate for a reactor.
This requirement on the size of the plasma seemed quite acceptable
and the design of large tokamak experiments was undertaken in several
countries. The largest of these was the collaborative Joint European Torus
experiment, JET, having a mean minor radius of 1.5 m.
The other task of the 1970s was to investigate means of heating the
ions to a high temperature. The early experiments relied entirely on the
ohmic heating of the plasma resulting from the toroidal current.
Unfortunately ohmic heating becomes less effective at higher temperature because
the electrical resistivity of the plasma falls as the electron temperature
increases, varying as Tg" . The earliest additional heating method to
achieve success was neutral particle injection. Fast neutral atoms are
injected into the plasma and give up their energy through collisions.
Another method of heating is to launch RF waves into the plasma in
such a way that they are absorbed at resonant surfaces within the plasma.
Various frequencies were used but the most promising method was that
of ion cyclotron resonance heating. Both neutral beam and RF heating
had achieved temperatures of several keV in the early 1980s.
The higher temperature produced by the additional heating allowed the
dependence of confinement time on temperature to be clarified. A
theoretical prediction based on energy transport due to simple collisions would
give confinement which deteriorated with increased density and improved
with increased temperature. Unfortunately, in these hotter plasmas, the
confinement time was found to be a decreasing function of both density
and temperature. As power was applied to the plasma the confinement
time fell. These results were disappointing but did not present a
fundamental obstacle. Using the empirical evidence provided by a range of

1.10 Tokamak research 29
experiments the confinement time was predicted to improve with larger
tokamaks and their associated higher plasma currents.
A fortunate discovery made in the ASDEX tokamak was the existence
of a mode of plasma operation which had a longer confinement time than
'normal' operation. This is called the H-mode. The transition to this state
of higher confinement was found in a plasma with a divertor and at a
sufficiently high level of plasma heating. The transition occurs abruptly and
appears to be associated with improved confinement at the plasma edge.
A problem which has been apparent since the earliest experiments is
the occurrence of instabilities. The most serious of these is the
'disruption' in which instability causes a rapid loss of the plasma energy and
termination of the discharge. In these events large currents are induced
in the vacuum vessel, producing very large forces on the vessel.
Disruptions seriously restrict the operating regime of the tokamak, limiting both
the density and the plasma current for a given toroidal magnetic field.
Another instability, which restricts the current density in the centre of the
plasma, is a relaxation oscillation called the sawtooth instability. These
oscillations cause repeated loss of energy from the central region.
A further type of instability limits the ratio of plasma pressure to the
magnetic energy density. The ratio of these two quantities is called ^
and the restriction imposed by the instability is called the /S-limit. The
value of ^ has been increased to this limit in a number of machines. By
manipulation of the operating conditions the ^S-limit can be increased and
a value of/S greater man 10% has been obtained in the DIIID tokamak. The
;S-values required in a reactor are somewhat less than this, encouraging
the belief that the ^S-limit will not be a serious problem.
In the early 19 80s two larger tokamaks were builtff FTR and JET. They
were designed to carry several megamperes and to produce a significant
amount of thermonuclear energy in a deuterium-tritium plasma. In these
experiments the plasmas were heated up to the temperatures required in
a reactor, ion temperatures in excess of 30 keV being reached. In JET a
confinement time greater than a second was achieved, and the regime of
tokamak operation was also extended with plasma currents up to 7 MA
and plasma pulse lengths of up to one minute.
In 1991 a further milestone was passed. Calculations showed that
the plasma conditions achieved in deuterium plasmas in JET were such
that if the deuterium was replaced by a 50-50 mixture of deuterium and
tritium the resulting fusion reaction power would be comparable to the
power supplied to heat the plasma. Although this experiment could not
be carried out at that time because of the resulting level of radioactivity
in the tokamak structure, it was decided to carry out a preliminary tritium
experiment. A controlled amount of tritium was injected into a deuterium
plasma as a neutral beam. This led to a fusion reaction power in excess
of a megawatt for more than a second. Subsequent experiments used a
50-50 mixture of deuterium and tritium, allowing the production of a
fusion power of more than 10 MW in the TFTR tokamak and 16 MW
in JET.

It is clear that many of the problems of fusion research have been
overcome in tokamaks. It is now necessary to look to the future and the
next stage of tokamak development. This enterprise will concentrate effort
on the critical problems and, if successful, demonstrate the feasibility of
a tokamak reactor. It seems likely that the first ignition tokamak will
be a joint project involving many countries. There is akeady worldwide
co-operation in an international team, whose task is to design a tokamak
which will produce substantial fusion power. This conceptual tokamak
is ITER—the International Thermonuclear Experimental Reactor. If it is
decided to proceed to construction of this reactor it will be an exciting
endeavour.
Bibliography
Few books have been written with thermonuclear fusion as
their principal subject. Of these the earlier ones are to some
extent outdated but nevertheless still offer useful information
and insights, and are therefore included in the following
chronological list:
Glasstone, S. and Loveberg, R.H. Controlled
thermonuclear reactions. Van Nostrand, Princeton, New Jersey
A960).
Rose, D.J. and Clark, M. Plasmas and controlled fusion. MIT
Press, Cambridge, Mass. A961).
Artimovich, L.A. Controlled thermonuclear reactions.
Gordon and Breach, New York A974).
Kammash, T. Fusion reactor physics. Ann Arbor Science,
Ann Arbor, Michigan A975).
Teller, E. (ed.). Fusion. Academic Press, New York
A981).
Gill, R.D. (ed.). Plasmaphysics and nuclear fusion research.
(Culham Summer School on Plasma Physics). Academic
Press, London A981).
Dolan, T.J. Fusion research. Pergamon Press, New York
A982).
Gross, J. Fusion energy. Wiley, New York A984).
Miyamoto, K. Plasma physics for nuclear fusion, 2nd edn.
MIT Press, Cambridge, Mass. A989).
Lawson criterion
Lawson, J.D. Some criteria for a power producing
thermonuclear reactor. Proceedings of the Physical Society B70, 6
A957).
A derivation of the criterion is given in the first edition of this
book.
Basic tokamak
An early paper describing the basic principles and initial
results is
Artsimovitsh, L.A. Tokamak devices. Nuclear Fusion, 12,
215 A972).
Tokamak reactor
An extensive account of fusion reactors including a
discussion of tokamaks is given in the article
Conn, R.W. Magnetic fusion reactors. Fusion (ed. E. Teller)
Vol. 1, Academic Press, New York A981).
An overview on fusion reactors is included in Chapter 7 of
the book
Gross, J. Fusion energy. Wiley, New York A984).
Fusion reactions and thermonuclear fusion
A compilation of cross-sections and reaction rates is
Miley, G.H., Towner, H., and Ivich, N. Fusion cross-
sections and reactivities. University of Illinois Nuclear
Engineering Report COO-2218-17, Urbana, Illinois
A974).
Fuel resources
The general subject of fuel resources is discussed in
Lapedes, D.N. (ed.) Encyclopedia of energy. McGraw-Hill,
New York A971).
The figures in the table of Section 1.8 were obtained from the
article entitled 'Outlook for fuel reserves', by M.K. Hubbert
in the above book, together with

Bibliography
31
Hafele, W., Holdren, J.P., Kessler, G., and Kulchinski, G.L.
Fusion and fast breeder reactors. International Institute
for Applied Systems Analysis, Laxenburg, Austria A977).
Economics
Analysis of the economics of tokamak reactors seems to
allow a wide range of views. A concise assessment of the
potential of fusion reactors together with a discussion of
possible electricity costs is given in
Conn, R.W. et al. Economic, safety and environmental
prospects of fusion reactors. Nuclear Fusion 30, 1919
A990).
A more detailed account is given in
Krakowski, R.A. and Delene, 'j.G. Connection between
physics and economics for tokamak fusion power plants.
/. Fusion Energy 7, 49 A988).
A less optimistic view is expressed by
Pfirsch, D. and Schmitter, K.H. Some critical observations
on the prospects of fusion power. Fourth international
conference on energy options. London, I.E.E. Conference
publication No. 233, 350,1.E.E., London A984).
Tokamak research
Chapters 11 and 12 are devoted to a description of particular
experiments, and references to detailed papers are given
there.
A book which summarizes tokamak research and gives a
good insight into the underlying physics is
Kadomtsev, B.B., Tokamak plasma, a complex
physical system. Institute of Physics Publishing, Bristol
A992).
The Goldston scaling is described in
Goldston, R.J. Energy confinement scaling in tokamaks:
some implications of recent experiments with ohmic and
strong auxilliary heating. Plasma Physics and Controlled
Fusion, 26, No. lA, 87 A984).
Physical constants
A comprehensive list of fundamental and other physical
constants is available in
Tables of physical and chemical constants, (originally
compiled by) G.W.C. Kaye and T.H. Laby. Longman, London

Plasma physics

2.1 Tokamak plasma
Tokamak plasma
A plasma is an ionized gas. When fully ionized it is composed entirely
of ions and electrons. These components have many of the properties of
a normal gas. For example they can be described by their particle density
and temperature. However, a plasma has two characteristic properties.
Firstly the electric charge density of the two species is so large that any
substantial separation would lead to a very large restoring force, and
as a consequence the ion and electron charge densities in a plasma are
almost equal. The second property is the ability to carry a current as
result of a relative drift between the ions and electrons. In a tokamak the
plasma current produces an important part of the magnetic field. Where
the plasma current crosses the magnetic field it gives rise to a magnetic
force which can balance the plasma pressure gradient.
When a plasma is in a magnetic field the individual particles are
constrained in their motion. They are free to move parallel to the
magnetic field, but perpendicular to the field they gyrate in Larmor orbits.
In tokamaks the ion orbits typically have a radius of a few millimetres
and the electron orbits are smaller by the square root of the electron-ion
mass ratio. Although the precise behaviour of the plasma is determined
by the motion of the individual particles in the local electromagnetic
field, the constraints on the particle motions described above give the
plasma fluid-like properties on lengths larger than the Larmor radii. Much
of our understanding of tokamaks is based on such fluid models of the
plasma.
The particle concentration in tokamaks is typically ~10^'^ m"^ which
is about 10"^ of the particle concentration in the atmosphere. Tokamak
plasmas typically reach temperatures of several keV, which corresponds
to tens of millions of degrees Kelvin. This is of the order 10^ times
atmospheric temperatures and consequently the pressure in tokamak plasmas
is comparable to that of the atmosphere.
The outward force of the plasma pressure is balanced by the magnetic
field. However, the plasma energy density in a tokamak is small
compared to that of the magnetic field, typically a few per cent. The basic
magnetic field is the toroidal field produced by coils outside the plasma.
The poloidal field produced by the toroidal plasma current is typically
ten times smaller.
Many processes in the plasma are determined by particle collisions.
Collisions between ions and electrons give rise to an electrical resistance,
which leads to ohmic heating of the plasma. Collisions also produce
transport of particles and energy, leading to losses of both from the plasma.
Typically ion collision times are in the range 1-100 ms. Electron collision
times are shorter by the square root of the mass ratio. Collision times
increase with increasing temperature, varying as T^/^. As a consequence

2.2 Debye shieldin
Table 2.1.1 Typical tokamak plasmas.
Plasma volume
Total plasma mass
Ion concentration
Temperature
Pressure
Ion thermal velocity
Electron thermal velocity
Magnetic field
Total plasma current
1-100m^
10-"^ - 10-2 gm
10i9-1020m-3
1-40 keV
0.1-5 atmospheres
100-1000 km S-'
O.Olc-O.lc
1-lOT
0.1-7 MA
ohmic heating becomes less effective at high temperatures. On the other
hand collisional plasma losses are reduced.
The basic behaviour of tokamak plasma is poorly understood. The
energy loss substantially exceeds that predicted on the basis of simple
collisions and this is not explained. The anomaly is thought to be due to
small scale plasma instabilities.
Typical tokamak plasmas (Table 2.1.1) are far from quiescent and a
number of macroscopic instabilities are regularly observed. In some cases
the plasma adjusts to the instability and no substantial deterioration of
performance results. However, in the case of so-called tokamak disruptions
the instability damages the plasma beyond recovery.
The present chapter gives an introduction to the basic physics involved
in the analysis and understanding of tokamak plasm,a§.
2.2 Debye shielding
The electric charge density of the separate ion and electron components
of a plasma is large enough to ensure that only small charge separations
occur. The magnitude of this effect can be appreciated by imagining the
separation of the ions and electrons into sheets of thickness d as illustrated
in Fig. 2.2.1.
If the ions are singly charged and the density of ions and electrons is n,
the charge per unit area in each of the separated sheets is dne. Ignoring
numerical factors the electric field between the sheets is ^dne/so and
the resulting force per unit area is
Hg. 2.2.1 Ion and electron charge sheets
separated by a distance d.
(dnef

2.2 Debye shielding
In a tokamak the density n is around 10^*^ m ^ and for this density
F-lO'^J^Nm"^
As an example consider a sheet thickness of 1 cm. This gives a force per
unit area of 10^ Nm~^ or 10^ tonnes m~^.
As a result of the very strong force caused by charge separation, the
electron and ion densities are held almost equal throughout the plasma.
This is called quasi-neutrality and, for the general case with ions of
charge Z,-, the constraint is expressed by
ne = y^n,Zi 2.2.2
where the summation is over ion species.
It should be noted that eqn 2.2.2 does not mean that VE = 0.
Equation 2.2.2 is almost, but not quite, exact and the small charge
difference gives rise to significant electric fields. Thus the electric field cannot
be determined from eqn 2.2.2. On the other hand, given the electric field,
the charge density, pc, is determined by V ■ E = Pc/so-
It is seen from eqn 2.2.1 that the restoring force decreases with
decreasing charge separation length. The argument for quasi-neutrality
is therefore invalid for sufficiently small scale-lengths. It is possible to
derive a fundamental length characterizing the plasma by calculating the
thickness d for which the internal energy of the plasma could provide the
energy for a complete separation of the ions and electrons as shown in
Fig. 2.2.1. The required energy is Fd, the force F being given by relation
2.2.1, and the internal energy is ~J«T. Equating these energies gives the
characteristic length J = Ad where
,. 2.2.3
/jx 1/2
= 2.35 X loM - 1 m, r in keV.
This length is called the Debye length. In a typical tokamak plasma Ad
hes in the range lO^^-lO"' mm.
Although the charge separation described above is energetically
possible over a Debye length, it does not of course occur spontaneously in
the body of the plasma because the velocity of the particles are random
and the coherence of the particle motions required for the imagined
displacement does not arise. One situation for which a substantial charge
separation does occur is where a plasma is in contact with a solid
surface. Charge separation then appears in a sheath close to the surface
and this sheath has a thickness ~Ad. The Debye length also arises in a
more subtle way inside the plasma, characterizing the phenomenon called
Debye shielding.

2.2 Debye shielding 37
Consider a particular ion in the plasma and let the ion be singly charged.
The electric field of this ion is
Now although this is the electric field directly associated with this ion,
the other particles in the plasma adjust to this field and the resulting
distribution of their charge shields the charge of the ion and changes the
effective electric field. The trajectories of the electrons close to the ion
are slightly displaced toward the ion and the trajectories of the ions are
slightly displaced away from it. The shielding occurs around every ion
and the inverse effect occurs for every electron. This behaviour is similar
to that which occurs in electrolytes. This case was analysed by Debye
and hence the shielding carries his name.
The form of the shielding can be calculated for a stationary ion by
solving Poisson's equation for the potential </>. In spherical geometry the
equation is
]_^r^^ = - — , 2.2.4
r^ dr dr sq '
where the charge density pc = Yli'^j^j- The ions and electrons will each
have a Boltzmann distribution in the potential, and so their densities rij
will be given by
nj=noexp—^, 2.2.5
no being the electron, and ion, density at a large di^ance from the chosen
ion, where the potential is taken to be zero. Thus substituting eqn 2.2.5
into eqn 2.2.4 and taking singly charged ions
-r-—-, -—— v*- -«- )■ 2.2.6
r^ dr dr sq
It will be found that e(f)/T < 1 and, anticipating this result, eqn 2.2.6
becomes
^d,d^^2^ 2.2.7
r^ dr dr sqT
Regarding the product (r</>) as the variable, eqn 2.2.7 may be written
d2 2
and the solution which decays at large r is
(P = a-e-^''^^'' 2.2.8
r
where a is a constant. Since </> = e/4nsor as r ^- 0, eqn 2.2.8 becomes
(p = __f_e-^''AD 2.2.9
4nsor

2.3 Plasma frequency
Fig. 2.2.2 Graphs of the unshielded ai
shielded potential around an ion.
This equation describes the Debye shielding. It is seen that the potential
e/47teor of the single ion is shielded according to the exponential factor,
the characteristic length of the shielding being the Debye length. Graphs
of the unshielded and shielded potentials are given in Fig. 2.2.2.
From eqn 2.2.9 the approximation e(f)/T < 1 used in the calculation
implies
^ttsqT'
2.2.10
The physical nature of this requirement can be made clear by noting that
the smallest relevant value of r is the order of the interparticle separation,
that is l/^'/^. Using this value for r, inequality 2.2.10 becomes
3/2
»f^\
and so the approximation used is valid if there are many particles in a
cube with sides of length Ad, that is
«A^»1. 2.2.11
In a tokamak plasma typical values are « ~ 10^*^ m~^ and Ad ~ 10~^ m.
Thus «Ad ~ 10^ and inequality 2.2.11 is well satisfied. The quantity nX^
is called the plasma parameter.
The assumption that the test particle is stationary has given a simplified
account of the shielding process. In reality each particle has a velocity
relative to the mean velocity of the background particles. When the test
particle has a velocity comparable to the thermal velocity of the shielding
particles there is a delay in the formation of the shielding charge and
only partial shielding occurs. In the limit of very fast test particles the
shielding response is negligible and the potential associated with the test
charge approaches the bare charge form e/4nsor.
The overall behaviour is such that each particle generates its shielding
charge as it moves through the plasma and this results in a fluctuating
electric field. The particles also receive energy from the electric field and
the equilibrium balance of these driving and damping processes gives the
thermal spectrum of electrostatic fluctuations.
2.3 Plasma frequency
In Section 2.2 it was shown that a plasma has a characteristic length,
the Debye length. It also has a characteristic frequency. This can be
understood by considering displaced sheets of electrons as shown in

2.3 Plasma frequency
39
Fig. 2.3.1(a). It is assumed that because of their larger mass the ions are
stationary and have uniform density. The positive charges in the figure
represent the deficiency of electrons in the layers from which the electrons
have been moved. The resulting electric field is shown in the
accompanying graph. The electrons are accelerated by the electric field and
move to cancel the positive charge. At the time of cancellation the
electron momentum is a maximum and this allows the electrons to recreate
the charge separation, now in the opposite phase. The process is repeated
and the resulting motion of the electrons constitutes plasma oscillations
with the characteristic plasma frequency.
The plasma frequency can be calculated using the fluid equations. For
a cold plasma the equation of motion for the electron fluid is
---eE
2.3.1
Fig. 2.3.1 (a) Displaced electrons give
rise to restonng force and acceleration,
(b) after half a cycle the charges are
interchanged.
and, assuming a small density perturbation h, the electric field is given
by
Thus taking the divergence of eqn 2.3.1 and eliminating V ■ E using
eqn 2.3.2
dt
£Q
The continuity equation is
dt ''
and its linearized form is
= -V ■ (nv)
dt
-nW ■ V.
Substitution of V ■ u from eqn 2.3.4 into 2.3.3 gives the required equation
for plasma oscillations
where <Up is the electron plasma frequency
\SQmeJ
A similar frequency is associated with ion oscillations, the ion plasma
frequency being
where e, is the ion charge.

2.4 Larmor orbits
In Section 2.25 a more general account of plasma oscillations is given
and it is there shown that eqn 2.3.5 gives the frequency of electron plasma
waves in the limit where the wavelength is much larger than the Debye
length.
Substituting numerical values into eqn 2.3.5.
«p = 56.4«'/2s-i.
For a tokamak this frequency is very high. For example a density
n = 10^*^ m~^ gives cOp = 5.6 x lO" s~' with a characteristic time,
<yr"', less than one hundredth of a nanosecond.
2.4
Larmor orbits
The equation of motion of a particle of mass nij and charge
magnetic field is
If the magnetic field
this equation are
It-
where
IS uniform and in
dvy
"dT"
-(^cjVx
the
z direction, the components of
2.4.1
2.4.2
is the cyclotron frequency and the z axis has been chosen to be along
the magnetic field. From eqn 2.4.2 the particle velocity, v^, along the
magnetic field is constant. Separation of the variables in eqns 2.4.1 leads
d^Vy
d^v,
and the solutions of these equations may be written
'^x = *^± sincOcjt, Vy = v± coscOcjt. 2.4.3
Using Vx = dx/dt and Vy = dy/dt, eqns 2.4.3 can be integrated to
give

2.4 Larmor orbits
is the Larmor radius. Thus the particle has a helical orbit composed of
the circular motion of eqns 2.4.4 and a constant velocity in the direction
of the magnetic field.
A particle having the mean thermal energy in the plane perpendicular
to the magnetic field has u]^ = 2vjj, where ^mjvl = jTj. The factor
of 2 appears because two degrees of freedom are involved. Thus, for a
thermal particle
Substituting the values of electronic charge e = 1.602 x 10 '^C,
electron mass me = 9.11 x 10~^' kg, and proton mass trip = 1.673 x
lO-^'^ kg, together with UTy = 1.27 x 10~^ (Tj/mj^^^ms-^ where the
temperature is now expressed in keV, gives
Electron |<yce| = 1.76 x 10"fi s~
Particle j
Pe = 1.07 X lO-^Te'^Vfi m>
ft,cp = 9.58 X lO'^fis"',
Pp = 4.57x lO-^Tp^^/B m,
cocj = 9.58 X 10^(Z/A)fi s-',
p^=4.57 X lO-\A^/^/Z)TJ^^/B i
where Z and A are the charge and mass numbers of particle j.
Tables 2.4.1 and 2.4.2 give some values of Wc and p. It should be noted
that the Larmor radius of a thermal particle is sometimes defined without
the factor Vl of eqn 2.4.5.
Table 2.4.1 Values of cyclotron frequency cOq and
/c(= \<^c\/2n) for electrons and protons.
Frequency Magnetic field
1 Tesla
3 Teslas 5 Teslas
l«cel(s~') 1.76 X 10" 5.28 X lO" 8.79 x lO"
«cp(s"') 9.58 X lO'^ 2.87 x 10^ 4.79 x 10^
fee 28 GHz 84 GHz 140 GHz
/cp 15 GHz 46 GHz 76 GHz

2.5 Particle motion along B
Table 2.4.2 Values of Larmor radius, p, for electrons and protons
having the thermal velocity
B Larmor radius Temperature
5 Pe
Teslas Pp
10 eV
0.003 mm 0.011mm 0.035 mm 0.11mm
0.15mm 0.48mm 1.5mm 4.8mm
0.002 mm 0.007 mm 0.021mm 0.67 mm
0.09mm 0.29mm 0.91mm 2.9mm
2.5
Particle motion along B
As described in Section 2.4 the motion of a charged particle in a uniform
magnetic field is composed of two parts, a circular orbital motion
perpendicular to the magnetic field and a uniform velocity along the field.
An acceleration of the particle along the magnetic field is introduced if
there is an electric field parallel to B or a gradient of B parallel to B.
Acceleration due to E\\
A parallel electric field simply provides an acceleration given by
— (m^i;||) = e^£|l
so that if £11 is a function of f, un is given by
^j'^W =^J J ^11 df-
There are circumstances where the velocity resulting from such
acceleration is relativistic and the mass of the particle is then related to its rest
mass rrijo by the relation
^l-v^c^'
If £11 is a function of the distance x\\ along the magnitude field and of
time, it is then necessary to solve the equation
^\
= ejEii(xii,t).

2.5 Particle motion along B 43
Acceleration due to V||B
A charged particle moving parallel to a magnetic field is not subject to any
magnetic force. However, if the particle also has a velocity perpendicular
to the magnetic field and the magnetic field has a gradient parallel to B
there is a force on the particle parallel to the magnetic field at the centre
of its gyro-orbit.
The geometry of the situation is shown in Fig. 2.5.1. The force on the
particle isej(v x B). If the magnetic field is slowly varying, the
component of this force parallel to the field line at the guiding centre of the orbit is
F = a\ejivxB)\ 2.5.1
where a is the small angle between the magnetic field at the position of
the particle and that at the guiding centre, and the force is clearly in the
direction of the weaker magnetic field.
Taking cylindrical coordinates with the z axis along the line of the
guiding centre motion and a radial coordinate r, the angle a is given by
a = ~ 2.5.2
dBr
2.5.3
p being the Larmor radius. Since V • B = 0 and B^ = rdB^/dr,
dB,
Taking dB^/dz at the guiding centre,
dB^
dz
where V|| is the gradient parallel to B.
Combining eqns 2.5.2 to 2.5.5 and putting B^ = B, the angle a is
given by
1 |V||fi|
2'^ B
1 3 dBr
= |V||fi|
2.5.4
2.5.5
2.5.6
Fig. 2.5.1 Gradient of B parallel to B
gives nse to a component of the force
Bj (v X B) along the direction of motior
the guiding centre.

2.6 Particle drifts
From the force balance of the Larmor orbit
mv]
k;(i;xB)| = —i
and so, using equations 2.5.1, 2.5.6, and 2.5.7 the force arising from
Vnfiis
Vjja
A particle moving into a magnetic field of increasing magnitude can be
reflected by this force, this effect being called the mirror effect. If a
magnetic field has a minimum along a field line, particles in this region
of weaker field can be trapped between the two mirrors which result.
The quantity /x = ^mv\lB appearing in eqn 2.5.8 is an adiabatic
invariant being almost constant in a slowly varying magnetic field. This
invariance is described in Section 2.7.
Particle drifts
The circular Larmor orbits calculated in Section 2.4 resulted from the
assumption of a uniform magnetic field having straight field lines and no
electric field. Any deviation from this basic state leads either to
acceleration parallel to the magnetic field or to particle drift perpendicular to the
magnetic field. The accelerated motions were dealt with in Section 2.5.
On the scale of the Larmor radius charged particles gyrate rapidly
about the guiding centre of their motion, but larger scale perpendicular
drifts of this guiding centre arise in the presence of any of the following:
A) an electric field perpendicular to the magnetic field;
B) a gradient in magnetic field perpendicular to the magnetic field;
C) curvature of the magnetic field;
D) a time dependent electric field.
The drift velocity for each of these cases is derived below.
£ X B drift
If there is an electric field perpendicular to the magnetic field the particle
orbits undergo a drift perpendicular to both fields. This is the so-called
£ X B drift.

? -^t
Electron
MSlSmSL
Fig. 2.6.1 E xB dnft of ion and
electron, Vd = E/B
2.6 Particle drifts
The equation of motion is
ej{E + v X i
Choosing the z coordinate along the magnetic field and the y coordinate
along the perpendicular electric field, the components of eqn 2.6.1 are
ej{E-v^B).
The solutions of these equations can be written
Vx = v±s\n(i>c]t H
B'
2.6.2
This drift is independent of the charge, mass, and energy of the particle.
The whole plasma is therefore subject to this drift. The trajectories of an
ion and an electron are shown in Fig. 2.6.1.
The E X B drift can be further understood by recognizing that the
perpendicular electric field is frame dependent. Thus this electric field
can be transformed away by moving to a frame having a perpendicular
velocity Uf such that
E + VfxB =0.
2.6.3
B ©
Fig. 2.6.2 A gradient of B perpendicular
to B gives ion and electron dnfts in
opposite directions.
In this frame the particle orbit will simply be circular. It is seen therefore
that in the original frame the particle will have its cirpolar motion together
with a drift velocity uj = Vf. Crossing eqn 2.6.3 ^ith B now gives the
drift velocity
E X B
VB drift
In a magnetic field with a transverse gradient the particle orbit has a
smaller radius of curvature on the part of its orbit in the stronger magnetic
field, as illustrated in Fig. 2.6.2. This leads to a drift perpendicular to both
the magnetic field and its gradient.
Taking the magnetic field to be in the z direction, and its gradient in
the y direction, the magnitude of the drift can be calculated from the
y component of the equation of motion, that is
dvy
2.6.4
Assuming the gradient of B to be small so that the magnetic field variation
across the Larmor radius is small compared to B, the magnetic field can

2.6 Particle drifts
be written
B = Bo + B'y
where y = 0 is at the midplane of the particle orbit. Using the smallness
of the perturbation of the orbit eqn 2.6.4 becomes
^ -T^ = -vMBo + B'y) - VdBo 2.6.5
ej dt
where uj is the required drift velocity and the unperturbed motion of a
particle with perpendicular velocity v± is given by
Vxo = v± sin (Ocjt, y = Pj sine J t
where pj = v±/cl>cj- Substituting for VxO and y in eqn 2.6.5
-^--~ = -v± sincOcjt(Bo + B'pj sincocjt) — v^Bq.
Taking the time average of this equation with {dvy/dt) = 0 gives the
required drift velocity in the x direction
B'
VA = -Pj-^v±_ 2.6.6
or in vector form
1 Bx Vfi
2"
The ions and electron have opposite drifts, the sign in eqn 2.6.7 being
determined by the sign of Cj in pj =mj v±/ejB.
Curvature drift
When a particle's guiding centre follows a curved magnetic field line it
undergoes a drift perpendicular to the plane in which the curvature lies.
This behaviour is illustrated in Fig. 2.6.3.
To calculate the drift it is convenient to transform to a frame rotating
with the angular velocity, v\\/R of the particle, where v\i is the velocity
parallel to the magnetic field and R is the radius of curvature of the field
line. In this frame the particle experiences a centrifugal force mv}jR and
the equation of motion is
dv mvl
mj~ = -/ic + ejivxB) 2.6.8
where ic is the unit vector outward along the radius of curvature.
Equation 2.6.8 is similar to eqn 2.6.1 for the case of the £ x B drift

2.6 Particle drifts
Fig. 2.6.3 Ion dnft due to magnetic field
curvature. Electrons dnft in the opposite
direction.
Ion
trajectory
with the force ej E replaced by nij vj/R. Thus, by
drift, the curvature drift is given by
with the E/B
Vd =
COcjR
Since cOcj takes the sign of the particle charge, the electrons and ions have
opposing drifts, the drift direction for the ions being thtft of I'c x B.
If no currents are present the V B drift is in the same direction as the
curvature drift and takes a similar form. In this case Vfi = —i^B/R and
the Vfi drift velocity given by eqn 2.6.7 is
.d = i^.
IcOcjR
The combined drift is therefore
Wd =
-M
or, in vector form
_ ^] + h^\ B xVB
Polarization drift
When an electric field perpendicular to the magnetic field changes in time
it results in what is called the polarization drift. The name arises from the
fact that the ion and electron drifts are in opposing direction and give rise
to a polarization current proportional to dE/dt.

2.6 Particle drifts
The equation of motion is
dv
mj~=ejiE(t) + vxB).
The electric field can be transformed away by moving to an accelerated
frame having a velocity
ExB
"f = -^-
The equation of motion is then
dv duf
m,^ = e,vxB-m,-
so that
dv
' dt
m, dE
Equation 2.6.10 is similar to eqn 2.6.1 with ejE being replaced by
m,dE
The polarization drift corresponding to the electric drift (E x B/B'^) i:
therefore
2.6.11
SO that, recalling that E is perpendicular to B,
l_dE_
cOcjB dt
This drift is illustrated in Fig. 2.6.4.
The drift is in the same direction as dE/dt for ions and the opposite
direction for electrons, being much larger for the ions. If the electron
density is n the resulting polarization current density is
7V = E-.
V6j
and substituting eqn 2.6.11 for each species
. _ Pmd£
Pm being the mass density.
Fig. 2.6.4 Polanzation dnft of an ion
caused by an increasing electric field
perpendicular to tiie magnetic field. The
electron drift is in the opposite direction.

2.7 Adiabatic invariants
2.7
Adiabatic invariants
Adiabatic invariants are quantities associated with the particle motion,
which remain almost constant during changes in the motion provided
the changes are sufficiently slow. In the case of charged particles in a
magnetic field the requirement is that time changes are on a time scale long
compared to the gyro-period, and spatial changes are on a length scale
much larger than the Larmor radius. There are three principal invariants
for a charged particle in a magnetic field, the most important being the
magnetic moment.
Magnetic moment
The basic definition of the magnetic moment of a current loop is
/x = /A 2,7.1
where / is the current in the loop and A is its area. The current carried
by a charged particle gyrating in its Larmor orbit is
and the area, np^, of the orbit is
For a small current loop the force on the loop is
F = -/xV[|fi 2.7.4
in agreement with the detailed calculation given in Section 2.5.
The invariance of /x is demonstrated by calculating its time derivative,
that is
d/x 1 /d /I A dfi\
d7=fiUl2"^"^J~''^J- ■'■'
The conservation of energy gives

2.7 Adiabatic invariants
and the change in B following the guiding centre velocity Uji is given by
dB dB
Substituting eqns 2.7.6 and 2.7.7 into eqn 2.7.5
d/x If/ dujj \
dT " fi 1 i~'"^"''"dr ~ '^"'' ■ ^ ^^'^ii"U
+ (e,£x-«±-/x^)}. 2.7.8
The acceleration dv\\/dt is produced by the force given in eqn 2.7.4
together with that due to £[[ and so, taking the scalar products with Ujj
duii
Thusthetermsinthefirstbracketineqn2.7.8givezero. Sinceux = cOcjPj
the gyro-average of E± ■ v± is given by
(E±-v±) = j^iE-ds 2.7.9
where the integral is around the Larmor orbit and the line element ds is
along v±. Thus using eqns 2.7.1, 2.7.2 and 2.7.9, eqn 2.7.8 can now be
rewritten
'^ = -fl^(^E.ds + A'^). 2.7.10
dt B 2n \J dt )
The last term in the bracket of eqn 2.7.10 is the rate of change of flux
through the area A, and from Faraday's law
dB f
A— = -d) E ds
dt J
so that
dt
This shows that, in the limit of slow variations of fi, /x is a constant. That
is, jx is an adiabatic invariant.
Second and third adiabatic invariants
The magnetic moment is associated with the Larmor orbit of a particle.
When the particle has a larger scale periodic motion there is a second
invariant, J, defined by
J = (fv^ldl 2.7.11

2.8 Collisions 51
where the integral is taken over the periodic orbit x(t) and dl = b ■ dx
where b is the unit vector along the magnetic field. In the absence of an
electric field the total energy, W, of the particle is constant, where
and, using the definition for /x given by eqn 2.7.3, Ujj in eqn 2.7.11 can
be written in terms of the constants of the motion and the magnetic field,
The periodic motion involved in the invariant J can be subject to a
drift and this drift can result in a larger scale periodic motion. The third
adiabatic is associated with this motion. If the drift velocity is uj, the
invariant is defined by the following integral over the periodic motion:
73= f Vidl.
It can be shown that 73 is proportional to the magnetic flux enclosed by
the orbit.
Collisions
Collisions between particles give rise to plasma diffusion and other
transport processes. They also allow transfer of energy between particles and
are responsible for the electrical resistivity of the plasma.
The calculation of these processes is complex. First of all the concept
of collision in a plasma is rather subtle. Secondly, collisions between
particles depend on their relative velocities, and the overall result of collisions
is the integrated effect of interactions between particles of all velocities.
Finally the effective collision frequency depends upon the process under
consideration.
The electric field at a given point in the plasma includes the sum of
the contributions from all of the charged particles. Thus each particle is
subject to the electric field force of all the other particles. However it
turns out that the electric field can be separated into two parts. The first
is a smooth macroscopic field, this is the field E which determines the
particle drifts and appears in the equations governing the macroscopic
behaviour of the plasma. The second part is a rapidly fluctuating
microscopic electric field. For a given particle these fluctuations are the sum
of the electric fields of the other particles with which it is 'colliding'.
These are the particles which, at that instant, lie inside a Debye sphere
surrounding the given particle, their trajectories adjusting to shield out

2.8 Collisions
Fig. 2.8.1 Geometry of electron-ion
collision witii impact parameter r and
scattering angle x ■
the collisional effect of more distant particles. A complete analysis of
this behaviour is very complicated. In the following treatment the
interaction of pairs of particles will be described and the sum of these binary
Coulomb interactions will be cut-off at the shielding radius.
Consider as an example the case of a plasma electron colliding with a
singly charged ion. The force between the particles is an inverse square
force and is therefore described by the classical theory of Rutherford. The
geometry of the collision is shown in Fig. 2.8.1. The scattering angle x
for an impact parameter r and incident velocity v is given by
cot(x/2)
^TtEQin^v^r
The impact parameter for a 90° scatter is therefore
ro = e^ lAnEQm^v^.
The cross-section for scattering through an angle >90° is cro =
that
(TO --
e^l^AnslS
where S is the kinetic energy of the electron.
However, in a plasma the electron is simultaneously interacting with
a large number of ions. Each collision leads to a different angle of scatter
and to different losses of momentum and energy.
For collision with a single ion the change in momentum parallel to the
initial electron motion is
„ _ 2meiJ

If the ions are taken to be effectively at rest the total rate of change of
momentum of the electron is obtained by integrating with respect to the
impact parameter, r. Thus since the rate of collisions per unit area of
impact isnv, where n is the ion density,
dp 2 /" 27rr
dt J l + (r/roJ
= -Inmev^ao ln(l + (r/ro)^)lo°. 2.8.1
In eqn 2.8.1 the Debye length. Ad, has been introduced as the upper limit
to remove the divergence which has arisen from the neglect of Debye
shielding for collisions with impact parameters larger than the Debye
length. Since kj)^ ro, eqn 2.8.1 becomes
— = -4 In AaonmeV^ 2.8.2
dt
where In A = ln(AD/ro) is called the Coulomb logarithm. If the length ro
is less than the quantum mechanical length h/2meV it should be replaced
by this length in A, leading to a comparatively small change in its
numerical value. The value of In A is typically around 17 in tokamak plasmas.
Details of its properties are given in Section 14.5. It is seen that the
cumulative effect of the many small angle collisions for impact
parameters greater than ro gives an effective collision cross-section 4 In Actq-
This is much larger than ao, the cross-section for large angle collisions
alone. /
The above example serves as an introduction to the nature of
collisions in plasmas. More generally it is necessary to carry out integrations
over the velocity distributions of the species involved. The proper basis
for this is provided by the Fokker-Planck equation which is derived in
Section 2.10. The effects of collisions can usually be expressed in terms
of characterizing collision frequencies or collision times and these are
described in Section 2.14.
Momentum and energy change
Equation 2.8.2 gives the rate of change of momentum for an electron
colliding with stationary ions. More generally, for particles of arbitrary mass
ratio and relative velocity, the rate of change of momentum for particle
/ with velocity u, through collisions with particles j with a velocity Vj,
averaged over all impact parameters, is
where the relative velocity

2.8 Collisions
e]e^^ In A
'J ~ ~A 7
the reduced mass, m,j, being given by
The corresponding rate of change of energy is
\dt I " (ni,+mj)vl
To obtain the average rates of change for a particle / due to collisions
with a//particles of type;, it is necessary to integrate eqns 2.8.3 and 2.8.4
over the velocity distribution function fj (Vj). The resulting integral can
be written
/-^\ =m,A%H 2.8.5
where V„ is the gradient in the v, velocity space.
nd
eje^, In A
It is interesting to note the connection to potential theory, the integral in
the expression for H having the same form as that for the electrostatic
potential of a charge distribution fj. It is apparent from this that for
a spherical distribution of fj, only particles with a velocity Vj < v,
contribute to the force on particle /.
The corresponding expression for the rate of energy change is
l^\ = Aim,v-V,H + m,jH). 2.8.6
The total rates of change of p, and s, are obtained by summing over all
species present in the plasma.
The potential H can be calculated for a given distribution function fj
and in particular for a Maxwellian distribution. However the discussion
of this is best delayed until the kinetic equations have been introduced in
the following sections. These equations describe the time development
of the distribution function. The collisional contribution to this is given
by the Fokker-Planck equation, and the coefficients appearing in this

2.9 Kinetic equations 55
equation are related to the rates of change of momentum and energy
described above. The form of H for a MaxwelUan distribution is given in
Section 2.13 and there is further discussion of the momentum and energy
change in Section 2.14. Explicit forms for eqns 2.8.5 and 2.8.6 can be
obtained from eqns 2.13.1 and 2.14.4.
Kinetic equations
Kinetic theory describes the behaviour of gases and plasmas in terms of
the particle motions. Because of the large number of particles involved
this description has to be statistical. In practice this is carried out using
the distribution function f(x, v, t) which measures the probability
density for a single particle in the six dimensional phase space {x,v). The
behaviour of the distribution function is described by the kinetic equation.
Depending on the circumstances this takes different forms, some of which
are described below.
A full account of the kinetic equations starts from the N particle
distribution function which is a function of the positions and momenta of
all the N particles. This includes information about pair correlations, and
leads to a separation of the effects of large-scale fields and those varying
on the scale of the Debye length, these small-scale fiejds being
responsible for 'collisions'. For present purposes it is adequate to use the single
particle distribution function / and to allow for collisions by introducing
a separate collision term.
The distribution function is a function of the position q and the
canonical momentum p, that is/ = /(^,j?). From the conservation of particles
it follows that the rate of change of / along a trajectory in phase space is
given by the divergence of the phase space flow, thus
d/ /9 . 9 .\
where
d 3.3 .3
— = \-Q ■ \- P ■ .
At dt ^ dq ^ dp
The divergence term on the right-hand side of eqn 2.9.1 is zero as is
readily seen by substituting Hamilton's equations
. _dH_ . __dH_
The resulting equation is
3/ 3/ 3/

2.9 Kinetic equations
Considering a particle species j, the equation of motion in a plasma is
Pj =ej{E + v X B)
and substituting into eqn 2.9.2 leads to the Vlasov equation
df df e, df
_^+„._^ + _L(£ + „xB)./=0. 2.9.3
dt dx Mj dv
This is the equation which governs the behaviour in the absence of
coUisions.
The inclusion of collisions requires the addition of a term (9//9f )c to
the right-hand side of eqn 2.9.3. If the collisions in a plasma were hard
collisions, localized in space and time, it would be appropriate to use
the form of the collision term given by Boltzmann's equation. However,
as seen from Section 2.8, this is inappropriate for a plasma. The proper
coUisional kinetic equation for a plasma is the Fokker-Planck equation
dt dx mj dv \dtJc
for which the collision term is derived on the basis of multiple small angle
collisions as described in Section 2.10.
The drift kinetic equation is a form of the Fokker-Planck (or Vlasov)
equation which describes the evolution of / under conditions where
it occurs slowly in time compared to the gyro-period and gradually in
space compared to the gyro-radius of the particle orbits. The equation
is derived from eqn 2.9.4 and involves a reduced phase space of five
variables (ujj, v±,x). The gyro-kinetic equation is similar, but describes
the case where the electromagnetic fields do vary significantly across a
Larmor radius, by averaging their effect over the Larmor orbit.
The kinetic equations are used for many purposes. Numerical
solutions of the Fokker-Planck equation give the slowing down of a beam
of particles injected into the plasma and the resulting heating of the ions
and electrons. Approximate forms of the equation allow the calculation
of the collisional transport of particles and energy. The linearized form
of eqns 2.9.3 and 2.9.4 are used in stability calculations, particularly for
micro-instabilities.
The Fokker-Planck equation can also be used to calculate
characteristic relaxation times, as described in Section 2.14, by considering
the behaviour of test particles in the plasma. By taking moments of the
kinetic equations it is possible to derive fluid equations. Although the
fluid equations are less generally valid, they are easier to solve and give
considerable insight into plasma behaviour.

2.10 Fokker-Planck equation
2.10 Fokker-Planck equation
As described in Section 2.8 the dominant effect of collisions in a plasma
occurs through the cumulative contribution of many small angle
scatterings. The appropriate equation to describe the effect of these collisions
is the Fokker-Planck equation. This provides an explicit form for the
colhsion term (9//90c and hence allows calculation of the behaviour of
the particle distribution function.
The rate of change of the distribution function due to collisions during
a short time Af is given by
(^] ^f(x^v,t + At)-fix,v,t) 2^^^
\dfJc At ■
The change in / results from the integrated effect of scatterings Au in
velocity during this time, thus
f(x, v,t + At)= [ fix, V - Av, t)ir{,v - Av, Av) d(Au) 2.10.2
where -^{v, Av) is the probability that a particle with velocity v will be
scattered by Av in a time At.
The integrand of eqn 2.10.2 can be expanded in a^aylor series in Au
to obtain
f{x, V - Av, t)\lriv - Av, Av) = fix, v, t)-^{v, Av)
-E^(/«A". + ^E^(/«A".A"/.- 2.10.3
Substituting eqn 2.10.3 into eqn 2.10.2 and using
j m{v,Av)A{Av) = 1
gives
fix,v,t + At)-f{x,v,t)
= - E ^ (/(^'"' ^> / ^("' ^")^"' 'i^^"))
2.10.4

2.11 Gyro-averaged kinetic equations
It is convenient to define the Fokker-Planck coefficients
{Ava) = I fAVc,diAv)/At
and
{AvaAvp) = / \lrAvaAvpd(Av)/At
giving the average time rate of change of Auq, and AvaAv^ due to
colhsions. Substitution of eqn 2.10.4 into eqn 2.10.1 then gives the
Fokker-Planck collision term
(^), = -Ei::«-.>/)-^E^«A..A..)/).
The quantity (Auq,) is called the coefficient of dynamic friction i
(Auq, AWjg) the diffusion tensor.
Gyro-averaged kinetic equations
Many plasma phenomena involve processes which are slow compared to
the Larmor frequency and which vary slowly in space compared to the
Larmor radius of the individual ions or electrons. To study such
phenomena simpler kinetic equations which average over the fast Larmor motion
have been derived.
The advantage of such kinetic equations lies in the reduced
dimensionality of the phase space. The Vlasov equation has the six independent
variables involved in r and v and the gyro-averaging reduces this to five.
Under some circumstances there is a periodic motion along the magnetic
field and if this is sufficiently fast a further averaging over this motion
reduces the phase space to four dimensions.
The drift kinetic equation is an equation for the gyro-averaged
distribution function
/ =
//.
where </> is the rapidly varying gyrophase. It is obtained by expanding
the Fokker-Planck equation with <y~' d/dt < 1 and p/L < 1, where coc
is the cyclotron frequency, p the Larmor radius and L is a characteristic
plasma length, and the equation then takes the form
9/
dt
■v/
-h
E-Vg + fx-
dK
fdf\
2.11.1

2.11 Gyro-averaged kinetic equations 59
where the averaged distribution function / is a function of the five phase
space variables x, /x, K with the magnetic moment /x = nijV^/lB and
the energy K = ^rrijV^. In eqn 2.11.1 E is the electric field and the
guiding centre velocity Vg contains the rapid longitudinal motion, the
electric cross-field drift, and the magnetic gradient B and curvature drifts
£ X B vlby.{b- V)fe + /x& x Vfi
"g = 1^ + —^ + ' 2.11.2
where & = B/|B| and^cy = ejB/mj.
In eqn 2.11.1 the first two terms of the left-hand side contain the
Lagrangian time derivative convecting along the guiding centre trajectory.
The coefficient of (9//9A') contains the work done by the electric field on
the guiding centre together with the change in the perpendicular energy,
\^mv\, experienced by a guiding centre (whose magnetic moment /x is
conserved) in a changing magnetic field. The right-hand side of eqn 2.11.1
represents the rate of change of / due to interparticle collisions. An
explicit form for (9 //90c can be obtained by gyro-averaging the Fokker-
Planck collision operator, but is somewhat complicated. The resulting
operator describes slowing down and diffusion in energy, K, and diffusion
in magnetic moment /x (or in the pitch angle variable A, = ix/K). It is
not usual to retain the effect of classical collisional diffusion which is a
second order effect (of order Vjp^lL\ where Pj is the Larmor radius,
Vj the collision frequency and Lj_ a characteristic length of variation
of / across the magnetic field). This is not an essential weakness and
a more complex drift kinetic equation, correct to hi^er order in pj/L
can be derived which contains both higher order drift velocities like the
polarization drift and classical diffusion.
The equation is used in linear and nonlinear studies of low frequency
and long wavelength instabilities, and in neoclassical transport theory
where the neglect of the 'classical' contribution to transport, arising from
Larmor gyration, is unimportant.
The gyro-kinetic equation extends these averaging procedures to
situations in which some components of the electromagnetic fields vary
significantly across a particle's Larmor orbit.
It was first used in linear stability analyses in which the perturbed fields
vary as exp(/^: ■ x) and the wavelengths in the directions transverse to the
magnetic field are comparable to the Larmor radius, that is k±v±/cOc is
of order unity.
Taking collisionless equations for simplicity and perturbations for
which k±v±/(i>c is of order unity and the perturbed quantities vary as
exp(—i<yf-I-^:_L-J»:) then, writing/ = fo + Sf andE = Eo — Vcp — icoA,
the distribution function perturbation Sf may be obtained in terms of the
perturbed potentials </> and A\\ and the magnetic field perturbation fi|| by
expanding the linearized Vlasov equation. The result, for isotropic /o is

2.12 Fokker-Planck equation for a plasma
where
and g(ix, K,x) satisfies the gyro-kinetic equation
-v\\b-Vg + ik± -Vgg
_r 9/0 bxVfo-k^
][
Mz)eji(t)-v\\A\\) +
2Mz)
2.11.3
with
Z = k_i_V_L/cOcj.
In the long wavelength limit, z ^- 0 and L ^- 0 and the results for S f and
g are identical to those which would be obtained by linearizing the drift
kinetic equation. The Bessel functions Joiz) and Jiiz), and the factor
exp(iL) contain the effects of Larmor averaging over the rapid spatial
variation of the perturbed fields.
If the equilibrium possesses magnetic shear this simple picture of
the gyro-kinetic equation as a differential equation is invalid because
the spatial variation of the perturbed quantities can no longer be
represented purely by the eikonal form exp(i^: ■ x). However, many short
wavelength Unear stability calculations in toroidal geometry introduce
the so-called ballooning transformation. This has the important
consequence that eikonal representations for the perturbed quantities are valid
in the transformed space, even in strongly sheared magnetic fields, so that
simple gyro-kinetic equations like 2.11.3 are obtained.
The gyro-kinetic equation appears in linearized studies of low
frequency instabilities, but more compUcated versions of the equation can
be derived for high frequency modes (co/coc ~ 1) with nonlinear terms
included.
For applications to low frequency or slowly evolving phenomena, a
second averaging (over the longitudinal motion of the particles) can be
performed. This further reduces the dimensionality of the problem to the
four variables JCx, /x, A' and generates the bounce averaged drift kinetic
equation, or bounce averaged gyro-kinetic equation.
Fokker-Planck equation for a plasma
In the case of a plasma the coefficients in the Fokker-Planck equation are
calculated for small angle Coulomb collisions and a sum is made over

2.12 Fokker-Planck equation for a plasma 61
all the particle species. The coefficients take the form of differentials
of integrals over the distribution function. These integrals, Hj and Gj,
called the Rosenbluth potentials, are given by
«'«=(-^)/a^-'
Gj{v) = j fj{v)\v-vj\dvj
2.12.1
\ mj / J \v-Vj\ -
and
the subscript j referring to the particle species. Written in terms of these
potentials the required coefficients are
where
e^Z^Z^ In A
Anslm^
and the subscripts a and ^ refer to the Cartesian components of v and Vj.
Using eqn 2.10.5 with eqns 2.12.3 and 2.12.4 the Fokker-Planck
collision term can now be written ^
/3/\ e^Z^zJhiAf 3 (dHj{v)'^\
+^/-/-|y^-^/(«)!} 2.12.5
where summation is taken over double indices of a and p.
Alternatively, the collision term may be written in the symmetric
Landau integral form
Uf =5:-
x-/f
fj(Vj)df(v) fiv)dfj(Vj)\ ^
where
M^^ _ ^^^^^
u = V — V, and «„« = ^ .
The Fokker-Planck equation for a plasma is now obtained by
substituting eqn 2.12.5 or 2.12.6 into eqn 2.9.4. Its solution is usually obtained

2.13 Fokker-Planck coefficients for Maxwellian distributions
numerically. However it is possible to obtain useful information of a
simpler form by considering the response of test particles to collisions with
species having a Maxwellian velocity distribution. This allows the
calculation of characteristic times for the slowing and deflection of particles
as described in Section 2.14.
2.13
Fokker-Planck coefficients for
Maxwellian distributions
Taking a Maxwellian velocity distribution for the 'background' species
and denoting this species with subscript 1,
Mvi) =
B7rK/2„3
v4j'
the Rosenbluth potentials given by eqns 2.12.1 and 2.12.2 can be
calculated. The resulting potentials are
= «i ( ;7~^*^ (u/V2i;ti) + -^vji^' (v/V2vTi^ j
.1 Orthogonal velocity
■s I'll, v±ci and v±^ with
_2_
TT Jo
is the error function,;
^ix) :
2
The corresponding (Au) is parallel to v, and the diffusion tensor is
diagonal. It is therefore convenient to use Cartesian coordinates
parallel and perpendicular to a chosen direction as shown in Fig. 2.13.1,
the two perpendicular coordinates being written u_l„ and u_l^. From
eqns 2.10.5 and 2.12.5 the friction and diffusion coefficients are related
to the potentials by the equations
(Auii) =
(Al^ll)'):
dHi
dv
dv^

2.13 Fokker-Planck coefficients for IVIaxwellian distributions
and
IdGi
\ / V dv
where
e^Z^Z? In A
The form of {{Av±a)^) follows from the relation
2 2
V = Uji
SO that
+ »^L + »^i^
\ _ 1 'I'^i
/ V dv '
V±a=0
The explicit forms are
(A^
((Ai^ll)
((Aw±a)
where
*W =
and
n
A _
,) = -Ao(l + ;^)
/ V
2\ ^ <&(i;/V2i;ti)
^_Ad ;
<&(x)-x<&'(x)
le^Z^Z^lnA
vI^(i;/V2i;ti)
2vl^
- ^(v/VlVTi)
2v
It is to be noted that the total perpendicular coefficient ((Au_l)^) is
given by
{(Av^f) = [(Av^^f) + [(Av^pf) = 2((Ai;x„)')
so that
((A„,)') = Ao'^<"^-^'^'';'^<"^-^"^'' 2.13.3

2.13 Fokker-Planck coefficients for Maxwellian distributions
and
((Ai;J) = ((Ai;||J) + ((Ai;^J) = Ad
<I'(w/V2ti)
Graphs of ^(x) and ^(x) are given in Fig. 2.13.2. These functions take
the limiting forms
2x
3V^'
1
2^'
<&(x) -^ —=, X « 1,
<&(x) ^1, X » 1.
Defining the diffusion coefficients D\\ and Dj_ by
and
the Fokker-Planck collision term given by eqn 2.10.5 can be written in
either of the two forms
and
Vv-[(Ai;||>/-V||(D||/)-D^V^/]
fdf\
-Vv ■ [((Avii) - V||D||)/ - D||V|| / - D^V^ /]
2.13.5
where Vy- indicates the divergence operator in velocity space, Au|| is
along V, and V|| and Vj_ are the components of V parallel and
perpendicular to V. The term 'dynamic friction' is usually apphed to (Au||),
the coefficient of / in eqn 2.13.4, but sometimes to the coefficient
((Au||> - V||D||) in eqn 2.13.5.
Fig. 2.13.2 Graphs of the error function
<i>U), ^{x), and ^(x) - ^(x).

2.14 Relaxation processes
Relaxation processes
The calculation of the changes in the distribution function described by the
Fokker-Planck collision term is generally quite complicated. However,
it is possible to obtain some insight by considering the response of a
test particle to collisions with remaining particles. These particles are
called the field particles and are denoted by the subscript 1. Formally the
procedure is to take a delta function at a chosen velocity for the initial
distribution function and to calculate the subsequent time development.
However, the initial rate of change of momentum loss, and deflection
and diffusion of velocity are given by the Fokker-Planck coefficients
themselves and it is possible to obtain the associated relaxation times
from these coefficients.
The slowing-down time for a particles of velocity v is given by
{dv/dt) (Auii)"
This time characterizes the rate of change of velocity in the direction of
the initial velocity. Using eqn 2.13.1 for (Aun)
(l+m/mi)AD*(w/V2i;Ti)'
The deflection time measures the average rate at which the particle
velocity is scattered into the direction perpendicular to its initial velocity. This
is a diffusion process and the deflection time is defined by
{dvlldt) ((Ai;^J>-
Using eqn 2.13.3
Ad(<I>(w/V2i;ti) - *(w/V2i;ti))'
Both of the processes described above involve a change in energy of the
test particles. The equation for the full rate of change of energy, (AS), is
= |Bi;(Ai;||> + ((Ai;||J) + ((Ai;^J)).
This equation also gives the rate of loss of energy of a particle beam.
Substituting for the coefficients from eqns 2.13.1 to 2.13.3

2.14 Relaxation processes
where x = u/VZuxi. Rearranging the terms in the bracket
lm\ V
X Uiv/V2vTi) - (l + ^) ^L_<i,'(i;/V2i;ti) J .
The physical processes underlying the energy balance can be understood
by writing the dynamic friction force
Test ions
field electrons
Equal masses
and the rate of energy transfer to the field particles
d£f
- = -(A£).
Equation 2.14.3 can then be written
d£f , 1
-FdV =
dt
--m(((Ai;||J) + ((Ai;^J)).
The quantity —FdV is the work done by the test particles against the
dynamic friction force. Part of the energy so released is transferred to the
field particles and the remainder appears as increased energy of the test
particles through the increased perpendicular and parallel spread in their
velocities.
In the limit u/uxi ^ 1
Test electrons
field ions
dEf m Ad
dt m\ 2v
^ //A ^2\ '"•^D
- FdU ^ (l -
Iv '
2.14.5
2.14.6
Fig. 2.14.1 Velocity space behaviour of
test particles under collisions with field
particles for a test particle velocity much
greater than the thermal velocity of the
field particles The field particle
distribution is centred at the origin and the
test particles initially have a delta function
distribution at velocity vq
For ion test particles and electron field particles almost all of the energy
is transferred to the electrons, the ions being slowed with negligible
scattering. For particles of equal mass half the energy is transferred to the
field particles and half appears in the energy of the perpendicular motion.
For test electrons and field ions the energy is retained in the electrons,
the collisions deflecting the electrons on a sphere of equal velocity. The
behaviour in these three cases is illustrated in Fig. 2.14.1.

2.14 Relaxation processes
In the limit u/uxi < 1
d£f mAp
df 'Jlnvjx
1 mAo
{!¥-)
«((Ai;||J)
3V23
TTUxi
-FdU^
\/27ruTi 3 Ti
In this case energy transfer to the field particles only occurs for test
particles which are much more massive than the field particles, to allow
^mv^ > \T\, as with an ion test particle and field electrons. If the
particles are of similar mass then, in this limit (w/wxi <C 1)
«ri, FdU^O
and the test particles are simply 'heated', the distribution function
expanding isotropic ally. The perpendicular energy is twice the parallel energy
because two dimensions are involved.
When two species are at different temperatures collisions bring about
an exchange of heat between them, lowering the temperature difference.
For species / and j this process is characterized by the heat exchange
time Tij defined by _^
-^ = -^ -. 2.14.7
The rate of energy loss from a test particle to field particles is given
by eqn 2.14.4. The total transfer of energy from one species with a
Maxwellian distribution function to another is obtained by integrating
the test particle energy loss over the whole distribution. Thus
where {AE),j, given by eqn 2.14.4, can be written
nje^ZfZ^ In A
{AE),j = -^
= (*^^-(-avfe*>.H

2.14 Relaxation processes
Thus
7272
dr, 2«^e'*Z2z2lnA
~di ~~3i27t)y^slmimj
-- f MivJ^VTj) - A + ^) -^^'(vjVlvTj)]
Integrating the first term by parts
so that
T — I—
(„2,+„2p3/2- ■ ■
Substitution of eqn 2.14.9 into eqn 2.14.8 gives d7;/df and comparison
with eqn 2.14.7 gives the required heat exchange time
r = ^ " ' -L + ^ . 2.14.10
For electrons and single charged ions the heat exchange time is
tie = tei = ^te 2.14.11
2m e
where te is the electron collision frequency given by
2^1/27.3/2
= 3B7r)-
3/2^
J.3I
le^lnA
In this case the frequency of collisions is determined by the faster
component, the electrons. However, because of the difference in mass the
energy transfer in a collision is inefficient, only a fraction ~ me/mi of
the electron energy being transferred to the ions.

2.15 Collision times
Collision times
The characteristic times for the collisional relaxation processes described
in Section 2.14 are functions of the velocity of the test particle. Typical
values of the times involved may be obtained by taking the test particle
to have the average thermal velocity. Thus, putting u = vj and using
mvj = T itis seen that all of the resulting characteristic collision times
are proportional to a time having the form
ne'^lnA
It is convenient to define collision times with the numerical factors
which occur in the calculation of macroscopic quantities such as the
electrical conductivity. For a plasma with ions of charge Z this leads to
an electron collision time
re = 3B7r)^/^ %2 4i a ^.15.1
and an ion collision time
2^1/27,3/2
niZ'^e^lnA'
The ratio of these times, te/ti, is of order (me/my^'^ reflecting the faster
thermal velocity of the electrons compared with that of the ions.
A further characteristic time is the heat exchange between the electron
and ion components of the plasma. This is the heat exchange time given
by eqn 2.14.11.
Expressing T in keV the collision times are
te =1.09 X 10'^
«,Z2lnA '
,,{mJmp)^f^T^/\
niZ"^ In A
Values of In A are given in Section 14.5. A graph of colUsion times is
given in Section 14.6 and some typical values are given in Tables 2.15.1
to 2.15.3.

2.16 Resistivity
Table 2.15.1 Values of electron collision time, tg, for Z = 1.
n
1020 m-3
Table 2.15.2
n
lO'^m-^
1020 m-3
lOOeV
2.4/xs
0.27/xs
Values of ion
lOOeV
0.20 ms
21/xs
T
IkeV
67/xs
7.2/xs
lOkeV
1.9 ms
0.20 ms
collision time, x^, for deuterium.
T
IkeV
5.0 ms
0.54 ms
lOkeV
0.13s
14 ms
Table 2.15.3 Values of heat exchange time, tie, for a deuterium
plasma.
n
lO'^m-^
1020 m-3
100 eV
4.4 ms
0.49 ms
T
IkeV
0.12 s
13 ms
lOkeV
3.4 s
0.37 s
2.16 Resistivity
When an electric field is applied to a plasma the electrons accelerate to
a drift velocity, Ud, at which the force due to the field is balanced by the
force due to collisions with the ions. This occurs for
where x^ is the time for momentum loss by the electrons.
The resistivity is defined by Ohm's law.
so that, using eqn 2.16.1,
A rough estimate is obtained by putting tc = te, the electron collision
time given in eqn 2.15.1. To obtain an accurate value it is necessary to

2.16 Resistivity 71
solve the collisional kinetic equation for the electron distribution
function taking account of electron-electron collisions. This was done by
Spitzer and his co-workers who found that for singly charged ions the
resistivity is approximately a half of the rough estimate referred to above.
More precisely
«'/2 7
In A
??s = 0.51 f- = 0.51- -
= 1.65 X 10-^ In A/T^'^ ohm m, T^ in keV,
= 2.8 X \0~^IT^'^ ohm m, Te in keV, In A = 17. 2.16.2
The plasma resistivity is equal to that of copper for Te ^ 1.4 keV and is
an order of magnitude less at the thermonuclear temperatures required
in a tokamak. Numerical values of r] from eqn 2.16.2 are given in
Section 14.10.
Equation 2.16.2 is appropriate either in the absence of a magnetic
field or for the component of current parallel to a magnetic field. In the
direction perpendicular to a magnetic field the cyclotron motion makes
the electron distribution function more isotropic. The resulting resistivity,
T]^, is almost exactly twice r]\\. Thus
??± = -^ = 1.96??||.
If the plasma is composed of several ion species, as it is in the case of
hydrogen plasma with impurities, equation 2.16.1 beqrftties
'^h
where Xcj is the electron momentum transfer time through collisions with
ion species ;". From the requirements of charge neutrality the number of
electrons is
]
and so Ohm's law gives
E = r}^njZjeVi. 2.16.4
J
Thus, combining eqns 2.16.3 and 2.16A
Now from eqn 2.14.1 the momentum transfer times for species j is
proportional iol In jZ^ and for a hydrogen plasma containing small amounts

2.17 Runaway electrons
of impurity equation 2.16.5 becomes
where ?js is the resistivity of a pure hydrogen plasma. An effective Z can
then be defined by
2eff = :^
EnjZ]
E^jZj
n = 2eff??s
2.16.6
with Zeff = 1 for a pure hydrogen plasma.
It should be noted that eqn 2.16.5 is an approximation based on the
assumption that the higher charge states arise from small concentrations of
impurity. For plasmas composed of a single species of charge Z there is a
further weak Z dependence of the resistivity, the resistance being given by
r){Z) = N{Z)Zr){\)
with N = 0.85 for Z = 2 and TV = 0.74 for Z = 4.
A further modification arises when the magnetic geometry traps a
fraction of the electrons so that they cannot carry a current in response to
the electric field. If a fraction / is trapped the number of current carriers
is reduced by a factor 1 — / and the resistivity is increased by a factor
~1/A — /). This is discussed further in Section 4.10.
2.17 Runaway electrons
The resistivity formula given in eqn 2.16.1 is only valid if the relative
drift velocity between the electron and ion species is much less than
the electron thermal velocity. This is usually the case. For example a
current density of 1 MA m~^ at an electron density of 10^*^ has an electron
drift velocity of 6 x lO'^ms"' whereas the electron thermal velocity at
a temperature of lOkeV is 4 x lO^ms"', a ratio of ~10~^. However,
if the electric field is sufficiently high the approximations assumed in
calculating the resistivity are invalid. Indeed the concept of resistivity
fails. If the relative velocity between the electron and ion species exceeds
the electron thermal velocity the collisional force between them decreases

2.17 Runaway electrons 73
Fig. 2.17.1 The electnc field force, Ee
and the collisional force for an electron
with a velocity v^.
rather than increases with velocity. This is clearly an unstable situation
and, if the electric field is maintained, the electrons run away.
Even with smaller electric fields such that uj <C wxe for which the bulk
of the electrons do not accelerate, it is possible for a smaller number of
electrons in the tail of the velocity distribution to runaway.
The requirement for an electron to accelerate is that
mvs
where Vg is the velocity of the electron and tg is its slowing down time
given by eqn 2.14.1. For Ue » uxe, tg a v^ and hence the collisional drag
decreases with increasing velocity as l/We ■ A graph of the two terms in
inequality 2.17.1 is shown in Fig. 2.17.1.
For Ue » UTe. the electron slowing down time due to collisions with
electrons is
47re;
•?™2,,3
The slowing-down time for ion collisions, tji, is a half of tge. Since the
drag is proportional to l/tg, the total slowing-down time is given by

2.17 Runaway electrons
Substitution of eqn 2.17.2 into inequality 2.17.1 gives the critical velocity,
Vc, above which runaway would occur
9 3ne^ In A
"c = 7—2 ^
= 23xlO~'^-m^s~^, lnA = 17 2.17.3
This corresponds to a critical energy
ec = 6.6x 10-'^|;keV.
This picture of electron runaway is oversimplified. It gives the velocity
above which electrons would run away at the sudden application of an
electric field. However, on a longer timescale, the rate of electron runaway
is determined by collisional diffusion in velocity space. As the faster
electrons runaway they are replaced by electrons diffusing through the
tail of the velocity distribution. Detailed calculations give the resulting
runaway rate per unit volume
where the Driecer electric field, Ej), is given by
ne^ In A
£d =
47reQmeWfe
When the electric field is sufficiently small the critical velocity
calculated from eqn 2.17.3 approaches the velocity of light. The equation is then
no longer valid. For relativistic electrons the slowing down time is almost
constant and the essential reduction of drag with increased momentum
no longer occurs. Thus the runaway process does not occur for electric
fields such that
ne^lnA
Another process which can put electrons into the runaway region
of velocity space arises from close collisions between already existing
runaway electrons and the thermal electrons. Although test particles
in a plasma are mainly affected by the sum of large impact parameter
collisions with small momentum transfer, the smaller number of close
collisions which transfer larger momentum are more important in this
process. The relevant close collisions in this case are those which lift a
slow electron above the critical velocity for runaway.

2.18 Electromagnetism
75
The momentum transferred to the slow electron by a fast electron is
principally perpendicular to the velocity, Vf, of the fast electron and is
given by
teAu ^ IrrieVf
ro
where r is the impact parameter and ro (= e^/47t£omeVJ) is its value for a
90° scatter. For the collision to transfer the electron to the runaway region,
Av must be greater than the critical velocity given by eqn 2.17.3, that is
Au > Uc. This requirement gives a cross-section for runaway production
Ee
3nmevj In A
2.11 A
Taking the fast electrons of the already existing population of runaway
electrons to be relativistic, the rate of production of new runaway electrons
by close collisions is Rf = nnr^c, that is, using eqn 2.17.4
1 Ee
Rf = TTrT—-
Thus, since niec/Ee is the time, to, taken for an already existing runaway
electron to gain a rest mass energy, mgC^, from the electric field, the
average time, r^, for a relativistic electron to produce a new runaway
electron may be written
tj. = 31n AtQ.
During this time the fast electron would increase its en^gy by an amount
EecTj, that is
ASf = 3lnAimoc\
and so a new runaway electron is produced each time an existing runaway
increases its energy by this amount. For a constant electric field this
process leads to an exponential growth in the runaway electron current
with an e-folding time tj..
2.18 Electromagnetism
The fundamental equations relating the electric and magnetic fields E
and B are Maxwell's equations
1 dE
2.18.1
2.18.2

2.18 Electromagnetis
with
V-B=0 2.18.3
and
V ■£ = — 2.18.4
where j is the electric current density, Pc is the electric charge density,
and
/xo = 47r X 10~^ henry m~',
eo = l//xoc^ = 8.854 x 10~'^ farad m"',
c = 2.998 X loVs-'.
In magnetic and dielectric media it is convenient to separate the atomic
and polarization currents from j and write eqn 2.18.1 in the form
dD
where j^ represents the macroscopic currents and, in uniform and
isotropic media,
B = ixH D = sE
where /x is the permeability and e the dielectric constant.
In a plasma, eqn 2.18.1 is appropriate but when describing linear waves
the dielectric tensor K is defined to include the effect of the oscillating
part, 7, of the current density so that
dE dE
j+so-=soK-.
Since V • B = 0, B can be written
B = VxA 2.18.5
where A is the vector potential. Substitution of eqn 2.18.5 into eqn 2.18.2
gives
Thus the quantity in brackets may be expressed as the gradient of a scalar
potential so that
E = -V(p-^. 2.18.6

2.19 Fluid equations 77
The potentials A and </> are not uniquely defined since it is possible to
make a gauge transformation
df
which leaves the fields E and B, calculated from eqns 2.18.5 and 2.18.6,
unchanged.
The electromagnetic energy density, 8, is given by
S = eo— + -.
2 /xo 2
Using eqns 2.18.1 and 2.18.2 it is found that the time rate of change of 8
is given by
d8 fExB\
_V . )-E-j.
The term E ■ j represents the transfer of energy to the charged particles.
The first term is the divergence of the flow of electromagnetic energy,
this flow being given by the Poynting vector
„ ExB
For static fields the curl of eqn 2.18.5, together with eqn 2.18.1 and
the choice of the gauge V • A = 0, gives
V^A = -ixoj
and the divergence of eqn 2.18.6 together with eqn 2.18.4 gives
2.19
Fluid equations
The kinetic equations describe the plasma in terms of the distribution
function f{x, v, t) which is a function of seven variables. For many
purposes it is adequate to describe the plasma in terms of fluid variables such
as the particle density n{x, t), fluid velocity vix, t), and pressure pix, t)
which are functions of only four variables. The required equations are
derived for each species of particle from the kinetic eqn 2.9.4
df ,dfF df /df\
-^ + v-T- + -■^, = \^] 2.19.1
dt dx m dv' \ dt /(,
where F is the force on the particle, the symbol v' now being used to
distinguish the particle velocity from the fluid velocity v. Equation 2.19.1

2.19 Fluid equations
is multiplied by chosen functions </>(«') and integrated over velocity space
to obtain equations for
= /
f{x,v',t)dv',
\ r , , ,
- I f(x,v ,t)v dv ,
ml f{x,v',t){v'-v){v'
where P is the pressure tensor. For an isotropic distribution function the
pressure is scalar and is given by
-.\mjn...'.
t)iv' - vydv'.
Thus the (/> = 1 moment of eqn 2.12.1 gives
dn
Jt"' dx J
r , , \ f dF
- v'fdv'-- --Jdv' = 0 2.19.2
c J m J dv'
where the third term has been integrated by parts and, considering only
collisions which do not change the number of particles, the integral over
the collision term is zero. Since dF/dv'is zero for electromagnetic forces
eqn 2.19.2 gives the continuity equation
dn
_ + V-(nu) = 0. 2.19.3
The momentum equation is obtained by taking the mv' moment of
eqn 2.19.1 to obtain
2.19 A
where again the third term has been integrated by parts. The collision
term represents the rate of change of momentum R due to collisions with
all other species. Thus eqn 2.19.4 becomes
^1 („„) + m^ j v'v'fdv' - nFiv) = R.
This equation may now be put in a more convenient form by writing
v' = (v' — v) + V to obtain
3
m—{nv) + V • P + mV- (nvv) -nF = R.
Then eliminating dn/dt using the continuity eqn 2.19.3 ^westhe equation
of motion
nm(^ + v-Vv]=-V ■ P+nF + R. 2.19.5

2.20 Magnetohydrodynamics 79
In a plasma the force on a particle is F = Ze{E + u x B), where Ze is
the particle charge, and eqn 2.19.5 therefore becomes
nm (— + V ■ Vu j = -V • P + nZe(E + vxB) + R. 2.19.6
It is seen from the above procedure that the equation for the time
dependence of the zeroth moment, n, introduces the first moment v, and
that the equation for the time dependence of v introduces the second
moment P. In calculating the equation for P the third moment is
introduced and so on. This procedure does not therefore lead to a closed set of
equations. Closure is usually achieved by making simpUfying
assumptions in the equation for P. For example it is often assumed that the
motion is adiabatic or that the third moment, the heat flux vector, may be
calculated using a simple form of thermal conduction.
The formal validity of the fluid equations rests on the behaviour being
sufficiently localized. This is achieved if the mean free path of the
particles is sufficiently small compared to the macroscopic lengths under
consideration. At high temperatures the mean free path is long and this
justification of the equations fails. For motion perpendicular to the
magnetic field the Larmor radius can provide the necessary localization. The
fluid equations will also fail when the scale length under consideration is
so small that it is comparable with the Larmor radius of the particles.
Magnetohydrodynamics
Magnetohydrodynamics, or mhd, is the name given to the single fluid
description of the plasma. In this model the separate identities of the ions
and electrons do not appear.
The equation of mass conservation is
^ = -V • (pi;) 2.20.1(aj
or
-^ = -pV • V 2.20.1(b)
at
where p is the mass density, v the fluid velocity, and d/d? is the derivative
(d/dt + v- V). Sometimes the fluid is taken to be incompressible in which
case dp/dt = 0 and V • u = 0.
The rate of change of velocity is given by the equation of motion
p(^ + v-Vv\=j xB-Vp. 2.20.2
In order to calculate the pressure gradient force an equation for p
is required. The simple non-dissipative model usually used assumes

2.20 Magnetohydrodynamics
adiabatic behaviour, that is
implying conservation of entropy. If the density is eliminated using
eqn 2.20.1 then eqn 2.20.3 becomes
• Vp - KpV • V 2.20.4(aj
dp
-f = -j/pV • V. 2.20Aib)
at
If the fluid is taken to be incompressible, V • u is then zero. However,
ypV ■ V is not zero, incompressibility corresponding to the limit y ^- oo.
The appropriate procedure in this case is to eliminate p from eqn 2.20.2 by
taking the curl ofthe equation and to use the separate equations dp/d? = 0
and V • u = 0 arising from the continuity equation.
The coupling to the magnetic field arises through the force y x B. In the
mhd model the displacement current in Maxwell's equation is neglected
and the current density is therefore given by Ampere's law
lxoj = VxB. 2.20.5
The rate of change of B is given by the induction equation
— = -W X E. 2.20.6
dt
It is now necessary to determine E in terms of the other variables. In the
model of ideal mhd the plasma is taken to be perfectly conducting. Thus
in the local frame of the moving fluid no electric field can be sustained,
and consequently
E + vxB = 0. 2.20.7
Equations 2.20.1 to 2.20.7, which are summarized in Table 2.20.1,
together with V -B = 0, constitute the ideal mhd model. A simple
modification of these equations leads to the model of resistive mhd. It is only
necessary to replace eqn 2.20.7 by Ohm's law
E + vxB = r]J 2.20.8
and the adiabatic equation by
where r] is the resistivity of the plasma.

2.21 Physics of plasma fluid
Table 2.20.1 The equations of ideal mhd.
dp ^
d?
dv
dp _
-pV • V
j xB-Wp
-ypV ■ V
7 = V X B/fMQ
E+vxB=0
2.21 Physics of plasma fluid
The behaviour of plasma in experiments is usually complicated, and
influenced by the particular circumstances of the experiment. However the
fluid equations presented in the previous sections give rise to a number
of more basic questions. Since the physics involved provides an insight
into the properties of plasma some of these matters are discussed below.
Fluid velocity
The fluid velocity of a constituent species of a plasma at a given point is
simply the mean velocity of the particles of that species in a small volume
around that point. However, as described in Section 2.^he gyro-averaged
velocity of particles is the velocity of their guiding centres. Generally the
fluid velocity and the velocity of guiding centres at a given point are not
the same. For example in a non-uniform plasma in which the ion guiding
centres are stationary there will be a finite ion fluid velocity. The relation
between these velocities is exemplified in the phenomenon of plasma
diamagnetism which is described in Section 2.22.
Pressure balance
In a steady plasma with a scalar pressure the force balance for each species
njejiE + vj xB) = Wpj. 2.21.1
In the frame for which the velocity of a given species is zero the pressure
gradient is balanced by the electric field force, that is
njejE = Vpj.
Alternatively, in the frame in which E = 0
njejVjxB = Vpj.

2.21 Physics of plasma fluid
This freedom of description is removed when the complete plasma is
considered. Thus summing eqn 2.21.1 over the species
E'^^J^J + ^^jejVj^B = '^P- 2.21.2
Since the plasma is almost charge neutral the first term in eqn 2.21.2 is
negligible and the equation becomes
jxB = Wp. 2.21.3
Using Ampere's law for j in eqn 2.21.3
— (VxB)xB = Vp 2.21.4
and using the vector relation
(V X B)xB = EVE - VB^/2
eqn 2.21.4 becomes
Vp = -V + —EVE. 2.21.5
2/^0 fiQ
The last term in eqn 2.21.5 is the result of field line curvature, E -VE
being along the radius of curvature, and the radius being given by i?^"' =
\b • Vb\, where b is the unit vector along E. If the magnetic field lines
are straight the magnetic field gives a scalar pressure B'^/Iimq and
Pressure tensor
The force arising from the pressure tensor P in eqn 2.19.5 is
v^ d
When P has an isotropic pressure component, it can be written
Pa^ = P&ap + ^ap
p being the scalar pressure. The term Oq,^ results from plasma velocities
and can often be written as a linear function of the velocity gradients.
When this is the case the term stress tensor is used for both Pa^ and Oq,^ .
It will here be reserved for Tlap.
In a normal fluid the linear velocity gradient terms in Oq,^ arise from
viscosity and the resulting tensor is called the viscosity sfress tensor. For a

2.21 Physics of plasma fluid 83
plasma in a magnetic field the corresponding tensor is more complicated
and includes non-viscous effects. For velocities and gradients along the
magnetic field the normal collisional viscous effect occurs, the viscosity
being dependent on, and increasing with the mean free path. However,
for velocity gradients perpendicular to the magnetic field the momentum
transfer is limited by the Larmor orbits and, the effect of the velocity
gradients is much reduced. The full pressure tensor for a collisional plasma
is given in Section 2.23.
Sometimes the pressure is anisotropic as a result of the magnetic field.
Writing p|| and p± for the pressures parallel and perpendicular to the
magnetic field the force Vp is replaced by
V_LP_L + V||P||
where V|| and Vj^ are the gradients parallel and perpendicular to the
magnetic field.
'Frozen in' magnetic field
In a perfectly conducting fluid the electric field in a frame moving with
the fluid velocity, v, is zero, that is
E + vxB = 0 2.21.6
It will be shown below that the magnetic flux through each surface moving
with the fluid is constant and consequently that the magnetic flux can be
thought of as frozen-in to the fluid and moving with it. Thus although at
each point there is a fluid velocity v and the term v x B exists, it is also
true that eqn 2.21.6 implies the convection of the magnetic flux with the
fluid.
Consider an arbitrary bounded surface S in the fluid. The magnetic
flux through this surface is
<&= f B-dS.
The time derivative moving with the fluid is
d<&
d<& /■ 9B „ i „
— = / dS+(p B 'vxds,
dt J dt J
where the second term describes the change of flux across the surface
boundary as the local magnetic field is swept by the line element ds at a
rate vxds.

2.22 Plasma diamagnetism
From Stokes' theorem
(j) B ■ vxds = - / Vx(u X B) • dS
and using Faraday's law, dB/dt = -V x E, eqn 2.21.7 becomes
d* r
— = - / Vx(£ + uxB)-dS
Thus, since E + v x B = 0
d<&
—- = 0
and the magnetic flux through every surface moving with the plasma is
constant.
Polarization
Consider a perfectly conducting fluid in a magnetic field to which an
electric field, Eit), is applied perpendicular to the magnetic field. Since
E + v X B = Othe fluid will move with a velocity
This velocity is produced by a current j in the direction of E, through the
force j X B. Thus substituting eqn 2.21.8 into the equation of motion
-jxB
p d£
Equation 2.21.9 shows that a polarization current flows and that the fluid
has a dielectric constant
B^/flQp'
where c is the velocity of light. The velocity fi/(/Aop)'^^ is the velocity
characterizing Alfven waves which are discussed in Section 2.24.
2.22 Plasma diamagnetism
In the early investigations of the magnetic properties of solids it was
found that rods of some substances aligned themselves to the magnetic

2.22 Plasma diamagnetism
Fig. 2.22.1 Ions with a given velocity
having Larmor orbits on a cylinder
produce a magnetic field SB inside the
cylinder, this field being in the opposite
direction to the total magnetic field B.
B field. These were called paramagnetic. Rods of other substances aligned
themselves across the magnetic field and were therefore called diamag-
netic. The cause of this behaviour is that in paramagnetic substances the
response of the material is to enhance the applied magnetic field whereas
in diamagnetic substances the field is diminished.
Plasmas in magnetic fields are naturally diamagnetic, the gyro-orbits
of the charged particles being such as to reduce the field. This is easily seen
by considering the orbits of particles with a given velocity perpendicular
to the magnetic field with the centres of their Larmor orbits on a particular
field Une as illustrated in Fig. 2.22.1. The figure shows the behaviour of
ions. Electron gyrate in the opposite direction but carry a negative current.
The particles lie on a cyUnder and each contributes a current ej co^j jln.
If there are Sn particles per unit length, their orbits produce a cylindrical
current per unit length
Si--
±Sn
and using a
The minus sign indicates that the current is in the opposite direction to
that producing the main field B. From Ampere's law the magnetic field
resulting from this current is BB = fioSi, so that j^
Inm
-^SnB,
and SB is independent of the sign of the charge as expected.
Considering now the more general case with a distribution of particle
velocities, let the magnetic field be in the z direction and consider those
particles with velocity w_l perpendicular to the magnetic field. These
particles contribute to the magnetic field at a given point if their orbit
centre Ues within a Larmor radius, v_i/cOcj, of that point. The sum of the
currents of such particles in a velocity space element d^v gives a current
per unit length
^ wj_ '
COcj_
fjd'v
= -:^vlfid'v
where fj is the distribution function. The resulting magnetic field is
.„ .,,,-. 2.22.1
2fi

2.22 Plasma diamagnetism
and integrating over the velocity distribution
= -^« 2.22.2
B
where pj is the particle pressure.
It is seen that the circular orbits of particles of species ; produce a
field Bsj in the opposite direction to the applied field, and the full field
fis is obtained by summing over the species ; to obtain the diamagnetic
field
fis = -^ 2.22.3
B
where p is the plasma pressure. This result is a low ^ approximation. If
the applied magnetic field is fio and the exact diamagnetic field is fid) the
pressure balance equation
(Bo + Bdf ^ ^Bl_
2ixo 2ixo
gives the full equation for fid
5^fl-i!^) = -—• 2.22.4
V 2fio; fio
In the low-;S approximation, p <^ Bq/2hq, the term involving B^ is
small and fid ^ B^.
The full pressure balance is obtained by recognizing that the gradient
in the magnetic field leads to a drift of the particle orbits and the resulting
current produces a further magnetic field. The current associated with
the magnetic field fis arising from the stationary orbits is obtained by
applying Ampere's law, with the present geometry, to eqn 2.22.3
= &x V
(D-
where b is the unit vector along B. From the force balance equation
J X B = Wp and the total current is
B
and so the residual current is
j-J, = bx^VB. 2.22.5
That this is equal to the current, 7d' caused by the magnetic field gradient
drift is seen by writing
yd = E"^^^-<"d7> 2.22.6

2.22 Plasma diamagnetism
Fig. 2.22.2 Showing how a density
gradient of stationary orbits give rise to a
current. The current arises through a local
imbalance of upward and downward
moving particles as illustrated in the
where Vdj is the drift velocity given by eqn 2.6.6 with pj = mjV±j/ejB
and {v]_.) = 2vjj so that
and, since rijmjVj- = pj, the drift current given by eqn 2.22.6 is
Thus eqns 2.22.5 and 2.22.7 give the required result
showing that the total diamagnetic current is the sum of the current due
to the circular orbits and that due to their drift. The primary diamagnetic
effect arising from the magnetic field of circular orbits is at first sight
surprising since the orbit is stationary and its averaged current is zero.
For a uniform plasma the diamagnetically induced magnetic field given
by eqn 2.22.2 is constant and the diamagnetic current inside the plasma
is indeed zero. However, there has to be a gradient in plasma pressure
between such a region and the surrounding vacuum magnetic field and
it is this gradient which provides the necessary current from stationary
orbits. This is illustrated in Fig. 2.22.2 for the case with a density gradient
only. With a temperature gradient the imbalance of neighbouring orbits
arises from their different orbital velocities.
The discussion in this section is restricted to the case of straight
magnetic field lines but illustrates the care required in keeping a clear
distinction between the guiding centre motion of individual particles and
the current which they contribute at a given point in space. The two
descriptions of the plasma must of course always be consistent but in
more complicated geometries the relationship is quite complex.

2.23 Braginskii equations
2.23 Braginskii equations
The fluid equations for a plasma are derived by taking moments of the
kinetic equation as described in Section 2.19. However these equations
contain quantities which are undetermined. The required quantities are
the rate of change of momentum due to collisions, the pressure tensor, the
heat flux and the heat generated as a result of collisions. In order to
determine these quantities it is necessary to solve the kinetic equation 2.19.1
with the collision term given by the Fokker-Planck equation as given in
eqn 2.12.5 or 2.12.6. A complete solution of these equations is not
possible. However, if the microscopic variables are taken to vary slowly in
space and time, an expansion procedure allows the required quantities to
be calculated. Such calculations have been carried out by a number of
workers, but Braginskii has given a clear and comprehensive presentation
and the resulting equations are often given his name.
The underlying idea is that the distribution functions can be expanded
about a Maxwellian distribution. That is
/ = /o + 5/
with
/o =
B7rr,7m;K/2
\2Tj'
where v' is the velocity coordinate and v is the mean velocity of the
particles. In a uniform plasma, in which the species are stationary and have
the same temperature, the distribution function is Maxwellian and the
collision term in the kinetic equation is zero. If small gradients and drift
velocities are now introduced the change, Sf, in the distribution function
makes the collision term in the kinetic equation non-zero. The procedure
is to solve the resulting kinetic equation and determine the collisional
response to the gradients and drifts. This provides formulas for the
collisional drag, viscosity and thermal conduction and closes the set of fluid
equation. The unknown fluid variables, including the pressure tensor and
heat flux, can then be determined by solving these equations.
The form of the transport coefficients can be partly anticipated. For
example the thermal conductivity parallel to the magnetic field is related
to the mean free path. A, and the collision time, r, by the usual random
walk relation, giving the familiar result
nTr

2.23 Braginskii equations 89
For conduction perpendicular to the magnetic field the step-length
becomes the Larmor radius and
the thermal conductivity being reduced by the usually very large factor
The formal calculations determine the precise numerical coefficients
and also introduce a number of less familiar physical transport processes.
These calculations are quite complex and will not be described here. The
equations of continuity, momentum balance and energy balance will be
introduced separately with some discussion of the underlying physics.
The equations given are derived on the assumption that the plasma is
sufficiently collisional that the mean free path is short compared to the
macroscopic lengths involved. The transport coefficients given are for
a singly charged species (n,- = Ug = n) and for cocete and cociti much
greater than one. The basic electron and ion collision times which appear
in the transport coefficients are defined in Section 2.15.
Continuity equation
The continuity equation for species j, electrons or ions, is
where the total derivative ''
Thus, moving with the fluid, density changes arise from compressibility.
For incompressible motion V • Vj and dn^/d? = 0. Equation 2.23.1 can
alternatively be written
-^ = -v.(„.,)
expressing the density change at a stationary point as the divergence of
the particle flux Tj = nvj.
There is no collision time in eqn 2.23.1 because, unlike say ionization
collisions. Coulomb collisions do not change the number of particles.
Momentum equation
The momentum balance equation is
"^■'"^'"ir ^ ~^^^ ~ ^^Jap+'^J^jiE + "jxB) + Rj 2.23.2
where the pressure pj = rij Tj and repeated Greek indices imply
summation over the repeated index. The stress tensor Tlja^ is complicated and

2.23 Braginskii equations
will be given below. Rj is the rate of momentum transfer due to collisions.
The total momentum change in collisions is zero and so, ^,- Ri = —Re.
The rate of momentum transfer from ions to electrons is given by
Re = Ru + Rt,
Ru being the friction force and Rj the so-called thermal force.
The friction force is
Ru = ^@.5 1m II +u±) = ne(??||;|| + ??_l;_l)
ri is the electrical resistivity, and the subscripts || and ± refer to the
directions parallel and perpendicular to the magnetic field. This force
constitutes the resistivity which was discussed in Section 2.16.
The thermal force is
Rx = -0.71nVIITe - ^ —~b x VTe, 2.23.3
b being the unit vector parallel to the magnetic field. Although the first
term does not involve the collision time it is nevertheless a result of
collisions. Consider the ions lying in a sheet perpendicular to the magnetic
field. Electrons passing through this sheet in the direction of the electron
temperature gradient lose momentum at a rate, VerienieVe where Vg is the
collision frequency. Electrons travelling in the opposite direction lose
momentum of opposite sign. However, although the fluxes nve will be
equal, the values of Vg will be different. The electrons coming from each
side will have a collision frequency characteristic of the temperature at
their point of origin, that is the position of their last collision a mean free
path away. The rate of momentum loss is therefore
i?T|| ~ AVeWeWei^e 2.23.4
where Ave, the difference in Vg on the two sides, is given by
Ave~A|V||Ve| 2.23.5
where A is the mean free path. Now Ve = tg"' a Te' ^ and so
V||Ve~^V||re~-^V||re. 2.23.6
II ^j,^ II Te "
Using X - vie/Ve, eqns 2.23.5 and 2.23.6 give

2.23 Braginskii equations 91
Since the velocity iie ~ vje and v^^ = Te/nie, the form of the thermal
force on the electrons, given by relations 2.23.4 and 2.23.7 is
Kt||
--neViiTe.
More
coUisional
Fig. 2.23.1 Electrons colliding with an
ion have velocities characterized by the
temperature an electron Larmor radius
away. In the presence of a temperature
gradient there is a difference in
coUisionality between the two sides, the
hotter electron having a lower
coUisionality. The resulting coUisional
imbalance leads to a force on the ion and
an equal and opposite force on the
electrons, the force being perpendicular to
the temperature gradient.
The sign of the force on the electrons is clearly in the direction of—V n Te
because the electrons from the colder side are more coUisional and are
therefore subject to the larger force.
The absence of the collision time in the expression for Rt|| arises from
the fact that, although less momentum is transferred by electrons if they
have a longer collision time, the difference in collision time between
the two sides is proportional to the mean free path and this itself is
proportional to the collision time. Thus the effects cancel.
The thermal force on the ions is equal and opposite to that on the
electrons, the colder electrons transferring more momentum than the hot
ones and hence producing a force in the direction of VTe. In a steady
state the thermal force on the electrons gives rise to an electric field
which provides a balancing force. The equal and opposite thermal force
on the ions is similarly balanced by this electric force.
The ft X VTe term in eqn 2.23.3 has a similar origin. The
electrons colliding with ions around a given point have different
directions according to the position of their guiding centre as illustrated in
Fig. 2.23.1.
As before, the rate of momentum loss is ~ AvgWeWeiie but the length
which characterizes Avg is now the Larmor radius Pe and not the mean
free path. Thus ,'
WTe V
The rate of momentum loss is
Rj± ~ AVe«eWeWTe
and substituting relation 2.23.8 with Ve =
Rtl ~ —"-nelV^Tel.
Wcete
From Fig. 2.23.1 it is seen that, since the colder electrons are subject to
the greater force, the thermal force on the electrons is in the direction
-b xVTe and consequently
1

2.23 Braginskii equations
The stress tensors Tliap and Oeajg for ions and electrons appearing
in eqn 2.23.2 both take the same form. In a strong magnetic field
(cOcjTj » 1)
n^X = -^miW^X + Wyy) - ^ridW^^ - Wyy) - Tj^Wxy
Tlyy = -^noiW,, + Wyy) - ^^liWyy - W,,) + TJ^W^y
n^y = Tly^ = -rilW^y + ^miW^X - Wyy)
n^^ = n,^ = -mw^, - r]4Wy,
Yly, = n,y = -mWy, + ??4W^;CZ
where the z-axis is parallel to the magnetic field and the rate-of-strain
tensor
The ion viscosity coefficients are
??[, = 0.96niriri
i 3 mTi i i
''3 = ^7^ ''4 = 24
and the electron viscosity coefficients for Z = 1 are
r]l = 0.73ne7;re
??i=0.51-^— ??2 = 4??i
Energy equation
The energy balance equation is
3 dr.- dvja
-„-gi = -p,v..,-v.,,-n,.,^ + e,.
The electron heat flux is
where
ql = nT^ f 0.71«|| + -^^b x «^
V kcelte /

2.23 Braginskii equations
and the ion heat flux is
- "^'"^ I-3.9VII Ti - -4^WxT, + ^b
X VTij
The heat exchange between ions and electrons due to collisions gives rise
to the ion heating
m-i te
and the heating of the electrons due to collisions with the ions is
2 2 1 .
= '?ii;ii +ri±j± + —j ■
As explained at the beginning of this section the ratio of parallel to
perpendicular thermal conductivity is (cOcjXj)^. This ratip is large for both
ions and electrons, typical values being lO'^ and lO'^ respectively. In the
direction parallel to the magnetic field the electron thermal conductivity
is larger than that of the ions by a factor ~(mi/me)'^^ because of their
longer collision time. Perpendicular to the magnetic field the
relationship is reversed because of the larger ion Larmor radius, the ion thermal
conductivity being larger by ~(mi/me) '^^.
The heat fluxes arising from ft x VT are analogous to the diamagnetic
current, the imbalance between the energy carried by particles with their
guiding centres in the hotter and colder regions providing a heat flux. The
electron and ion fluxes are of opposite sign and cancel at equal
temperatures. Furthermore, because the heat flux is perpendicular to V T it flows
along isotherms and does not cool the plasma.
The ohmic heating, r]j^, appears in the electron equation only. This
is because an electron colliding with an ion transfers only a small
fraction ~me/mi of its energy to the ion. Consequently the scattering of the
directed relative motion leads to a predominant heating of the electrons.
The same inefficiency of energy transfer explains the appearance of the
factor me/mi in the heat exchange term. Thus the heat exchange between
ion and electron species at different temperatures occurs at a slower rate
than the other relaxation processes.
The term involving the stress tensor and velocity gradients describes
the viscous heating of the plasma.

2.24 Plasma waves
Plasma waves
The wave properties of plasmas are extremely complex. In this section
some of the simpler waves in uniform plasmas are introduced.
The general procedure is to solve Maxwell's equations together with
the linearized plasma equations. In the absence of plasma Maxwell's
equations give the familiar vacuum electromagnetic waves with a
velocity c. The inclusion of plasma effects introduces the one
remaining term to Maxwell's equations, namely the current in the equation for
V X B. Thus the addition of the plasma effects requires a calculation of
the perturbed plasma current in terms of the perturbed electric field. This
amounts to a calculation of the dielectric tensor.
Maxwell's equation combine to give the electromagnetic wave
equation which may be written
V X V x£: = —
132.
97
3?2
In a uniform plasma all of the perturbed quantities can be taken to be
sinusoidal in space and time. It is algebraically convenient to write the
perturbed quantities in the form
Aiixj) =Re[Aie'(
'h
where Ai is a complex ampUtude and k is the wave vector. For simplicity
the symbol Re is not written, but is implied, in all of the linearized
equations and circumflex on the symbol A is dropped. Thus the curl
operator can be replaced by i^: x and eqn 2.24.1 becomes
-kxkxE=^E+icoixoj. 2.24.2
The dielectric tensor K (sometimes represented by e) is defined by
KE
--E + —J
SqU)
2.24.3
and eqn 2.24.2 can be written
kxkxE + ^KE = 0.
When the current j is determined in terms of E, eqn 2.24.3 gives K and
substitution of KE into eqn 2.24.4 gives the relationship between <y and
k, that is <y = <y(^:). This is called the dispersion relation. The refractive

2.24 Plasma waves
index, n, is defined by n = |n| where
kc
is the ratio of the velocity of light to the phase velocity of the wave.
Although the procedure described above gives the formal basis of the
calculation of the properties of plasma waves, the underlying physics is
often seen more clearly by writing each of the relevant Maxwell equations
separately, and this method will be followed below.
In each equation the variables are written as the sum of the equilibrium
part and the perturbation, that is
A = Aq + Ax.
Then taking the perturbations to be sufficiently small the equations are
linearized by subtracting the equilibrium equation and dropping nonlinear
terms in the perturbed quantities. In the following calculations the basic
equations are given together with their linearized forms.
Plasma oscillations
Plasma oscillations were discussed in Section 2.3. Their frequency will
be recalculated here using the formalism described above. Plasma
oscillations are longitudinal oscillations, the electrons being displaced in the
direction of the wave vector. This gives rise to a restoring electric field
resulting in the oscillatory motion. In terms of MaxweU^s equation this
means that the magnetic field plays no role and the right hand side of
the equation for V x B is zero. That is, the plasma current and the
displacement current cancel.
The oscillations are governed by the equation of motion. Coulomb's
equation and the continuity equation, as given below
me—- = -eE -^ - nieicovei = - eE\ 2.24.5
^ dt
V . £ = -n^e/sQ -^ ik ■ Ei= - n^xe/sQ
drie
—- = —V • (neJ^e) -^ — icoriei = — inok ■ Vei-
Combination of these equations gives (o = cop, where
^ \SQrnJ
is the plasma frequency. Although the wave vector appears in the
relationships between the physical variables, the oscillation frequency is
independent of ^:. The effect of finite temperature on the dispersion
relation is given in Section 2.25 where the non-collisional damping of thermal
plasma oscillations is calculated.

2.24 Plasma waves
Transverse electromagnetic waves
In a transverse electromagnetic wave the perturbed electric and magnetic
fields are both perpendicular to the wave vector. In a vacuum the
magnitude of the electric field is simply E = cB, but when a plasma is
introduced the electric field drives an electron oscillation, again in the
direction perpendicular to k.
When the plasma response is significant the electromagnetic wave
can alternatively be thought of as a plasma oscillation with a
magnetic induction contribution to the electric field. Whereas in electrostatic
plasma oscillations the terms ixqJ and (l/c^)dE/dt cancel, in the
electromagnetic oscillations these two terms are unequal and the difference is
balanced by V x B. The inductive effect of this magnetic field becomes
weaker at small k and as ^: ^- 0, the frequency <y ^- (Wp.
Equation 2.24.2 can be written
k^Ei = %Ei -|-i<y/Ao7i 2.24.6
and Uei is given by eqn 2.24.5. Making the substitutions, eqn 2.24.6 gives
the dispersion relation
0,2 = k^c^ + 0,2. 2.24.7
It is seen that, for a given frequency, as the density of the plasma is
increased to increase (Wp, a critical point is reached where cop = ca and
k^ becomes negative. This shows that undamped propagation of
electromagnetic waves in a plasma can only occur if <y>&,p. For uxcop, k
becomes imaginary and under such conditions the wave decays. When
an electromagnetic wave enters a plasma with a spatially increasing
density, propagation can occur up to the point where co = cop and the wave
is then subject to a cut-off.
In the above description the electrons have been taken to be cold.
However even at finite temperature the electron pressure will not play a
role because the gradients arising from k are orthogonal to the electron
motion.
Sound waves
In the calculations for plasma oscillations and transverse electromagnetic
waves the ions were neglected. At the high frequencies of these waves
the large ion mass prevents a significant response. However at lower
frequencies ion oscillations become possible in the form of sound waves.
These are similar to sound waves in a gas, but the electron pressure
contributes to the ion motion through coupling provided by the electric
field.

2.24 Plasma waves 97
The equation of motion for singly charged ions is
dv\
n\m\— = nieE - Vpi -^ -iconnnvn = neEx -ikpn- 2.24.8
The inertia of the electrons is negligible and so the force balance equation
for the electrons is
0 = -n^eE - Vpe ^ 0 = -neEx - ikp^x. 2.24.9
Adding eqns 2.24.8 and 2.24.9
—iconm\v\x = —ik{p\x +Pei) = —i^Pi. 2.24.10
For these waves quasi-neutrality is preserved, and from the continuity
equations
^ = -v. („,.,)
^ = -v.<„..,
^
-
-ia)n\x= -ink ■ un
— icowei = —ink ■ Vsx
it is seen that the requirement Wei = «ii implies Uei = vn (=«i). To
obtain the dispersion relation, p i is related to w i by assuming the electron
and ion motions to be adiabatic so that
dp
— = —yp'V-v -^ —icopx=—iypk-vx- 2.24.11
Substitution of eqn 2.24.11 into eqn 2.24.10, with vn = vx, now gives
where the sound speed Cg is given by
C^ = yEi±Pl_ 2.24.12
Magnetohydrodynamic waves
The waves described so far have been in plasmas with no magnetic field
or, if there is a magnetic field the wave direction is such that the particle
motions were parallel to it, and therefore unaffected by it.
There is a class of waves described by the mhd equations for which the
magnetic field plays a central role. There are three types of wave. Firstly
there is the shear Alfven wave. This is an incompressible wave and it
is therefore unaffected by the plasma pressure. The other two involve
compression and their wave velocities involve both the Alfven speed and
the sound speed. Because of this they are called magnetosonic waves.
These two waves are distinguished by their velocities, being called the
fast and the slow magnetosonic waves.

2.24 Plasma waves
Shear Alfven wave
The simplest form of the Alfven wave occurs when the wave-vector is
parallel to the magnetic field. This case is illustrated in Fig. 2.24.1. The
elasticity is provided by the magnetic field, the curvature of the bent field
lines giving a B V B force in the opposite direction to the plasma
displacement. The inertia is provided by the mass density, coming essentially
from the mass of the ions.
A convenient way to describe the general Alfven wave and its relation
to the magnetosonic waves is to assume a uniform magnetic field and
to take a coordinate system with the x-axis along the magnetic field and
the wave-vector k in the (x, 3;) plane. In this coordinate system the fluid
displacement of the Alfven wave is entirely along the z direction. The
geometry is shown in Fig. 2.24.2.
The governing equations are the mhd equations given in Section 2.20.
These are written below together with their linearized forms taking the
perturbed quantities to vary as exp[i(—<y? -f- kxX + kyy)]
dv
j =
dB
J7 ~
E =
j X B
V X B/fMo
-Vx£
-ux B
^
-
-
^
These equations combine to
CO = kx
Va with
Va =
— p'lcou^x
jyi
— icoBzi
Exi
give
fio/V/IoP-
= —jyiBo
= -ikxB.i
= —ik^Eyi
= 0, Eyl
+ ikyExi
= -Wzifio-
2.24.13
Thus, independent of the direction of k, the shear Alv6n wave has a
velocity Va along the magnetic field. With k parallel to B, that is ky = 0,
the wave takes the form illustrated in Fig. 2.24.1 with the displacement
shown there being in the z direction of the above calculation.
Fig. 2.24.1 Simple Alfven wave with
fc| I Bo-The fluid velocity OS
plane of the figure.
Fig. 2.24.2 General shear Alfven wave.
Bo and fc lie in the plane of the figure and
the velocity oscillation is perpendicular to
this plane. The wave propagates along x
with the Alfven velocity Va-

Fig. 2.24.3 The magnetosonic w
velocity oscillations in the plane
containing Bq and k
Magnetosonic waves
In magnetosonic waves the plasma displacement lies in the plane
containing the wave vector and the magnetic field. Thus in the chosen coordinate
system shown in Fig. 2.24.3 the fluid velocity has components Vx and Vy.
The wave motion is governed by the same equations as Alfven waves with
the addition of the adiabatic equation for the pressure. These equations
are written below together with their linearized forms
dv
= j X B-Vp ^ -
POUOVxl
-'^Kpx
J =
E =
dp _
-- V X B/ixo
= -V X £
-u X B -^
JzlBo-
HkxByl
ikyE^i
ikxE.i
ikypi
-kyE
-ypV-
- icopi = ypoiikxVxi + kyVyi).
These equations combine to give the dispersion relation
(pco^ - kjyp) (pa? - kjyp - k^—) = k^^p^
k^ ■
\ [Cs + ^A ± ((^s^ + Va)^ - ^C^Va cos^ ^)'^^]
2.24.14
where Cg is the sound speed and Va is the Alfven velocity, given by
eqns 2.24.12 and 2.24.13, and 0 is the angle between k and B.
The wave with the positive sign in eqn 2.24.14 is the fast magnetosonic
wave and that with the negative sign is the slow magnetosonic wave.
For 6 = 0, that is k parallel to B, the waves have
k
and
--Va (fast)
= Cs (slow)

2.25 Landau damping
Fig. 2.24.4 The fast magnetosonic with
k±Bo The oscillations involve
compression of both the fluid and the
magnetic field.
\ \ \
tf t
1 1
t t
ik
The fast wave with ^: || B is identical to the Alfven wave with k in the same
direction, the different directions of u i in the above calculations being
purely a result of the choice of coordinates.
For 6 = n/2, that is k perpendicular to B,
— = Vl + Cl (fast)
@ = 0 (slow)
The fast wave is here simply a compressional wave in which both the
magnetic field and the fluid are compressed as illustrated in Fig. 2.24.4.
Landau damping
It might be expected that waves in a collisionless plasma would be free
from damping. This is not the case. The interaction between the particles
and the field of the wave can lead to a form of damping called Landau
damping. As an example, the Landau damping of Langmuir waves is
described below.
The linearized form of the electron Vlasov equation for f\ (x, t) is
dt
,9/1
9x me av
and the perturbed electric field, E\{x,t)h given by
3£i
ox eo J
Fourier and Laplace transforms are now applied to eqns 2.25.1
and 2.25.2 by multiplying by exp[i(—/ex + cot)] and integrating over
all space and over time from ? = 0 to oo. This gives equations for the

Fig. 2.25.1 (a) Integration contoui
cu-plane, (b) Landau contour, and
(c) contour for calculating Landau
damping of the Langmuir waves
i-plane
2.25 Landau damping
transform variables
/i (^, co)=lfi (k, t = 0) El (k, CO)
9/o
^)/
i(« - kv) 2.25.3
2.25.4
where /i (k, ? = 0) is the Fourier transform of /i at ? = 0. Substitution
of 2.25.3 into 2.25.4 now gives
Ei(k,co)^(ie/ksQ) f fi(k,
theFouri
low gives
So J V- (o/k I \ nteEo J V - (o/k )
2.25.5
Thus the required solution for the Fourier component of the electric field is
le-
E{Kt)
Jiy-
k^-
nieSo J V
dfo/dv
-dco
2.25.6
co/k
dv
where / is the numerator of eqn 2.25.5 and represents the initial
conditions.
The normal procedure for evaluating an inverse transform of this type
is to extend the line of integration in the <y-plane to form a closed contour
as shown in Fig. 2.25.1(a). The integral is then equal J® 2:7ri times the
residues of the enclosed poles. Since the zeros of the denominator of
eqn 2.25.5 are such poles, these zeros would then give the eigenvalues of
the problem.
However, the integrand of the (o integral in eqn 2.25.5 does not have the
necessary analytic properties because of the discontinuity arising from
the velocity integral at (Oi = 0. As shown by Landau this difficulty may
jz-plane
f-plane
"W
(b)
(c)

be resolved by deforming the velocity integral to the contour C as shown
in Fig. 2.25.1(b).
Thus the eigenvalues are given by the dispersion relation
^1 /" -!
' k^njcv
dfo/dv
-co/k
dw = 0.
2.25.7
It is this Landau integral which leads to collisionless damping. For a
Maxwellian distribution the long wavelength limit of eqn 2.25.7 gives
the dispersion relation
V 9w /
■^co/k
where the last term arises from the Landau contour shown in
Fig. 2.25.1(c). If the real part of the frequency is determined from the
first three terms in eqn 2.25.8 and used to calculate the last term, the
dispersion relation becomes
«==«p(l+3^2^2I/2.
Kl)
fe-)
the last term giving the Landau damping of the waves. It is seen from
eqn 2.25.8 that the damping arises through the interaction of the wave
with particles travelling at the phase velocity, co/k.
Bibliography
The present chapter provides only an introduction to the
plasma physics involved in the study of tokamak plasmas.
A more general treatment will be found in the following
books, listed in chronological order.
Spitzer, L. The physics of fully ionized gases, 2nd edn.
Interscience, New York A962).
Thomson, W.B An introduction to plasma physics. Perga-
mon Press, Oxford A962).
Montgomery, D.C. and Tidman, D.A. Plasma kinetic theory.
McGraw-Hill, New York A963).
Kunkel, W.B. Plasma physics in theory and application.
McGraw-Hill, New York A966).
Boyd, TJ.M. and Sanderson, J.J. Plasma dynamics. Nelson,
London A969).
Clemmow, P.C. and Dougherty, J.P. The electrodynamics of
particles and plasmas. Addison-Wesley, Reading, Mass.
A969).
Ichimaru, S. Basic principles of plasma physics. Benjamin,
Reading, Mass. A973).
Krall, N.A. and Trivelpiece, A.W. Principles of plasma
physics. McGraw-Hill, New York A973).
Golant, V.E., Zhilinsky, A.P., and Sakharov, I.E.
Fundamentals of plasma physics. Wiley New York A977).
Schmidt, G. Physics of high temperature plasmas. Academic
Press, New York A979).
Gill, R D. (ed.) Plasma physics and nuclear fusion research
(Culham Summer School). Academic Press, London
A981).
Rosenbluth, M.N. and Sagdeev, R.Z. (eds.) Handbook of
plasma physics. North Holland, Amsterdam A983).
Nicholson, D.R. Introduction to plasma theory. John Wiley,
New York A983)
Chen, F.F. Introduction to plasma physics and controlled
fusion. Plenum Press, New York A984).
Miyamoto, K. Plasma physics for nuclear fusion, 2nd edn.
MIT Press, Cambridge, Mass. A989).
Dendy, R.O. Plasma dynamics. Clarendon Press, Oxford
A990).

Goldston, R.J. and Rutherford, P.H. Introduction to plasma
physics. Institute of Physics Publishing, Bristol A995).
Dendy, R.O (ed.) Plasma physics: an introductory course
(Culham Summer School). Cambndge University Press,
Cambridge A993)
An extensive source of matenal is available in the series of
volumes enutled Reviews of plasma physics (ed. Leontovich,
M.A.). Consultants Bureau, New York. At present there are
18 volumes. Each chapter reviews a different branch of the
subject.
Fokker-Planck equation
The Fokker-Plank equation for a plasma, and the Rosenbluth
potentials are denved in
Rosenbluth, M.N., MacDonald, W.M., and Judd, D.L.
Fokker-Planck equation for an inverse-square force.
Physical Review 101, 1,A957).
The Landau integral formulation is denved in
Landau, L.D., Journal of Experimental and Theoretical
Physics 7, 203 A937).
Gyro-averaged kinetic equations
A derivation of the dnft kinetic equation is given by
Sivukhin, D.V. Motion of charged particles in
electromagnetic field in the drift approximation. Reviews of Plasma
Physics Vol. 1, see p. 96, Consultants Bureau, New York
A965).
The linearized gyro-kinetic equation is derived in
Taylor, J.B. and Hastie, R.J., Stability of general plasma
equilibria. Plasma Physics 10, 479 A968).
Bibliography 103
The enhancement of resistivity in a tokamak due to trapped
particles is discussed in Section 4.10.
Electromagnetism
A clear discussion of Maxwell's equations is given in
Chapters 18 and 32 of
Feynman, R P., Leighton, R.B., and Sands, M. Lectures on
physics. Vol. n. Addison-Wesley, Reading, Mass. A965).
Braginskii equations
The equations are derived in
Braginskii, S.I. Transport processes in a plasma. Reviews of
plasma physics (ed. Leontovich, M.A.), Vol. 1,
Consultants Bureau, New York A965).
Runaway electrons
The seminal paper is
Dreicer, H., Electron and ion runaway in a fully ionized gas
Physical Review 111, 329 A960).
The runaway rate was calculated by
Gurevich, A.V., On the theory of runaway electrons. Zhumal
Eksperimentalnoi i Teoreticheskoi Fiziki 39, 1296 A960)
ISoviet Physics, JETP 12, 904 A961)]
and the relativistic effect by
Connor, J.W. and Hastie, R.J., Relativistic limitations on
runaway electrons. Nuclear Fusion^MS, 415 A975).
The significance of short-range collisions was pointed out by
Sokolov, Yu. A., Multiplication of accelerated electrons
in a tokamak. Pis'ma Zhumal Experimentalnoi i
Teoreticheskoi Fiziki 29, 244 A979) IJETP Letts. 29, 218
A979)]
Relaxation processes
An introductory account is given in Chapter 5 of
Spitzer, L. The physics of fully ionized gases, 2nd edn.
Interscience, New York A962).
The subject is further described by J.J. Sanderson in
Chapter 7 of
Gill, R.D. (ed.) Plasma physics and nuclear fusion research.
Academic Press, London A981).
Resistivity
The calculation of the classical resistivity of a uniform
plasma was carried out by Spitzer and his co-workers and is
given in
Spitzer, L. and Harm, R. Transport phenomena in a
completely ionized gas. Physical Review 89, 977
A953).
Waves
The cases treated in Section 2.24 are elementary examples
of a very complex vanety of waves which can propagate in
a plasma. The subject is treated at length in
Stix, T.H. Waves in plasmas Amencan Institute of Physics,
New York A992).
Akhiezer, A.L, Akhiezer, LA., Polovin, R.V., Stienko, A.G.
and Stepanov, K.N. Plasma electrodynamics. Vol. I,
Pergamon Press, Oxford A975).
Landau damping
Landau, L.D. On the vibrations of the electronic plasma.
Journal of Physics (USSR) 10, 25 A946).
A physical picture of Landau damping is given by
Stix, T.H. Waves in plasmas. American Institute of Physics,
New York A992).

Equilibrium

3.1 Tokamak equilibrium
3.1 Tokamak equilibrium
The subject of tokamak equilibrium has two basic aspects. Firstly there
is the internal balance between the pressure of the plasma and the forces
due to the magnetic field. Secondly there is the shape and position of the
plasma, these being determined and controlled, by currents in external
coils.
As described in Section 1.6 the main component of the magnetic field
is the toroidal field produced by poloidal currents in external coils. A
smaller, poloidal magnetic field is produced mainly by the toroidal
current in the plasma. The full poloidal field is comprised of this internally
generated field together with that due to toroidal currents in the primary
winding and other coils used for plasma shaping and control. Finally the
toroidal magnetic field is modified to a small extent by poloidal currents
in the plasma.
The general form of the spatial variation of the magnetic field is
illustrated in Fig. 3.1.1. The basic shape of the toroidal field B^ is obtained
from Ampere's law. Thus, taking a line integral around a circular toroidal
circuit inside the toroidal field coils, and neglecting the small poloidal
plasma current
2jtRB<p = noh
3.1.1
where R is the major radius coordinate and h is the total current in the
coils. It is seen from eqn 3.1.1 that
Fig. 3.1.1 Basic radial vanation of the
toroidal magnetic field B^ (with an
approximate l/R dependence), the
poloidal magnetic field Bg, due mainly to
the plasma current, and the plasma
pressure, p. R is the distance from the
major axis of the torus and the graphs are
for the median plane

3.1 Tokamak equilibrium 107
In present tokamaks this radial fall off is significant. Taking a minor
radius a, the change in B^ across the plasma is
2a
where fi^o is the field at the mid-plane R = Rq. For an aspect-ratio
R/a = 3, Afi^/fi^o = |- This variation of fi^ across the plasma has an
important effect on the trajectories of the plasma particles as described
in Section 3.10.
The distribution of the poloidal magnetic field depends on the toroidal
current profile. In the case where this current is driven by a toroidal
electric field, the steady state current profile is determined by the electrical
conductivity. Since this increases with electron temperature as T^ ''^ the
current is peaked in the central region where the temperature is highest.
It is possible to drive the current by non-ohmic means using RF waves or
particle beams as described in Section 3.14. Another component of the
plasma current is the so-called bootstrap current described in Section 4.9.
This current arises from a combination of the radial gradients of density
and temperature and the toroidal magnetic geometry.
Because the mass density of the plasma is very low, typically
10"'^ gm m~^, and the component internal forces on the plasma are quite
large, typically 10 tonnes m~^, the internal forces must balance. The
plasma pressure exerts an outward force across the miny radius and the
poloidal magnetic field exerts an inward force. The imibalance between
these two forces is taken up by the magnetic pressure of the toroidal
magnetic field. This force may be inward or outward.
The complete magnetic field produces an infinite set of nested toroidal
magnetic surfaces. The field lines themselves follow a helical path on their
magnetic surface as they wind round the torus. The sound speed in the
plasma is typically 10^ — lO^m s~' and consequently the pressure is
constant along the magnetic field, any imbalance being rapidly removed.
The direction of the magnetic field changes from surface to surface.
This shear of the magnetic field has important implications for the stability
of the plasma. The average twist of the magnetic field on each surface
can be characterized by the so-called safety factor, q, which is a measure
of the pitch of the helical field lines. The shear is then determined by the
radial rate of change of q.
The toroidal geometry of the plasma leads to a hoop force which is in
the direction to expand the plasma ring. This force is balanced by applying
a vertical magnetic field which interacts with the toroidal current to give
an inward force.
The particle motions are quite complex. The basic component is the
normal small scale helical motion along the magnetic field as the
particles gyrate in their Larmor orbits. At low temperatures the particles
suffer frequent collisions and collectively they can be regarded as a fluid.

3.2 Flux functions
At higher temperatures collisions are less frequent and the particle orbits
are affected by the toroidal geometry of the magnetic field. A
substantial fraction of the particles are trapped in the weaker magnetic field on
the outer side of the torus, being reflected between turning points in the
region of stronger magnetic field.
While the equiUbrium is partly determined by the externally imposed
conditions such as total current, applied toroidal magnetic field and
the applied heating, many characteristics are the result of the plasma
behaviour. Thus the density and temperature profiles are governed by the
transport properties which in turn are affected by plasma instabilities.
Fig. 3.2.1 Magnetic flux surfaces
forming a
Flux functions
For axisymmetric equilibria, that is equilibria which are independent of
the toroidal angle </>, the magnetic field lines lie in nested toroidal magnetic
surfaces as illustrated in Fig. 3.2.1.
The basic condition for equiUbrium is that the force on the plasma be
zero at all points. This requires that the magnetic force balances the force
due to the plasma pressure, that is
j X B =
3.2.1
Fig. 3.2.2 Magnetic field lines and
current lines lie in magnetic surfaces
It is clear from this equation that B -Vp = 0. Thus, there is no pressure
gradient along the magnetic field lines and the magnetic surfaces are
surfaces of constant pressure. Furthermore eqn 3.2.1 gives j • Vp = 0,
and consequently the current lines also lie in the magnetic surfaces as
shown in Fig. 3.2.2.
In studying tokamak equilibria it is convenient to introduce the poloidal
magnetic flux function ijr. This function is determined by the poloidal
flux lying within each magnetic surface and is therefore a constant on
that surface. Thus xfr satisfies
B-Vf = 0
Introducing a cylindrical coordinate system based on the major axis of
the torus as shown in Fig. 3.2.3 and defining ijr to be the poloidal flux per
radian in (p, the poloidal magnetic field is related to i/r by
1 3f
JJr
conforming to the requirement V • B = 0, that is
- — iRBR) + -^=0.
R dR dz
The flux function i/r is arbitrary to an additive constant which may be
chosen for convenience.
Br =
Bz
3.2.2

3.3 Grad-Shafranov equation
109
Fig. 3.2.3 Cylindrical coordinate
system. 7? = 0 is the major axis of the
3.2.3
From the symmetry of j and B it is clear that a current flux function
also exists. This function, /, is related to the poloidal current density by
13/ . _ 1 3/
Comparison of eqns 3.2.3 with Ampere's equation,
• =_±^
1X0 dz ' ^ flo R dR''
gives the relation between / and the toroidal magnetic field as
RB^
-{RB^\
/ =
IXQ
3.2.4
It can be shown that / is a function of i/r by taking the scalar product of
eqn 3.2.1 with jf, to obtain j ■ Vp = 0, and then substituting eqn 3.2.3
for jr*. Thus
3/3p_3/3p^^
dR dz dz dR
and hence
V/ X Vp = 0,
proving that / is a function of p. Then, since p = piijr), it follows that
/ = /W-
The flux functions as defined here give the poloidal^ux associated
with a unit angle in </>. It is also possible to use the totallux function for
the torus which is simply larger by a factor 27t.
3.3
Grad-Shafranov equation
The equilibrium equation for an axisymmetric system such as a tokamak
can be written as a differential equation for the poloidal flux function ijr.
This equation which has two arbitrary functions, piijr) and fiijr), is
usually called the Grad-Shafranov equation.
The equilibrium equation
j X B = Vp
may be written
jp X i0fi0 + U i^ X Bp = 'Vp 3.3.1
where jr p is the poloidal current density, Bp is the poloidal magnetic field,
and 10 is the unit vector in the </> direction, (p being the toroidal coordinate.

3.3 Grad-Shafranov equation
Equation 3.3.1 can now be written in terms of the poloidal flux
function t/r. Equations 3.2.2 and 3.2.3 may be contracted to
Thus, substituting eqns 3.3.2 and 3.3.3 into eqn 3.3.1, and remembering
that 10 • Vi/r = i^ • V/ = 0, gives
dyj-
dp
di/f
and substitution of these relations into eqn 3.3.4 leads to
„dp „ d/
^^ = ^d^ + ^^d^-
Substituting eqn 3.2.4 for B,p into eqn 3.3.5 then gives
It remains to write j^ in terms of i/r. This is done by introducing Ampere's
equation
fMoj = VxB. 3.3.7
Substitution of eqns 3.2.2 into the toroidal component of eqn 3.3.7 gives
-^.«* = ii^^^ + ^ 3.3.8
and using eqn 3.3.8 to substitute for j^ in eqn 3.3.6 gives the required
equation
^J]^rJ^ + -^ = -/^oi?'p'W - nl f{f)f\f)- 3.3.9
This equation is the Grad-Shafranov equation. Figure 3.3.1 shows the flux
surfaces and profiles of j'^, p, and B^ obtained by numerical solution of
the equation for a typical case.

3.4 Safety factor, q
Fig. 3.3.1 Equilibrium flux surfaces and
plots of toroidal current density, plasma
pressure, and toroidal magentic field across
the midplane.
Safety factor, q
The safety factor, q, is so called because of the role itplays in determining
stability. In general terms, higher values of q lead tq^greater stability. It
also appears as an important factor in transport theory.
In an axisymmetric equilibrium each magnetic field line has a value
of ^. The field line follows a helical path as it goes round the torus on its
associated magnetic surface. If at some toroidal angle, </>, the field line
has a certain position in the poloidal plane, it will return to that position
in the poloidal plane after change of toroidal angle A</>. The ^-value of
this field Une is defined by
Thus if a magnetic field Une returns to its starting position after exactly
one rotation round the torus, then ^ = 1. If it moves more slowly in the
poloidal direction it has a higher value of ^. Rational values of q play an
important role in stability. If ^ = m/«, where m and n are integers, the
field line joins up on itself after m toroidal and n poloidal rotations round
the torus. Kq =2 line is illustrated in Fig. 3.4.1(a).
In order to calculate the value of ^ it is necessary to use the equation
of the field line
i?d(/> _ fi0
As ~ fin

112 3.4 Safety factor, ^
Fig. 3.4.1 (a) Field line onq =2
surface, (b) Poloidal integration path for
eqn 3.4.2. (c) Flux aimulus containing
toroidal flux dO and poloidal flux d*.
where ds is the distance moved in the poloidal direction while moving
through a toroidal angle d</>, and fip and B^ are the poloidal and toroidal
magnetic fields. Thus from eqn 3.4.1
InfRBp
3.4.2
where the integral is carried out over a single poloidal circuit around the
flux surface as illustrated in Fig. 3.4.1(b).
It is clear from eqn 3.4.2 that q is the same for all magnetic field lines
on a magnetic surface. Thus ^ is a flux function, that is ^ = qiilr).
For a large aspect-ratio tokamak of circular cross-section eqn 3.4.2
gives the approximation
, = ^ 3.4.3
where r is the minor radius of the flux surface. Be is the poloidal magnetic
field, i?o is the major radius, and the toroidal magnetic field is essentially
a constant.
An alternative expression for q can be obtained in terms of the magnetic
fluxes. Consider an infinitesimal annulus between two magnetic surfaces
as illustrated in Fig. 3.4.1(c). The poloidal flux is
dvj/ =2nRBpdx
3.4.4
where djc is the local separation of the surfaces. The toroidal flux through
the annulus is
d^= j)iB^dx)ds. 3.4.5
Substituting eqn 3.4.4 for fip into eqn 3.4.2 gives

3.4 Safety factor, ^ 113
and using eqn 3.4.5
_ d<&
^~ d*'
Thus the safety factor can be expressed as the rate of change of toroidal
flux with poloidal flux.
An associated quantity is the rotational transform, i, (iota) which is
given by i = 2n/q. It is often replaced by t = i/2n, that is t = l/q.
q profiles
The radial profile of q usually has its minimum value at, or close to, the
magnetic axis and increases outwards. In the case of large aspect-ratio
and circular cross-section the behaviour of q is simply determined by the
toroidal current density profile, j(r). Thus writing Ampere's law in the
form
InrBe = iioHr),
where the current inside r is
nr) = l7t r jirYdr',
and using eqn 3.4.3 for q gives
2nr^B<,
qir) =
Taking r = a, the edge value of q is
qa --
fioIR
where / is the total current. The central value of q is obtained by taking
thelimitr -^ 0 in eqn 3.4.6. In this limit/(r) = :7rr^;o, where ;o = ;@),
and so
Equations 3.4.7 and 3.4.8 give the ratio
qa_ ^ na'-jo ^ jo_
qo I U)a
where (j)^ is the average current density over the whole plasma.

3.4 Safety factor, q
Equation 3.4.6 can be written
2fi^
q(r) =
where (;)r is the average current density inside the radius r
Differentiating eqn 3.4.9 with respect to r
1 = JJ1l. 3.4.11
q {])r
Now it follows from eqn 3.4.10 that (;);. = 2(; - (;)r)/r. Thus, since
a monotonically decreasing current profile has j < (j)r it is seen from
eqn 3.4.11 that such a current profile has q' > 0.
For plasmas which have a limiter the general behaviour of ^ described
above persists for non-circular plasmas. However precise values require
numerical computation and this usually involves solving the Grad-
Shafranov equation. An approximation which is often used is 'q
cylindrical' which by analogy with eqn 3.4.7 is defined by
InabBd,
qcyi =
fioIR
where a and b are the half-width and half-height of the plasma.
It is convenient to have a simple model for qir). In the case of a
large aspect-ratio circular plasma such a model is provided by the current
distribution
; = ;o(i-rV«')^
Ampere's equation, ixqj = A/r) d(rBe)/dr, then gives
Substituting eqn 3.4.12 into the approximation for q given by eqn 3.4.3
leads to the required qir),
^ 2(y + 1) B^ r^/a^
^ HO jo R l-d-r^a^y+'-
With this model
9@)
When plasmas are bounded by a separatrix, as they are in configurations
with a divertor, the q profile is fundamentally modified. The reason is

3.5 Beta
that the value of ^ for surfaces close to the separatrix is dominated by the
contribution close to the X-point. The poloidal magnetic field, fip, has a
null at the X-point, and locally its magnitude is proportional to the distance
from the X-point. The magnetic geometry around the X-point is illustrated
^^^ in Fig. 3.4.2. The expression 3.4.2 for q has fip in the denominator of
the integrand and this leads to a logarithmic contribution. If the shortest
distance of a flux surface from the X-point is d, the limiting form of q as
J^Ois
Fig. 3.4.2 Illustrating the geometry of
the flux surfaces around the X-point when
the plasma is bounded by a separatrix.
7tR\VBp\
where A is a length characterizing the overall geometry. Thus as the
separatrix is approached, ^ ^- oo. The underlying cause is that the smallness
of fip around the X-point delays the poloidal motion of the field lines,
and field lines on surfaces close to the separatrix spend almost all of their
trajectory close to the X-point.
3.5 Beta
The efficiency of confinement of plasma pressure by the magnetic field
is represented in a simple way by the ratio *
^ B^lno'
However, there are several different measures of this type, some arising
from varying choices of definition and others from the need to quantify
different equilibrium properties.
For a reactor, the important quantity is the thermonuclear power
obtained for a given magnetic field. The reaction rate is proportional
to n^{av) which is not generally expressible as a pressure. However, in
the temperature range envisaged for a reactor 10-15 keV, {av) is roughly
proportional to T^ and the thermonuclear power is then proportional to
p^. The resulting form of P, called ^*, is defined by
(/p^dr//dr)'^'
^ ~ B^/2fM0
where the integrals are over the plasma volume and fio is the value
of the toroidal magnetic field. Although it is the toroidal magnetic field at
the coil which is subject to limitation it is usually more convenient to use
the value of the vacuum toroidal magnetic field at the geometric centre
of the plasma.

A commonly used fi is the average value defined by
/pdr//dr
Another expression which arises is the poloidal fi, defined by
/pd5//d5
^'= BlUm '■'■'
where the integrals are surface integrals over the poloidal cross-section
and
Ba = !^
where / is the plasma current and / is the length of the poloidal perimeter
of the plasma. For a large aspect-ratio circular plasma / = 2na and
eqn 3.5.1 becomes
fpdS
An alternative definition uses the volume average of p rather than the
cross-sectional average in eqn 3.5.1.
The significance of ^p may be seen by taking a circular cross-section
and integrating the numerator of eqn 3.5.2 by parts to obtain
i>^^-
'dp
and substituting dp/dr from the approximate pressure balance equation
fior dr
dr dr ylixo j
to obtain, after integration,
(aBga)^ Jo dr
It is seen that if there are no azimuthal currents, so that the integrand of
eqn 3.5.3 is zero, then ySp = 1. If dfi^/dr > 0, so that the toroidal field
plays a part in confining the pressure, then fip > 1. On the other hand,
if dfi?/dr < 0, the magnetic pressure fi?/2/Ao displaces some of the
plasma pressure and Np < 1. This is illustrated in Fig. 3.5.1.
There is no formal limit to the equiUbrium value of N. This may be seen
by the following thought experiment. Consider a perfectly conducting
plasma surrounded by a perfectly conducting shell. Imagine the plasma
to be continually heated, increasing the pressure on the flux surfaces.
The plasma surfaces will move but their nested topology will remain

3.6 Large aspect-ratio
Fig. 3.5.1 Profiles of B^ for ci
unchanged. Furthermore the plasma boundary is fixed. In principle there
is no limit to this process and therefore to the fi which can be obtained.
However, it should be noted that this procedure leads to an increased
plasma current. The experimental situation is of course more complex
and in practice raising fi ultimately leads to the formation of a separatrix
with an X-point on the high field side of the plasma.
Large aspect-ratio
Tokamak equilibria take a comparatively simple form ^r low-N, large
aspect-ratio plasmas of circular cross-section. The ordering of quantities
in terms of the inverse aspect-ratio, e = a/R, is
fi0 = B^o{Ro/R){l + 0{£^)) Be ~ efi^o
70 ~ sB^oliXQa J0 ~ s'^B^o/ixoa
p^E^Blo/fMo,iP-e^) Np~l
where B^o is the vacuum toroidal magnetic field at the major radius of
the plasma Rq. The basic pressure balance equation is that of a cylinder.
dp
-T- = UBe - jeB^Q, 3.6.1
the equilibrium being specified by j,pir) and p(r) with pia) = 0. The
azimuthal field is given by Ampere's equation
IJ'0J<P =
rdr
irBe)
and jg is then determined by eqn 3.6.1.
When toroidal effects are included, the flux surfaces form non-
concentric circles as illustrated in Fig. 3.6.1(a). Using the coordinate

3.6 Large aspect-ratio
Fig. 3.6.1 (a) Showing circular flux
surface displaced by a distance A with
respect to outer flux surface whose centrf
is at a distance Rq from the major axis
(b) Coordinate system (r,6) with centre
at major radius Rq.
system shown in Fig. 3.6.1(b) the Grad-Shafranov equilibrium eqn 3.3.9
may be written
n 3 3
['rdr'''dr'
1 32
1
Ro-\
cos 6 sin 0
V dr
3.6.2
= -ixoiRo + r cos eyp'o^) - f4 f{i^)f{i^).
Expanding i/r in e,
The flux function t/rg is given by the leading order part of eqn 3.6.2,
corresponding to eqn 3.6.1, that is
r dr V dr /
-IxqRqP (fo) - H-ofifo)! (fo)
and fi satisfies the first-order part of eqn 3.6.2
/I 3 3 1 32 \ , cos^dfo
= ~iJ,oRoP"(fo)fi -i4(f(fo)fifo)yfi -2ixoRorcosep'ifo)
= --T-il^oRlp\fo)+ljlfifo)f\fo))-TTrfi - 2ixoRorcos9p'(ifo
If the flux surface t/r is displaced a distance A(i/ro(r)), f may be written
f = i/fo -f- f 1
= i/fo - A(r)cos6i
dfo

3.7 Shafranov shift 119
Substituting the form for tlri given by eqn 3.6.5 into eqn 3.6.4 leads to
-A—(-—( ^\\ - - (—\ — ( f^V dA\ 1 dfo
dr \r dr \ dr )) r \dfo) dr \\dr) dr I Ro dr
d T , T , dpa dr
3.6.6
and, from eqn 3.6.3, the first terms on the two sides of eqn 3.6.6 cancel,
leaving
where the definition of the flux function given by eqn 3.2.2 has been used
to replace (dfo/dr)/Ro by BgQ.
The solution of the differential equation3.6.7withdA/dr = 0atr = 0
and A (a) =0 gives the displacement A(r) of the flux surfaces for a zero-
order pressure po(r) and azimuthal magnetic field Bgoir). Together with
eqn 3.6.5 this then provides the solution fir,0).
Shafranov shift
From the equilibrium calculation of Section 3.6 it is seen that the centres
of the magnetic flux surfaces are displaced with respect to the centre of
the bounding surface. This displacement, A(r), is given by the solution
of eqn 3.6.7. The displacement of the axis. As = A@), is called the
Shafranov shift.
The Shafranov shift depends upon the particular forms of po{r) and
Beoir), and eqn 3.6.7 must be solved for each case. However, some
indication of the behaviour can be obtained by using simple analytic
forms. Thus, dropping the subscript zero, and taking
= P 1-
eqn 3.6.7 can be written
dA 1 (r^
dr RBg \a''
:2PP^ea
r Jo

3.7 Shafranov shift
where Bea = Be (a) and the poloidal beta, ^p, is defined by
p 4/^0 Jq pr dr
BUlfio
andySp = ixop/Bg^ inthiscase. Application of Ampere's law to eqn 3.7.1
gives the required poloidal field
r/a
3.7.4
Using eqn 3.7.4 for Be equation 3.7.2 can be integrated numerically to
obtain As as a function of Np and v. However, it is more useful to use the
internal inductance, i^, rather than v. This is defined by
2/o"fi|rdr
3.7.5
A graph of ii(v) is given in Fig. 3.7.1, and an empirical fit correct to
within 2% is given by
^i = lnA.65 + 0.89v).
The parameter v is related to the ratio of edge and central q values through
qa/qo = v + l and this ratio is also indicated in the figure. The calculated
values of the Shafranov shift are plotted in Fig. 3.7.2 in the form of
contours of equal (R/a) As/a in the (Np,-ei) plane.
V^o
Fig. 3.7.1 Graph of the internal
inductance of the current
J = ]{l- (r/a)^y as a function of v.
2.0
1.5
1.0
0.5
-
-
-
^
)
2
1
3
2
4
3
5
4
6
5
7
6
8
7
9
j
\
-
8

Fig. 3.7.2 Graphs giving the Shafranov
shift As in the form of contours of equal
values of (R/a)As/a in the (/6p,^,) plane
for a parabolic pressure profile and current
profiles given by eqn 3.7.1.
3.8 Vacuum magnetic field
3.8
Vacuum magnetic field
The calculation described in Section 3.6 leads to an approximate
solution for the plasma equilibrium. This solution gives the variation of
the poloidal magnetic field around the plasma surface at r =a. This in
turn determines the vacuum magnetic field and prescribes the externally
produced field necessary to maintain the equilibrium.
It is first necessary to determine Bg (a) from the plasma equiUbriurtL
using the large aspect-ratio expansion introduced in Section 3.6. Bg is
given by
1
df
with
f =
R dr ~ Ro + rcosO dr
- A(r)^cos0
dr
3.8.1
and A(r) determined by the solution of eqn 3.6.7. Thus, using A(a) = 0,
eqns 3.8.1 and 3.8.2 give the poloidal field at r = a as
>['-a
Ro'^Kdr)

3.8 Vacuum magnetic field
The quantity dA/dr must now be calculated. Carrying out an integration
of eqn 3.6.7 and integrating by parts on the right-hand side leads to
r/?ofi|o
Jo \ " 2/Ao/
Now, using the definitions of Np and ii given by eqns 3.8.3 and 3.7.5, and
taking po(a) = 0, eqn 3.8.4 gives
Substitution of eqn 3.8.5 into eqn 3.8.3 then leads to
Be(a) = Bgo(a)(l + ~Acos9\ 3.8.6
where
The vacuum magnetic field must now be matched to this solution for
Be (a). The vacuum field is given by the solution of the equation
(V X BH = 0. Using eqns 3.2.2, and the present coordinates,
(V X BH takes the form of the left-hand side of eqn 3.6.2. In the large
aspect-ratio approximation the solution for r <^ Rq'is
3.8.7
where /(= — 2naBeoia)/ixo) is the plasma current. The values of the
constants c\ and ci are determined from the requirements that Bg(a)
matches the plasma solution given by eqn 3.8.6 and that Br (a) = 0.
Substitution of eqn 3.8.7 into the expanded form of eqn 3.8.1 provides
the vacuum solution for Beia). Matching this to eqn 3.8.6 then gives
-^ci-C2 = ln —+2A. 3.8.8
a^ a
Since Br = —{l/Ror)d\lj-/dO, the requirement Bria) = 0 implies that
the coefficient of cos 6 in eqn 3.8.7 is zero air ~ a. Thus using eqn 3.8.8
the values of ci and ci are found to be
ci=a^(A + i), c, = -(ln^ + A-i)
and substitution into eqn 3.8.7 gives
27r V, r J 47t \ a
The factor (ln(8i?o/'') - 1) in eqn 3.8.7 is an approximation, valid
for r < i?o, to a function which is zero for r -^ oo. Thus for large
-U-^)>

3.9 Electric fields 123
r, i/f takes the form (ixqI/4n)c2r cosO corresponding to a vertical field
(/Ao//47r)c2/i?o,thatis
47tRo \ a 2)
This is the vertical magnetic field necessary to maintain the plasma in
equilibrium, its effect being to provide an inward force to balance the
outward hoop force on the plasma
Electric fields
In a tokamak equilibrium the electnc field has three components. The two
components in the magnetic surface can be regarded as either toroidal and
poloidal, or as parallel and perpendicular to the magnetic field The third
component is that which is perpendicular to the magnetic surface, the
'radial' electnc field
Discharges are formed by the application of a toroidal electric field.
This electnc field at first produces a current in the outer region of the
plasma. The current and its associated electric field then diffuse into the
plasma In the simplest model this diffusion is governed by Maxwell's
equations and Ohm's law The actual behaviour however is rather
complicated because the temperature dependent electrical conductivity is
detenmned by the ohmic heating and energy transport, and often there
are instabilities associated with the process
Another element in the behaviour is the £ x B dnft In cylindncal
geometry the application of an axial electnc field produces an inward drift
velocity E^/Be. This inward motion leads to the build up of a negative
pressure gradient and this in turn dnves an outward diffusive plasma flux
which, in the resulting equilibnum, balances the inward E x B drift In
this steady state the radial velocity is zero and Ohm's law becomes simply
E = r]j In a tokamak the behaviour is more complex partly because
of the toroidal geometry and partly because the plasma flow across the
magnetic field is determined by anomalous transport rather than simple
resistivity.
However a simplifying feature is that in the final steady state the
magnetic field in the plasma is constant in time and consequently there are no
flux changes in the plasma Thus, from Faraday's equation, V x £ = 0
Using cylindncal coordinates (R, </>, z) with the z-axis along the axis of
symmetry of the torus, the z-component of this equation is
c
where c is a constant The constant toroidal voltage, InRE^, is
maintained by the imposed flux change through the torus.

3.10 Particle orbits
Faraday's equation also gives a simple result for the poloidal electnc
field Ep In a steady state the toroidal magnetic field is constant and
V X £ = 0 implies
<j) Ep-ds = 0
where the integral is taken around any poloidal circuit in the plasma.
However, as will be seen below, this does not mean that Ep itself is zero.
In equilibrium each species m the plasma must satisfy its own force
balance equation. The component perpendicular to the magnetic surface
IS
njej(E„ + (Vj xB)„) = ^
dx„
where the subscript n refers to the perpendicular components Thus the
'radial' pressure gradient force is balanced by the force from a field which
IS the sum of the radial electnc field and the Vj xB field ansing from the
species flow velocity in the surface. The contribution of the two individual
terms is frame dependent. In a frame with velocity equal to i>y the pressure
gradient is balanced entirely by the electnc field. On the other hand,
summing over species, quasi-neutrality imposes ^ rij = 0. Thus in any
frame the total pressure gradient is balanced by J2j ^j^j ( ^ ^)n and
this is just j X B.
Particle orbits
In a uniform magnetic field a charged particle gyrates around a magnetic
field line and the guiding centre of the particle's orbit moves with constant
velocity along the magnetic field. In a tokamakthe non-unifonmty of the
magnetic field leads to drifts of the guiding centre. In the absence of
collisions these dnfts give nse to two types of guiding centre orbit.
Particles with a sufficiently large velocity parallel to the magnetic field
circulate continually round the torus. These are called passing particles
The remaining particles are trapped particles, being trapped on the outer
side of the torus by the magnetic mirrors formed as a result of the poloidal
variation of the magnetic field as shown in Fig. 3.10 1 Both types of orbit
lie on toroidally symmetric drift surfaces. The poloidal cross-sections
of such surfaces are illustrated in Fig. 3 10.2 with the projections of
particle orbits The condition for collisions to be important is denved in
Section 3.12.
The orbits are constrained to lie withm a distance, d, of a magnetic
surface This distance can be calculated using the conservation of the
canonical angular momentum which follows from the toroidal symmetry

3.10 Particle orbits
Magnetic surface
Fig 3 10.1 Showing the banana orbit of
a trapped particle with its projection onto a
poloidal plane.
Guiding centre orbit
Projection on to poloidal plane
Fig 3 10 2 Diagram illustrating drift
surfaces for the orbit of a passing particle
and the (banana) orbit of a trapped particle.
The major axis of the torus is on the left
Passing
Traced
The conservation is demonstrated by calculating the change of mechanical
momentum using the equation of motion in the toroidal direction
Using eqn 3.2.2 for B eqn 3.10.1 can be written
Vf being the poloidal flux function Since di/r/d? = v ■ Vt/r, eqn 3.10.2
becomes
where the canonical momentum p^ is given by
p^ = nijRv^+ejip-. 3.10.3
Returning now to the calculation of the separation of the orbit from the
magnetic surface, it is seen from eqn 3.10.3 that the constancy of p^

3 10 Particle orbits
implies that orbit involves a change in i/r. This m turn implies a
displacement of the particle across the flux surfaces. For a small displacement d
from the flux surface the change m the flux function is
\Sxlr\ = \Vf\d. 3.10.4
Using eqn 3 10.3 to obtain St/r, eqn 3.10.4 gives
An approximate upper bound on d may now be obtained using eqn 3.3.2
to write I Vi/f I = RoBg, and then, taking the maximum value oi8(Rv^)
to be Rq U0 , with u^ the maximum value of the particle's toroidal velocity,
eqn 3.10.5 gives
J ^ I  I u ^J^S
d < \^^\ where co^^e = ——.
I coce I rrij
The distance v^ /cOcq is the Larmour radius calculated for a particle of
velocity 1H using the poloidal magnetic field Be.
Particles with low velocity parallel to the magnetic field are trapped in
the weaker magnetic field on the outer side of the torus. This behaviour
IS described in Section 3.11 where it is shown that, in the approximation
(jIR) <^ 1, the region of velocity space for particle trapping is the cone
W||o/w±ol ^ Br/i?o)'''^ where uno and v±_q are the velocities parallel and
perpendicular to the magnetic field at the minimum value of the field
on the particle orbit. The orbits of the trapped particles are calculated in
Section 3.12.
The drift surfaces of passing particles are determined by two
components of the particle motion. The first is the motion parallel to the magnetic
field giving rise to a poloidal rotation. For particles which are strongly
passing, this rotation has a frequency
CO = {Be/B)vn/r.
The second component is the vertical drift due to the gradient and
curvature of the toroidal field as given by eqn 2.6 9, that is
Ud = —^^^ ^ 3.10.6
ejRB^
Combining these motions the equations for the drift orbit are
dR dz
—~=(i>z, -— -
dt dt
where z is the vertical coordinate and R^ is the R coordinate of the centre
of the cross-section of the magnetic surface.

3.11 Particle trapping 127
The resulting equation for the drift surface is
(r-Rc-—) +z^ = constant.
This IS a circular surface displaced from the magnetic surface by a distance
d = -— ~---^
CO Rcoce
which is a factor r/R smaller than the bound derived above.
3.11
Particle trapping
Since the vacuum toroidal magnetic field is proportional to l/R, the
field IS smaller on the outer side of the torus. Particles in this region
having a small velocity parallel to the magnetic field undergo a magnetic
mirror reflection as they move into the region of higher field. In the
absence of collisions the particles are trapped in the low field region,
undergoing repeated reflections as they bounce backward and forward
between turning points.
The mirror force responsible for the trapping is given by eqn 2 5.8.
Its effect IS most readily understood by regarding it as the force on the
magnetic moment, [m, of the particle orbit, that is /
F = -/AV||fi, where/A=^—^. 3.11.1
As shown in Section 2.7, fx is almost constant during the particle's
motion and the criterion for particle trapping can be calculated using this
result.
The magnitude of the magnetic field along a particle trajectory has its
lowest value, fimin, m the median plane. Denoting the velocity at this
point by a subscript zero, the constancy of fx gives
^ = ^^. 3.11.2
B fimin
Now, at the bounce point, un = 0 and so conservation of energy implies
^± = "±o + "no-
Substitution into eqn 3 11.2 then gives the field fib at the bounce point,
-^ = l + (^]\ 3.11.3
Thus the smaller the angle wno/wxo the shorter the trajectory between
bounces

3.11 Particle trapping
The condition that a particle be trapped is clearly that, given its pitch
angle wno/wxo at the median plane, the magnetic field along the
particle trajectory reaches the value fib required for reflection as given by
eqn 3.11.3 An approximate form for this condition may be obtained
taking the toroidal magnetic field to have its vacuum form
n n ^0
where Bq is the field at the major radius Rq. The ratio of the maximum
field to the minimum field on a surface of minor radius r is then
fimax Ro + r
Brmn~ Ro-r'
b < fimax)
Thus, using eqn 3.11.2, the requirement for trapping,
becomes
1/2
( "IIP \
\v±o)
3.11.4
For an isotropic distribution function such as a Maxwellian the number
of the particles which are trapped is determined by the velocity space
geometry and the fraction / is
/ =
/ v\\o \
3.11.5
where vq is the total velocity Using u^
jl + u]^ to write
{^)
' 1 + (W||/w±J
Fig 3.11.1 Graph of the fraction of the
particles which are trapped as a function of
the inverse aspect-ratio of the magnetic
surface, r/Ro.

3.12 Trapped particle orbits 129
and substituting the critical condition for iv\\/v±o) from condition 3.114
gives (i'||o/wo)cnt and hence, using eqn 3.11.5 the trapped fraction
For Ro/r < 7 over half of the particles are trapped. A graph of /(r/i?o)
is given in Fig. 3.11.1
3.12 Trapped particle orbits
The bounce motion of trapped particles can be calculated using
the force given by eqn 3.11 1 Wnting the major radius coordinate
R = Rq + rcosO, the parallel gradient of the magnetic field, dB/ds,
may be obtained using
fi = fio- = ^ 3.12.1
R l + ir/Ro)cose
which for strongly trapped particles @ < 1), and large aspect-ratio gives
dB ^ rBo d(gV2) ^^22
ds Rq ds
The equation of a field line is r dO/ds = Bg/B and,#o 6 = (Be/rB)s
Thus substituting eqn 3.12.2 into eqn 3.11.1 the equation of motion is
where the bounce frequency
o^=^(^Y' 3.12.4
qRo \2RoJ
with q = rBo/RoB0, and so the motion along the magnetic field is
given by
5 = 5^ sin coi^t
Since 6 ocs,the6 component of motion is given by
61 = 0b sin (Wb? 3 12 5
The turning point 9^ is obtained using eqn 3.11 3 for the bounce condition
For 0b < 1 eqn 3 12.1 gives

130 3.12 Trapped particle orbits
and substitution into eqn 3.11 3 gives
1/2
v±o\rJ
The drift surface on which the trapped particle orbit lies is now obtained by
including the r component of the vertical drift due to the toroidal magnetic
field as given by eqn 3.10.6 Forux ^ U|| this drift, Ud = ^nijV^/ejRB^,
IS almost constant and its radial component is
dt
Equation 3 12.5 gives
.2\l/2
^-('-a)T
and the combination of eqns 3 12 6 and 3 12.7 then leads to the differential
equation of the drift surface
■('-Ol
Thus, integrating eqn 3.12 8, the equation for the drift surface is
--(^y('-a)i
This surface has the shape of a banana, as illustrated in Fig 3.10.2, and
the orbits are called banana orbits. From eqn 3.12.9 the half-width, Ar,
of the orbit is 9hVd/(i>b, that is
.no_
Ar =
where cOce = Sj Bg/nij Thus Ar is equal to the Larmor radius calculated
for a particle of velocity uno using the poloidal magnetic field Bg
It IS now necessary to determine the conditions of colhsionality which
allow particle trapping. Potentially trapped particles have velocities lying

3.12 Trapped particle orbits 131
within the cone of velocity space satisfying eqn 3 114 Collisions cause
these particles to diffuse in velocity space and they will diffuse out of the
trapping cone in a time proportional to the square of the trapping angle,
that is
tdetrap — TT'^^coU 3.12 11
where tcoU is the collision time for a large angle scatter.
The condition for collisions to prevent trapping is that the detrapping
time be shorter than the bounce time <y^' as given by eqn 3 12 4. Thus,
using eqn 3 12.11, the colhsionahty condition for detrapping is
This condition can be estimated by using the appropriate collision tr j
te and ti for electrons and ions given in eqns 2.15.3 together with
v± = V2ut where vj is the thermal velocity. For typical tokamak
geometry and plasma densities, this gives critical temperatures of a few hundred
eV for both ions and electrons. Below the critical temperature collisions
detrap the particles.
Potato orbits
The above analysis of trapped particle orbits assuipes that the deviation
from a flux surface is sufficiently small that r is almost constant over the
orbit. From eqn 3.12.10 the requirement for this is
r^'^:^qpR^'^ 3.12.12
where p is the Larmor radius. For deuterons, qpR^^^ is typically a few
centimetres and so, apart from a small central region, trapped deuter }
have banana orbits. However, a-particles, which have a Larmor radius
more than an order of magnitude larger and are predominantly produced
in the core of plasma, will generally fail to satisfy criterion 3.12.12. These
particles have broader orbits, given the name potato orbit.
The general particle orbit can be calculated using the constancy of
the particles energy and canonical toroidal angular momentum together
with the adiabatic invariant ix = mv\/2B. Before carrying out this
calculation it is instructive to derive the potato orbit for the illustrative
case when the bounce point is on the magnetic axis.
The velocity parallel to the magnetic field is given by
2 2 2
U,, = U - V^
= -(W-fMB) 3.12.13

3.12 Trapped particle orbits
where W is the particle energy. If the turning point, wn = 0, is on the
magnetic axis, W = [mBq and
vi = vl[l-§-). 3.12.14
Using eqn 3.12.1, and examining large aspect-ratio, eqn 3.12.14 becomes
i;2= i;2 Jl^Qgg,_ 3.12.15
The toroidal equation of motion is
m^-^=e,v.Be. 3.12.16
Taking fig = B'^r and writing u^ = dr/dt, eqn 3.12.16 becomes
dvs
dr
'^'dt
and can be integrated to obtain
2m
Fig. 3.12.1 Potato orbit for particle
passing through the magnetic axis
Since u^ = v\\B^IB ~ un, eqns 3.12.15 and 3.12.17 now combine to
give the particle orbit
{^:)<^p-
where q — B/RqBq. The potato orbit is shown in Fig. 3.12.1.
General orbit
A particle's canonical toroidal angular momentum is
P0 - mRv,j, - ejf 3.12.18
where t/r is the poloidal flux function defined by eqn 3.2.2, and taking
U0 = v\\B^/B
y = ^f^ J^—. 3.12.19
" mR B^
Eliminating un between eqns 3.12.13 and 3.12.19 gives
2m(W-Aifi)= Up0+eji/r)-^J . 3.1220

3 13 Plasma rotation 133
For specified constants W, ix and p^, with the specified spatial
dependence of B, and hence fi^ and t/r, eqn 3.12.20 gives the general particle
orbit.
Plasma rotation
When neutral particle beams are injected into the plasma with a toroidal
component to their velocity, the momentum of the beam particles is
deposited in the plasma causing it to spin. Figure 3.13.1 gives an
experimental example of the spinning-up of the plasma as measured
using the Doppler shift of impurity spectral lines. The plasma can also
be spun by ion cyclotron waves but the rotation produced is much
smaller.
If particles diffusing out of the plasma were simply lost from the
surface, the plasma would develop a uniform rotational velocity over the
minor cross-section. Figure 3 13.2 shows a typical velocity profile and it
is seen that there is a considerable fall-off towards the edge, indicating
a drag force at the boundary The radial gradient of rotation also implies
a viscous drag in the plasma with an associated transport of momentum
across the plasma radius.
Centrifugal effects
The spin of the plasma introduces a centrifugal force, which invalidates
the Grad-Shafranov equation. The effect of rotation is to throw the plasma
towards the outboard side of the flux surface.
The distribution of plasma on a flux surface can be calculated using
the equation of pressure balance parallel to the magnetic field. For a
toroidally symmetric plasma this equation reduces to the equation for
pressure balance around the magnetic surface in the poloidal plane. Thus,
if i,^ is the unit vector in the toroidal direction and i/r is the poloidal flux
Fig. 3.13 1 Plasma velocity during
neutral beam injection as measured by the
Doppler shift of the impurity spectral lines
(JET)

3 13 Plasma rotation
Fig 3 13.2 Typical radial profile of
toroidal rotation of a plasma spun
by neutral beam injection (JET).
Rotation
(Revs./sec)
function, the pressure balance equation is to be applied in the i^ x Vi/r
direction.
The geometry is illustrated in Fig. 3 13 3, which shows part of a flux
surface Thedistancealongthesurfaceisi'andthemajorradiuscoordinate
IS i?. At any point on the surface the poloidal angle between the major
radius vector and the flux surface is 6. For a given surface, s = s(R) and
so for any quantity y
Fig. 3 13 3 Geometry used in the
calculation of centnfugal effects
dy
ds '
dy dR
dR ds
The pressure balance equation for any species j is
T,~-^ ^n,mjCO^Rcose +n,Z,eEs
ds ■' ■' J J "
where the temperature Tj is taken to be constant on a flux surface, Uj is
the particle density, m j and Zj e are the particle mass and charge, Es is the
component of electric field along s, and the toroidal rotation frequency,
CO, will be taken to be the same for all species.
Using relation 3 13 1
drij
"d7

3 13 Plasma rotation
and, introducing the electrostatic potential </>,
where the derivatives are all at constant t/r
Substitution of eqns 3 13.3 and 3.13 4 into eqn 3.13.2 gives
dn.
njmjw n-njz.je
and this equation can be integrated to give the density distribution
Hj = njo exp I ^ ^:—y 1
with rij = rijo and </> = 0 at a position on the surface R = Rq.
There is an eqn 3 13.5 and an unknown density, rij, for each species.
There is also an additional unknown, </> The required further equation is
the equation for quasi-neutrality
J2fijZj=^- 3 13.6
Thus eqns 3.13.5 and 3.13.6 define the problem.
For a pure hydrogenic plasma, the ion and electron densitites are
given by
( {mco^R^ - R^) - e(f>\
n\ = na exp I 1
where the centrifugal force on the electrons has been taken to be
negligible.
Using quasi-neutrality, «i = «e(= n) eqns 3.13.7 and 3.13.8 give the
potential
Te niiCO 2 2

3 14 Current drive
R(m)
Fig. 3.13.4 Toroidal rotation of tiie
plasma throws the impurity ions to the
outboard side of the plasma The
tomographic reconstruction of the soft
X-ray emission shows the resulting
asymmetry (Ingesson, L.C. et al.. Nuclear
Fusion 3S, 1675A998)).
and the particle density
n = noexp — 3.13.9
^ 2G1 + Te)
Expanding the exponential in 3.13.9
"""«\^- 2(r, + re) j
and, using the aspect-ratio expansion, the total difference. An, in density
around a surface is given by
,2r
An = noM
whereM = <yi?;„/((ri+re)/mi)'''^,r is the minorradius of the magnetic
surface and Rm is the major radius of the plasma.
The displacement to the outboard side of the plasma is sometimes
observed in the soft X-ray emission from impurities. Because impurity
ions have a larger mass than hydrogenic ions it is possible for the impurity
ion flow to have a Mach number greater than one and for quite large van-
ations of the impurity density to arise on a plasma surface Figure 3.13 4
shows an experimental example.
Current drive
The concept of a tokamak reactor operating with a current generated
by an induced electric field, and therefore as a pulsed device, has
substantial drawbacks related to the fatigue stress produced by the thermal
cycling and the interruption of the power output. These problems could
be removed by a non-inductive current drive system which would make
continuous operation feasible. The development of high poloidal beta
regimes has produced plasmas in which more than 70% of the plasma
current is earned in the form of the plasma self-generated bootstrap
current. Such operating scenarios bring the efficiency demanded of the
non-inductive current drive system within the range of technical
feasibility. Non-inductive current drive is also required for control of the
radial profile of the current density in order to avoid or control mhd
instabilities and to optimize plasma confinement. Optimization of the
plasma current density profile may require a combination of several non-
inductive current drive schemes Current drive in the plasma centre can
easily be provided by fast waves, high energy neutral beam injection or
electron cyclotron waves, whereas efficient current drive at large minor

3.14 Current drive 137
radius is more difficult because of the lower electron temperature and
the deleterious effects of trapped electrons However, lower hybrid
current drive can be used to generate current efficiently for r/a > 0.5.
There are several current drive schemes available with different attributes
and limitations. The following sections describe the features of the main
schemes.
Neutral beam injection
Neutral beam injection produces a current of fast ions circulating around
the torus. The slowing down of these fast ions by collisions with electrons
causes the electrons to drift toroidally in the same direction as the fast
ions. The electron current due to this drift is in the reverse direction to
the fast ion current, so there is some cancellation between these two
components. The degree of cancellation depends on the charge, Zfe, of
the fast beam ions, the effective plasma ion charge, Zeff e, and the number
of trapped electrons. Since there can be near cancellation of the fast
ion and electron currents, correct calculation of the net current requires
accurate evaluation of the electron current. In the usual regime, where
the electron thermal velocity significantly exceeds the fast ion velocity,
use of the Fokker-Planck equation to calculate the beam driven current in
the large aspect-ratio approximation and in the low collisionahty banana
regime gives,
Y = l-^ + lA6^e^A{Z^ff) 3.14.1
where ///f is the ratio of the net current to the fast ion current and
e = r/i? is the inverse aspect-ratio. For fast ion velocities which are much
less than the electron thermal velocity, as is normally the case, values of
the function A range from 1.67 for Zeff = 1, to 1.18 for Zgff = 4. In
eqn 3.14.1 the second term on the right hand side represents the reverse
electron current in the absence of trapped electrons and the third term
takes their effect into account. Equation 3.14.1 is normally applied locally
in the plasma to calculate the beam driven current density at a given
magnetic flux surface. In a tokamak the fast ion current stacks up during
the injection period as the fast ions circulate repeatedly around the torus.
A steady state is reached when the build up rate of current due to stacking
is balanced by the loss rate due to slowing down through collisions with
the plasma electrons and bulk ions, or to charge exchange of the fast ions
with neutral atoms. In the case where charge exchange dominates the loss
process, the fast ions can be considered to be at constant speed so that the
fast ion current density on a specific flux surface is given by,
if = jiV\\rcx/2nR
where ji is the injected current density, un is the fast ion velocity parallel
to the magnetic field and tcx is the charge exchange time. The fast ion

3.14 Current drive
current density can also be written in terms of the fast ion source rate per
unit volume, S,
if = SrcxeZfV\\.
It is usually necessary to use a neutral beam power deposition code, which
takes into account the injection geometry, to determine the radial profile
of the beam deposition.
Furthermore, to compute the local fast ion current density, jf, a two-
dimensional Fokker-Planck or Monte Carlo calculation of the beam ion
velocity distribution is generally necessary, including the effects of
trapping of the fast ions In the absence of trapping, a relatively simple analytic
solution can be found and the current density is given by.
Sx^eZfVQ r' , - 3 ,
A + uD Jo
where ts is the fast ion slowing down time and u is the fast ion velocity
normalized to the injection velocity, vq. The distribution function /i is
the first order Legendre polynomial component of / given by
fl =
where
P=-
„3
miZeff
2mfZ
SV^r meZu|g
Y^ mfn\Z^
the subscript i referring to the plasma ions.
The efficiency for generating the fast ion current, defined as jf divided
by the power per unit volume Pd(=^mfVQS), is given by
Pd mfvoil + u^) Jo
Evaluation of this expression shows that the highest efficiency is
achieved by operating at the highest electron temperature and lowest

3 14 Current drive 139
electron density in order to maximize ts, and by choosing the fast ion
energy to be close to the so-called critical energy, for which Mc ~ 1,
at which the effects of collisions with electrons and collisions with ions
are approximately equal, as described in Section 5.4. In practice, the
beam energy is usually determined by beam penetration requirements.
The radial profile of the beam driven current is determined by the beam
energy, the deposition profile, and the injection angle.
Neutral beam current drive has been observed in most large tokamaks,
although in many cases the neutral beam injection systems were not
optimized for high current drive efficiency. Experimental measurements
are generally in good agreement with theoretical predictions. A neutral
beam driven current of 0.34 MA was measured in TFTR for an injected
power of 11.5 MW. The bootstrap current was calculated to be 0.5 MA in
this case, indicating that the total plasma current of 0.9 MA was
predominantly non-inductively driven. In DIII-D and JT-60U, the entire plasma
current of 0.35 and 0.5 MA, respectively, has at low density, been
maintained by a combination of bootstrap current and neutral beam current
drive. In JET, a neutral beam driven current of 0.25 MA has been observed.
All these results were obtained using neutral beams based on the
acceleration and subsequent neutralization of positive ion beams. However,
for the plasma parameters characteristic of a fusion reactor, adequate
beam penetration requires very high energy neutral beams with
energies ~1 MeV. Since the neutralization efficiency of positive ion beams
decreases rapidly with increasing energy, systems based on negative ion
beams must be deployed in a reactor as explained in Section 5.5. Such
a system has been installed on JT-60U where a neutral bepm driven
current of 1 MA was measured for an injected power of 3.75 MW at a beam
energy of 360 keV.
Lower hybrid current drive
The most effective non-inductive current drive scheme in present day
tokamaks is based on current drive by travelling waves in the lower
hybrid range of frequencies. Present experiments use frequencies in the
range 0.8-8 GHz. By using a phased waveguide array antenna, power
may be coupled to lower hybrid waves with high phase velocity parallel
to the magnetic field. These waves are resonant with high energy
electrons having a parallel velocity which matches the phase velocity of the
wave and absorption takes place through Landau damping as described in
Section 5.7. The phased array antenna ensures that most of the power is
coupled to waves propagating in a particular toroidal direction so that the
wave-particle interaction occurs preferentially with electrons travelling
in that direction. In the simplest picture, the lower hybrid waves directly
impart momentum to these electrons which, in steady state, leads to the
generation of a current determined by the balance between the momentum
input and the loss by collisions to the ions. However, a more
important effect is that the accelerated electrons become less collisional and

3 14 Current drive
lose momentum at a slower rate. Since electrons moving m a particular
toroidal direction are preferentially heated, this gives rise to a so-called
'asymmetric resistivity' and accounts for 75% of the driven current.
The action of the lower hybrid wave is to accelerate electrons from a
velocity v\\, parallel to the magnetic field, to a velocity v\\ + Ai;||. This
requires an incremental energy input per unit volume
AE = «eWeW||Ai;||.
Assuming that the velocity of an electron v is randomized by collisions
on a momentum destruction timescale l/v(v), this incremental energy
input produces an incremental current density j that persists for a time 1 / v
AEe
j = HeeAvii = .
meV\\
The power density required to refresh this current at time intervals of 1/v
Pd = vAE
Hence the 'current drive efficiency' is given by
Pd meW||V
For uii » UTe, V a l/w«, and so
This simple treatment serves to illustrate the important influence of colli-
sionality leading to a strong dependence of the current drive efficiency on
the parallel electron velocity and hence the parallel wave phase velocity
(since the parallel phase velocity CL>/k\\ = v\\ at Landau resonance, where
k\\ is the parallel component of the wave-vector). An accurate
calculation of the current drive efficiency requires a two-dimensional treatment
of velocity space dynamics. For a general velocity displacement in the
direction s it can be shown that
j _ e 2 s-C/31;)(UIIi;3) ^^^^
Pd VoWewIe (^ + ^eff) S ■ C/3u)i;2
where vq is a characteristic electron-ion colUsion frequency given by
(ot. In A
Vq =
47r«e%
For lower hybrid waves s is in the parallel direction and from eqn 3.14.2
-^ a i;-' (vj + ui)^^^ + 3i;|| (uj + ui) '^^ 3.14.3

3 14 Current drive 141
where the velocity v±, perpendicular to the magnetic field, is much less
than uii for the resonant electrons Equation 3.14 3 shows that the term
arising from the energy input is three times larger than the term arising
from the momentum input. Thus the asymmetric resistivity provides three
quarters of the current. This effect requires no momentum input from the
wave since the parallel momentum of the current carrying electrons is
balanced by an equal and opposite momentum in the ions, which carry
a negligible amount of current due to their much higher mass and hence
lower velocity for the same momentum.
It is convenient to introduce normalized parameters u = v/vj^,
J = j/irieevjg) and Pd = Pd/{nemeVoVj^). Equation 3.14.2 then
reduces to
J__ 2 s-C/3«)(»||»3) ^^^^
Pd E + Zeff) S • C/3«)m2
For lower hybrid waves in the high velocity limit, u\\ » m_l, this gives
a M|| a .
^d Wjg
The efficiency of any current drive method in practical units is given by
I ^ Aj
P InRApi
where / is the total current driven, P is the total power and A is the
plasma cross-sectional area. In terms of the normalized ci|rrent and power
densities defined above this becomes
- = 0.061 %: ( — ) AW~' Te in keV
P i?(«e/1020)lnA V^dy
Thus, in the suprathermal, but non-relativistic, limit discussed above
for lower hybrid waves I IP scales quadratically with the phase
velocity (through the factor J/Pd), inversely with major radius and density,
and has only a weak dependence on Zeff. In this particular case there is
no dependence on electron temperature since J / Pd varies inversely as
Ujg. This is not the case for most other schemes which do not generate
suprathermal electrons and so have a favourable scaling with Tg. However,
the capability of lower hybrid waves to give high current drive efficiency
even in moderate temperature plasmas, due to strong Landau damping on
suprathermal electrons, has resulted in an abundant database of results
compared with other schemes, giving rise to the convention of defining
a current drive figure of merit ?? in terms of the scaling for suprathermal
electrons, namely.
where «e is the line-average electron density. For most schemes ri depends
on Te A full treatment of the problem, in which the response of the

3.14 Current drive
Fig. 3.14.1 Sustainment of the full
plasma current in a 3 MA JET discharge by
lower hybrid current drive Signals shown
are plasma current /p, lower hybnd power
Pui, and resistive loop voltage
Vres(=Vioop-(l//p)d/dfBLl2)) The
resistive voltage is the loop voltage
corrected for inductive effects and
represents the voltage required to sustain
the plasma current. A zero resistive voltage
indicates that the plasma current is fully
sustained by the lower hybrid waves.
(Ekedahl, A. et al., Nuclear Fusion 38,
1397A998))
electron distribution function to a finite spectrum of launched waves is
calculated, requires a solution of the two-dimensional Fokker-Planck
equation including electron trapping and relativistic effects
In many tokamak experiments it has been possible to drive the
complete plasma current by lower hybrid waves. Some experiments have also
demonstrated discharge start-up by lower hybrid waves Plasma currents
of 3.6 and 3 MA have been fully sustained by lower hybrid current drive in
JT-60U and JET (Fig 3 14 1), respectively. A current drive figure of merit
?j > 0 3 AW~'m~^ has been achieved in these devices In TRIAM-1 M,
a plasma current of 20 kA was sustained for 2 h whilst in Tore-Supra a
plasma current of 0.8 MA was sustained for 2 min by lower hybrid waves
Current drive at high density, ~10^^m~-^, has been demonstrated using
high frequency lower hybrid waves in Alcator-C and FTU
In present experiments lower hybrid waves typically transit the plasma
many times before full absorption occurs. Nevertheless, the effectiveness
of lower hybrid waves for control of the radial profile of plasma current
has been demonstrated in many tokamaks As shown above, waves with
the highest phase velocity give the highest current drive efficiency but
these waves also have the poorest penetration due to mode conversion
Although lower hybrid waves are expected to be absorbed in a single pass
for plasma parameters characteristic of a fusion reactor, strong Landau
damping and mode conversion are expected to limit penetration of the
waves to the outer half of the plasma in this case
Fast wave electron current drive
Fast wave current drive using fast magnetosonic waves in the ion cyclotron
frequency range is similar to that by lower hybrid waves in that the waves
damp at the Landau resonance However, the force on the electrons is
due not only to the parallel electric field of the wave but also to the
interaction between the parallel gradient of the wave's magnetic field and the
magnetic moment of the electron ansing from its gyro-motion, so-called
transit time magnetic pumping (TTMP) The net interaction is much

3.14 Current drive 143
weaker than for lower hybrid waves. Furthermore, other absorption
mechanisms, associated with cyclotron resonances for example, can compete
with electron Landau damping and TTMP Typically only 10-20% of the
launched power is absorbed in a single pass through the plasma in
existing tokamaks Power is deposited centrally, typically within r/a ~ 0 4,
and the interaction does not produce suprathermal electrons The single
pass absorption is expected to increase to ~50% in the next generation
of tokamaks such as ITER A current of about 100 kA has been driven
in Din-D and Tore-Supra using fast waves. In DIII-D the current drive
figure of merit, r], was observed to increase linearly with central electron
temperature, in agreement with theoretical predictions, reaching values
in excess of 0 04 AW~' m~^ In ITER, a current drive figure of ment in
the range 0.15-0.25 AW~' m~^ is expected, depending on the electron
temperature Unlike some other schemes, fast wave current drive has no
penetration problems with the high density plasmas required in reactors.
Electron cyclotron current drive
In the case of lower hybrid current drive, only 25% of the driven current
anses from direct momentum input from the waves (eqn 3.14.3), the
remaining 75% resulting from the energy input which gives rise to an
'asymmetric resistivity' In fact even waves with negligible momentum,
such as electron cyclotron waves, can be used to drive current, by heating
only those electrons circulating in a particular toroidal direction. These
preferentially heated electrons collide less often with the ions than do
those electrons circulating in the opposite toroidal direction Thus the
electron population transfers net parallel momentum to the ions and the
two species drift in opposite toroidal directions generating a current
The effect can be quantified by further analysis of eqn 3.14.4. The
action of the electron cyclotron wave is to accelerate electrons primarily
in the perpendicular direction. In this case eqn 3.14 4 gives
J 2 3
Pi E + Zeff) ^2 " >
For lower hybrid waves which accelerate electrons primanly in the
parallel direction eqn 3.14.4 gives
— - 2 (—\ (A 2
^d ~ E + Zeff) \M\) ^ "" ^
Companng eqns 3.14.5 and 3 14 6 we see that, in the high velocity limit
where MII i$> mx the normahzed electron cyclotron current drive efficiency
IS 3/4 of the lower hybrid current drive efficiency. The results of linearized
Fokker-Planck theory are shown in Fig 3.14.2 and agree with the above
analysis for suprathermal parallel electron velocities.

3.14 Current drive
Fig 3.14.2 Comparison of theoretical
current drive efficiency for: (i) deuterium
beams injected into a D-T plasma; (ii)
Landau damping of lower hybnd waves;
(iii) electron cyclotron waves, and (iv) He^
minority ions in a deuterium plasma. The
scale gives the ratio of the total current
/ (A) to the total power injected, P (W),
into a tokamak plasma of major radius R
(m), density n (lO^") m^^), and
temperature Tc (keV). v is the wave phase
velocity, or beam ion velocity, and uxe the
electron thermal velocity.
10"^ 10"
The electron cyclotron resonance condition for interaction in the
vicinity of the /th cyclotron harmonic is given by
-IcOceiR) =k\\V\\
3 14 7
where the electron gyro-frequency coce is a function of major radius
through the dependence of the toroidal magnetic field on R. The
frequency shift of the resonance, represented by the term on the right hand
side of eqn 3 14 7, anses due to the Doppler effect From the
resonance condition it can be seen that, for a given directivity (given sign of
k\\), the resonant parallel velocity changes sign on opposite sides of the
'unshifted' resonance, (o = Imcs, giving rise to opposing toroidal currents
Hence strong single pass absorption is required for high current drive
efficiency to ensure that the waves are damped on one side of the resonance
layer only Fortunately this is usually the case in present tokamaks The
strong, locahzed absorption of waves in the electron cyclotron frequency
range, and the ability to control the absorption location by steering of the
launched microwave beam or adjustment of the toroidal magnetic field,
makes electron cyclotron waves particularly suitable for the control of
mhd instabilities by local current drive. Control of sawteeth and
stabilization of teanng modes by electron cyclotron current drive has been
effectively demonstrated in a number of tokamaks Current drive
efficiencies have been compared with theoretical predictions made using ray
tracing codes to obtain the power deposition, coupled to Fokker-Planck
calculations of the current density Measured currents are in reasonable
agreement with such calculations if the effects of electron trapping,
relativity and radial electron diffusion are included A current drive figure
of merit in excess of 0 03 AW~' m~^ has been reported in T-10, and in
TCV a plasma current of ~ 150 kA has been fully sustained using electron
cyclotron waves
Electron cyclotron waves are effective for both current drive in the
plasma core and off-axis current drive. For core current drive in ITER,

3.14 Current drive
145
a current drive figure of merit in the range 0 2-0.3 AW~ m~ may
be achievable, depending on the electron temperature and the electron
cyclotron system parameters. However, for current drive at large minor
radius, electron trapping can have a strong deleterious effect on the current
drive efficiency
Fast wave minority ion current drive
The same principles can be applied to current drive, in the ion cyclotron
frequency range, by asymmetric heating of a minority species of ions
introduced into the plasma. The heating, through its effect on lon-ion
collisions, creates oppositely drifting ion species, and a net current flows
if the charge to mass ratios of the ions are different As in the case of
neutral beam injection, the friction between the ions and electrons causes
an electron current to flow which tends to cancel the ion current. The
efficiency for the case of He^ minority ions in a deuterium plasma is
shown in Fig 3.14 2, and is similar in magnitude to that for current drive
by neutral beams
Evidence for such current dnve has been obtained in JET using directed
fast waves and a hydrogen minority resonance touching the ^ = 1 surface
The minority ion current drive is predicted to produce a local bipolar
perturbation to the current density profile, due to absorption either side of the
unshifted resonance, which leads to opposing driven currents for a fixed
wave directivity When positioned close to the ^ = 1 surface, such a local
bipolar current density perturbation affects the sawtooth instability This
was the case in the JET experiment, as shown in Fig 3.14 3. With waves
directed anti-parallel to the plasma current the sawtootl( oscillations were
almost completely stabilized With waves in the opposite direction the
sawtooth oscillations were destabilized and the sawteeth became short
and of small amplitude. The plasma temperature profile was flattened
inside the sawtooth inversion radius at a value of 4 keV compared with
a peaked temperature profile of 6 keV central value for the stabilizing
antenna phase This temperature difference resulted in a factor of two
change in the D-D fusion reactivity.
Fig. 3 14.3 The effect of minority
current drive on the stability of sawtooth
oscillations, as seen on the soft X-ray
intensity, when the current is driven at the
q = 1 surface With the phase of the
antenna currents (j) = +90° the sawteeth
are stabilized for extended periods For
(j) = -90° the direction of driven current is
reversed and the sawteeth are less stable,
taking the form of very rapid, small
amplitude oscillations, the level of the
X-ray intensity being the same as that after
the sawtooth relaxations in the (p = -|-90°
case. (Bhatnagar, VP et al Nuclear
Fusion 34, 1579 A994)).
20
10
Soft X-ray
(a.u)
10
n
T/%lvU P
V
1
wvvw\. \
1 /
Current \
dnve ^-_^i
0=+9O° 1 ^^
0 = _9O° 1 \.^_^
15 16 17 18 19 20
Time (s)

Summary
There exists a wide range of non-inductive current drive methods
possessing a vanety of different characteristics and attributes For example
electron cyclotron current drive offers the potential of localized,
controllable non-inductive current drive, well-suited for control of mhd
instabilities, whilst lower hybrid current drive offers the potential of high
current drive efficiency in the outer half of the plasma The plasma current
has been fully sustained in many tokamaks by non-inductive current drive
Due to the interaction with suprathermal electrons, lower hybrid current
drive has produced the largest current so far in existing devices It is likely
that a combination of schemes will be employed in a reactor Measured
current drive efficiencies are generally in good agreement with theory,
although the experimental database is rather limited at high plasma
densities The projected non-inductive current drive efficiency in a steady-state
tokamak reactor leads to an intolerably high recirculating power unless
a large fraction of the plasma current is self-generated by the bootstrap
effect Bootstrap currents of more than 70% of the total plasma current
have been established in existing tokamaks
Bibliography
Toroidal equilibrium is described in chapters of the books
Miyamoto, K Plasma physics for nuclear fusion MIT Press,
Cambridge, Mass A989)
Bateman, G MHD instabilities. MIT Press, Cambndge,
Mass A978).
Freidberg, J P Ideal magnetohydrodynamics Plenum Press,
New York A987).
White, R B Theory oftoroidally confined plasmas. Impend
College Press B001)
The general equilibrium problem is treated in
Shafranov, VD Plasma equilibrium in a magnetic field
Reviews of plasma physics (ed. Leontovich, M A ) Vol. 2,
p. 103, Consultants Bureau, New York A966)
An extensive treatment of the properties of magnetic field
configurations is given in
Solovev, L S and Shafranov, V.D Plasma confinement
in closed magnetic systems Reviews of plasma physics
(ed Leontovich, M A ) Vol 5, p 1, Consultants Bureau,
New York A966)
A more practical account of the tokamak case is given in the
review paper
Mukhovatov, VS. and Shafranov, VA Plasma equilibrium
in a tokamak Nuclear Fusion 11, 605 A971).
Grad-Shafranov equation
Which should perhaps be called the SLSG Equation, the
original references being
Shafranov, V.D On magnetohydrodynamical equilibnum
configurations Zhurnal Experimentalnoi i Teoreticheskoi
Fiziki 33,710 A957) [Soviet Physics JETP 6, 545 A958)].
Lust, R and SchlUter, A, Axialsymmetnsche magne-
tohydrodynamische gleichgewichtskonfigurationen Zeit-
schnftfur Naturforschung 12A, 850 A957)
and
Grad, H and Rubin, H. HydromagneUc equilibna and
force-free fields. Proceedings of the 2nd United Nations
International Conference on the Peaceful Uses of Atomic
Energy Geneva 1958 Vol. 31, 190 Columbia University
Press, New York A959).
Large aspect-ratio
Shafranov, VD Section 6 of Plasma equilibrium in
a magnetic field Reviews of plasma physics (ed.
Leontovich, M A ) Vol 2, p 103, Consultants Bureau,
New York A966)

Vacuum magnetic field
Mukhovatov, M.S and Shafranov, V.D Plasma equilibrium
in a tokamak Nuclear Fusion 11, 605 A971)
Particle orbits and particle trapping
Particle trapping in tokamaks is descnbed in
Kadomtsev, B B and Pogutse, O P Plasma instability of
trapped particles in toroidal geometry Zhumal Experi-
mentalnoi i Teoreticheskoi Fiziki 51, 1734 A966) [Soviet
Physics, JETP 29, 1172 A967)]
and an account is given in Chapter 3 of
Miyamoto, K Plasma physics for nuclear fusion MITPress,
Cambndge, USA A989)
Potato orbits were identified and described by
Stringer, TE Radial profile of a-particle heating in a
tokamak Plasma Physics 16, 651 A973)
Plasma rotation
The centrifugal effects of plasma rotation were described ir
Wesson, J A Poloidal distribution of impunUes in <
rotating tokamak plasma. Nuclear Fusion 37, 577
A997)
Current drive
Current dnve by neutral beam injection was suggested by
Ohkawa, T Pnnciples of current drive by beams Nuclear
Fusion 10, 185 A970)
The use of high velocity RF waves was proposed by
Fisch, N J Pnnciples of current dnve by Landau damping of
travelling waves Physical Review Letters 41, 873 A978)
A useful overview of current dnve is provided by the
Proceedings of IAEA technical committee meeting on non-
inductive current dnve in tokamaks, Culham 1983,
Culham Laboratory Report CLM-CD A983)
A comprehensive and extremely clear review of the theory of
most types of non-inductive current dnve methods is that of
Fisch N J Reviews of Modem Physics, 59, 175 A987)
The application of non-inducuve methods for optimizing the
current dnve and profile control is discussed in
US-Japan Workshop on the Physics Issues for Steady-
State Tokamaks, June 1993, RIAM, Kyushu University,
FURKU report 93-02@2)

Confinement

4 1 Tokamak confinement
4.1 Tokamak confinement
To achieve thermonuclear conditions in a tokamak it is necessary to
confine the plasma for a sufficient time, as described in Chapter 1 The
global energy confinement time is defined by
tE =
41 1
where P is the total power input Confinement is limited by thermal
conduction and convection processes but radiation is also a source of
energy loss
In the absence of instabilities the confinement of a toroidally
symmetric tokamak plasma is determined by Coulomb collisions The
transport of particles and energy which would occur under these
circumstances has been calculated Unfortunately the transport which actually
occurs does not agree with the calculated values In particular the thermal
transport by electrons can be up to two orders of magnitude higher than
predicted
It IS thought that the observed anomalous transport is due to instability
of the plasma, which causes the particles and the energy to escape at a
higher rate This could occur either through perturbations which allow
transport across the nested magnetic field structure or through a break-up
of this structure, allowing particles and energy to flow along magnetic
field lines which themselves follow stochastic trajectories However,
although fluctuations of vanous sorts are observed in tokamaks, their
relation to the observed transport is not clear Furthermore, although a
range of instabilities has been predicted theoretically, there is no
conclusive agreement between calculations of the resulting transport and the
experimental behaviour
In the absence of a theoretical understanding of confinement, and given
the need to predict the confinement properties of future tokamaks, it has
been necessary to resort to empirical methods The simplest of these is to
accumulate data from a number of tokamaks, each operated under a range
of conditions, and to use statistical methods to determine the dependence
of the confinement time on the parameters involved This provides scaling
expressions which, within some error, allow extrapolation to projected
tokamaks
Nevertheless, to explain the so-called anomalous transport is one of the
most important challenges to theoretical tokamak physics It is inevitable,
however, that the route to understanding must start with an analysis of the
irreducible transport ansing from collisions In particular this provides
a basis against which to measure the anomalous effects Even this basic
case, without the complications of instabilities, is quite subtle
In a cylindrical plasma the collisional transport of particles and energy
can be understood in terms of a simple diffusion process, and this is called

4.1 Tokamak confinement 151
classical transport The particles suffer collisions with a characteristic
colhsion time tc A collision allows the particle to step across the
magnetic field with a step length equal to the Larmor radius, p This gives a
diffusion coefficient D ~ p^/tc and hence an approximate confinement
time r ~ a^/D, so that
where a is the plasma radius
Since the collision time and the Larmor radius are both proportional
to the square root of the particle mass, the classical energy confinement
time associated with the electrons is greater than that for the ions by the
ratio (mi/me) '^^ However because collisions between like particles do
not produce net particle diffusion, the electron and ion diffusion rates are
both determined by electron-ion collisions and both the species diffuse
at the rate given by the random walk argument for electrons
In a torus the classical transport model described above is
inappropriate for a number of fundamental reasons To keep the distinction clear,
the colhsional transport in a torus is known as neoclassical At low
temperatures, for which the plasma is very colhsional, the fluid equations
which describe the behaviour in a cylinder can also be used for the torus
However the behaviour is quite different There is a toroidally induced
force on the plasma outward along the major radius, and this leads to
an internal convective flow The net particle transport resulting from this
flow IS larger than the 'cylmdncal' contribution
At higher temperatures the fluid model is inap^cable The lower
collision frequency allows particles to have trajectories determined by
the toroidal geometry In particular particles which are trapped in the
lower magnetic field on the outer side of the torus have banana orbits
whose width is (^/e '/^)p These larger orbits allow a greater diffusion to
result from collisions than would occur for a Larmor radius step-length
The transport in the highly colhsional fluid regime is called Pfirsch-
Schluter transport This regime is connected to the low collisionahty
banana regime by the so-called plateau regime in which there is no
dependence on the collision frequency In all of these regimes the mass
dependencies of classical transport persist
The energy confinement time scaling of Pfirsch-Schluter and banana
regime transport with respect to density, temperature, magnetic field and
plasma size, I, is
TE ~ -r, 4 1 2
n
where fip is the poloidal magnetic field Experimental confinement times
are not only much shorter than the neoclassical prediction, but also differ
in scaling from relation 4 12 The experimental data available do not
allow a unique scaling to be deduced and several are in use However, the
general behaviour can be illustrated using a scaling obtained by Goldston

4.2 Resistive plasma diffusion
for auxiliary heated tokamaks. This scaling, which has proved reasonably
satisfactory over a wide range of parameters, has the form
te a
nT
413
Although no generally accepted theoretical basis for scalings such as
4 13 has been given, it has been appreciated that dimensional analysis
imposes useful constraints on therr possible forms. Conversely the
empirical scalings can shed light on the physical processes responsible for the
anomalous losses
The difference in temperature dependence between the expected form
4 1.2 and the empirical form 4 1 3 has made the achievement of high
temperatures more difficult than might have been hoped It has meant
that as higher heating power is applied, and higher pressures are reached,
the confinement deteriorates Using eqn 4 1 1 with relation 4 13, it is
seen that the confined energy only increases as the square root of the
applied power
It was found, however, that under certain conditions there is a
discontinuous improvement in confinement as the heating power is increased
Typically there is a factor of two increase in the confinement time This
regime of higher confinement is called the H-mode and the previous
lower level is called the L-mode The H-mode is achieved more readily
in plasmas bounded by a separatnx The improvement in confinement is
mainly due to the appearance of an edge transport bamer, a region of better
confinement at the edge of the plasma A number of other improved
confinement regimes, in particular those involving internal transport bamers
with hollow current profiles, have also been identified
Using internal measurements of the density and temperature, together
with a knowledge of the power deposition, it is possible to analyse the
local confinement properties of the plasma and determine the plasma
diffusivity and the electron and ion thermal diffusivities This detailed
information places strong constraints on possible theoretical models of
the transport, to the extent that no generally accepted model has yet
emerged
Resistive plasma diffusion
The resistive diffusion of plasma across a magnetic field is described by
Ohm's law together with the pressure balance equation, that is
E + vxB = r]j 421
and
JxB = Vp, 422

4.3 Diffusion in a cylinder
153
Fig. 4.2.1 Vector geometry of
(vx B)xB = -B^v± The vecto
B are in the plane of the paper
4.2.3
where in general the resistivity is a tensor having a value ri\\ for current
parallel to the magnetic field and r]± for current perpendicular to the field.
The velocity perpendicular to the magnetic field is obtained by
taking the cross-product of eqn 4.2.1 with B. Figure 4.2.1 gives the vector
geometry of the term (v x B)xB showing that
(v xB)xB = -B^v±.
^ Thus using eqn 4.2.2 to ehminate j x B,
E X B Wp
In a perfectly conducting plasma E + v x B = 0 and it was shown in
Section 2 21 that this equation implies that the plasma motions are such
that the magnetic flux through any element of fluid remains constant. The
first term on the right of eqn 4.2 3 gives the velocity which occurs to
maintain this condition in the presence of an electric field. The second
term gives the deviation from this velocity due to resistivity. This resistive
contribution to the velocity is driven by, and proportional to, the pressure
gradient. The diffusive nature of this term is seen using the continuity
equation. Thus taking E =0 and constant temperature, the rate of density
change (= V • nu^) is given by
dt 2/^0
where ^ = nT/iB'^/lno), giving a diffusion coefficient
The two terms in eqn 4.2.3 can also be understood in terms of a particle
description. The first term is just the macroscopic effect of the £ x B
drift of all the individual particles as described in Section 2.6. The second
term represents the collisional diffusion of the particles.
From Section 2.16, ??j_ ~ ms/ne^Xc and using pe = V2meVTe/eB
with P ~ nnieVj^/(B^/2ixo) eqn 4.2.4 gives
4.2.4
This is the same relation as that derived from a random walk model with
a step length pe and a step time tg.
Diffusion in a cylinder
The diffusion velocity in a circular cylinder is given by eqn 4.2.3. The
diffusion is radial and so, using cylindrical coordinates ir,6,z), the

4.3 Diffusion in a cylinder
velocity is
Vr = ^(^EoB,-E,Bo-r,^^y 4.3.1
For a given particle source and known electric and magnetic fields
eqn 4.3.1, together with the continuity equation, allows a
determination of dp/dr. In the absence of sources a solution is still possible and
in particular there is a steady state solution for which v, = 0. In a steady
state V X £ = 0 and this implies Eg = 0 and E^ = constant. With this
condition eqn 4.3.1 gives
^=-^^. 4.3.2
dr rj±
In a tokamak the axial magnetic field is much larger than the poloidal
magnetic field and for /6p ~ 1 the axial current density is much larger
than the poloidal current density. If the corresponding limit is taken
in the cylindrical case it is possible to determine the ^p. With these
approximations the parallel component of Ohm's law is
Ez = mJz 4.3.3
and substituting eqn 4.3.3 into eqn 4.3.2
-— = -JzBg. 4.3.4
dr r]±
Now, from eqn 3.5.1
2 fn pr dr
and for p{a) = 0 an integration by parts gives
2fprdr = ~ r
Jo Jo
Using Ampere's law
lid.
in eqn 4.3.4 and substituting for dp/dr into eqn 4.3.6 gives
Jo r]± 2ixo
so that, from eqn 4.3.5
^ = X 4.3.7
V±
For rjii = r]± eqn 4.3.7 gives ^p = 1. This is simply a consequence of
there being no poloidal current in this case, the axial electric field driving

4.4 Pfirsch-SchliJter current
155
an axial current. For the classical case ri\\/ri± = 1/2, a poloidal current
arises from the axial electric field, the current being 'deflected' by the
anisotropic resistivity. This poloidal current enhances the axial magnetic
field, a phenomenon called the paramagnetic effect.
Pfirsch-Schliiter current
Resistive diffusion in a toroidal plasma is considerably more complex
than that in a cylinder. The basic reason is that the plasma pressure
gives a toroidal hoop force outward along the major radius as shown
in Fig. 4.4.1. This force must be balanced by an internal magnetic force,
and the currents which produce this force are driven by a plasma flow
which is specific to the torus and is absent in the cylinder.
The current required to balance the pressure force is perpendicular
to the magnetic field and is essentially a vertical current. This current
alone would lead to charge accumulation in the upper and lower parts of
the plasma. Charge accumulation is prevented by a return current which
flows along the magnetic field and does not therefore affect the force
balance. This parallel current was discovered by Pfirsch and Schliiter who
showed that, through its resistive dissipation, it plays ^fundamental role
in the plasma diffusion in a torus. Before calculating the Pfirsch-Schliiter
current a heuristic account will be given.
The plasma pressure is constant on each flux surface, but through
toroidal geometry the surface area is larger at larger major radii. The
resulting pressure imbalance gives rise to a net outward force density
along the major radius
In toroidal geometry plasma
o an outward hoop force
R dr'
This is balanced by a y x B force. Thus the associated perpendicular
current, jh, has a vertical component
1 r dp
'U~d^'
To avoid charge accumulation the Pfirsch-Schliiter current, jps parallel
to the magnetic field, must be such that its vertical component is equal and
opposite to jhv as illustrated in Fig. 4.4.2. Since this vertical component is

4.4 Pfirsch-SchliJter current
Fig. 4.4.2 Showing the balancing of the
vertical component of the Pfirsch-Schluter
current and the perpendicular hoop force
current jj,.
4v+yiiv=o
where fip is the poloidal magnetic field, relations 4.4.1 and 4.4.2 give the
required current
;ps "
_J_^dp
Bp R dr'
The correct expression for a plasma with a circular cross-section in the
large aspect ratio limit has the form of relation 4.4.3 but with a numerical
factor 2 as will be shown below. Because the angle of the magnetic field
to the vertical varies with the poloidal angle as cos 0, the required vertical
component of jps implies that jps varies as cos 6, its toroidal direction
being of opposite signs on the inboard and outboard side of the torus.
The formal calculation requires a more precise form for jy. This is
obtained by writing the poloidal current density, _/p as the sum of its
components from jn and j±. Thus defining
J± =
-iJxB)xB/B',
jp can be written
Equations 3.3.2 and 3.3.3 give
Jp
■' R
and since
j±
= i|Vpl
fidt/r'
RBp dp
B~df

4.4 Pfirsch-SchliJter current 157
and, from eqn 3.2.4 RBtp = fiof, eqn 4.4.4 can be written
J\\=fB —, 4.4.5
where f = f(f) and the prime denotes a derivative with respect to i/r. In
steady state the quantity /' is determined by the requirement that, from
V X £ = -dB/dt,
where ds is a poloidal line element along the magnetic surface, Ep^ is
the component of the electric field in the direction of Bp, and the line
integral is taken round a flux surface in the poloidal plane. Sps is giver
by the component of Ohm's law parallel to B
V\m = ^Ep, + ^E^. 4.4.7
Using eqn 4.4.5 for j\\ and eqn 4.4.7 for Sps, eqn 4.4.6 gives
(l/fip> (£^fi^/fip>
r
where the averages are defined by
{x) = (b xds / (b ds
and it has been assumed that r]\\ = rjniijr).
Substituting eqn 4.4.8 into eqn 4.4.5 gives the required equation for ;||
/I (l/Bp) \ (S^fi^fip)
The last term on the right hand side of eqn 4.4.9 gives the parallel current
driven by the applied electric field E^. The other term is the Pfirsch-
Schluter current, that is
Equation 4.4.10 is exact. The expression for the circular cross-section
large aspect-ratio case is obtained by calculating the required averages.

4.5 Pfirsch-Schlijter diffusion
Taking fip/fi^ ~ e, with
^ l+ecos0
where s = r/Ro, together with
fip = fie(l + eA(r)cos6i), 4.4.12
where A(r) is determined for a particular equilibrium by eqns 3.8.1
and 3.8.2
,2s J
jps = -mfp-^ COS0 + O(e^).
Substitution of
/ = RBIiiQ and p' = {dp/dr)/RBe
then gives the Pfirsch-Schluter current
^^ r dp
7PS = —2 COS0.
•^ Be R dr
4.5
Pfirsch-SchliJter diffusion
Plasma diffusion in a cylinder was described in Section 4.3. The fluid
equations used there also describe the diffusion in a torus for a low
temperature, collisional plasma. The requirement on collisionality is that
collisions are sufficiently frequent that the trapping of particles in the
region of lower magnetic field is negligible. Under these conditions
the diffusion velocity is given by eqn 4.2.3 and in toroidal geometry
the velocity perpendicular to the flux surfaces is
EpsBs — Ed,Bn V_|_p
'^ = ¥2 '^-^T'
where V±p represents the scalar magnitude of Vp.
It is now necessary to obtain an expression for Eps in terms of known
quantities and this is done using the component of Ohm's law parallel to
the magnetic field given in eqn 4.4.7. Substituting for Eps in eqn 4.5.1,
4.5.1
v± =
^^wJw -^±-
fi2
fio'
4.5.2
4.5.3
Using eqn 4.4.9 with eqn 4.4.10, eqn 4.5.2 becomes
fi0 Vxp^ 1 ({E^B^IBp)
The last three terms on the right hand side of this equation correspond to
pressure gradient and electric field terms in the cylindrical case as they

4.6 Banana regime transport 159
appear in eqn 4.3.1. The first term is proportional jps and this term gives
the toroidal contribution called Pfirsch-Schluter diffusion.
The velocity v± is a function of the poloidal angle and the total plasma
flux across a magnetic surface is given by the poloidal line integral around
the surface
r = Inn (b v±R ds = 27tn{v±R) (b ds,
where n is the particle density. The required quantity is therefore (v±R)
and this is obtained using eqn 4.5.3 for v±.
Thus, using eqn 4.4.10, the Pfirsch-Schluter term contributes
where p' = dp/dip-. This expression can be evaluated in the large aspect-
ratio approximation, using eqns 4.4.11 and 4.4.12. After some algebra
the contributions from the poloidal variation of fip cancel and the leadin[
order result is
^{^)^.
dp/dr
The contribution of the electric field term in eqn 4.5.3 is similarly
calculated and, using q = Bcpr/BgR, the final result is
{v^R) dp/dr ^. 2 , ^05e
-^^ = —^('?^ + 2^'?ll)--^- ^^ 4.5.5
It is seen that the Pfirsch-Schluter diffusion resulting from the parallel
currents is 2q^r}\\lr]±^ larger than the cylindrical contribution involving
the perpendicular currents.
Banana regime transport
In the absence of colHsions those particles with v\\ < e'^^wj, are trapped
in the weaker region of the tokamak magnetic field and execute banana
orbits as described in Section 3.10. When a small collisionality is allowed
for, it is these trapped particles which dominate the transport, even though
the fraction of the particles which are trapped is ~ e' /^. It should be noted
that here e is the inverse aspect-ratio of the magnetic surface and therefore
varies across the plasma radius. When the collisionality is sufficiently
low that particles complete at least one bounce orbit before suffering
a collision, the plasma is said to be in the banana regime. Collisions

4.6 Banana regime transport
cause scattering out of the region of velocity space where particles are
trapped. This transition requires collisional diffusion in velocity space
through an angle A0 ~ e'^^ and so the effective collision frequency for
detrappingisv/(A0)^ ~ w/e.Thus the bananaregimerequirementis that
this effective collision frequency be smaller than the bounce frequency
Wb ~ s^/^vj/qR, thatis
It is possible to derive an approximate expression for the diffusion
coefficient by considering the random walk behaviour of the electrons
as follows.
The collisions which scatter the electrons out of their trapped orbits
displace the particles across the flux surface by a distance ~ Wbe. the
electron banana width. This provides the step length for the diffusion
process. Since Wbe ~ (?/£'^^)Pe this step length is larger than the Larmor
radius step length, pe associated with classical diffusion.
Using the banana width step length together with the effective collision
frequency it is possible to derive an estimate of the resulting diffusion.
This gives a diffusion coefficient wlj(s/Vg). However, only a fraction,
~ e'/^, of the particles are trapped and so the effective banana regime
diffusion coefficient is
^ s^^Hp^q/s^^'f q' 2
^~ i]V, -^'^ePe-
This exceeds the classical diffusion coefficient by the large factor q'^/s^^'^
and the Pfirsch-Schluter coefficient by 1/e^/^.
A similar estimate can be made for the electron and ion thermal
diffusivities. The resulting expression for the electrons is
^e ~ 'O ~ ^^^pI
and the ion thermal diffusivity is given by the analogous expression
?' 2
with the consequent prediction that the ion thermal conduction would far
exceed that of the electrons.
The estimate of the banana width given above is modified when w\, is
comparable to the distance from the magnetic axis. In this case we take

4.6 Banana regime transport 161
the value s = w/R, where w is the new orbit width. As a result
where w^ot is known as a 'potato' width on account of the shape of the
orbit in this situation. Since Wpot > w\, one expects larger transport near
the magnetic axis.
The calculation of the transport coefficients is much more complex
than the heuristic account given above would suggest. Rather than give a
lengthy and detailed derivation it is more appropriate here to outline the
general structure of the calculation.
Kinetic theory
Basically the requirement is to calculate the steady state distribution
function in tokamak geometry using the kinetic equation and then use this
distribution function to calculate the flux across each magnetic surface.
The fundamental kinetic equation is
U-V/ + —(£ + uxB)- —= C(/), 4.6.1
m dv
where the collision term on the right is given by the Fokker-Planck
equation and Ze is the particle charge, Z being —1 for electrons.
However, since the detailed motion in the Larmor orbits is not important,
eqn 4.6.1 can be replaced by the drift kinetic equation as described in
Section 2.11. In the present case this takes the form
«rV/ + i;d-V/ + —£||^ = C(/), '' 4.6.2
where the subscript n refers to the direction parallel to the magnetic field,
v\\ being the parallel component of the velocity, and v^ is the toroidal
drift velocity given by eqn 2.6.9, that is
where coc = ZeB/m. When eqn 4.6.2 is solved for /, the particle flux
across a magnetic surface is given by
= //
fVd-dSd'v, 4.6.4
where dS is a vector normal to the magnetic surface.
The solution of eqn 4.6.2 uses two expansions. In the first the Larmor
radius and the inductive electric field are taken to be small, allowing the
expansion
where /^'^ is of order p/a or ZeER/T. In the second expansion the ratio
of effective collision frequency to trapped particle bounce frequency is

4.6 Banana regime transport
taken to be small and /^'^ is written
yd) ^y(lH_^y(l)l^
/^'^' being of order Veff/cob relative to /('^°. It is /^'^' that gives rise
to the flux r, although, as will be seen, it can be expressed in terms of
f'-^^^. However, it is still necessary to consider /^'^' because it provides
a constraint which determines Z^'^*^.
The equation for /^^^ is
„l|.V/@) = C(/(«))
and the solution is a Maxwellian distribution
/<». = /„,«,) = A, (^)"%xp(-
where
W = ^mv^ + Zecf),
<p being the electrostatic potential, N = N{-^) and T = Tii/), with \jr
the poloidal flux function introduced in Section 3.2.
In next order eqn 4.6.2 becomes
„ll . v/(i) + „d • V/m + Ze£||i;|| ^ = C(/(')). 4.6.5
To obtain an equation for the flux in terms of / ^' ^"^ eqn 4.6.4 is first written
the outward component of Vi/r being negative.
The factor Ud • Vi/r is obtained using eqn 4.6.3,
wJ + Ai/mfi (Vi/fxB)
Ud-VVr = J vfi-^—^^2— ' 4.6.6
where ix is the magnetic moment jmv\/B. The magnetic moment is now
expressed in terms of wy using the conservation of particle energy to write
so that
(.J+£B)v« = -„„«^v(a). 4.6.7
Substituting eqn 4.6.7 into eqn 4.6.6
Vd-Vxlr = ^(B X Vi/r) . V (^) 4.6.8

4.6 Banana regime transport 163
and writing
B = B^i^ + -(Vi/r X 10)
gives
B X Vl/r = -fi^VVr X 10 + -(VVrJj^.
Since, from axisymmetry,
H ■ V(w||/fi) = 0
and the poloidal magnetic field is given by
Bp = Vi/r X i^/R,
eqn 4.6.8 becomes
uj. VVr = —^/(i/r)B-vf^), 4.6.9
coc \B /
where axisymmetry allowed Bp • V to be replaced by B • V, and
/(i/f) = RB^, this symbol being used here in place of the function
fiof, introduced in Section 3.2, to avoid confusion with the distribution
function.
The required form for T is now obtained by taking the m w y / fi moment
of eqn 4.6.5 and integrating over d5/1V t/r |. Since ,
d^w = 27r 2^ fid/AdW/|w|||, 4.6.10
a=±l
where a is sign(w||), the first term can be integrated by parts over a
magnetic surface and the resulting term is proportional to F. The second
term integrates to zero so that
The first term gives the collisional diffusion and it is seen that it is related
to the exchange of momentum in collisions. Since like-particle
collisions cannot create momentum they do not cause diffusion. Furthermore,
multiplying eqn 4.6.11 by Ze, and recognizing that total momentum is
conserved in collisions between electrons and ions, it is seen that the
electron and ion fluxes are equal, that is the diffusion is ambipolar. The
result 4.6.11 is independent of collisionality regime.
As remarked earlier the flux given by eqn 4.6.11 is determined by /^'^"^
but / (' ^^ itself is constrained by / ^' ^'. The physical basis of this constraint
is as follows: f'-^^^ satisfies a collisionless equation and the solutions
correspond to a Maxwelhan distribution with 'diamagnetic' toroidal drifts
for both electrons and ions. If only like-particle collisions are allowed for,

4.6 Banana regime transport
the Maxwellian solutions persist. However, electron-ion collisions would
tend to reduce the drift of the passing electrons toward that of the ions and
such a form can be constructed from the constants of the motion W, ix, and
CT. But for trapped particles this is impossible because a is not a constant of
the motion and this gives rise to a residual friction between the trapped and
passing electrons. The colhsional constraint arising from /^'^' describes
the competition between trapped electrons and ions in determining the
form of the 'colhsionless' electron distribution function Z^'^*^.
Solution of Fokker-Planck equation
To solve for F as given by eqn 4.6.11 a solution of eqn 4.6.5 for /^'^ is
required. This is obtained making use of the low collisionality expansion
y(i)_y(iH_|_y(i)i introduced above and taking the electric field to be
of the same order as the collision term. In leading order only the first two
terms appear and eqn 4.6.5 becomes
^B.V/('H + ^^/B.vf^)^=0, 4.6.12
B ■' Ze B \B) df
where use has been made of the relation 4.6.9.
Integration of eqn 4.6.12 gives the solution
where g(i/r, W, ix, a) is afunction of the constants of the motion including
CT, the sign of wy. The first term in eqn 4.6.13 represents the diamag-
netic drift of the Maxwellian distribution. The second term, g, is to be
determined by the constraint imposed by /^'^'.
From eqn 4.6.5 the equation for /^'^' is
|lB.V/(')'+Ze£||.||^ = C(/(')% 4.6.14
The function /^'^' must satisfy the constraints imposed by the
periodic motion of the particles. These are different for passing and for
trapped particles. Passing particles freely complete a periodic motion
in the poloidal angle 6 whereas trapped particles bounce between turning
points Oi and 62 where wy = 0. Thus, for passing particles integration of
eqn4.6.14overaperiod27r in6iusing/('^iFi) = /('^'FI + 27r) gives
/|c
For the trapped particles the integration is carried out between turning
points and summed over the two streams ct ± 1 to obtain
M92) d^
/ C(g)-—=0. 4.6.16
Here ds is an element of poloidal arc length along the magnetic surface.

4.6 Banana regime transport 165
Equations 4.6.15 and 4.6.16 provide the colHsional constraint
necessary to determine g and hence Z^'^*^, from which the fluxes can
be calculated. A full solution requires a lengthy calculation, the results of
which will be quoted below. However, the procedure can be illustrated by
using a model collision operator to solve eqns 4.6.15 and 4.6.16 explicitly.
The model operator used has the important feature of correctly
representing pitch angle scattering and conserving momentum in like-particle
collisions. It is also asymptotically correct for distribution functions that
are localized in pitch angle, as occurs for the trapped and just passing
particles when e <C 1 or for the passing particles when e ~ 1, where
E = r/R. For simplicity it is convenient to neglect the energy dependence
of the collision frequency, the temperature gradients and the toroidal
electric field. Then the ion and electron collision operators are written
''^f'>-AiTi'f-
Ce(/e)
r 3 v\iixdfe , me 1
+ VeiWll I •
9 W||pt3/e
dfX, B dfX,
- + fui
Substitution into the constraints 4.6.15 and 4.6.16 leadsw the ion equation
(^ll/fi> [
(A) = (bAds/ (bds.
Using the definition of Mi and eqns 4.6.13 and 4.6.17, and performing the
velocity integral by integrating by parts in ix using eqn 4.6.10 gives
„, + _LZ;i^ + i!!*=0, 4.6.18
ZeBndf Bdf
where n = Nexpi-Zecp/Ti). This represents the role of neoclassical
poloidal flow damping in reducing the total ion poloidal velocity to zero.
In the presence of a radial temperature gradient eqn 4.6.18 is modified by
thermal forces to
Ti 1 dn k dTi 1 d</> _
"' ZeBe nd^~ ZeBg "dT fi^d7~ '
where /: = 0.172 and a large aspect ratio expansion for the equilibrium has
been used. In the rest frame of the ions, and setting Z = 1 for simplicity.

Banana regime transport
this yields a radial electric field
_ T,dn _ 0.172 dTi
'^ en dr e dr
Similarly, the electron equation gives
..46>-^i?r.+^)(^)
eBe n dr
where the result
J T (W||>
has been used.
Transport coefficients
The equations of particle and electron and ion energy transport take
dn
37 +
3 /3
= -
d /3
^\2
if(.r) = o
-)nM<'"
-^^-Gl
-y^lH^-
\n dr
Qa =
te nil
-i-)]
0.172 371
.^r.)]
0.172 3 TA
Ti Jr)
I+ -^11 ill
is the electron-ion energy equipartition term, E^jn is the Ohmic heating
and the remaining terms on the right hand side of eqns 4.6.22 and 4.6.23
are the work done against the radial electric field given in eqn 4.6.19.
Equation 4.6.11 expresses the electron flux Fg in terms of the
momentum exchange between electrons and ions and, in the absence
of thermal forces, this is given by —me«Vei(Me — "O- Using eqn 4.6.19,
the surface averaged electron flux per unit area is given by
Te = -0.73(Vee + V,,)E~^/V pl^i^ + f) '
where Pe = Bre/me)'/^/«ce.

4.7 Plateau transport 167
The heat fluxes for electron and ions can be calculated in a similar way.
The more complete variational calculation gives the following results
^ e-^l\^plr
te
2.44e'/2^
_ £-3/2^2^2,
1.75e'/2^
+ —
■[-
r£|
-
T^E
1.12^1 +
1.53A +
1
1)
1)
Idn
I An
nd7~
0.43 dTe
1.81 dTe
Te dr
0.19 dTi"!
Te drj
4.6.24
0.27 dTi"!
^dTJ
4.6.25
Because the ion thermal diffusivity can sometimes approach the
neoclassical value, an improved treatment including finite aspect-ratio
effects is justified. Such a calculation leads to somewhat larger values.
An interpolation formula which gives the correct asymptotic results for
e <C 1 and e ^ I, when nearly all particles are trapped, is
^, = -0.68^ ^-^fl+0.48e'/2)„^, 4.6.26
ti V / dr
where a = {2TJm.f'^10)^. A more complete result for moderate e,
due to Chang and Hinton, is given in Section 14.11. This describes all
collisionality regimes and includes the effects of impurities.
Finally, it is noted that the collisional ion toroidal viscosity does not
show a neoclassical enhancement. In the banana regime i|%ierely acquires
a Pfirsch-Schluter factor so that
0 1^'^'
X0=O.l^.
These results serve as a useful basis for comparison with experiments.
4.7 Plateau transport
Figure 4.7.1 displays the variation of diffusion coefficient with colHsion
frequency for the Pfirsch-Schluter and banana regimes at large aspect-
ratio, s = r/R <^ I. These two regimes leave a gap in collision frequency
s^'^vrlRq < V < vj/Rq. 4.7.1
In this region diffusion is found to be dominated by a class of slowly
circulating particles. These are particles which have such a low v\\ that

4.7 Plateau transport
Fig. 4.7.1 Vanation of diffusion
coefficient with collision frequency.
they suffer a small angle collision with Aw|| ~ v\i during a single transit
round the torus. Since Coulomb collisions are diffusive in velocity space
this characteristic value of v\i is determined by equating the effective
collision frequency for such small angle colhsions to the transit frequency
of the particle round the torus: v(wt/w||)^ ~ v\\IRq. Thus, this so-called
resonant velocity is given by
^{vRq/vj)^!^.
4.7.2
As the collision frequency spans the range 4.7.1 from the banana regime
to the Pfirsch-Schliiter regime, this velocity changes from the trapped
band v\\ ~ e'/^wj to wy ~ wj- A heuristic estimate of the corresponding
diffusion can be made by noting that, due to the magnetic drift, a particle
with this resonant velocity drifts a radial distance B ~ Wdt in a transit time
r ~ Rqlv\\. Since it suffers a colhsion during such a transit this is the
characteristic step for a random walk estimate. Noting that the fraction
of resonant particles is ~ W||/wt, the diffusion coefficient
D-
This is the plateau diffusion coefficient. It is independent of colhsions
and matches the banana and Pfirsch-Schliiter results at the appropriate
collision frequencies.
To provide a quantitative expression for the particle and heat fluxes it
is necessary to solve the drift kinetic equation 4.6.2 for these particles. It
is convenient to use the velocity space variables wy and v±. For a large
aspect-ratio tokamak with circular surfaces eqn 4.6.2 takes the form
qR de
11 + 2^ .„^9/m , 2e
cOcR
dr
, 9/m.

4.8 Ware pinch effect 169
where the Fokker-Planck collision term has been approximated by the
pitch-angle scattering contribution appropriate for scattering of the small
W|l particles from the resonant band. Equation 4.7.3 can be solved for /
by Fourier transforming in wy. Neglecting the Sy term for simplicity, the
solution is
/(.,.»x,») = J^fjf"si„,„„-.)exp(-^)d,.
The radial flux F = r f v^i f d^ v d6 due to the radial magnetic drift
Wdr can be calculated directly for this distribution function. The major
contribution is indeed provided by particles satisfying relation 4.7.2.
Detailed calculations yield a particle flux
2 ^ eBe r [l ^ T^J n dr ^ IT^ dr ^ 2T^ dr J
- l.6■^/7t£ ~,
an electron heat flux
-2.1^/jTs'
dn 15_l_d7; 3J_d7;"]
d7^T7;"dr^27;"d7j
and an ion heat flux
3 ^2 T, fh dT, /
2 eBg r dr
Since
A~(m,/me)'/'pe,
qi exceeds qe by ~ {milme) '/^.
The plateau region is an idealization based on the large aspect-ratio
approximation. Calculations of the transport fluxes have been carried out
to describe the transition between banana and plateau regimes when the
resonant particles merge with the trapped particles. It is found that for
realistic values of e, the plateau approximations are valid over only a very
narrow region of collisionality.
Ware pinch effect
Expressions 4.6.24 and 4.7.4 indicate an inward particle transport due
to the toroidal electric field. This is known as the Ware pinch effect.

4.8 Ware pinch effect
The inward flow occurs for trapped particles and their behaviour follows
directly from the toroidal equation of motion. In the banana regime this is
d
—mjV^=ejiE(i, + (vxB)^). 4.8.1
For trapped particles the integral between bounces of the term on the
left-hand side of eqn 4.8.1 is zero and consequently the steady state time
average is also zero. Thus
({V X BH> = -E^. 4.8.2
Now
(v X BH = v±Be, 4.8.3
where vx is the component of the velocity perpendicular to the magnetic
flux surface, corresponding to the radial velocity in the case of a circular
plasma, and Bg is the poloidal magnetic field. Combining eqns 4.8.2
and 4.8.3 the time averaged pinch velocity of the trapped particles is
given by
independent of the particle's mass and charge. Thus, since the trapped
particle fraction is ~e'/^, there is a flux
r-^e^f\E^/Be.
The mechanism underlying this behaviour can be understood by
considering the effect of the toroidal electric field on the banana orbits of the
particles. Following eqn 3.12.3, the modified equation of motion along
the magnetic field lines is
d?2
SO that
s =
= -c4s + -
Sb sin cobt +
ejE^
and since s = (B/Be)r9
6 =
9h sin (Wb? -|-
ejBeE^
2.. d'
It is seen that the orbit is displaced by the electric field to have a mean
angle
as illustrated in Fig. 4.8.1.

4.8 Ware pinch effect 171
Fig. 4.8.1 Showing the displacement of
a trapped particle orbit ansing from the
toroidal electric field
As a consequence, the effect of the Vfi and curvature drifts is not
symmetric about the mid-plane. The particle therefore experiences a
radially inward component of the vertical drift for a longer time than
the outward component. If the drift velocity is Vdj, the resulting radial
velocity is —Vdj sin 6 and, considering deeply trapped particles for which
6 is small,
Vr = -VdjO-
Using eqn 4.8.4
and the time-averaged Vr is
{Vr) = —
>lrB^
Substituting Vdj = ^mjv]_/ejRB and co^ = iv±/qR)ir/2Ry/^ with
q = rB/RBg, the required pinch velocity is obtained
Typical values of S^ and fi^ are 10~' Vm~' and 0.57, giving pinch
velocities of ~ 0.2 ms~'. The inward radial displacement per bounce
period is very small. The time taken for a radial displacement equal to
the banana width w^ is
E4,/Be'
and using eqn 3.12.10 for the banana width
Typical values of r are 0.1 s for ions and 1 ms for electrons.

4.9 Bootstrap current
4.9 Bootstrap current
It was shown in Section 4.8 that a radial particle flux results from a toroidal
electric field. The Onsager symmetry relations require the existence of a
parallel electric current driven by a density gradient. Indeed, the general
relation 4.6.11 between diffusion and electron-ion momentum exchange,
or friction, parallel to the magnetic field implies such a current. In the
Pfirsch-Schluter regime the friction associated with the Pfirsch-Schluter
currents, which have zero average over a magnetic surface, is consistent
with the Pfirsch-Schluter diffusion. But the additional friction related to
the higher transport in the banana regime implies the existence of a
unidirectional toroidal current, which is known as the bootstrap, or diffusion
driven current. Such a current exists independently of the conventional
current driven by an applied electric field. The suggestion that this
current, which can be maintained by steady radial diffusion of the plasma,
could provide part of the tokamak's poloidal magnetic field has led to the
term bootstrap current.
A heuristic explanation of the bootstrap current can be given. For an
inverse aspect-ratio e = r/R there is a fraction e'^^ of trapped particles
and they typically have a parallel velocity e'/^wj- They execute a banana
orbit of width Wb ~ e'^l'^qp, where p is the Larmor radius. Thus in the
presence of a density gradient they carry a current analogous to the dia-
magnetic current of untrapped particles but here parallel to the magnetic
field. This current is
k^-ee'l\e'l\^)w^^i
ei/2 dn
Both trapped ions and trapped electrons carry such a current and there
is a transfer of momentum to the passing particles of both species which
adjust their velocities accordingly. The dominant current turns out to be
that arising from the difference in velocity between the passing ions and
the passing electrons and this is the bootstrap current jb-
The momentum exchange between the passing electrons and the
passing ions is Vei^e jb/^ and for the passing electrons this is balanced
by the momentum exchange between the passing and trapped electrons.
The trapped electrons are localized to a part ~e'/^ of velocity space and
their effective collision frequency is determined by the time for diffusion
out of this region, v^' ~ (e'/^)^v^'. Thus the momentum exchange
between passing and trapped electrons is ~(vee/e)we7t/^- Equating the
two expressions for momentum exchange for the passing electrons

4.9 Bootstrap current
and using relations 4.9.1,
Vee q T An
•^'''^"^?72fid7-
Since Vee ~ Vei and q = sB/Bg the banana regime bootstrap current is
given by
ei/2 dn
this current being parallel to the magnetic field.
The precise expression correct to 0(e'/^) is
e'/^n r 1 dn dT.
'2.44(re + rO-—+0.69 '
n dr
f--^]-
In the opposite limit, e ^- 1, when most particles are trapped, it is found
that
J_dp
Be dr
so that, with increasing e, the current tends to be driven predominantly
by the pressure gradient, rather than the density gradient. Equation 4.9.3
Fig. 4.9.1 Typical bootstrap current
profiles for two pressure profiles (with
T'/T = n'/n)

4.10 Neoclassical resistivity
gives the scaling for the total bootstrap current /b as a fraction of the total
current / as
with c typically around 1/3.
Figure 4.9.1 shows two typical bootstrap current density profiles and
indicates the sensitivity to the pressure profile. In contrast to the
inductively driven current the bootstrap current peaks off-axis. Experimental
evidence for the bootstrap current is described in Section 12.2.
In the plateau regime the trapped particle effects diminish as v~\
becoming negligible as the Pfirsch-Schliiter regime is approached.
Because of the need to calculate the bootstrap current under realistic
conditions, models have been derived which include the trapping
fraction, the collisionality and the charge state as parameters. The resulting
formulas for j^ are rather complicated and one such formula is given in
Section 14.12 of the Appendix.
Neoclassical resistivity
In a cylindrical plasma the conductivity along the magnetic field is given
by its Spitzer value asp = l.96ne^re/me. However, in a tokamak the
trapped electrons are unable to move freely along the magnetic field in
response to an applied electric field. The current is thus reduced by the
presence of trapped particles. In the banana regime the conductivity takes
the form a = crsp/(e) where e = r/R. Thus the conductivity varies over
the minor radius through both asp and the variation in e.
In the large aspect-ratio approximation the current density parallel to
the magnetic field is given by
;il=o^Sp(l-1.95e'/2)£|| + j^, 4.10.1
where the first term has the trapped particle modification to the
resistivity and jb is the bootstrap current given by eqn 4.9.2. However, more
complete calculations show that the range of applicability of eqn 4.10.1
is rather limited. A more accurate form of the e dependence from the
extended calculations is
a=asp(l-e'/V.
A more complete empirical representation of numerical calculations
which includes the dependence on Zgff (= X; f^i 2^/«e) and the collision
frequency is given in Section 14.10. Experimental evidence for eqn 4.10.1
is described in Section 12.2.

4.11 Ripple transport
Ripple transport
The finite number of toroidal field coils of a tokamak destroys the perfect
axisymmetry of the device. The coils produce a short wavelength 'ripple'
in the magnetic field strength as a field line is followed around the torus.
For N coils, the magnetic field can be represented by
fi = fio(l-ecos6i)(l - Sir,6) cosN(p)
and the resulting magnetic wells are illustrated in Fig. 4.11.1.
An approximation for the value of S, for the case of strongly elongated
toroidal field coils, is given by
+
where R is the coordinate along the major radius and i?outer and i?inner
are the major radii of the outer and inner legs of the toroidal field coils.
It is clear from Fig. 4.11.1 that following a field line, for which
(p = (po + qO, the wells vanish for angles 6 such that a | sin 01 > 1, where
the parameter a = s/iNqS). The condition a > 1 divides the poloidal
plasma cross-section into two regions, the 'ripple well region', where
toroidal wells do exist, and the remainder where they do not. The typical
shape of the ripple well region is shown in Fig. 4.11.2f
The ripple affects the transport properties in different ways in these
two regions. In the ripple well region the most important effect is due to
particles becoming trapped in the local toroidal wells, and subsequently
being lost via grad-B drifts in the vertical direction. In particular banana
trapped particles with tip positions at the edge of the ripple well region
have a high probability of becoming well-trapped. In the remainder of the
plasma the ripple modifies the orbits, mainly those of the banana trapped
particles, leading to transport.
Fig. 4.n .1 Vanation of magnetic field
strength along a field hne in a tokamak
with a nppled field, and the resulting types
of particle trapping.
rv/%
Toroidally trapped

4.11 Ripple transport
Ripple well transport and ripple banana transport affect both the
thermal plasma and highly energetic particles. For thermal particles both
forms of transport are mainly collisional (collisional ripple well
transport and collisional ripple diffusion), while for fast particles collisionless
effects dominate (colUsionless ripple well trapping and stochastic
diffusion respectively). Because of the larger ion Larmor radius the effects of
the ripple are mainly on the ion, rather than the electron, transport. An
exception is the ripple effect on very highly energetic runaway electrons.
For a reactor, the main considerations regarding ripple are the loss of
fast a-particles and the associated heat losses to the first wall and in-vessel
components. These heat losses can be highly localized. Ripple well losses
appear vertically above or below the ripple well regions, depending on
the grad-fi drift direction. In addition to this poloidal localization, there
is a toroidal localization due to the increase in ripple well depth as the
particle moves closer to the toroidal field coil.
A second consideration is that of losses of neutral beam injected fast
particles. Neutral beam particles ionized in the outer region of the plasma
may have banana tip positions which lie inside the ripple well region. This
will lead to their rapid loss. In particular for beamlines having large angles
with the magnetic field (near perpendicular), a significant proportion of
the neutral beam energy may be lost through this mechanism.
For a reactor the ripple amplitude S at the plasma edge typically must
not exceed 1 to 2%, in order to avoid excessive ripple well losses, while
the ripple at the plasma centre should not be greater than about 0.01%,
in order to avoid stochastic diffusion losses. These considerations lead to
numbers of toroidal field coils typically between 16 and 24. For smaller
numbers of toroidal field coils, the separation between the coils and the
plasma needs to be larger than for larger numbers in order to satisfy the
criterion on the ripple at the plasma edge. This leads to somewhat larger
coils, offsetting the advantage of the smaller numbers. The main
arguments for a smaller number of coils are the accessibility of the tokamak
for remote handling devices, and the access for tangential neutral beam
injection for purposes of non-inductive current drive.
Collisional ripple well trapping transport
For a particle to be trapped in the ripple wells it has to satisfy the condition
that the parallel velocity is sufficiently small that magnetic mirror
reflection occurs in the ripple well. This is equivalent to the statement that
the banana turning point positions of the particles lie inside the ripple
well region. Particles are trapped into and de-trapped out of ripple well
trapping by collisional processes, in particular by pitch-angle scattering,
which changes the ratio between the parallel and perpendicular
velocities. The typical residence time of a particle as ripple well trapped is then
of order A? ~ S/v, where v is the collisional deflection frequency. The
fraction of particles which is ripple well trapped is of order S'/^.
Particles which are trapped in the ripple wells drift vertically with a
velocity Vd^ pv/R due to the toroidal field gradient drift, where p is the

4.11 Ripple transport 177
Larmor radius and v is the total particle velocity. Combining the ripple
well trapped fraction, the drift velocity and the residence time, a diffusion
coefficient for collisional ripple well transport can be estimated as
where D is a radial diffusion coefficient for a circular plasma, averaged
over the pitch angle. This implies a greater loss rate for ions than for
electrons, and an ambipolar electric field will evolve to reduce the ion
particle diffusion. Nevertheless, eqn 4.11.1 remains an appropriate
estimate. It should however be noted that its validity is restricted to collision
frequencies v > v^S/a, where a is plasma minor radius, since otherwise
particles would drift out of the plasma before suffering a collision,
producing a loss cone in velocity space rather than a diffusion. This restriction
is particularly stringent as D is dominated by contributions from the more
energetic particles, so that the inequality must hold for these particles (sa*
energies approximately five times the plasma temperature). A secona
caveat is associated with the poloidal variation in the ripple. As shown
in Fig. 4.11.2, ripple wells typically exist only near the low field side
and near the plasma mid-plane. The proper poloidal averaging procedure
leads to a significant reduction in D from that given in eqn 4.11.1.
Ripple well losses of fast particles
For ripple well trapped particles that are sufficiently^nergetic as not to
suffer a collision before being lost (v < v^S/a), Ae ripple well ti-ap-
ping process represents a loss cone. Particles are fed into this loss cone
either by (i) collisional processes (pitch-angle scattering), (ii) the
processes of ripple transport of banana particles, (iii) acceleration by radio
frequency fields, or iv) directiy by neuti-al beam injection. The process
responsible for the actual trapping in the ripple wells of these particles is
collisionless ripple ti-apping. This occurs due to the finite banana widfi^
of particle orbits in the vicinity of the turning point. The particle feels ^
different ripple value on approaching the turning point than on leaving it.
The difference is approximately Aw(dS/dz), where Aw represents the
vertical displacement which the particle undergoes at the turning point,
and z is the vertical coordinate. If this is a positive number, so that the
ripple increases in the direction of the vertical drift, the particle can be
trapped, and will remain trapped as long as the ripple well depth increases
along its trajectory. The occurrence of trapping further depends on the
toroidal position of the turning point with respect to the toroidal field coil
location. For a large number of coils and for sufficientiy large toroidal
banana precession, the toroidal phase of the turning point can be
considered random. The rate of collisionless trapping can then be expressed in
terms of a trapping probability p per bounce. Taking into account that

4.11 Ripple transport
then near the ripple well boundary, where a -
s being the inverse aspect ratio.
To be trapped the high energy particle needs a finite number of
reflections of order 1/p. In practice, with p in the range of 10"^-10"', trapping
in the ripple wells for particles with banana tips near the ripple well
boundary is a very fast process, much faster than slowing down.
Collisional ripple diffusion
The absence of perfect axisymmetry also modifies the banana orbits.
Under conservation of the magnetic moment, the rippled field produces
variations in the velocity component parallel to the magnetic field. These
cancel over most of the banana orbit, but are significant in modifying
the time spent near the banana turning point. This leads to a motion of
the position of the banana turning point for successive banana bounces.
Because of constancy of energy and magnetic moment, the turning point is
constrained to lie on surfaces of constant total magnetic field. In practice,
this means that the motion of the turning point is essentially vertical.
The vertical step at one banana turning point is given by Az =
Acos(N(p ± 7r/4), where the -|- and — refer to the upper and lower
turning points respectively, and (p is the toroidal coordinate of the turning
point. The amplitude A is given by:
A = p{n/NfHB4,/BRf^a-\
where fi^ is the toroidal field and Br is the major-radial component of
the poloidal field. The difference in toroidal angle between consecutive
banana turning points is given by the bounce angle and the precession
angle of the banana orbit. The difference in steps Az between consecutive
turning points leads to a non-closure of the banana orbits.
For small values of A, the result is a complicated vertical motion of the
banana tip on consecutive bounces. It is determined by two periodicities,
namely the toroidal periodicity of the ripple field and the periodicity of the
toroidal banana precession motion. This motion is essentially periodic. It
does not lead to losses.
Transport of particles can result from collisional de-correlation of the
successive steps Az. An upper estimate of this transport can readily be
obtained by assuming full de-correlation of the successive steps. The
de-correlation can be produced by collisions and occurs when the collision
frequency is large, that is
ivVtb'
where r\, is the banana bounce time. In this case, the steps Az are fully
de-correlated, and a diffusive transport of order e'^^ A^/tb results, where
the fraction e'/^ represents the fraction of banana-trapped particles.

4.11 Ripple transport 179
This regime of complete collisional de-correlation is called the banana
plateau regime. At higher temperatures and consequently lower collision
frequencies, the behaviour enters the banana drift regime, in which the
diffusion rate is suppressed due to partial correlation between consecutive
steps. In the banana drift regime, the diffusion coefficient decreases with
particle energy. At yet higher particle energies, there is the regime of
stochastic diffusion.
Stochastic diffusion
If the vertical step-size amplitude in the above discussion becomes large,
then the step itself leads to a de-correlation of the orbits. The
condition for this is that the change in toroidal bounce angle, due to the
vertical step, is of the order of the angle between toroidal field coils,
or A(/> = (9(/>/9z)A ?« InlN. Consequently, a so-called Chirikov
parameter y = NA(d(f)/dz) is defined, which describes the level of
de-correlation. For large values of y, full de-correlation of the steps
occurs, leading to stochastic motion of the banana tip and to a fast
transport. As for the collisional transport above, this transport is of a diffusive
nature, and an upper estimate of the diffusion coefficient is given by
D = A^/tb. This upper estimate is valid for y » 1. For y < I, the
effective diffusion coefficient is significantly smaller.
The usual method of calculating stochastic diffusion losses is by the
use of guiding centre following Monte Carlo codes. On the basis of a large
number of such code calculations, an expression for the dependence of
the diffusion coefficient on the Chirikov parameter has been formulated:
where D is the diffusion coefficient for vertical diffusion of a banana
particle with a given magnetic moment, that is with a given turning point
major radius. Figure 4.11.3 shows a set of contours of constant D for
1 MeV protons in JET with the number of toroidal field coils reduced
from 32 to 16.
Expressions such as this make possible the use of codes which follow
the history of the bounce-averaged coordinates (rather than the guiding
centre coordinates) to study the ripple loss problem.
Experimental studies
Experimentally, the particle and heat losses of fast particles due to ripple
well trapping have been verified. In Tore Supra fast electrons lost from the
plasma, and collected by Faraday cups, were shown to be on trajectories
originating in the ripple well regions. In JT60-U the heat losses associated
mainly with the loss of neutral beam ions were measured, and shown to
agree well with the predicted losses.
The most comprehensive experiments on toroidal field ripple were
performed on ISX-B and JET. The tokamaks were operated with half the
set of toroidal field coils, that is 9 out of 18 and 16 out of 32 respectively.

4.12 Confinement modes and scaling expressions
Fig. 4.n.3 Contours of cc
coefficient of stochastic diffusion for
1 MeV protons, as calculated from
eqn 4.11 2 for a JET configuration with 16
toroidal field coils (D in m^ s~')
(Tubbing, B.J.D et al, Proc 20th E PS
Conf. on Controlled Fusion and Plasma
Physics, Lisbon 1993, Vol 17C, Part 1 p.
39)
SO that ripple effects could be studied in otherwise identical plasma
discharges. In JET, this raises the toroidal field ripple at the edge of the
plasma from about 1% to about 10%. Fast particle losses, thermal energy
confinement, and plasma rotation were studied. In both ISX-B and JET
the effect of ripple on thermal energy confinement and on plasma rotation
exceeded theoretical predictions. In addition, it was found in JET that the
ripple has a severely deleterious effect on the H-mode of confinement.
With 16 toroidal field coils in operation, H-modes without Edge
Localized Modes (ELMs, see Section 7.17) could not be obtained with heating
powers up to 12 MW, whereas with 32 coils ELM-free H-modes could
be readily obtained in otherwise identical plasmas. Finally, in the JET
experiment stochastic diffusion was studied by its effect on minority ions
accelerated by ion cyclotron resonance heating and on tritons generated
by deuterium-deuterium fusion reactions. These experiments led to the
conclusion that the stochastic diffusion losses are well modelled with the
existing theory. The loss of heating power, and the loss of tritons, could
be predicted to within a factor two using calculations with guiding centre
or bounce-averaged Monte Carlo codes.
Confinement modes and scaling expressions
As discussed in Section 4.1 tokamaks do not behave according to the
predictions of neoclassical theory described in the previous sections. The

4.12 Confinement modes and scaling expressions 181
energy confinement, as measured by the confinement time te, is found
to be much shorter than the neoclassical value. There is a lack of
understanding of the underlying cause of this behaviour and as a result it has
been necessary to resort to an empirical representation of the
confinement time. This usually takes the form of a product of powers of the
various parameters involved. Unfortunately even this procedure does not
adequately describe the behaviour of the confinement time. It is found
that there are several regimes of operation and these are described by
a patchwork of scaling expressions. For convenience these regimes are
described as modes of confinement.
The confinement behaviour can be conveniently put into four
categories. The first covers ohmically heated plasmas and the other three
relate to plasmas with additional heating. The two basic modes of
additionally heated plasma are the so-called L (for low) and H (for high)
confinement regimes. The third category covers a variety of plasmas for
which operational procedures have been found which produce enhanced
confinement: particularly important examples are those associated with
hollow current profiles (or ones almost flat in the centre) known variously
as reverse shear, negative central shear or optimized shear. The scalings
for these modes will now be described in turn.
Ohmically heated plasmas
At low density it was found that the energy confinement time scaled as
rE = 0.07(,n/l6^'^)aR^q s, 4.12.1
where n is the average electron density, a and R the^ninor and major
plasma radii, and q is the cylindrical equivalent edge safety factor. The
improved confinement with increased density is in conflict with the
decrease in confinement predicted by neoclassical theory.
As the density is increased the linear improvement of te with n is lost
and Te saturates at a density
n,at = 0.06 X 10²⁰/i?A" ^/c"'a-2-5 m"^ (/ in MA),
where / is the plasma current, A is the atomic mass of the ions, and k is
the plasma elongation, b/a.
B y controlling the density in such a way as to maintain a peaked density
profile it has proved possible to extend the linear scaling into the so-called
Improved Ohmic Confinement (IOC) regime. Results from the ASDEX
tokamak are given in Fig. 4.12.1.
It should be noted that, because the level of ohmic heating itself
depends on the plasma parameters, there is a freedom to rearrange the
form of Te. Since the ohmic heating has the form I^Rrj, where i?^ is the
plasma resistance which scales as
R ~AJ_
" abTV^'

4.12 Confinement modes and scaling expressions
Fig. 4.12.1 Improved ohmic
confinement mode in ASDEX. The broken
curve, with open circles and crosses,
corresponds to the saturation mode, the
upper lines are for two different scans in
IOC modes. (Aratan, R. et al., Max-Planck
Institiit fiir Plasmaphysik, Annual Report
1988)
the energy balance relation takes the form
I^R nTabR
abfy^ TE
Thus the ohmic heating confinement time given by te in eqn 4.12.1 can
equally well be represented by tg where
tE = tE/
and / is an unknown function which cannot be determined by the global
experimental measurements.
L-mode confinement
In order to improve the plasma energy content above that achieved with
ohmic heating alone additional heating was applied using beams of
energetic neutral particles or RF waves. The results were disappointing in
that, for given operational conditions, the confinement was found to
degrade with increased heating power. By analysing the results from
several tokamaks Goldston obtained the confinement scaling
pO.5^0.37
(/ in MA, P in MW),

4.12 Confinement modes and scaling expressions
Fig. 4.12.2 Comparison of the
experimental values of confinement time
from a number of tokamaks with the
L-mode scaling r^^^^ P (Yushmanov,
P.N. et al. Nuclear Fusion 30, 1999
A990).)
0.1
0.01
0.001
r
r
^
g
1 I 1 1
B^JP
^^
1 1 il 1 , . 1
D
O
D
A
®
, , , ,1 ,
ASDEX
Dm
ISX-B
JET
JFT-2M
JT-60
PDX
TFTR
1 1 1 > 1 1 >
Ms)
where P is the applied power. The degradation is apparent through the
factor P^-^ in the denominator.
Although this scaling was obtained before the large tokamaks such
as JET were operational, it was found to describe the results on these
machines quite well. In order to improve the predictive capability for
the proposed tokamak reactor ITER an extended data base, including the
larger tokamaks, was used to generate a more precise form of Goldston's
scaling. The resulting confinement time, which was given the name
ITER89-P, is given by
= 0.048
;0 85^1 2^0.3^0.5(„/1020H-lfi0-2A0-5
pO.5
(/ in MA, P in MW),
4.12.2
where B is the toroidal magnetic field. A comparison between this
formula and data from a number of tokamaks is shown in Fig. 4.12.2. The
results of a later analysis based on an improved data base are given in
Appendix 14.13.
It is interesting to note that, using the power balance relation P ~
nTabR/TE, the Goldston confinement time takes the approximate form
/2
4.12.3
where g is a geometrical factor.
H-mode confinement
The improved confinement of the H-mode was discovered on ASDEX
tokamak and its properties are described in Section 4.13. It was found
that when sufficient power was applied the discharge made an abrupt

4.12 Confinement modes and scaling expressions
transition in which the edge confinement was improved, leading to edge
pedestals in the temperature and density. The effect of this was to produce
a doubling of the confinement time.
This behaviour was subsequently obtained in many tokamaks and
analogues of the ITER89-P L-mode scaling law have been derived. An
example is
^ITERH93-P _nngT^ '^ ^ '^ jn/^O ) tS A
%h -U.U3:S -^^ S
(/in MA, P in MW), 4.12.4
where txh refers to the confinement time for the thermal part of the plasma
energy. A different scaling relation holds when ELMs are present. A
widely used expression is
r0 93nl39„0 58^0 78/„/in20N0 4lD0 15 4O19
_IPB98(y,2) _r, ,,r^ K a K (n/iU ) tl A
(/in MA, P in MW) 4.12.5
It is seen that the dependencies are generally similar to those of the
L-mode. The results of other analyses are given in Appendix 14.13.
To relate the confinement in a given plasma to that of the L-mode a
factor H is introduced, defined by
where tg is the confinement time given by one of the L-mode scaling laws.
While H is typically 2 in H-modes it is reduced in the presence of ELMs.
Unless steps are taken to reduce the effect of ELMs they can seriously
degrade performance, in particular at higher densities approaching the
density limit.
Other improved confinement modes
Improved confinement was achieved in the TFTR tokamak in the form
of the so-called Supershot. These discharges are heated by neutral beam
injection into a low density plasma, the injection consisting of two
oppositely directed, balanced beams. The resulting plasmas have low recycling
of particles at the edge and peaked density profiles. Their improvement
factor H is around 3.
The energy confinement of tokamak plasmas has also been improved
by narrowing the current profile. This has led to the use of another
parameter, the internal inductance £1, in the scaling formulas for te. Thus it is
found that
TE oc e^ 0.67 < a < 0.8.
In JET the so-called Pellet Enhanced Performance (PEP) H-mode with
peaked pressure profiles was induced by the injection of hydrogen pellets
into the plasma giving values of // up to 3.8.

4.13 H-modes
Fig. 4.12.3 Radial ion temperature
profiles from charge exchange
spectroscopy for a JET D-T discharge. An
internal transport barrier is tnggered at
0.35 s after the start of the high power
heating phase. (Gormezano, C. Physical
Review Letters 30, 5544 A998).)
(keV) 20
So-called V-H modes with H up to 3.6 have been obtained in DIII-D
by depositing boron on the walls. Similar results were obtained in JET
with beryllium surfaces. In these discharges there is an edge temperature
pedestal and a high edge bootstrap current.
A variety of configurations with non-mono tonic ^-profiles, or merely
weak positive magnetic shear, have achieved H > 2. They are
characterized by a region of good confinement known as an internal transport
barrier, shown in Fig. 4.12.3.
The TEXTOR tokamak has obtained the so-caljid Radiatively
Improved Mode by seeding additionally heated plasmas with a small
fraction of impurities, such as argon or neon. These discharges maintain
good confinement, with te oc « at high density.
The above description of the various regimes clearly demonstrates the
lack of understanding of confinement. Ideally, the cause of the enhanced
transport would be identified and the resulting transport calculated. This
would then provide an understanding in which each mode of behaviour
fitted into an overall scheme. This task presents a formidable challenge.
In the absence of such understanding it is necessary to look for other
theoretical aids. One such is provided by the constraints which
dimensional analysis imposes on the scaling laws, and this is discussed in
Section 4.14.
4.13 H-modes
During neutral beam heating experiments on ASDEX it was found
that under certain conditions there was an abrupt transition to higher

4.13 H-modes
confinement. In this higher confinement regime the confinement time
was typically twice that of the previous low confinement. Figure 4.13.1
shows an example of the transition from L-mode to H-mode and a
comparison of the behaviour of an H-mode and L-mode plasma. This type of
behaviour has subsequently been observed on many tokamaks.
The change in confinement is first apparent at the edge of the plasma
where there is a rapid increase in the pressure gradient mainly due to
an increase in edge density. The associated improvement in edge
confinement can be thought of as a transport barrier. When this barrier
appears it produces an increase in density over the whole plasma on
the timescale of a confinement time, with some further improvement of
confinement in the bulk plasma. A sequence of density profiles is shown
in Fig. 4.13.2.
This behaviour was unexpected and the reason for it is not clear. One
possibility is that the transition is implicit in the basic transport equations,
with the solutions having a bifurcation at the critical condition. A more
widely held view is that the explanation lies in a sudden change in the
stability of the edge plasma associated with a change in the flow profile.
It is possible for example that an increase in the flow shear across an
unstable region would suppress the instability. Since the perpendicular
particle flow velocity v±, for each species, is related to the radial electric
field through
njej(E,. + v±jB) = -^,
the behaviour is also discussed in terms of changes in the gradient of
the electric field. This view receives support from the observation that
edge density fluctuations undergo a sudden decrease over a few cms
Fig. 4.13.1 Companson of H- and
L-mode discharges with the same heating
power. The L-H transition follows the
application of tangential neutral beam
heating After the transition the density
and the perpendicular component of j8p
nse to around twice the values reached in
the L-mode discharge. (ASDEX team,
Nuclear Fusion 29, 1959 A989).)
4-
IQ^ 3
A0 m )
2-
^Pi '-
0-
1 1
H-mode ^^^^"^^ ^^
..__————""''^ ^-"-^^""^^^ '
——"^ "i^-- .^ 1
1 L-mode i
1 i
U<it>
. — _ ^-r::^ 1 heating i

4.13 H-modes
4
3
(lO'V-^)
2
1
0
(a)
[^^
^». 1
• 5 ^
,_ _ , _ , _ ,_ _
10 20 30 40 50
r(cm)
Fig. 4.13.2 Sequence of density profiles
measured on ASDEX through and
following an L-H transition. The profiles
in (a) are at the times shown in (b), which
gives the time dependence of ^e and the Ha
signal. (Wagner, F. et al. Plasma physics
and controlled nuclear fusion research.
(Proc 13th Int Conf, Washington, 1990),
Vol 1,277IA.E.A Vienna A991).)
Fig. 4.13.3 Showing the fall in density
fluctuations, as measured by the
reflectometer signal, at the onset of the
H-mode in DUI-D. (DIU-D team. Plasma
physics and controlled nuclear fusion
research. (Proc. 13th Int. Conf.,
Washington, 1990), Vol 1, 69 I.A.E.A
Vienna A991))
at the time of the transition as seen in the DIII-D results shown in
Fig. 4.13.3. However experiments on JET indicate that the sudden change
in confinement can occur over a large part of the outer plasma radius.
The transition to H-mode requires that the heating power be above a
certain threshold. An empirical scaling for this threshold power has been
obtained by assembling data from a range of tokamaks
PTh = 1.38(n/10^"y
,20x0 77 rO 92 p 1.23^0.76
MW.
4.13.1

4.13 H-modes
Fig. 4.13.4 Comparison of expenmental
power thresholds for the L~H transition
with the scaling expression 4.13.1, fig 20 is
the line-averaged density in units of
when the L-H transition occurs. (ITER
Physics Basis, Nuclear Fusion 39, 2175
A999).)
10
Pl
(MWI
1
0 ASDEX
: • ASDEX Upgrade
- D AlcatorC-Mod
" ffl COMPASS-D
] ♦ Dffl-D
+ JET ^-,
" A JFT-2M ^
A JT-60U ^
r ■ PBX-M X ni^^
: X TCV x^^ ,^^S
J^
rA-ldxf^l
J^^Tj-
1.38n°"B°'
« (MW)
A companson with experiment is shown in Fig. 4.13.4. There are further
conditions which affect the ease with which the transition occurs. For
example it is more readily obtained with a divertor configuration, although
it also appears with a separatrix X-point near the wall and in some
circumstances in limiter configurations. In configurations with a single X-point
the transition occurs at lower power when the toroidal magnetic field is in
the direction such that R x B is toward the divertor, R being the major-
radius vector. This is commonly described as having the ion grad-fi drift
toward the divertor.
The improvement in confinement in the H-mode has certain negative
aspects. Firstly the increase in density is uncontrolled and can lead to
a transition back to the L-mode. There is also an associated
enhancement in impurity confinement. Both of these effects are ameliorated in
the presence of so-called Edge Localized Modes or ELMs, described in
Section 7.17. However ELMs are associated with a loss of confinement
and pulsed heat loads.
A characteristic feature of H-modes is the fall in the //„ signal from
the edge of the plasma as seen in Fig. 4.13.2. The //„ emission comes
from neutral hydrogen entering the plasma as part of the recycling process
and so the //„ signal is a measure of the recycling of hydrogen between
the plasma and the surrounding surfaces. Thus, the abrupt fall in the //„
signal marks a sudden decrease in recycling. It is seen from Fig. 4.13.2
that the subsequent deterioration of the H-mode is accompanied by the
reappearance of spikes on the //„ signal. These are associated with the
ELMs and indicate bursts of recycling induced by a loss of particles
from the plasma. It seems likely that the ELM instability is driven by the
steepened edge pressure gradient or current gradient associated with the
H-mode.
The ultimate usefulness of the H-mode depends on whether the benefits
of improved confinement can be achieved under controlled conditions
without the detrimental effects of increased impurity level and a build up
of a-particles in a reacting plasma, or excessive transient heat loads on
divertor target plates due to associated ELMs.

4.14 Internal transport barriers
4.14 Internal transport barriers
Experiments on TFTR with a non-monotonic q profile, referred to as
reversed shear, sometimes exhibited transitions to states with significant
enhancements in confinement over L-mode as a result of the formation
of an internal transport barrier as opposed to the edge transport
barrier of H-mode. However, the reversed magnetic shear in itself was
insufficient as it was found that seemingly identical q profiles could
demonstrate different behaviour. Those discharges with improved
confinement were termed enhanced reverse shear (ERS) discharges. This
difference indicated that the reverse shear merely facilitated the action
of another process, possibly the generation of flow shear which
suppresses turbulent transport as in H-mode, as discussed in Section 4.19.
Subsequently many tokamaks, both electron heated and ion heated, have
achieved improved confinement in situations where the magnetic shear
is reversed or just weakly positive and a range of other terms to describe
these have been coined, for example, negative central shear in DIII-D,
optimized shear in JET. These magnetic configurations can be achieved in
a variety of ways' by means of non-inductive current drive or in the
transient phase during ohmic current penetration, for example. The requisite
flow shear can be provided by momentum input from neutral beams
or arise from the radial electric field which balances tt^ ion pressure
gradient. Because of the influence of details of the profiles of q and
the deposition of heating power, there appears to be no simple
threshold condition for these transitions. There is some evidence for a power
threshold increasing with magnetic field strength but this can be strongly
modified by appropriate current drive, to produce strongly reversed
magnetic shear. The formation of an internal transport bamer is often found
to occur in the vicinity of low order rational ^-surfaces, for example
q = 2,3.
Internal transport barriers are narrow radial regions with greatly
reduced transport and steep radial gradients. This reduction can occur
in various transport channels, most commonly in the ion thermal
channel, where neoclassical levels are obtained as shown in Fig. 4.14 1, and
in the density and toroidal momentum channels. However, it is
sometimes also seen in the electron thermal channel. Often the transport is
also reduced in the core plasma region within the radius of the internal
transport bamer. Measurements show that the internal transport barriers
are associated with regions of rapid radial vanation in the radial electric
field as shown in Fig. 4.14.2.
During the later evolution of an internal transport bamer discharge, or
with increasing heating power, the position of the bamer moves outward.
Sometimes an H-mode edge transport bamer can also form providing
a further improvement in confinement. However, these subsequent

4.14 Internal transport barriers
Fig. 4.14.1 Radial profiles of the ion,
electron and neoclassical diffusivities for
an optimized shear D-T discharge in JET
QETTeam, Nuclear Fusion 39, 1 A999))
10
1
0 1
«/T
//
[ ' / '^
' "~^ •-. ^ Neo-classical x,
3 02 04 06
Fig. 4.14.2 Radial electnc field and
carbon pressure profiles in an ERS
discharge in TFTR Fluctuations and
turbulent fluxes are reduced inside the
transport bamer near the minimum in q
Correspondingly, the carbon pressure
profile has a steeper gradient in this region
The transport bamer is associated with a
rapidly varying profile of Er
developments can produce profiles which are mhd unstable, leading to a
termination of the discharge
Experiments on JET have demonstrated significant a-particle
production in optimized shear discharges with D-T fuel The improved
confinement of internal transport bamer configurations makes them
attractive for a steady state fusion power plant However, their use in
these ways requires the development of current drive and heating
systems to control the current and pressure profiles on timescales longer
than that corresponding to resistive diffusion

4 15 Scaling laws
4.15 Scaling laws
Theory
The purely empirical scaling relations described in Section 4 12 were
expressed in terms of operational and engineering parameters such as
I, P,B, and a The equations governing the underlying mechanism
determining confinement place constraints on the form of these scaling laws,
the constraints being dependent on the type of process responsible These
constraints have been derived using the scale invanance technique and
are referred to as the Connor-Taylor or Kadomtsev constraints. This
technique exploits the invanance of the governing equations under scale
transformations. It is related to dimensional analysis but is more
systematic and can uncover constraints not readily accessible by that more
heuristic method
An illustrative example is the case where the transport mechamsms are
taken to be described by the Vlasov equation with electrostatic potentials
determined by the quasi-neutrality condition. Thus electrons and ions
satisfy
9^
dt
9/
+ ^{E + vxB)
9^.
dv
0
4 15 1
E^jjfj^'v-
These equations are invanant under just three scaling transformations
In these transformations each of the variables is multiplied by a power
of the scale factor such that the equation remains unchanged. The three
scale transformations in this case are
Tl /, ^ afj
T2 v^^v t ^ r^t E^^^E B^^B
T3 t ^ yt X ^ yx E ^ y~^E B^y~^B.
These transformations can now be used to impose constraints on the form
of the confinement time scaling Thus, taking the confinement time to be
dependent on charactenstic values of the quantities n,B,T, and a in the
power law
TE ex nPB'lT''a'
and using the definitions
4 15 3
n= f fd^v nT = \m f v^fd^v.

4 15 Scaling laws
the transformations Tl to T3 can be substituted in turn into eqn 4 15 3.
Equating the powers of a,^, and y on the two sides of the resulting
equations then provides three constraints on the indices p, q, r, and 5
CI p = 0
C2 q + 2r = -l
C3 s-q=l
Substitution of these constraints into eqn 4 15 3 now gives the required
scaling relation
If te IS taken to have a general functional dependence on the characteristic
quantities, relation 4.15 4 is replaced by
Relations 4.15 4 and 4 15 5 are specific to the model defined by
eqns 4,15 1 and 4 15 2. More complex models lead to fewer invanant
transformations and fewer constraints on the indices The most important
of these models are summarized in Table 4 15 1
If in the above example the quasi-neutrality condition is replaced
by Poisson's equation, a constraint would be removed Indeed if the
confinement processes also involved the Fokker-Planck equation and
finite-y6 effects, there would be no constraints on the form of re, and
Table 4.15.1 Scaling laws for vanous plasma models
Plasma
model
Scaling law for Bte
Constraints on power
law scahng D.15 3)
Number
of free
exponents
Colhsionless low-N
Colhsional low-N
Colhsionless high-N
Colhsional high-N
Ideal mhd
Resistive mhd
F {T/a^B^)
F {T/a^B\ na^/B^a^)
F{na^,T/a^B^)
F{na\Ta'l\Ba^l^)
{naY^F{nT/B^)
{na'^)"^F{nTIB\Ta'l^)
p = 0^s = -2r = q + l
3p + 2r + s = 0
4p + q + 2r+l=0
2p-2r-s = 0
q + 2r + l=0
2p + |?+ 1-5 + 1 = 0
2p + q = 0
q + 2r+l=0
2p + q = 0
p-r + 2s-^=0
1
2
2
3
1
2

4 15 Scaling laws 193
in the power law representation the four indices p,q,r, and 5 would be
independent
In general this method does not give information on geometrical ratios
such as a/R, hja, and the safety factor q The procedure is of less value
when atomic processes play a significant role
Experimental scaling relations
A characteristic time which frequently appears in the discussion of
confinement scaling laws is the so-called Bohm time. This is defined by
a"
where Db is proportional to the diffusion coefficient introduced by Bohm
and IS here defined by
It IS seen that this coefficient can be rewritten in the form
Db ~ u>cP^,
where <Uc is the cyclotron frequency and p is the Larmor radius
Equation 4.15 5 can be expressed in terms of Tb in the form
tE = tBF(p*)
where
is a normalized Larmor radius More generally te can be written
x^ = x^F{p^,fi,v^,K) 4 15.7
where
* e^l^vylRq
with s = r/R, IS the ratio of the effective collision frequency for trapped
particles to their bounce frequency and
x. = ^
a
IS a normalized Debye length
If A:^ plays no role in confinement, there are only three free indices in
a power law form for Te. This constraint on p,q,r, and 5 in eqn 4 15.3
IS known as the Kadomtsev constraint The ITER89-P and ITER H93-P
scaling laws satisfy this constraint approximately. It also follows from
eqn 4 15.7 that if the quantities p*,N, and v^^ are the same in different

4 15 Scaling laws
Fig. 4 15.1 The normalized energy
confinement time, Bt^, compared to the
gyro-Bohm scahng p^^, for discharges in
JET and DIII-D with similar values of ^
and j8n iq is the safety factor, j8n the
Troyon normalized thermal j8) The solid
squares are JET discharges with q = 3 4,
^N = 1 5, the solid circles are DIII-D
discharges with ? = 3 8, j8n = 2 1 The
open squares and circles relate to
dimensionally identical discharges in JET
and DIII-D, respectively
tokamaks, then Te a fi~ Such so-called identity experiments have
been earned out between JET and DIII-D and are consistent with this
prediction (see Fig 4 15 1)
If further there is no P dependence, the constraint is that of the low-N
Fokker-Planck equation The absence of v^^ would correspond to the
constraint of the collisionless high-N model Finally if both v^ and P play
no role the scaling relation is that given by eqn 4 15 6
In extrapolating from present expenments to a tokamak reactor it is
found that the values of P and v^^ will undergo a small change compared
to p^ It IS important therefore to determine the p* scaling
If confinement is governed by small scale turbulence on the scale
of p, the colhsionless skin depth c/wpe, or the layer width of resistive
instabilities, additional invanant scalings exist, leading to
tE
= rB-F(^,v,).
4.15.8
This IS known as gyro-Bohm scaling. At constant ^ and v^^ eqn 4.15.8
implies fire a p^^ This has been demonstrated in similanty
experiments between H-mode discharges in JET and DIII-D, as shown in
Fig 4 15 1 If on the other hand the turbulence is on a scale related
to a, Te takes the Bohm scaling form
tE = tBF(^,v>,) 4 15 9
The ITER89-P scaling relation 4 12 2 gives Bohm scaling with
-tB^ff
'V*
whereas the H-mode scaling expressions 4 12 4 and 4 12 5 are closer to
gyro-Bohm
It may be that Te is not best descnbed by a power law expression
in p*,N, and v^^ For example, a two term, non-linear form has been

4.16 Transport coefficients 195
suggested for H-mode This represents separate contributions from the
plasma core and edge pedestal regions
Even if the functional form (p^,p,v^) in eqn 4 15 7 is not known it
IS possible to use the concept of similanty to predict the performance of
other tokamaks from the confinement behaviour of existing devices
For example, a family of similar tokamaks of different sizes but having
the same values of p^„p, and v^ would have
r, ~ 1 ~ «5/4
If Te satisfies eqn 4 15 8 then, for the same values of ^6 and v^^, there is
two parameter family of similar tokamaks with
while if Te satisfies eqn 4 15 9, there is another two parameter family
with
Thus knowledge of the performance of one tokamak of a given size can
be used to predict the performance of a future device provided conditions
are arranged to maintain the similarity, including geometry and profiles.
Transport coefficients
The energy confinement time Te represents the result of a number of
transport processes. In the centre of the discharge sawteeth play a role,
at the edge ELMs have an effect in H-mode and in between transport is
usually determined by local processes in which both the electrons and the
ions undergo diffusion and convection. Further effects are the exchange
of energy between the species and the loss of energy by radiation
Furthermore there is a radial dependence of the processes determining the
transport and it is therefore necessary to carry out measurements which
allow a determination of the local transport coefficients In addition to
energy transport it is important to investigate the transport of particles,
including impurities and energetic particles, and the transport of toroidal
angular momentum
The radial flux densities are the particle fluxes Fj, and the heat fluxes
qj for each species j In neoclassical theory these are driven by the
radial gradients drij/dr and dTj/dr The observed transport can also
be written in these terms, the fluxes being related to the gradients by a

4 16 Transport coefficients
matrix of coefficients Thus if the fluxes for each species depend only on
the gradients for that species, the equations for the fluxes can be written
dr dr
dn, dT,
The diagonal elements of the matrix are the usual Dj and nXj-lna more
general representation there would be an equation for the toroidal current,
introducing the toroidal electric field into the flux equations (for example
eqns 4.6 24 and 4.6 25) Furthermore there could be dependencies on
gradients of other species
In an alternative simplified representation the fluxes are expressed as
the sum of a diffusive and a convective term For example the electron
particle flux can be written
d«e
Fe = -D—^ - V«e
dr
where D is the diffusivity The second term describes an inward pinch with
a velocity V and could represent the contribution of all the off-diagonal
terms It is not possible to separate D and V using steady state
measurements but they can be determined by means of transient perturbations
using, for example, pellet injection or gas puffs
Most experimental information relates to the diagonal matrix elements
or diffusivities, but the particle and impurity pinches have also been
measured A heat pinch is less commonly invoked The diffusivities are
generally much larger than the neoclassical values Thus typically
Xi,Xe~ Im^s"'
and the hydrogen and impurity diffusivities are somewhat lower with,
^ ~ ^^ ~ |Xe
and the pinch velocity
V~ 10ms"'
These values are to be compared with typical neoclassical values
Xineo~0 3m^s"'
Xe neo ~ £>neo ~ I ~ j ^i neo
£>zneo~0 1m^s"'
Generally
Xi ~ 1 to 10 Xi neo and Xe ~ 10^ Xe neo
The values of D, D^, and Xi can approach neoclassical levels in the plasma
core and in high confinement regimes but Xe is almost always anomalous

4 16 Transport coefficients
Fig. 4.16 1 Similanty of the toroidal
momentum diffusivity /0, helium
diffusion coefficient, One. and ion and
electron thermal diffusivities, /, and /e, in
a hot ion L-mode discharge in TFTR
(ITER Physics Basis, Nucleai Fusion 39,
2175A999))
)iffusivity
01
-^'y^-
/VV"'
: u/
- //
//
-w,
^^-^^"^/"/^
z^^-^^
— — Z0
z,
Ze
Minor radius (m)
Toroidal momentum confinement is also anomalous, with a diffusivity
X0 which IS similar in magnitude to Xi and Xe
A general feature of the diffusivities is their increase across the radius
toward the plasma edge Results from the TFTR tokamak are shown in
Fig. 4 16 1. Experiments on JET indicate a sharp transition from
approximately neoclassical values in the core to very anomalous values in the
outer region.
The various confinement regimes arise from changes in either Xi or Xe
Thus in ohmic confinement Xe dominates at low n^ but decreases with n^
until Xi exceeds it in the saturated confinement regime. In L-mode plasmas
Xi IS somewhat greater than Xe H-mode plasmas are ch^actenzed by a
reduced Xe m the outer region, the enhanced confinement appeanng as an
edge transport barrier In Supershots and Improved Ohmic Confinement
plasmas density peaking leads to lower values for Xi- Plasmas with
nonmonotonic q profiles have neoclassical values of Xi m the core region
(see Fig 4 14 1), sometimes Xe is also reduced
There is an apparent difficulty in relating the temperature and density
dependence of the xs to the scaling of the energy confinement time
From relation 4.12.2 it is seen that te decreases with increasing density
and temperature whereas x increases with radius and so confinement
decreases radially with decreasing density and temperature. The reason
for this IS not known but it could for example be the result of a deterioration
with the shear parameter {rjq) Aq/Ar
The /^ dependence of te in relation A 12 2 indicates local dependence
on Be, possibly x ~ l/fi| but again there is considerable uncertainty
In ohmic conditions Xe and Xi are inversely proportional to the ion mass
but this dependence is much weaker in L-mode plasmas
Detailed parameter scans in T-10 provided a fit for Xe for ohmic
conditions.
nqR R
Q-

4 17 Fluctuations
where Dr = T/eB This gyro-Bohm form is contrary to the L-mode
scans which, for JET and TFTR, give the Bohm form
In H-mode, however, results from JET and DIII-D are gyro-Bohm in
nature
Xeff~DgBr«^y^^
where D^ = p^D-Q.
Experiments in DIII-D with transient off-axis ECRH suggest the
existence of an electron heat-pinch, but this conflicts with the results of ICRH
experiments in JET This question is related to that of so-called
profile resilience Experimental results sometimes suggest that the plasma
relaxes to a particular type of Te profile This is at variance with
experiments in which the transient behaviour is understood in terms of a
non-linear conduction law. Furthermore, the Ty profile is sometimes close
to that corresponding to marginal stability for ion temperature gradient
modes, discussed in Section 4.20 Heat pulse and pellet injection
experiments indicate the importance of off-diagonal elements in the transport
matrix.
4.17 Fluctuations
The anomalous transport described in previous sections is believed to anse
from turbulent diffusion caused by fluctuations in the plasma. These may
be electrostatic or electromagnetic and such fluctuations are expected to
appear as the non-hnearly saturated state of one or more of the many
microinstabilities which have been predicted for a tokamak.
Thus turbulent fluctuations produce an £ x B drift velocity
8v±_
SE±
and this combines with density fluctuations 8n to give a convective particle
flux
r = {Sv±Sn),
where () is an average over a flux surface
This average will produce a finite flux except where Sv± and Sn are
exactly out of phase. Similarly temperature fluctuations of species j will
give rise to a heat flux
^j = jrij{Sv±STj),

4 17 Fluctuations
199
where rij is the equilibrium density. The electric field fluctuations can be
either electrostatic or electromagnetic.
If there are magnetic fluctuations SB with an associated change in
magnetic topology, the perturbed velocity Sv\\^ parallel to the magnetic
field combines with the perturbed radial magnetic field SBr, to give
a flux
Macroscopic mhd phenomena such as sawteeth and low mode number
teanng mode islands can also have a significant effect on confinement
through a rearrangement of the otherwise toroidally nested magnetic flux
surfaces These phenomena are described in Chapter 7, and this section
will concentrate on finer scale fluctuations, often comparable in size to
the Larmor radius.
Observations
At the edge of the plasma, fluctuations mSn,STe, and the electric potential
S</> can be measured by Langmuir probes, and the magnetic perturbation
SB can be measured using Mimov coils. While S«/«,Sre/re,andeS</>/re
rise rapidly towards the plasma edge, reaching values ~50%, under
quiescent conditions the edge value of SB/B is small, typically ~10~'^
Measurements of Sn in the plasma interior can be made by a vanety
of techniques including microwave scattering. Far Infra Red scattering
(FIR), Heavy Ion Beam Probes (HIBP), Beam Emi^ion Spectroscopy
(BBS) and microwave reflectometry. Figure 4 17 1 gives results from
TFTR It IS seen that the internal density fluctuations are much lower,
falling to ~1%
Fig. 4 17 1 Amplitude of normalized
density fluctuations in a TFTR Supershot
plasma as measured by beam emission
spectroscopy (Fonck, R.J. et al, Phys
Rev Z.effj 70, 3736A993).)

4 17 Fluctuations
Measurements of S</> in the core using a heavy ion beam probe indicate
eS(f)/Te ~ Sn/n Direct measurements of internal magnetic fluctuations
are in their infancy but a cross polanzation scattering measurement on
TORE SUPRA suggests SBr/B ~ IQ-^^
The spatial Fourier transform of the fluctuations has wavenumbers
k± and k\\ perpendicular and parallel to the magnetic field Theoretical
models for fluctuations are usually characterized by the predicted k
spectrum The observed spectrum S{k±) is dominated by wavelengths greater
than the ion Larmor radius In the radial direction correlation lengths of
2-3 cm are observed with the spectrum peaking at the longest wavelength
measurable. The poloidal spectrum is peaked in the region /c_lPs ^ 0.3,
where ps is the ion Larmor radius at the electron temperature, S falling
off at larger k±. Typical wavenumbers parallel to the magnetic field have
/c||L ~ 1 where L is the connection length, qR, around the torus The
fluctuation amplitudes for Sn satisfy the simple theoretical mixing-length
estimate Sn/n ~ l/k±Ln where Ln is the density scale-length This is the
amplitude at which the perturbed gradient k±Sn balances the equilibrium
gradient
The characteristic frequencies of the fluctuations appear to be
~ 100 kHz This would be comparable with the diamagnetic frequency
(o^/ln for poloidal mode number m ~ 100, though taking account of
Doppler shifts from plasma flows may significantly reduce m
Correlations with transport
If the fluctuations described above are to account for the observed
transport processes it is necessary to demonstrate a correlation between
the fluctuations and confinement
This can take the form of detailed quantitative compansons between
measured fluxes and those calculated from the fluctuation measurements.
However this is usually only possible at the edge of the plasma For
the main plasma it is necessary to resort to a companson of the radial
dependencies of the fluctuation amplitude and xir) For example it is
found that (Sn/n)^ and x increase together with radius More globally
it IS possible to analyse the correlation between the level of fluctuations
and the confinement time Te These correlations can take the form of
similar scahngs with parameters such as n and /, or similar behaviour
at transitions such as the L-H transition and the formation of an internal
transport bamer
In the edge region a precise analysis of the relationships between
transport and electrostatic fluctuations is possible since probes can be
used to measure the amplitudes and phases of Sn, S<p, and STg. Detailed
studies have been made on TEXT For particle fluxes, the resulting
magnitudes and scahngs agree with the observed transport behaviour, indicating
that electrostatic fluctuations provide the dominant transport mechamsm
The conductive electron heat flux is more uncertain but the measurements
of STq would allow an explanation in terms of electrostatic fluctuations

417 Fluctuations
201
For the edge region the magnetic fluctuations are too small to play a
significant part
Using the heavy ion beam probe in TEXT it has been possible to
determine Sep and Sn together with their phase relation further into the
core This allows a calculation of the expected particle flux from
electrostatic fluctuations and rough agreement is found with the actual flux over
the region r/a > 0 6 In the absence of information on S</> theoretical
estimates of x based on measurements of the amplitude of the Sn
fluctuations in the case of TFTR are in reasonable agreement with power balance
calculations. Similar agreement is obtained from the estimate x ~ LI/Tc
using experimental correlation lengths Lc and times Xc
A clear correlation between r^ ' and (Sn/n)'^ was found in ohmic,
ion cyclotron, and neutral beam heated plasmas in TFR as shown in
Fig 4 17 2. Detailed studies ofthe correlation between density fluctuation
characteristics and transport have been carried out in TFTR where ohmic,
L-mode, and Supershot discharges have all been analysed The fluctuation
power correlates with anomalous transport in that, within the confinement
zone, the variation with applied power and plasma current is consistent
with te The fluctuation scale-length also decreased from ~4cm in low
density ohmic plasmas to ~2cm in Supershots, consistently with the
Fig. 4.17 2 Measurements from TFR
showing a correlation between the level of
density fluctuations and the electron
energy confinement time (with allowance
fr)r the effect of sawtooth oscillations)
Figure (a) is for ion cyclotron heating and
Fig. (b) is for neutral beam heating. Both
figures also give results for ohrmc heating
(TFR Group and True, A in Turbulence
and anomalous transport in magnetic
plasmas, 1986, p. 141, Eds GresiUon, D
and Dubois, M A. Editions de Physique,
OrsayA987))
(a)
-
(b)
-
^J(_.*/
1 1 1
\^
1-,/-^

4.18 Turbulence-induced transport
Fig. 4.17.3 Showing the fall of density
fluctuations as measured by reflectometry
dunng an L-H transition in DHI-D
(Doyle, E J. et al Plasma Physics and
Controlled Nuclear Fusion Research,
(Proc 14th Int Conf Wurzburg, 1992)
Vol 1, p. 235 I.AE A Vienna A993))
Time
improved confinement. The longer wavelength fluctuations in L-mode
discharges may relate to the Bohm-like scaling of L-mode confinement.
In DIII-D and ASDEX detailed correlations between fluctuation levels
and the L-H transition have been observed. As the edge transport barrier
forms, the fluctuation level drops within 100/as. Figure 4.17.3 shows the
correlation between the decrease in Da emission and the fluctuation level
at an I^H transition in DIII-D. Furthermore the improved confinement
which develops later for r/a > 0.7 is accompanied by a decrease in
fluctuations over tens of ms. In L-mode current ramp experiments in
TFTR the fluctuations change more rapidly at the edge than in the core,
consistently with the changes in heat transport.
Turbulence-induced transport
The theoretical picture of turbulence-induced transport is that the free
energy released by an instability drives a steady level of fluctuations in
the associated perturbed quantities. In this turbulent state fluctuations
result in a radial transport of particles and energy.
It is possible to attempt a theoretical description at one of two levels.
Firstly, the behaviour of the underlying instability can be taken as given.
In this case the transport arising from the electromagnetic fluctuations
SE and SB such as those described in Section 4.17, is calculated. This
procedure is described in the next sub-section where random walk
estimates for turbulent transport arising from the fluctuating E x B drift
velocity Sv± and from the parallel motion along stochastic magnetic
field lines are given. This is followed by a discussion of quasi-linear
theory where turbulent fluxes such as the particle flux F = {SnSv±), are
calculated using the hnear plasma response to SE and SB.
Secondly, at a more ambitious level, it is possible to attempt a
calculation of the non-linearly saturated state of the microinstability and

4.18 Turbulence-induced transport 203
then the resulting transport. There are several possible procedures
available. One general method uses the scale invariance approach described
in Section 4.15 to discuss local rather than global transport. Another
approach is strong turbulence theory in which saturation is taken to occur
when the perturbed gradient VSn is comparable with the equilibrium
gradient Vn. Alternatively, for weak turbulence the linear growth of
a fluctuation of a particular wavelength is balanced against its decay
due to non-linear scattering to other wavelengths. Particular examples
arising from candidate instabilities are discussed in Section 4.20. Finally
computational simulation of turbulent transport based on the fundamental
plasma equations as discussed in Section 4.21, offers the most exact
approach.
Transport due to electrostatic fluctuations
It is convenient to describe the fluctuations in terms of their Fourier
components. Thus the electrostatic potential is written S(p= J^k ^<Pk^'^'^^-
A particular component Scpk gives rise to a crossfield E x B drift velocity
.kx B
Svk = -i—j^S<pk-
If the particle velocity Svk persists for a time Xk, known as the correlation
time, it leads to a displacement Srk ~ ^VkT^k- Summing over the wave-
number spectrum, a random walk estimate for the turbulent diffusion is
. ^ . .,. , 4.18.1
The correlation time is determined by the process which most rapidly
limits the unidirectional E x B drift. The possible processes include
(i) the time variation of the fluctuation, characterized by Xk ~ l/cok, (ii)
the effect of the linear motion of the particles giving for example Xk =
l//c|l vj, the time for a particle to move along a parallel wavelength of the
fluctuations, or Xk = l/m, the time for magnetic drifts to carry particles
over a perpendicular wavelength, or (iii) the time Xk = l/vefif for
collisions to change the particle orbit, as for example with trapped particles,
which have Ves = v/e. However, as the level of the turbulence increases
the fastest limiting process may become the turbulent velocity Svk
carrying a particle a perpendicular wavelength, that is Xk = ^^ where
Qk =kj_8vk = .
Thus for low levels of fluctuations with ^k'^i^eSk, where
<yeff;fe=max(<y;t,/c||iiT,<yd,Vefif)> eqn. 4 18.1 becomes
D = y— r^^^V
^ <^eSk V

4.18 Turbulence-induced transport
which yields the scaling D oa (Scpy. At higher fluctuation levels when
^k ^ o^eSk, the diffusion coefficient is given by
r ^
so that D becomes Hnear in S(f).
Transport due to magnetic fluctuations
When magnetic fluctuations SB are present they can destroy the set of
nested toroidal flux surfaces and produce ergodic magnetic fields as
described in Section 7.13. The thermal motion of particles along the
resulting magnetic field lines can then lead to loss of particles and energy.
As described in Section 7.2 a magnetic field perturbation SB^aia.
rational surface at radius rmn, given by m = nq{rmn), produces a magnetic
island of width
u;^„= -AJ!H1^ 4.18.2
\ m B )
where the shear length Lg = Rq^/rq' — Rq/s, where 5 is the magnetic
shear. As the perturbation level is raised an increasing part of the regions
between resonant surfaces becomes ergodic. The behaviour is determined
quantitatively by the parameter
1 Wmn + Wm'n'
4.18.3
where adjacent resonant surfaces are labelled by m, n and m', n'
respectively. The field line behaviour becomes predominantly ergodic as a
approaches one When a » 1 and many islands overlap the behaviour
becomes stochastic. Equation 4.18.3 is then conveniently generalized to
where the sum is over all modes with rational surfaces in Ar, that is those
for which nq{r) < m < nq{r) + nq'[s.r. Then for Wmn independent of
= E«
,nq.
When a » 1 the radial diffusion of the field lines can be described by a
magnetic field line diffusion coefficient Dm Thus if the field perturbation
hBr remains in the same direction over a distance Lc in the toroidal
direction, that is Lc is a correlation length, then the field line takes a
radial step
If a sequence of such steps is uncorrelated then a random walk estimate
for the radial diffusion coefficient as the field line moves around the torus

4.18 Turbulence-induced transport 205
is given by
For weak turbulence the correlation length Lck ~ 1/^|| ~ Rq, leading to
Dm oc {BB,f. More generally
/C|| =
-.V
and the second term dominates as the fluctuation level increases.
Expressing BB^k in terms of the island width Wk and estimating a radial
derivative as w^', eqn 4.18.4 can be written
D„ = E^
The motion of particles along these diffusing magnetic field lines leads to
radial transport of particles and energy. In the 'collisionless' limit, when
the mean free path X exceeds the correlation length Lc, a particle moves
freely along the radially diffusing magnetic field line with velocity U|| for a
collision time Tc. In this time it moves a radial step distance Br = y/Dy{k.
If a collision displaces the particle's guiding centre to an uncorrected field
line, so that it does not merely retrace its path, it performs a random walk
with a diffusion coefficient ^
(SrJ DmA
D = = = uiiDjvi.
However, if the plasma is more collisional with A<Lc the particle
collisionally diffuses along the magnetic field line with a radial step
Br ~ iBBr/B)X for each collision time. A random walk estimate for
the radial diffusion then yields
where Dy ~ (X^/tc) is the parallel collisional diffusivity.
A number of the theories introduced in Section 4.20 obtain Wn oc I/n
and in this case eqns 4.18.4 and 4.18.2 can be used to write eqn 4.18.5 in
the form
Z)~4^(-) (—) , 4.18.6
q^s^ \rJ \N/
where ag — 1 and A'^ is the number of contributing toroidal mode numbers.
Because relation 4.18.6 depends on the mobility of a particle along B, the

4.18 Turbulence-induced transport
transport coefficients for the different species have the following relations
Xe ~ i/;;^Xi, Xi ~ £>
D^ ~ /—D, D^'^iv) ~ ( — ) D,
where Xe and Xi are the electron and ion diffusivities, and D, D^" (u), and
Dj are the diffusion coefficients for the thermal electrons, suprathermal
electrons of velocity v and impurity ions with charge Z and mass m^.
The ambipolarity requirement, that the electron and ion fluxes be equal
in order to maintain charge neutrality, is brought about by a positive radial
electric field which restrains the more mobile electrons.
Quasi-linear theory
More precise relationships between fluctuations and transport can be
obtained from quasi-linear theory.
Within a fluid description of the plasma, the turbulent density flux can
be obtained from the surface-averaged electron density, n, equation:
^n + V ■{Vn) = S, 4.18.7
where S is the particle source. Choosing coordinates with x and y
perpendicular to the magnetic field, which is in the z- direction, x being in
the direction of the gradient in density and averaging over the y-direction
with n = {n) + Sn, V = SV, one has
^{n) + ~ir,) = S, 4.18.8
dt dx
where the particle flux r;^ in the ;c-direction is
r^ = {SV^Sn).
From the perturbed form of eqn 4.18.7 we have
i-i)icok+iy,^)Snk = -SV^,k — {n), 4.18.9
where (o^ and y^ are the frequency and growth rate of the Fourier mode k.
Only the irreversible part of the perturbed density from eqn 4.18.9
(of. + )// dx
gives a contribution to expression 4.18.8
3
dx

4.18 Turbulence-induced transport 207
where the diffusion coefficient is
D± = Y /^ ol^Vxkl^- 4.18.10
T ^^ + y^
It is more convenient to express 8 Yx,k in terms of the radial
displacement ^x of the plasma element using the relation d^/d? = Fx
Again only the irreversible part of the displacement ^
Yk%x,k = 8Vx), 4.18.11
is needed in estimating the transport. After substitution of expression
4.18.11 in4.18.10
"-Ek^II^.P^j^
Yk
This is the quasi-linear expression for transport, where § remains to be
determined. Further simplification is possible from the fact that the
displacement cannot exceed the value ^x,k = 7t/k±. Supposing that for short
wave turbulence k^ ^ ky ^ k±, the diffusion coefficient becomes
Z)±
B.4J/)/, yj \
2 Vl<ol + yi)^^^'
where the maximum term in the sum 4.18.12 has been chosen.
In terms of a kinetic description the quasi-linear particle and heat fluxes
can be computed from 8f, BE, and SB. For example
, BEy 8Bx\ ^ \
^f[-ir + n~]^'^)- 4.18.14
-(/
In cyhndncal geometry the Hnearized kinetic equation 4,15.1 can be
solved for Sf to obtain
8fk = \—t(^<P - nSA\\)k^ 4.18.15
(O — k:||i;|| B ar
where /m is the Maxwellian distribution and A is the vector
potential. Only the imaginary part of Sf in eqn 4.18.15 contributes to F in
eqn 4.18.14 and consequently
with AII the parallel component of the vector potential. Similar equations
hold for the heat flux q, and the whole transport matrix can be determined

4.18 Turbulence-induced transport
from the density and temperature gradients appearing in d/w/dr provided
the spectrum of fluctuations is known. An important modification appears
in toroidal geometry when trapped particles are present. For these
particles the contribution from parallel motion, k\\ v\\ in the denominator of
eqn 4.18.16 averages to zero due to their periodic bounce motion. Then
the lower frequencies {(Od), the precessional magnetic drift of trapped
particles, and Ves their detrapping frequency due to Coulomb collisions,
play an important role and require the replacement
ImC-^Utof '
\<W-/C||U||/ V<^~ (<^d>+iVefif/
in eqn 4.18.16.
Saturation levels and transport fluxes
The determination of the fluctuation spectrum is a difficult theoretical
task. Analytic approaches involve uncertain assumptions about
saturation mechanisms and numerical simulations play an important role in
validating these models. Before discussing these calculations it is
appropriate to mention the constraints arising from dimensional analysis. If
the turbulence is on a microscopic scale, for example on the scale-length
of the ion Larmor radius Ps measured at the electron temperature, the
colHsionless skin depth c/wpe, or resistive layer width a/ ^tr/ Ta then the
scale invariance technique can be applied to the equation for the
fluctuations. The decoupling of the equilibrium scale-length from the fluctuation
scale-length permits more invariant transformations. This procedure leads
to scalings for the fluctuations and the corresponding turbulent transport.
For example, the potential fluctuation takes the form
and the diffusion coefficient
^ = Z)gB/(v.,N,...)
where the gyro-Bohm coefficient is
DgB = ^Db
with Db = TleB the Bohm coefficient. On the other hand, if the
fluctuations have a scale I which is proportional to a, rather than p^, but still

4.18 Turbulence-induced transport
satisfies i <^a, then
D = Db/(v„N,...).
The calculation of specific forms for the function / requires a model
for the non-linear saturation. A simple bound is given by the so-called
mixing-length estimate, in which it is assumed that the instability drive
is removed when the perturbations reach an amplitude such that the
perturbed gradients equal the equilibrium gradient. Thus for drift waves
driven by the density gradient this estimate gives
k±8nk ~ no/Ln
4.18.17
and since the density perturbations satisfy the Boltzmann relation the
saturated potential fluctuation is
T k±Ln ' ■
A comparison of the estimate 4.18.17 with experimental data is given in
Fig. 4.18.1.
Inserting relation 4.18.18 into the quasi-linear^4'ormula 4.18.16
for electrostatic drift wave fluctuations with the diamagnetic frequency
Fig. 4.18.1 Showing a comparison of
the normalized fluctuation level h/n with
the mixing-length estimate l/k^La for a
number of tokamaks, where k± is the mean
perpendicular wavenumber of the
fluctuations. The asterisks indicate
measurements closer to the plasma edge.
(Surko, CM. in Turbulence and
anomalous transport in magnetic plasmas,
1986, p. 93, Eds Gresillon, D. and Dubois,
M.A. Editions de Physique, Orsay A987).)
ALCATORAj
ATC

4.19 Radial electric field shear and transport
<y*(= k±T/eBLn) gives
-t-
This result can also be interpreted as a balance between the linear
growth of a mode and a stabilization from turbulent diffusion, k\D. The
expression 4.18.13 reduces to 4.18.19 when y^ > cok-
Weak turbulence theory allows calculation of a steady state spectrum of
fluctuations by balancing wave energy growth yi^\S(f)k\^ against damping
from non-linear wave scattering due to ions. This damping arises from
the SE X B/B^ ■ WSf non-linearity in the ion kinetic equation and leads
to a damping rate k]_\S(f)kf /co^B'^.
Precise expressions can be obtained for a particular instability but a
qualitative estimate is given by
e8(pk I'
T
~.klLl'
Substitution of eqn 4.18.20 into eqn 4.18.16, gives the weak turbulence
estimate for the diffusion coefficient,
Radial electric field shear and transport
Experimental evidence from tokamaks indicates that improved
confinement is often associated with the development of strongly radially varying
profiles of the radial electric field, Er as shown in Fig. 4.14.2. In particular
this is evident in the vicinity of transport barriers, both the edge barriers
associated with H-mode and internal transport barriers. However, other
improved confinement modes such as V-H mode in DIII-D show this
feature across much of the plasma radius. These observation suggest that
a radially varying Er profile reduces anomalous transport.
A theoretical basis for a link between reduced transport and the sheared
E X B velocity which arises from a radially varying Er has been
provided. The mechanism is a reduction in the mixing-length estimate for
a density fluctuation, eqn 4.18.17, which arises from an increase in the
effective perpendicular wavenumber, k±,asa. result of the velocity shear.
This increase in k± is illustrated in Fig. 4.19.1 where a sheared velocity
Vy (x) = SyX is superimposed on an isotropic turbulent eddy or vortex of

4.19 Radial electric field shear and transport
► y o B -^v^
(a)
Fig. 4.19.1 The effect of a sheared £xB flow, VexB on a turbulent eddy:
(a) illustrates the A:-variation of the sheared flow in the v-direction, perpendicular to
the magnetic field B, (b) shows a circular eddy of size L, and (c) demonstrates how the
sheared flow distorts this into an elongated elliptical shape after time t. The major axis
of the ellipse is given by L^ = L(l + 5^?^)'^^ where, 5„ is the velocity shear, while
the minor axis is reduced to L± preserving the area of the eddy. (Itoh, K., Itoh, S.-I.,
and Fukuyama, A. Transport and Structural Formation in Plasma, I.O.P. Publishmg,
Bristol, p. 226 A999).)
size L = /cJq in the {x, y) plane, perpendicular to the magnetic field. After
a time t the eddy becomes distorted, the circular eddy being stretched to
an ellipse with major axis L/ = L(l + 5^?^)'/^. The area of the eddy
is conserved so the minor axis is reduced by the same factor, leading to
an effective perpendicular wavenumber, /cefif = ^±o(l + 5^?^)'/^. This
process persists for a correlation time so t = Xc = (Do/c^ggf)"', where
Do is the turbulent diffusion coefficient in the absence of velocity shear,
and
^±eff = ^±o(l + 52r2)i/2. ''' 4.19.1
In the limit of strong velocity shear, SyX^ » 1, it follows from eqn 4.19.1
and the definition of the correlation time that
According to the mixing-length estimate the density fluctuation
amplitude, h, is suppressed relative to its value Hq in the absence of velocity
shear, by a factor /c±o/^±efif so that
1
l + 52r2-
This is a significant reduction if SyXc > 1. In cylindrical geometry the
E X B velocity is given by Sr/fi and the condition S^tc » lis expressed
in terms of the £ x B shearing frequency coe = r d(Er/rB)/dr as
coE > l/kioD.
For a toroidal flow, me takes the form
RBe d f Er \
4.19.2

4.19 Radial electric field shear and transport
For a mixing-length estimate, Do = Yhlk\, where ji, is the linear growth
rate, and inequality 4.19.2 reduces to
«£ > YL. 4.19.3
Calculations show that this condition on «£ provides linear stability for
a range of modes. Non-linear simulations of turbulent transport due to
ion temperature gradient turbulence are consistent with condition 4.19.3,
providing a 'rule of thumb' for the suppression of transport by sheared
flows. The inequality 4.19.3 is often found to correlate with experimental
observations on the formation of transport barriers.
The electric field shear can also modify classical and neoclassical
transport by a process known as 'orbit squeezing'. This is most
easily illustrated for Larmor orbits in a uniform magnetic field B in the
z-direction. Consider the Hamiltonian for the motion of a particle in this
field and a quadratic electrostatic potential well
H = ^pI + ^{Py- eBxf + -p] + ^-,
where p^^, py,Pz are the canonical momenta with py and p^ conserved
quantities. Then the normal Larmor orbit appears as motion in the
;c-direction in a 'potential well' m (py — eBx)^/2, leading to an excursion
X = Py/eB about x = 0, giving the usual Larmor radius, pl- Inclusion
of the electrostatic potential steepens the potential well and the turning
points are modified to ;c = xl/{1 + S) where S = m^"jeB^ is the
squeezing factor. Transport coefficients are correspondingly reduced by
a factor S~' in the limit 5 <^ 1. The effect on banana orbits is similar,
but more complex.
The radial electric field satisfies the radial force balance equation for
any ion of charge Ze
Er=^^~-VeiB^ + V^iBe, 4.19.4
nZe dr v v
where Vei and V^i are the poloidal and toroidal flows, respectively, of
the ion species considered. E x B flows can be generated by applying a
voltage using biased probes at the plasma edge, but eqn 4.19.4 shows they
can also be produced indirectly in a number of other ways: applying
additional heating to increase the ion pressure gradient contribution dpi/dr,
using momentum inputs to drive Vgi and V^i against viscous damping,
and by flows driven by the turbulence itself through the Reynolds stress.
These vanous inputs offer means to control the presence of transport
barriers.

4.20 Candidate modes 213
Computational simulations of plasma turbulence, described in
Section 4.21, indicate that fine scale poloidal E x B flows can be
generated by the turbulence. These are called zonal flows and are found to
reduce the saturated level of the turbulence.
Candidate modes
The recognition that the transport in tokamaks is 'anomalous' has led to
an intensive search for the mode, or modes, of instability which cause
this behaviour. So far no candidate has received general acceptance.
Several microinstabilities have been invoked to explain the observed
fluctuations and the associated transport. A brief account of the drift mode
instabilities is given in Chapter 8 and the fluid-like mhd instabilities are
introduced in Chapter 6.
A commonly used model for ohmic and L-mode plasmas assumes
electrostatic trapped-electron drift waves and ion temperature
gradient modes with a contribution from resistive ballooning modes near
the plasma edge. The ion temperature gradient instability involves the
quantity r]i = d In T{/d In n and is often called the ?ji-mode. In toroidal
geometry the toroidal curvature plays an important role and the
parameter Lti/R, where Lti = -(din Ti/dr)"' replaces rn iathe theory. The
shorter wavelength, electromagnetic electron drift wavelnstability which
involves the analogous quantity, rie, has also been suggested. This mode
gives the required x ~ l/« scaling for ohmic discharges.
Resistive fluid instabilities such as rippling modes, which are driven
by the resistivity gradient, and resistive ballooning modes are generally
only relevant near the plasma edge where a number of atomic processes
also come into play. Modifications of the resistive ballooning modes in
which neoclassical effects or electron inertia play a role would extend
their influence into the plasma interior. It has also been suggested that
self-sustained magnetic islands could be a cause of enhanced transport.
The principal electron drift wave instabilities arise from
trapped particle effects when the normalized collision frequency,
v*e = Vele^l'^ivje.lRq) is such that v^e<l- They typically have
<y ~ <y*e and poloidal wave number kg such that kgp^ ~ 0.3. They
are categorized as collisionless when Veff < <y^, and dissipative at high
effective collision frequency Veff > <y^, where Veff = v/e. In more colli-
sional plasmas, with v^e > 1, the mode takes the form of a collisional drift
wave driven unstable by circulating particles. There is a variety of
expressions for the associated thermal diffusivities, depending on the saturation
mechanism invoked and whether or not the mode structure depends on
toroidicity. These diffusivities have the gyro-Bohm form
Xe ~ £>gB/(v*, geometry).

4.20 Candidate modes
Fig. 4.20.1 Comparison of theoretical
values of thermal diffusivity for
trapped-electron modes with experimental
values for a JET discharge. The x scale is
logarithmic and p is the normahzed radius.
The theoretical curves are calculated from
(a) Romanelli, F., Tang, W.M., and White,
R.B. Nucl. Fusion 26, 1515 A986) and
(b) Dominguez, R.R. and Waltz, R.E. NucL
Fusion 27, 65 A987).
_
(a) z-'^'"' ~'~'~--.,
/"
~~ 7^ ■ "Experi ment
/
'
A typical expression, based on mixing-length estimates, is
2 Ve LnLTel+0.1/v,,e
where s = r/R,c^ = Te/mi,ps = c^/coa, where Cs is the isothermal
sound speed, and Ln and Lje are the characteristic scale-lengths for the
radial gradients of density and electron temperature. The form 4.20.1
encompasses the transition from the dissipative trapped-electron mode
to the collisionless mode driven by the precessional-drift resonance as
V:^e -^ 0. This model captures some features of the ohmic and L-mode
scalings but Xe has a radial profile which decreases toward the plasma
edge. A comparison of the form 4.20.1 with JET experimental results is
shown in Fig. 4.20.1.
For a sufficiently large temperature gradient the r]i mode with k±p^<l
becomes unstable. This has been offered as an explanation of the
confinement scalings for both the saturated ohmic confinement and the L-mode.
In slab geometry instability is predicted for ??i > 1 but in toroidal
geometry the criterion for instability is that the radial scale-length, Lri, for
the ion temperature is such that Lti < Lric where Luc = cR with
c — 1/6. The toroidal mode is more relevant to most tokamaks. Several
gyro-Bohm expressions for Xi have been derived, taking the form
- T^/ (geometry) // (-^
Lnc)
4.20.2
where H is the Heaviside function and / is a function of geometric
ratios. One of the forms which has been more successful in reproducing
the experimental profiles and current scalings has f oc q.A model based
on simulations of gyrofluid plasma equations for ion temperature gradient
turbulence has a structure like eqn 4.20.2.

4.20 Candidate modes
In a more collisionless plasma with the normalized collision frequency
v*i = e~^l'^v\l{vriRq) such that v^i < 1, trapped ion modes are
predicted to be unstable. An expression for the thermal diffusivity due to the
dissipative trapped ion instability is
where s = {rjq) Aq/Ar.
In addition to the electron drift waves with /cj^Ps ^ 1. there is the
electromagnetic ?je-niode with /c_l < (Ope/c, which is unstable for ??e ^ 1.
where ?je = din Tg/dlnn. An expression for the associated gyro-Bohm
thermal diffusivity in cylindrical geometry is
Xe = 0.13(— ) ^??e(l + ??e).
\C0peJ qR
Calculations for the toroidal version, the electron temperature gradient
mode, lead to a result resembling eqn 4.20.2
\<ype/ K \LTe LjecJ
Resistive ballooning modes are driven by the pressi^^ gradient in the
region of unfavourable curvature of the magnetic field. Although basically
electrostatic, the mode has a magnetic component which can lead to a
stochastic magnetic field. The resulting thermal diffusivity has the form
where ri is the Spitzer resistivity, a — —BixoRq^/B^)dp/dr, P =
IfMop/B^, and C > 10. Replacing resistivity by electron inertia leads
to a form of Xe which captures some features of the L-mode scaling. The
convective transport in this case leads to
Va ( c \^ a^l^
where Va is the Alfven speed, h{s) = 1.7 for s < 0.7 and his) = 2.5s
for 5 >0.7.
Although micro-tearing modes are generally stable in hot tokamaks
there remains the possibility of non-linear instability of magnetic islands.
The Rutherford equation for island growth, derived in Section 7.3, is
modified by various effects such as finite ion Larmor radius or bootstrap

4.20 Candidate modes
currents to take the form
dw (. X\
-dr==H^+^j-
In the case of bootstrap currents
sLn
where fi^ — 2ixop/B^. For large m numbers the outer solution to the
perturbed flux takes the form exp (— \m \x/r) where x is the distance from
theresonantsurface.Thus A' = liip-'/ip-) = —2m/r and eqn 4.20.3 gives
a saturated island width
2m ■
If islands 'overlap' the magnetic field becomes ergodic. A model based on
this behaviour was given by Rebut, Lallia, and Watkins. In this model the
condition for self-sustainment of the chaotic magnetic field leads to a
critical temperature gradient. The model is semi-empirical being constructed
from dimensionless quantities in such a way as to reproduce the ohmic and
L-mode behaviour in JET. The resulting forms of the transport coefficients
have a more complicated form than the familiar power dependencies on
the parameters. In particular the enhancement over the neoclassical values
is 'switched on' when the electron temperature gradient exceeds a critical
value and dq/dr > 0.
This is illustrated by the radial electron heat flux which takes the form
qe = qe,neo ~ «eXRLW
dTe /dTA \ „/ldre| l/d^e^
')>
\dr \dr )^) \| dr | | V, dr y
where H is the Heaviside function
XRLW = 0.5c' vH-U-i r^^ y^
^^ (l/re)(dre/dr) + B/ne)(dne/dr)
{llq^){dqldr)
and the critical temperature gradient is
|/dre\ \ ^^ e I ( njB^ \'^^
vdr
{^omi^y
where rj is the Spitzer resistivity. In addition to the critical temperature
gradient the model predicts neoclassical transport when dq/dr is reversed
in sign from its normal positive value.
An opportunity to test transport models is afforded by the International
Profile Database.

4.21 Turbulence simulations, critical gradients, andtemperature pedestals
217
Attempts to explain the transport barriers which appear in H-mode or
internal transport barrier plasmas have generally relied on a reduction of
the turbulence by shear in the plasma flow or the associated electric field
as discussed in Section 4.19. When T = wsTd > 1, where cos = kgVgA
and ty) — A^/D the turbulence is expected to be reduced. Here A is the
radial width of a fluctuation and D the turbulent diffusion coefficient so
that Td is the time for turbulent diffusion across A. Vg is the radial shear
in the poloidal flow and kg the poloidal wavenumber so that (Os is the
width of Doppler shifts across A.
Turbulence simulations, critical gradients, and
temperature pedestals
Analytic estimates of turbulent transport, as described in Section 4.18,
are of uncertain validity, so it is important to perform 'first-principles'
numerical simulations of plasma turbulence in a tokamak. This approach
solves the governing equations for a given plasma model without
approximation. Three main models have been studied: one utilizes the Braginskii
collisional fluid equations, one a full gyrokinetic description of the plasma
and one a simpler so-called gyrofluid model.
The first model has been applied to the edge regions of the tokamak,
where simulations of electromagnetic resistive ballooning modes have
shown that the resulting turbulence is reduced by finite p a|id diamagnetic
effects. This has led to a theory for the L-H transition, f he gyrokinetic
and gyrofluid models have been applied to temperature gradient
turbulence and have cast light on transport processes in the main plasma core.
The seminal gyrofluid study of rj^, or ion temperature gradient,
turbulence led to an analytic parameterization of the numerical results, known
as the IFS-PPPL model. This model produces high transport once the
linear stability criterion is violated. Since this criterion is the form of a
critical ion temperature gradient length Rd(inTi)/dr > c, where c is a
constant (c ~ 6), such a model tends to force the Ti profile to lie near this
marginally stable profile—Whence it is known as a critical gradient model.
This model provides a good description of L-mode discharges in TFTR,
but is less convincing for H-modes.
However, there is considerable experimental evidence that tokamaks
exhibit cntical gradient characteristics, the temperature profiles being
resilient to changes from the critical gradient profile, a property known
as 'stiffness'. In particular, a critical gradient model predicts a strong link
of both the central temperature and energy content and the temperature at
the edge of the plasma as is shown in Fig. 4.21.1. This edge temperature
is taken to be the temperature at the inner side of the H-mode transport
barrier, known as the pedestal temperature, Tpgd. This linkage means
high values of Tped are important for tokamak performance. A common

4.21 Turbulence simulations, critical gradients, and temperature pedestals
Fig. 4.21.1 Profile stiffness in ASDEX
Upgrade. The central electron temperature
is plotted against the boundary temperature
measured 2 cm inside the plasma edge,
Te(a-2 cm), showing how these are
proportional if the edge pressure gradient
is near the ballooning limit. It can be seen
that this is the case for Type I ELMs. Type
III ELMs do not follow this
proportionality. (Suttrop, W. et al. Plasma
Physics and Controlled Fusion 39, 2051
A997).)
+
1
Type
Type
I ELMs
III ELMs
+ +
*^+
^P''
n
++
++
estimate for Tpgd is based on the assumption that the good confinement in
the H-mode bamer allows the pressure gradient to reach the limit imposed
byidealmhdballooningstability,a = -2/Ao(^?^/-B^)(dp/dr) = CKcrit ~
0( 1). If the barrier width A is known then Tped can be calculated. There is
experimental evidence and plausible theoretical arguments that A scales
as a hybrid of the ion poloidal Larmor radius, p,6i, and the tokamak
major radius, R. For example, if A <x pig, a. scaling for Tped can be
developed:
rpeda(i?/a)(fiV«'^V)-
When a > cKcnt, ELMs are triggered.
The gyrofluid simulations were followed by more basic gyrokinetic
calculations and differences between the predictions of the two models
led to a deeper understanding of the non-linear saturation mechanisms
involved. In the gyrokinetic model the ion temperature gradient
instabilities first develop as radially elongated structures known as streamers.
However, a secondary non-linear Kelvin-Helmholtz instability breaks
these up into more isotropic eddies and microscale poloidal flows
known as zonal flows build up. These zonal flows limit the growth
of the turbulence in much the same way as the equilibrium sheared
flows discussed in Section 4.19 lead to lower transport. As a result
the critical gradient for ion temperature gradient modes is increased
from its linear value, an effect known as the 'Dimits upshift'. In
the less accurate gyrofluid model the growth of these zonal flows is
impeded and the transport remains high. Nevertheless there is a
damping of zonal flows by parallel neoclassical viscosity in a torus and
this introduces a collisionality dependence in the gyrokinetic
simulations of transport coefficients similar to that observed experimentally.
Figure 4.21.2 shows an example of the turbulence calculated by a
simulation code.

4.22 Impurity transport
Fig. 4.21.2 Turbulence simulations with
a gyrokinetic code, the turbulence evolving
in time from left to nght The behaviour
with sheared flow is shown in the upper
panel, the initial hnear, radially extended
structures being broken up by the flow The
lower panel shows the behaviour without
sheared flow and the extended structures
are seen to persist into the non-linear
regime (Lin,Z and Tang, WM Physics of
Plasmas 9, IS56 B002))
Experimental investigations of electron thermal transport in
nonmonotonic q profiles show that it often remains high. A candidate mode to
explain electron transport is the electron temperature gradient instability.
Electromagnetic gyrokinetic simulations of this turbulence show that
radial streamers again develop but in contrast to the case of the ion
temperature gradient mode, they persist. Since this ipplies k, <C kg
the transport is much greater than the mixing-length estimate based
on eqn 4.18.18 for isotropic turbulence with kr ~ /eg- However, for
small or negative magnetic shear and large values of the normalized
pressure gradient, a, the streamer can be inhibited and low electron
transport ensues. This provides an explanation of the experimental
observations.
Impurity transport
The presence of impurities can dilute the fuel ions in a reacting plasma
and enhance radiation losses, both effects impairing the performance of
a tokamak reactor. Impurities arise from the solid surfaces and, through
transport processes, can penetrate to the central plasma. Another
serious source is the helium 'ash' necessarily produced by the fusion reactions
themselves. The requirement that the fraction of helium ash remains
acceptable (<10%) can only be met if the outward transport of helium
is sufficiently rapid.

4.22 Impurity transport
A discussion of impurity transport involves consideration of both
neoclassical and anomalous processes since experiments show evidence
of both effects.
The neoclassical theory of impurity transport, although exceedingly
complex for an arbitrary number of species, is highly developed. For
simplicity, however, the discussion here will be restricted to one charge
state of one impurity species.
The distinctive feature of neoclassical impurity particle transport
follows from the relation 4.6.11 between fluxes and momentum exchange.
Since the collision frequency of ions with impurities can greatly exceed
that for ions with electrons, such collisions can induce a
correspondingly greater impurity flux and an oppositely directed ion flux. This will
modify the impurity density profile until the frictional forces vanish. The
condition for this is
1 dn^ Z dn, a dT
where n^ is the density of an impurity species of charge Z, «i is the
plasma ion density and the coefficient a depends on the details of the
thermal force. In the absence of the thermal force, eqn 4.22.1 implies
a concentration of impurities towards the magnetic axis according to
the relation
nzjr) ^ (n,ir)Y
nz@) Ui@)y
This relation has potentially serious implications for radiation losses from
impurities and for the removal of helium ash resulting from fusion
reactions. However, these problems may be reduced if the coefficient a in
eqn 4.22.1 is negative, an effect known as 'temperature screening'. The
sign of a depends on the collisional regimes of both plasma ions and
impurities.
Impurities are heavier and more highly charged than the plasma ions
and hence will tend to lie in the Pfirsch-Schliiter regime. Consequently
there is generally no banana-plateau contribution to the impurity
diffusion. The so-called principle of detailed balance states that the
contributions from banana-plateau and from Pfirsch-Schliiter particle
transport are separately ambipolar. Thus the plasma ion transport due to
collisions with impurities will be charactenstic of the Pfirsch-Schliiter
regime since the impurities experience only Pfirsch-Schliiter
transport. However, it is still necessary to consider subdivisions of the
Pfirsch-Schliiter regime.
The first of these, called the intermediate Pfirsch-Schliiter regime,
arises when collisions are insufficient to make the plasma ion distribution
Maxwellian. Normally this only applies when the plasma ions are in the
banana-plateau regime. In an impure plasma the time for the plasma ion
distribution to relax to a Maxwellian can exceed the 90° collision time,
and so this situation arises even in the Pfirsch-Schliiter regime. Detailed

Tipurity transport
Fig. 4.22.1 Predicted neoclassical
impurity fluxes near plasma edge, showing
impurity accumulation
Intermediate
Pfirsch-Schluter
regime
Extreme
Pfirsch-Schluter
regime
impunties impurities\
screened I flow in
from centre [
calculations show that temperature screening occurs in the
intermediate Pfirsch-Schluter regime. When collisions are sufficient to maintain a
Maxwellian distribution of the plasma ions, as is usually the case near the
edge of the plasma, the conventional fluid (or extreme Pfirsch-Schluter)
description is appropriate and it is found that temperature screening
disappears. Figure 4.22.1 indicates the consequences for the radial impurity
distribution.
The full neoclassical theory has been implemented in transport codes,
allowing for a large number of impurity species and charge states in
these various regimes. Experimental situations occur in which
impurity transport exhibits these neoclassical features but, more commonly,
impurities appear to experience anomalous transport similar to that
characteristic of the background plasma. Unfortunately no adequate theory
of this anomalous transport exists but surprisingly a simple universal
empirical formula appears to satisfactorily model many situations. F^,
the radial particle flux averaged over a magnetic surface, is given by the
formula
-DA
(An,
''-+2S-,nA
with
D^ = 0.25-6 m^s-', S = 0.5-2,
4.22.2
and has been used in most transport codes. It contains a
diffusion coefficient D^ and an inward velocity similar to that
commonly used to model the anomalous particle fluxes of the background
plasma.
Detailed experimental studies of the transport of trace impurities
injected into tokamak plasmas have been carried out. In the core of the
plasma the transport of impurities is very slow in the absence of sawtooth
activity. Experiments in JET show that typically D^ ~ 0.1 m^ s~'. This is
an order of magnitude lower than its value further out, but is still greater

4.22 Impurity transport
Fig. 4.22.2 Expenmental profile of the
dififusion coefficient for injected nickel in a
JET discharge The bars indicate the range
of uncertainty.
Fig. 4.22.3 Companson of carbon
diffusivity and neoclassical prediction fo
an enhanced reversed shear plasma in
TFTR. (Efthimion, PC et al. Nuclear
Fusion 39, 1905A999))
0 2 0 3 0.4 0.5 0 6 0 7
Normalized radius (rfa)
than the neoclassical predictions by a factor 2 to 10. In fact D^ appears
to undergo a rapid transition at a particular radius, possibly characterized
by a value of the shear parameter, 5 = (r/q)dq/dr, of around 0.5. This
behaviour is shown in Fig. 4.22.2. Furthermore D^ increases markedly
with the temperature gradient in this outer region. However, impurity
transport in non-monotonic q profiles can be described by
neoclassical theory, as shown in Fig. 4.22.3. The diffusivity of helium, significant
for the build up of helium ash which dilutes the fuel in a burning plasma,
is comparable to Xefif for L and H-mode plasmas (see Fig. 4.22.4 from
Din-D).
Sawtooth activity in the core is efficient in removing impurities from
that region, while ELM activity at the edge can prevent them entering the
plasma and accumulating at the centre in the H-mode.

4.23 Experimental discoveries
Fig. 4.22.4 Companson between the
helium diffusivity Dne and the effective
thermal diffusivity, XeS, m DIII-D for
L-mode and ELMy H-mode (ITER
Physics Basis, Nuclear Fusion 39, 2175
A999))
2.0
1.5
1.0
0.5
0
L-mode
u
i^
f
^dI
4,23 Experimental discoveries
While most attention has been paid to the global confinement and
general transport properties of tokamaks there have been several
specific experimental results which, because surprising, are worthy of study.
Examination of the underlying behaviour in these cases should provide
clues to the understanding of the complex nature of transport in tokamaks.
Three examples are described below.
The X-event and power switch-off experiment
The X-event. Figure 4.23.1 shows the time development of the total
plasma energy, W, in a particular type of JET discharge with neutral beam
heating. The characterizing feature of the behaviour is the sudden change
in dW/dt from being strongly positive to strongly negative. Because of
the problems in understanding this sudden transition it has been called
the X-event.

4.23 Experimental discoveries
Fig. 4.23.1 Time dependence of the
plasma energy m a heated plasma,
implying abrupt changes in confinement at
the X-event and power switch-off
(Wesson, J A and Balet, B , Physical
Review Letters 77, 5214 A996))
There is always an obvious immediate cause of the X-event in the form
of a sawtooth collapse, an ELM, or both. However, these phenomena
are very brief and cannot provide an explanation for the very different
behaviour of W immediately before and after the X-event when the gross
configuration of the plasma is the same.
The power balance equation is
W =
W
4.23.1
where P is the heating power, and the energy loss is characterized by the
confinement time r. Rearranging eqn 4.23.1 gives an expression for the
confinement time
P-W
In the example of Fig. 4.23.1 the power is 18 MW and considering
times immediately before and after the X-event, W = 8 MW before
and —11 MW after. Equation 4.23.2 gives the ratio of the confinement
times ti before and tj after to be
= 2.9.
Since the profiles of the temperature and density are essentially the same
before and after the X-event this result shows that for plasmas of this type
the confinement properties cannot be expressed as a simple function of
these variables.
The switch-off. Even more surprising is the behaviour when the heating
beams are switched off some time after the X-event. From eqn 4.23.1 it
is expected that the negative slope of W will increase by P, in this case
18 MW, but as seen from Fig. 4.23.1 there is no significant change in the
slope. Before the switch-off
W

4.23 Experimental discoveries
tb
For the present case this gives a ratio of confinement times of
approximately 3. Since the plasma configuration is essentially the same before
and after switch-off it is again difficult to understand the change in
confinement. The simple explanation that the beams were inadvertently
switched off at the X-event is not available since the beams are detected
directly by charge exchange measurements up to the switch-off.
These results seem to imply that the heat transport and confinement
are not single valued functions of the macroscopic plasma properties.
The L-H transition
As described in Section 4.13 it is found that with increased heating there
is a transition to H-mode confinement. This is marked by the formation
of large gradients in temperature and density at the edge of the plasma.
The fact that large differences in these quantities are sustained over a
narrow region implies that the improved confinement can be attributed to
a transport barrier formed at the edge of the plasma. Theoretical efforts
to provide an explanation of H-modes have concentrated o^ trying to find
a bifurcation between states with and without this barrier.
A study of the phenomenon in JET showed a quite different behaviour.
Cases were found in which at the onset of the H-mode an immediate
change in the behaviour occurred, not only at the edge but across the outer
half of the plasma radius. Figure 4.23.2 shows the time dependence of
Fig. 4.23.2 The fall in the 0„ signal
marks the onset of the H-mode The
electron temperature undergoes an increase
in slope simultaneously over a large part of
the radius The radius r is normalized to
the radius of the plasma (Neudatchin,
S v., Cordey, J.G , and Muir, D G Proc
20th E PS Conf. on Controlled Fusion
and Plasma Physics, Lisbon 1993,
Vol 17CPartI,p 83)

4.23 Experimental discoveries
the electron temperature at several positions across the plasma radius. It
is clear that this behaviour is not just due to the formation of a barrier
at the edge of the plasma. Had this been the case the plasma away from
the edge would have shown a delayed response over a longer timescale.
The almost simultaneous change in the rate of temperature increase over
the outer half of the plasma obviously calls for a different explanation.
One possibility is that the conductivity is not determined locally. This
might be the case, for example, if the anomalous transport is due to
radially elongated convective cells.
Narrow transitions
The temperature gradients associated with internal transport barriers are
described in Section 4.14. A remarkable feature of the observed gradients
is the narrowness of the transition to the steep gradient. Since the thermal
conductivity /c = —q/(dT/dr) where q is the heat flux, this sudden radial
transition implies that the thermal conductivity changes over a very short
distance. This is illustrated in Fig. 4.23.3(a) which gives the result of
Fig. 4.23.3 (a) Electron temperature
profile m a TFTR plasma with an internal
transport bamer. (b) Graph of
-l/(rdT/dr) denved from the
temperature profile, implying a large
change in thermal conductivity over a short
distance (From Bell, M G. et al Plasma
Physics and Controlled Fusion 41, A719
A999))

4.24 Radiation losses 227
an electron temperature measurement in TFTR in which a reliable
continuous plot of temperature was obtained by moving the plasma across
the line of sight of the detector channels.
Over short distances the total heat flux Q across magnetic surfaces
is almost constant. Since Q oc rq, a. good estimate of the local radial
variation of the thermal conductivity is obtained from ze a l/(rdr/dr).
Figure 4.23.3(b) gives a graph of —l/(rdr/dr) carefully derived from
Fig. 4.23.3(a). It is seen that there is an order of magnitude change and
at its steepest the graph implies a factor of 2 change in k over 1 cm.
This result provides a challenging test for any theory of transport across
internal barriers.
Radiation losses
A pure hydrogen plasma emits electromagnetic radiation.
Microscopically this is due to the acceleration of the charged particles. Because of
their lighter mass the electrons undergo larger acceleration than the ions.
Consequently they radiate much more strongly and only the electrons
need be considered.
The electrons are accelerated in two ways. Firstly they are
accelerated by collisions, the resulting radiation being called bremsstrahlung.
Secondly they are subject to the acceleration oF their cyclotron
motion and the associated radiation is called cyclotron or synchrotron
radiation.
In the presence of impurities the bremsstrahlung is enhanced. There
are also further losses due to the atomic processes of line radiation and
recombination radiation. These losses are described in Section 4.25.
Bremsstrahlung
The power radiated by an electron undergoing an acceleration a is
The acceleration of an electron during a collision with an ion is caused
by the Coulomb force Ze^/4nEor^, where r is their separation and Ze
the charge on the ion, and so
Aneomei

4.24 Radiation losses
Taking the duration of a collision to be 2r/u, the energy lost per collision
is 8E = Plrjv and eqns 4.24.1 and 4.24.2 give
(i{ln Ef^cr)^ m\v
Thus, integrating over the impact parameter i
radiation power per unit volume is given by
the bremssti'ahlung
■Pbr = ne.ni I SEvlnrdr
lAn^e}
The integral is 1/r but the divergence at small r is removed by quantum
mechanical effects so that the lower Hmit of r is h/nieV. Using this limit
in 1/r and replacing v by its average value from 1/2 mgW^ = 3/2 Tg,
eqn 4.24.3 gives the required form for Pbr- Substituting the numerical
factor obtained from a full calculation then gives the bremsstrahlung
power due to ions of charge Z as
' 6C/2)l/2;r3/2e3c3/j^3/2 ^ z e ,
where g is the Gaunt factor which gives a quantum mechanical correction.
Under the conditions of interest g ~ 2\/3/7r and
Pbr = 5.35 X 10-"z2«e«z7;'^^ Wm"^ T^ in keV.
Figure 4.24.1 gives the ratio of the bremsstrahlung power in a pure
D-T plasma to the thermonuclear power produced in a-particles, as given
by eqn 1.4.6. This shows that although bremsstrahlung is a significant
Fig. 4.24.1 Ratio of power radiated in
bremsstrahlung to the thermonuclear
power produced in a-particles for a D-T
plasma with T, = Te

4.25 Impurity radiation 229
loss mechanism it does not present a serious obstacle to ignition in a pure
D-T plasma.
Cyclotron radiation
The theory of cyclotron radiation losses is quite complex, involving
emission and absorption at harmonics of the cyclotron frequency in
spatially varying plasma and magnetic field. However, the basic elements
can be simply described.
The power radiated from a single non-relativistic electron is given by
eqn 4.24.1 with the acceleration of the cyclotron orbit, a = (o^Pe- Putting
Pe = Bre/me)'^^/<yce would then give a radiation power density
Pc = (e'^/37tsomlc^)B^neTe.
This power is very large and under reactor conditions would be more
than 1 MWm~^. However, this is not, the power lost from the plasma
because the plasma is optically thick to radiation at the fundamental
frequency. The principal energy loss occurs at the harmonics of the
cyclotron frequency, these harmonics being generated through relativis-
tic effects. The power in each harmonic falls rapidly with increasing
harmonic number n, being proportional to (u^g/c^)"~'. However, like
the fundamental, lower harmonics are absorbed and the plasma behaves
like a black body for these frequencies, radiating according to the
Rayleigh-Jeans law. Most of the power loss occurs,^4herefore, in
the harmonics at the transition from optically thick to optically thin
behaviour. The resulting power loss is only lO^^-lO"^ of the power
given above for the fundamental without absorption. In a reactor this
power loss would be of the order of 10~^ MWm"^ and would therefore
be negligible.
4.25 Impurity radiation
The presence of impurities in the plasma produces energy losses through
radiation. There are two types of process involved. The first is the
enhancement of bremsstrahlung because of the higher value of the ionic
charge for impurities. The second is the radiation which occurs through
the atomic processes of line radiation and recombination.
In a steady state with negligible transport effects (coronal equilibrium),
the power radiated from a given impurity species is proportional to the
electron density n^ and to the impurity density «i, and the radiated power

4.25 Impurity radiation
Fig. 4.25.1 (a) The radiation parameter
R and (b) the mean charge Z as functions
of elearon temperature for carbon,
oxygen, iron, and tungsten
:(a)
xSrungsten
1 \ Iron -
\ / \^P''y8^3-<^
Carbon
1 10 100 1 10 100
eV eV eV IceV IceV IceV
density may be written
Pr = n^niR, 4.25.1
where the radiation parameter i? is a function of the electron temperature.
Graphs of RiJe) are given in Fig. 4.25.1 for a number of elements.
The R{Te) curves have a principal maximum together with subsidiary
maxima at higher temperatures. For light impurities the principal
maximum occurs at a low temperature and above this temperature the radiation
is substantially reduced. As the temperature is increased, electrons are
successively removed from the impurity ions and when the ions are fully
stripped only bremsstrahlung radiation remains. In a reactor low Z atoms
would be fully stripped. At a particular temperature a given impurity
species will have a distribution of charge states Z. A mean value Z, can
be defined by
Z = 2_]n^Z/ni where «i = /^n^,
n^ being the density of ions in the charge state Z. Some graphs of Z{Te)
are given in Fig. 4.25.1.
For low Z impurities such as carbon and oxygen the maximum
radiation occurs at a very low temperature, of the order of tens of
eV. The ions of these impurities are fully stripped at a temperature
of 1 keV and in the hot plasma of a reactor they would only radiate
through bremsstrahlung. At the plasma edge radiation losses arise from
the incompletely stripped impurities which enter the plasma as neutral
atoms.
For high Z impurities, and these include the metals of which the
tokamak is constructed, the first maximum in radiated power occurs at a
somewhat higher temperature. For temperatures above 100 eV the
radiation per ion is much greater than for low Z impurities. Even at reactor
temperatures these ions are not fully stripped and the radiated power is
such that the level of high Z impurities must be very small in a reactor.
A quantitative assessment of the required impurity levels can be
obtained by calculating the radiated power for a particular impurity as

Fig. 4.25.2 Fractional impunty level
which produces a radiation power equal tc
10% of the total thermonuclear power
= .He
•Li
.Be
=^ .B
E C-.N
: O-.F
Ne'J^a
Mg.Al
: Sl'..Cl
••!/>
/'7
NiZn
' ' :
:
Mo
•-.../ Ag E
Sn*"
20 30
Atomic number
a fraction, F, of the thermonuclear power given by eqn 1.4.2
{l + fZ)fR
Uav)£
where «h is the total density of hydrogenic ions (deuterons plus tritons),
/ is the impurity fraction «i/«h and £ = 17.6 MeV. Figure 4.25.2 gives
the values of / which would produce a radiated power fraption F = 0.1
at T = 10 keV. This corresponds to a radiated power loss of 50 per cent
of the a-particle power.
A further problem arising from impurities in a reactor is that, for a
given total particle density, there is a displacement of reacting ions by the
large number of electrons produced by the impurities.
Bibliography
A book which provides insights into the physics is
Itoh, K., Itoh, S.-L, and Fukuyama, A. Transport and
structural formation in plasmas. Institute of Physics
Publishing, Bristol A999).
The theory of purely collisional transport is descnbed in
Helander, P. andSigmar, D.J. Collisional transport inmag-
netized plasmas Cambridge University Press, Cambridge
B002),
and a further theoretical account is given by
Hazeltine, R D and Meiss, J D Plasma confinement,
Addison-Wesley, Redwood City, California A991)
General review of transport
A summary of theoretical and experimental research on
tokamak confinement can be found in
ITER Physics Expert Groups on Confinement and Transport
and Confinement Modelling and Databases. ITER Physics
Basis, Chapter 2: Plasma confinement and transport.
Nuclear Fusion 39, 2175 A999).
Expenmental results have been reviewed by
Hugill, J. Transport in tokamaks—a review of experiment.
Nuclear Fusion 23, 331 A983).

232
Bibliography
and discussed by
Wagner, F and Stroth U Transport in toroidal devices—
the expenmentalist's view Plasma Physics and Controlled
Fusion 35, 1321 A993)
Measurements and theories of anomalous transport are
discussed by
Liewer, P C. Measurements of micro-turbulence in tokamaks
and comparisons with theones of turbulence and
anomalous transport Nuclear Fusion 25, 543 A985)
Reviews of neoclassical theory can be found in
Hinton, FL and Hazeltine, R.D Theory of plasma transport
Reviews of Modem Physics 48, 239 A976), and
Galeev, A.A and Sagdeev, R Z Theory of
neoclassical diffusion In Reviews of plasma physics (ed.
Leontovich, M.A) Vol 7, p 257 Consultants Bureau,
New York A979)
Neoclassical transport
The onginal paper on Pfirsch-Schluter transport is
Pfirsch, D and Schluter, A Der Einfluss der eleck-
tnschen Leitfahigkeit auf das Gleichgewichtsverhalten
von Plasmen niedngen Drucks in Stellaratoren Max-
Planck-Institut, Report MPI/PA/7/62 A962);
and on banana-plateau transport is
Galeev, A A. and Sagdeev, R.Z Transport phenomena in
a collisionless plasma in a toroidal magnetic system.
Zhumal Experimentalnoi i Teoreticheskoi Fiziki 53, 348
A967) [Soviet Physics JETP 26, 233 A968)]
Pfirsch-Schluter transport
Treatments can be found in
Solovev, L.S. and Shafranov, V.D. Effects of curvature on
classical diffusion and thermal conductivity Reviews of
plasma physics (ed. Leontovich, MA.) Vol. 5, p 145
Consultants Bureau, New York A970), and
Hazeltine, R D. andHinton, FL. Collision dominated plasma
transport in toroidal confinement systems Physics of
Fluids 16, 1883A973)
Banana regime transport
A heunstic discussion can be found in
Kadomtsev B.B. and Pogutse, OP. Trapped particles in
toroidal magneuc systems. Nuclear Fusion 11, 67 A971)
The complete vanational solution for the fluxes is obtained in
Rosenbluth, M.N., Hazeltine, R.D , and Hinton, FL. Plasma
transport in toroidal confinement systems Physics of
Fluids 15, 116 A912).
A clear denvation of the essential results (including plateau
and Pfirsch-Schluter diffusion) is given by
Rutherford, PH Colhsional diffusion in an axisymmetnc
torus Physics of Fluids 13, 482 A970)
Expressions for ion neoclassical conductivity in a finite
aspect-ratio torus, also valid for all collisionality regimes, are
given in
Chang, C S. and Hinton, FL Effect of impunty particles
on the finite aspect-ratio neoclassical ion thermal
conductivity in a tokamak Physics of Fluids 29, 3314
A986)
Plateau transport
The complete results are denved in
Galeev, A A Diffusion-electncal phenomena in a plasma
confined in a tokamak machine Zhumal
Experimentalnoi i Teoreticheskoi Fiziki 59, 1378 A970) [Soviet Physics
JETP 32,152 A971)]
The transition between banana and plateau transport is
investigated in
Hinton, FL and Rosenbluth, M.N Transport properties
of a toroidal plasma at low-to-intermediate colhsion
frequencies Physics of Fluids 16, 836 A973).
Ware pinch effect, bootstrap current, and
neoclassical resistivity
These effects are all implied in the complete banana-plateau
transport theory, references given above, but seminal and
interesting papers are
Ware, A.A. Pinch effect for trapped particles in a tokamak
Physical Review Letters 25, 15 A970).
Bickerton, RJ Connor, J.W, and Taylor, J B. Diffusion
dnven plasma currents and bootsti'ap tokamak. Nature
Physical Science, 229, 110 A971)
Hinton, FL, and Oberman, C Electncal conductivity
of plasma in a spatially inhomogeneous magnetic field
Nuclear Fusion 9, 319 A969)
The effects of finite aspect-ratio on the bootstrap current are
to be found in
Hirshman, S P Finite-aspect-ratio effects on the
bootstrap current in tokamaks Physics of Fluids 31, 3150
A988),
and the subject of bootstrap currents is reviewed in
Kikuchi, M and Azumi, M. Expenmental evidence for
the bootstrap current in a tokamak. Plasma Physics and
Contmlled Fusion 37, 1215 A995)
Tight aspect-ratio effects on neoclassical conductivity are
discussed in
Hazelune, R.D , Hinton, FL and Rosenbluth, M N Plasma
transport in a torus of arbitrary aspect ratio. Physics of
Fluids 16, 1645 A973), and

Bibliography
233
Hirshman, S.P., Hawryluk, R.J. and Birge, B. Neoclassical
conductivity of a tokamak plasma Nuclear Fusion 17, 611
A977).
Ripple transport
This has been discussed in detail in the review by
Kovnzhnykh, L.M Neoclassical theory of transport
processes in toroidal magnetic confinement systems, with
emphasis on non-axisymmetnc configurations Nuclear
Fusion 2A,^5\ A984)
Ripple trapped transport is descnbed in
Stnnger, T.E. Effect of the magnetic field npple on diffusion
in tokamaks Nuclear Fusion 12, 689 A972)
An account of npple plateau transport can be found in
Boozer, A H Enhanced transport in tokamaks due to toroidal
npple Physics of Fluids 23, 2283 A980)
A good account of banana drift transport is included in
Goldston, R.J. and Towner, H.H. Effects of toroidal field
npple on suprathermal ions in tokamak plasmas Journal of
Plasma Physics 26, 283 A981).
A more recent review is
Yushmanov, PN Diffusive transport processes caused by
npple in tokamaks Reviews of plasma physics (ed
Kadomtsev, B B ) Vol 16, p. 117, Consultants Bureau,
New York A990)
Confinement modes
A descnption of different modes of energy confinement is
given in
Stambaugh, R D ef al. Enhanced confinement in tokamaks.
Physics of Fluids B2, 2941 A990)
The H-mode was first observed in the ASDEX tokamak.
Wagner, F et al. Regime of improved confinement and high
beta in neutral beam heated divertor discharges in the
Asdex tokamak Physics Review Letters 49, 1408 A982)
Further information can be found in the overviews amongst
the papers for the 4th H-mode Workshop (LA E A.
Technical Committee Meeting on H-mode Physics), Naka, Japan,
November 1993, ^ubhshed'mPlasmaPhysicsandControlled
Fusion 36, pp. A3-A74 A994)
Information on non-monotonic q profile configurations can
be found in
Levinton, FM., Zamstorff, M C, Bartha, S.H , Bell, M,
Bell, R.E , Budny, R V, Bush, C , Chang, Z , Frednckson,
E , Jones, A et al. Improved confinement with reversed
shear in TFTR Physical Review Letters 75, 4417 A995).
Connor, J W, Bracco, G., Buttery, R J , Hidalgo, C , Jacchia,
A., Peeters, A.G., and Stroth, U. EU-US Transport Task
Force Workshop on Transport in Fusion Plasmas,
Transport Barrier Physics Plasma Physics and Controlled
Fm«o« 43, 355B001).
Synakowski, E.J Formation and structure of internal and
edge transport bamers. Plasma Physics and Controlled
FMiio«40, 581 A998)
A review of expenmental data on the L-H transition is given
in
Carlstrom, T.N Transition physics and scaling overview
Plasma Physics and Controlled Fusion 38, 1149 A996).
while theones of the transition are reviewed in
Connor, J.W and Wilson, H R A review of theones of the
L-H transition Plasma Physics and Controlled Fusion 42,
Rl B000).
Scaling relations for energy confinement
An early review of expenmental results was given by
Goldston, R.J Energy confinement scaling in tokamaks.
some implications of recent expenments with ohmic and
strong auxiliary heating Plasma Physics and Controlled
Fusion 26, No 1 A, 87A984).
and more recently by
Kaye, S M. et al Status of global energy confinement
studies. Physics of Fluids B2, 2926 A990).
A compilation of scalings for the energy confinement and
L-H power threshold is in
Thomson, K., Bracco, G, Bush, C, Carlstrom, TN,
Chudnovskij, A.N., Cordey, J G., Deboo, J C, Fielding,
S.J., Fukuda, T., Greenwald, M. et al Latest results from
the ITER H-mode confinement and th^shold databases
Fusion energy (Proc. 17th Int. Conf., Yokohama 1998)
Vol 3,p 987 LA E.A.Vienna A999).
Scaling relations for L- and H- mode confinement have been
given by
Kaye, S. and the ITER Joint Central Team and Home Team
Projection of ITER performance using the multi-machine
L and H mode databases Plasma physics and controlled
nuclear fusion research (Proc 15 th Int. Conf. Seville,
1994) Vol. 2, p 525 I.A.E A. Vienna A995).
A theoretical framework for discussing the empirical laws
can be found in
Kadomtsev, B.B Tokamaks and dimensional analysis. Fiziky
Plasmyl, 531 A975) [Soviet Physics—Journal of Plasma
Physics 1,295 A915),
and
Connor, J.W and Taylor, J B Scaling laws for plasma
confinement Nuclear Fusion 17, 1047A977).
Experimental observations on transport
coefficients and fluctuations
The correlations between fluctuations and local transport
coefficients are discussed in the review by

234
Bibliography
Wootton, A J. et al. Fluctuations and anomalous transport in
tokamaks. Physics of Fluids B2, 2879 A990)
and the papers
Connor, J.W Tokamak turbulence—electrostatic or
magnetic? Plasma Physics and Controlled Fusion 35, B293
A993)
Bickerton, R J. Magnetic turbulence and the transport of
energy and particles in tokamaks. Plasma Physics and
Contmlled Fusion 39, 339 A979)
Some expenmental results on thermal diffusivities are
discussed in
Perkins, F.W et al Nondimensional transport scaling in the
Tokamak Fusion Test Reactor- Is tokamak transport Bohm
or gyro-Bohm? Physics of Fluids B5, 477 A993)
An example of a study of particle transport is given in
Behnnger, K , Engelhardt, W., Fussman, G et al. in Proc
IAEA Technical Committee on Divertors and Impurity
Control, Max Planck Inst, fiir Plasma-physik, Garching,
42A981)
The effect of transport bamer on fluctuation is descnbed in
Mazzucato, E , Batha, S.H , Beer, M , Bell, M., Bell, R.E,
Budny, R.V., Bush, C, Hahm, TS, Hammett, GW.,
Levinton, FM., Nazikian, R. et al. Turbulent fluctuations
in TFTR configurations with reversed magnetic shear
Physical Review Letters 77, 3145 A996)
Connor, J.W. and Wilson, H.R. Survey of theories of
anomalous transport. Plasma Physics and Controlled Fusion 36,
719A994)
The Rebut, Lallia, Watkins model was first descnbed in
Rebut, PH, Lallia, PP, and Watkins, M.L. Electron heat
transport in tokamaks Plasma Physics and Controlled
Fusion 11DA), 172A987)
Simulations of edge turbulence can be found in
Rogers, B N and Drake, J.F Enhancement of turbulence by
magnetic fluctuations. Physical Review Letters 79, 229
A997),
and simulations of ITG turbulence are reported in
Dimits, AM., Bateman, GA, Beer, MA., Cohen, B.I.,
Dorland, W, Hammett, G W et al. Comparisons and
physics basis of tokamak transport models and turbulence
simulations. Physics of Plasmas 7, 969 B000)
and
Lin, Z , Hahm, T S , Lee, WW, Tang, W.M , and White,
R B Gyrokinetic simulations in general geometry and
applications to collisional damping of zonal flows. Physics
of Plasmas 7, U51 B000)
with ETG simulations in
Jenko, F, Dorland, W, Kotschenreuther, M, and Rogers,
B N Electron temperature gradient dnven turbulence
Physics of Plasmas 7, 1909 B000).
These papers discuss zonal flows, cntical gradients and
Theories of anomalous transport
Some of the pnnciples are discussed in Chapter 4 of
Kadomtsev, B.B Plasma turbulence Academic Press,
London A965),
and in
Horton, W Nonlinear drift waves and transport in
magnetized plasma Physics Reports 192, 1 A990).
The effects of stochastic magnetic fields on transport are
addressed by
Rechester, A.B. and Rosenbluth, M.N Electron heat
transport in a tokamak with destroyed magnetic surfaces.
Physical Review Letters 40, 38 A978),
and in more depth by
Krommes, J A. Oberman, C , and Kleva, R G. Plasma
transport in stochastic magnetic fields Part 3, Kinetics of
test particle diffusion Journal of Plasma Physics 30, 11
A983).
The apphcations to a number of specific instabilities can be
found in
Kadomtsev, B B and Pogutse, O P Turbulence in toroidal
systems. Reviews of plasma physics (ed. Leontovich,
M A.) Vol. 5, Chap. 2. Consultants Bureau, New York
A970)
and the review by
Comparison of theory and experiment
A comparison of a theory of stochastic magnetic transport
with the ISX-B expenment is described in
Carreras, B A , Diamond, PH., Murakami, M., Dunlap, J.L.
et al Transport effects induced by resistive
ballooning modes and companson with high-/3p ISX-B tokamak
confinement. Physical Review Letters 50, 503 A983)
Comparisons of vanous theories with JET expenmental
results can be found in
Connor, J.W et al An assessment of theoretical models
based on observations in the JET tokamak: I Ion heat
transport due to VTi instabilities. Plasma Physics and
Controlled Fusion 35, 319 A993)
and
Tibone, F, Connor, J W, Stringer, T.E , and Wilson, H.R An
assessment of theoretical models based on observations
in the JET tokamak. 11 Heat transport due to electron dnft
waves, electromagnetic and resistive fluid turbulence and
magnetic islands Plasma Physics and Controlled Fusion
36,473 A994)
A companson of a theory for ion temperature gradient
turbulence with the TFTR tokamak can be found in

Bibliography
Kotschenreuther, M , Dorland, W., Beer, M A., andHammet,
G.W Quantitative predictions of tokamak energy
confinement from first pnnciples simulations with kinetic effects.
Physics of Plasmas 2, 2380 A995).
and a companson of a number of theones with the
International Profile Database in
Connor, J W., Alexander, M , Attenberger, S E., Bateman,
G., Boucher, D., Chudnovskij, N , Dnestrovskij, Yu N ,
Dorland, W.etal Validation of 1 D transport and sawtooth
models for ITER Fusion energy (Proc. 16th Int Conf,
Montreal, 1996) Vol. 2, p 935 IA E.A Vienna A997).
The role of E x B shear flow in improved confinement
modes is discussed in
Burrell, K. H. Tests of causality: Expenmental evidence
that sheared E x B flow alters turbulence and transport
in tokamaks. Physics of Plasmas 6, 4418 A999).
and
Burrell, K H Effects of E x B velocity shear and magnetic
shearon turbulence and transport in magneuc confinement
devices. Physics of Plasmas 4, 1499 A997).
Experimental results on the edge temperature pedestal are
reviewed in
Hubbard, A E. Physics and scaling of the H-mode pedestal
Plasmas Physics and Controlled Fusion 42, A15 B000).
Impurity transport
The complex and complete neoclassical theory has been
reviewed by
Hirshman, S.P and Sigmar, D.J. Neoclassical transport of
impurities in tokamak plasmas. Nuclear Fusion 21, 1079
A981).
An example of experimental measurements of impurity
transport can be found in
Gianella, R et al Role of current profile in impunty
transport in JET L-mode discharges. Nuclear Fusion 34, 1185
A994).
Radiation losses
A precise calculation of bremsstrahlung losses was given by
Karzas, W.J and Latter, R. Electron radiative transitions in a
Coulomb field AstrophysicalJoumalSnpplementnumbei
55,6, 167A961);
and a more introductory account is given in
Tucker, W.H Radiation processes in astrophysics MIT
Press, Cambridge, Mass A975)
An early calculation of electron cyclotron emission from
plasmas was made by
Trubnikov, B.A. Magnetic emission of high temperature
plasma Thesis, Institute of Atomic Energy, Moscow
A958). [Enghsh trans. USAEC Techn. Information
Service AEC-tr; 4073 (I960)];
and a more recent review paper is
Bomatici, M., Caro. R., De Barbien, O., and Engelmann, F.
Electron cyclotron emission and absorption in fusion
plasmas. Nuclear Fusion 23, 1153 A983)
The impunty radiation losses under coronal conditions are
given in
Post, D.E., Jensen, R.V, Tarter, CB^/Grasberger, W.H.,
and Lokke, W.A. Steady-state radiative cooling rates for
low-density, high-temperature plasmas. Atomic data and
nuclear data tables 20, 397 A977).

Heating

5.1 Heating
In an ignited D-T plasma the energy losses are balanced by the plasma
heating from the slowing down of the a-particles resulting from the
fusion reactions However, the fusion reaction rate is a strong function
of temperature and is negligible at low temperatures. Thus, to reach the
temperature required for ignition it is necessary to provide some form of
heating There are several proposed methods of achieving this, but before
describing these it is instructive to estimate the amount of heating needed.
As shown in Section 1.4 the power balance in a thermonuclear D-T
plasma is given by
Pr
/3nT 1 2
5 1.1
where the energy loss and a -particle heating terms in the bracket represent
spatial averages. At ignition these two terms are equal, the additional
power Pu, by definition, being zero. Thus, for a tokamak plasma to ignite
TE must be sufficiently large and because, for chosen ignition conditions,
the confinement time increases with size, this essentially determines the
plasma dimensions. It is seen from eqn 5.1.1 that the additional power
required to raise the plasma temperature to ignition depends on both the
plasma volume and the temperature dependence of the a-particle heating
and energy loss terms. The temperature dependence of (crv) has been
determined precisely but the dependence of te is less accurately known
Before considering the total heating power requirements the
temperature dependence of the required heating per unit volume will be calculated
for constant TE and Te oc l/r.Usingthevaluesof(CTi;) given in Fig. 1.3.1
the two terms in the bracket of eqn 5.1.1 are shown in Fig 5.1.1(a) for
a given density and an ignition temperature of lOkeV The difference
between these two terms gives the required additional heating per unit
volume and this is shown in Fig. 5 1.1(b). The powers are normalized to
the a-particle heating at ignition and the total powers required in the two
cases will depend on the functional dependence of t^. At temperatures
below 4keV the a-particle heating is small.
For each GW of thermonuclear power at ignition, the a-particle power
is 200 MW. For the cases considered above, the peak additional power
requirement was approximately 40 per cent of the ignition a-particle
heating for constant TE and 15 per cent for TE cxl/T These correspond to
total required heating powers of 80 and 30 MW per GW of thermonuclear
power
The initial heating in all tokamaks comes from the ohmic heating
caused by the toroidal current At low temperatures ohmic heating is
quite powerful and, in large tokamaks, easily produces temperatures of a
few keV However, as the temperature increases, the collision frequency

Fig. 5.1.1 Showing the power balance
for a tokamak which would ignite at a
temperature of 10 keV Figure (a) gives the
rate of power loss per unit volume for
TE = constant and rg a 1/7", together
with the corresponding a-particle heating
Figure (b) gives the additional heating per
unit volume to provide a steady state power
balance in the two cases. The powers are
normalized to the a-particle heating (and
therefore to the power loss) at ignition
(a)
Power loss
V
Tg constant / ^
(b) Additional heaung
^/^"
/-'^^^^
0 2 4
z-'
1
^ T
X^ //
^~~^^^ /^ /
/ a-particle
y^ heating
■~~-^ Tg constant
~~~~~~~^-^^s
6 8 1
and the resistivity fall. Consequently, at the temperatures required for
Ignition the ohmic heating is much reduced, leading to the requirement
for additional heating Nevertheless under some conditions it is possible
for ohmic heating to contribute significantly to the heating required for
Ignition,
The two main methods which are envisaged for heating to ignition
temperatures are the injection of energetic neutral beams and the resonant
absorption of radio frequency (RF) electromagnetic waves With the level
of confinement found experimentally both of these methods would in
principle be capable of providing heating of the required magnitude, and
both have been successfully tested at power levels of tens of MW
The beams used for injection heating have to be composed of neutral
particles because ions would be reflected by the tokamak magnetic field.
Heating with neutral beams is a complex process Ions must first be
produced and accelerated to the required energy. They are then neutrahzed by
charge exchange in a gas target, and the unwanted residual ions removed.
In the plasma the neutral particles become charged again and as a result
are confined by the magnetic field They are then slowed by collisions
with the plasma particles, giving up their energy in the process
There are several types of RF heating, the three principal ones
involving waves at around the ion cyclotron frequency, the electron cyclotron
frequency, and the lower hybrid frequency The design of the system must
be such that the waves propagate to the central region of the plasma and are

5.2 Ohmic heating
then absorbed. This requires calculation of the propagation of the waves in
the non-uniform plasma and non-uniform magnetic field, and the
transfer of wave energy to the plasma particles Some schemes involve the
introduction of an additional ion species to absorb wave energy. Another
method, which is less developed, uses the low frequency shear Alfven
resonance.
It IS also possible to achieve a transient heating of the plasma by plasma
compression If the plasma is compressed in a time short compared with
the confinement time the compression is adiabatic. The behaviour then
depends upon whether the compression is sufficiently slow that equipar-
tition occurs between the degrees of freedom. If it is, the pressure change
and therefore the energy density change is related to the volume change
by the adiabatic law p <x V~^^^ If equipartition does not occur then
the heating depends upon the number of degrees of freedom involved in
the compression Compression of both the plasma minor radius and the
major radius are possible
5.2 Ohmic heating
The toroidal current which is necessary for equilibrium in a tokamak is
also a source of plasma heating through the resistance to the current caused
by electron-ion collisions. At low temperatures this ohmic heating is very
strong but, because the resistance of the plasma vanes with temperature
as Tf , It is less effective at high temperatures
The ohmic heating density is
where ij is the resistivity of the plasma and j the current density. There
are two limitations on j arising from mhd stability requirements. The
first IS the necessity of avoiding disruptions This imposes a constraint on
the safety factor at the edge of the plasma which, for a circular plasma
IS approximated by qa > 2 Thus, since qa = aB^/RBga and, from
Ampere's law, Bga = iJ-oI/2na the average current density must satisfy
1
5.2.1
Since the local ohmic heating density is proportional to ; the
requirement 5 2.1 would not, by itself, limit the total ohmic heating.
Concentration of the current density provides another degree of freedom. However,
this IS subject to a limitation ansing from instability in the central region
of plasma, particularly the sawtooth instability

5.2 Ohmic heating 241
It was once thought that the sawtooth instability limited the central
current density to a value which maintained the central safety factor, .70, at a
value equal to or greater than one As explained in Sections 7.6 and 7.14, it
appears that this limitation is not so firm. This is firstly because
measurements of qo give values less than one even during sawtooth oscillations
and secondly because the oscillations can be stabilized.
In the absence of instability a steady state current of a given value
would require a certain toroidal electric field, E The ohmic heating
density can then be written
Pa = Ej.
However, both the electric field and the current distribution depend upon
the confinement properties of the configuration through the dependence
of the resistivity on temperature
A further complication arises from the form of the resistivity The
Spitzer resistivity, ;7s, is independent of the geometry but neoclassical
resistivity has a strong aspect-ratio dependence, taking the form
% = - -2- 52.2
This neoclassical effect increases the resistivity substantially but, because
it falls to zero at r = 0, the current concentrates toward the axis, driving
qo down There is some uncertainty as to the actual resistivity in tokamaks
but the experimental evidence indicates that it is neoclassical.
It is seen from the above account that it is not ea^y to make a precise
calculation of the ohmic heating and its resulting temperature. To illustrate
the basic features a simple approximate calculation will be used. Since
the volume within small radii is small and the current at the plasma edge is
small the effective resistivity is taken to be that at half the plasma radius.
Thus, taking R/a = 3, the geometric factor in eqn 5.2.2 enhances the
Spitzer resistivity by approximately a factor 3. Using eqn 2.16.2, this
gives
T]^8x 10-^Zeff ^e~^/^ Te in KeV 5.2.3
Using this approximation the average ohmic heating density is
Pu = ri{f).
Taking the current profile to be

5.2 Ohmic heating
Ampere's law gives
A-i'-if]
2(v + l)r
and eqn 5.2 5 together with q{r) = (B^/R)/{Be/r) leads to
v+l = ^.
qo
Using JO = IB^/RqoiXQ and eqn 5.2.6, eqn 5.2 4 becomes
ij') = ^(\)
\^.oRJ qo(qa-jqo)
The temperature which would be achieved by ohmic heating alone is now
obtained by substituting eqn 5 2.7 into the energy balance equation
riij ) =
Te
where rj is given by eqn 5.2.3. This gives an average temperature. If the
peak temperature, T, is taken to be twice this value then
f = 2.7xlO«f^'7^f\eV
\nqaqoJ \RJ
where the small contribution from ^qo in eqn 5.2.7 has been neglected.
There is uncertainty as to what scaling to use for te Since the
conditions in a large reactor tokamak would be different from present
experiments there is a range of possible outcomes. One scaling used for
ohmically heated plasmas is the so-called Alcator scaling
5.2.9
Te
= ^(n/lO^^)a^ s.
Substitution of eqn 5.2.9 into eqn 5.2.8 gi
f --
Takin
f --
\qaqoJ ^R
g Zeff = 1 5, qaqo =
= 0.875^^ keV
\4/5
B4,) keV.
1 5 and R/a --
ves
= 3,
and values for this case are plotted in Fig. 5 2.1.
It IS seen that for a magnetic field of 6T the temperature is 3.6 keV
and that very high fields are needed to reach temperatures required for
Ignition. However, the use of scaling 5.2.9 is for illustration and a different
scaling could significantly affect the result

5.3 Neutral beam injection
Fig. 5.2.1 Temperature predicted foi
ohmic heatmg as a function of the toroidal
magnetic field using Alcator scaling
Plasmas with a substantial amount of impurity have a higher value of
Zeff which increases the ohmic heating and leads to a higher temperature.
Of course the presence of impurities also leads to additional power loss
through radiation as described in Section 4 25.
The ohmic heating in an ignited plasma is quite small. It can be
estimated using eqns 5 2.3 and 5 2.7 to obtain
,(/> = oioZeffr-v2(^y
1
qoiqa - 2'?o)
- MWm"-
[ikeV
Taking Zetf = 1.5, B^/R = 1 and qo(qa - ^qo) = 1.5
T in keV
, 0.10
'?(/) = ^;372MWm-
In a reactor with a plasma volume of 2000 m^ this would give an ohmic
heating power of ~6 MW for T = 10 keV
Neutral beam injection
Neutral atoms injected into a plasma travel in straight lines, being
unaffected by the magnetic field. The atoms become ionized through
collisions with the plasma particles and the resulting ions and electrons
are then held by the magnetic field. Since the ions and electrons have the
same velocity the energy is carried almost entirely by the more massive
ions. Once ionized the ions have orbits in the magnetic field determined
by their energy, angle of injection and point of deposition. The energy of

5.3 Neutral beam injection
the injected ions is gradually transferred to the plasma electrons and ions
through Coulomb collisions. Thus the injected ions are initially slowed
and then thermalized.
It IS clearly desirable that as much of the deposition as possible should
take place in the central region of the plasma. This means avoiding both
too strong absorption, which leads to heating of the plasma edge, and
too weak absorption which allows transmission of the beam through the
plasma to produce heating and particle sputtering at material surfaces.
There are three basic atomic processes leading to beam absorption,
charge exchange, ionization by ions, and ionization by electrons. These
processes are listed below using the symbol H to represent the species. In
a reactor the beam would probably be deuterium and the target plasma a
deuterium-tritium mixture. Thus, using subscripts b and p for beam and
plasma, the processes are
Charge exchange Hb + H+ -> H+ -f Hp
Ionization by ions Hb + HJ" -> U.^ +}it + e
Ionization by electrons Hb + e -> Hj|" -f 2e.
The absorption of the beam depends upon the cross-section for these
processes. Thus if the intensity of the beam is
I{x) = Nb{x)vb
where A^b is the number of beam particles per unit length and v\, their
velocity, its decay is governed by the equation
d/ / (fTeWe)\ ,
d^ = -H"* + "'''^'
where n{x) is the electron (and ion) density, cTch and cf^ are the cross-
sections for charge exchange and ionization by ions, and (cTgWe} is the
electron ionization rate coefficient. The different form of the electron
ionization term is due to the fact that the electrons will generally have
velocities greater than the particles in the beam while the plasma ion
velocities, of course, are less.
The cross-sections for the various processes are shown m Fig. 5.3 1,
the electron ionization being represented by the effective cross-section
{cfeVe)/vb- Below 90 keV, charge exchange is the most effective process
for a deuterium beam. Above this energy, ionization by ions becomes
dominant.
In a reactor the electron density will be around 10^*^ m~^. For a
deuteron beam energy of 100 keV the combined cross-section for charge
exchange and ionization by ions is 3 x 10"^*^ m^ giving a decay length,
(crn)~', of 30 cm. Since a reactor would have a plasma radius an order of
magnitude larger this represents a serious problem because, using
conventional methods, there are difficulties in producing neutral beams with high
energies. The proposed solution is to use negative ion beams, which can

5.3 Neutral beam injection
Energy of hydrogen beam atoms
10 keV 100 keV
Fig. 5.3.1 Cross-sections for charge
exchange and ionization by plasma ions
(protons, deuterons, or tritons) and the
effective cross-section {creVe)/Vb for
ionization by electrons, as functions of the
neutral beam energy. The cross-sections for
a hydrogen beam are the same as those for
a deuterium beam having twice the energy.
10 keV 100 keV 1 MeV
Energy of deuterium beam atoms
Fig. 5.3.2 Illustrating the increased
neutral beam absorption length with
tangential injection, and the increased
difficulty of access through the toroidal
field coils
Toroidal
field coils
be efficiently produced and neutralized at substantially higher energies.
The techniques of neutral beam production are described in Section 5.6.
If the neutral beam is injected along the major radius of the tokamak,
that is perpendicular to the magnetic field, the resulting ions are subject
to losses arising from the npple in the magnetic field as described in
Section 4.11. In smaller tokamaks there is also the problem that the beam
is not completely absorbed in the plasma and impinges on the far wall.
These difficulties are ameliorated by a more tangential injection as shown
in Fig. 5.3.2. However the ability to do this is restncted by the difficulty of
access between the toroidal field coils and the increased pumping
requirement in the longer drift ducts. The chosen injection angle is therefore a
compromise between these constraints.

5.4 Neutral beam heating
A disadvantage of neutral beam systems is the large scale of the
equipment On the other hand they have the advantages that, in the main,
they can be developed and tested separately from the tokamak itself,
and the heating profile can be predicted independently of the magnetic
configuration.
5.4
Neutral beam heating
Once the neutral beam particles entenng the plasma have become ionized,
the resulting fast ions are slowed down by Coulomb collisions. As the
slowing down occurs energy is passed to the particles of the plasma,
causing heating of both electrons and ions. At high injection velocity the
electron heating is initially dominant. Then, as the beam ions slow down,
the heating is transferred to the ions.
Because the electron mass is much smaller than that of the ions,
collisions with the electrons cause only a small scattering of the beam ions.
Consequently if the drag force which the electrons transmit to the beam
ion is Fbe, and beam ion velocity is v\,, the heating of the plasma electrons
is given by
-^beVb-
5.4.1
The force is given by the rate of momentum loss, that is
^be = mb(Ai;||>e
MbVb
where mt is the mass of the beam ions, (Ai;||} is the friction coefficient
introduced in Section 2.13, and Tge is given by eqn 2.14.1. Thus eqn 5.4.1
becomes
Taking the case where Vb is If
3B71) 1/2 7;3/2
s than the electron thermal velocity,
ne^ In A

5.4 Neutral beam heating 247
Substituting eqn 5.4.3 into eqn 5 4.1 gives the electron heating
p ^ 2ml^^mbAuSb ^^^
3B7r)i/2 7;3/2 ■
where S^ is the beam energy jmbV^.
A similar heating of the ions occurs through beam ion collisions with
the plasma ions. However, in this case the comparability of their masses
means that the slowing down of the beam ions is accompanied by a
scattering of the beam ion velocities principally perpendicular to the initial
direction of the beam. This spreading of the perpendicular velocities
constitutes a 'heating' of the beam ions which will ultimately contribute
to the plasma energy but does not appear in the initial direct heating. Thus
the rate of direct heating of the plasma ions is
Pi = -FbiVb - ^mb(vl) 5.4.5
where F^i is the drag force on the beam ion due to the plasma ions, the
velocity diffusion coefficient (w]^} is given by eqn 2.13.3, and
^bi = mb(Ai;||}i
mbWb
where the slowing down time, r^u is given by eqn. 2.14.1. Since the beam
ion velocity is much greater than the plasma ion thermal velocity
m. 2vl
Mb +mi Ad
the appropriate limiting forms, given by eqns 2.14.5 and 2.14.6 are
-Fb.Vb = ■
2i;b
MbA-a
Thus, from eqn 5.4.5, only the fraction mb/{mb + m^) of FbiVb appears
as direct heating of the plasma ions, and
Combining eqns 5.4.4 and 5.4.7 the total direct heating per beam ion,
P = Pg + p„ is
It is seen that at higher values of 8b the first term, representing the electron
heating, predominates and that as the beam ions lose energy the ion

5.4 Neutral beam heating
heating takes over. Equation 5.4.8 can be written
_ Iml^^nibAu
' 3Bu)i/2re^/2
% 1 +
where At is the atomic mass of the beam ions, In A has been put equal
to 17 and
= 14.8-477^6 5.4.9
a\'^
where Ai is the atomic mass of the plasma ions. At the critical beam
energy, 8\, = 8c, the electron and ion heating rates are equal. For
Ab = A; = 2 the critical energy is 19 Tg. Figure 5.4.1 shows the fraction
of the direct heating by a beam ion going to electrons and ions as a
function of Sb/Ts for Ab = Ai = 2. In present experiments typical injection
energies are of the order of the critical energy and the electron and ion
heating are of comparable magnitude.
Beam slowing
Using the beam-ion power balance equation
Fig. 5.4.1 Electron and ion heating
deutenum beam ions with energy 6b a
fractions of the total heating plotted
against Sb/7"e for a deuterium plasma

5.4 Neutral beam heating 249
with equations 5.4.3 and 5.4.9, eqn 5.4.8 can be written
and the solution for the beam energy is
where ^bO is the initial value of ^b- Equation 5.4.11 is not valid at very
small Sb but gives a satisfactory value of the time for the beam ions to
slow down to the thermal energy. Thus putting ^b = 0 the characteristic
time is
-ml-
The graph in Fig. 5.4.1 gives the fraction of the heating going to ions and
electrons for a beam ion of a given energy. It is also possible to calculate
the overall heating fractions allowing for the time dependent energy of
the beam ions, as below.
Ion-electron heating fractions
The second term in eqn 5.4.10 represents power transferred to the ions
and so the rate of ion heating is
9 /ox 3/2
and using eqn 5.4.10
Pi =
g3/2 ^ g3/2 df ■
Thus the total energy delivered to the ions is
/.,., = .-f
„3/2 ^ „3/2
and the fraction of the initial ion beam energy which goes to the ions is
Z"^'"^^' gcd(gb/gc)
1 + (Sb/S,)y^ 5_4_^2
?c).
/g rebo/Sc
gbo Jo 1

Neutral beam heating
Fig. 5.4.2 Fraction of the initial beam
energy which is directly transferred to the
plasma ions as a function of the ratio
4o/ec
cPix)
^l\l
l-x'/^+x
' (l+;ci/2):
- +
tA"
i2x'/^-l
V3
l)\
Thus eqn 5.4.12 gives the fraction of the plasma heating which is received
by the plasma ions as a function of the ratio of the initial beam energy to
the critical energy and a graph ofcpiSbo/Sc) is shown in Fig. 5.4.2.
Distribution function
The steady state distribution function of the slowing beam ions can be
calculated using the fact that the flux in energy space is uniform and given
by the source rate S. Thus distribution of energies /(%) is given by
Using eqn 5.4.10
fiSb) --
2gb(l + (ec/eb)^/^)'
a graph of which is shown in Fig. 5.4.3.
As the beam ions lose their energy, their velocities are increasingly
scattered in the perpendicular direction, so-called pitch angle scattenng.
The slowing and scattering ultimately lead to a thermalization of the beam
at the plasma temperature. The scattering is predominantly caused by
collisions with the ions and can be illustrated by an approximate calculation
using the associated form of ((Awi)^} as represented by the deflection
time Td given by eqn 2.14.2. Thus the resulting rate of energy increase
due to the perpendicular spread in velocities is
d 1
-mbWi =
5.4.13

5.4 Neutral beam heating
Fig. 5 4.3 Graph of the steady state
energy distribution function resulting from
the slowing-down of an ion beam
This represents the part of the power FbiWb which is not transmitted to
the plasma ions. Using eqns 5.4.13 and 5.4.10,
r{h>n,vl)-
H-m
and using eqn 5.4 3 for Tse, eqn 5.4.14 becomes
-(i/Wbvi) =-
1 + (eb/ecK/2
so that
5/Wb'
=3/2
+ s,
3/2-
It is seen from eqn 5.4.15 that the scattering is small for S^ > Sc
and increases as Sb falls. Figure 5.4.4 illustrates schematically the time
development of the velocity distribution of a set of ions injected at a
given time.
Experiments
The first steps in the neutral beam heating of tokamaks were reported in
1973. Injection with tens of kW of power was carried out in the ATC,

5.4 Neutral beam heating
ION HEATING \ ELECTRON HEATING'
Fig. 5.4.4 Sketch of the time
development of the velocity distribution of
beam ions injected at ? = 0, showing the
change in behaviour when the ions are
slowed below the critical velocity
Vc = Bgc/'nb)'/2_
I Mainly
/ slowed
Pitch angle /
scattering ^
Fig. 5.4.5 Heating of PLT plasma by
neutral beam injection. The ion
temperature was measured by analysis of
charge-exchange neutrals for 2 4MW
deuterium injection into a plasma with a
central density n@) = 4.5 x lO" m"^
(Eubank, H et al Physical Review Letters
43,270A979))
^
CLEO, and ORMAK devices. Typically plasmas with temperatures of
~200 eV were heated through a temperature increase of ~50 eV
Subsequent development of the beam systems led to megawatt beam
powers and by 1979 temperature increases of several keV had been
obtained. Figure 5.4.5 shows results from the PLT tokamak in which
2.4 MW of deuterium beam injection increased the ion temperature from
1 keV to over 6 keV.
As the available beam power was increased to tens of MW, the plasma
temperatures moved into the reactor relevant range and temperatures of
tens of keV were achieved A further development was the use of tritium
beams in JET. Figure 5 4 6 shows the time development in one such
discharge. A peak beam power of 14 MW, including 1.5 MW in the tntium
beams, raises the ion temperature to 19keV. The resulting fusion power
was~15MW.

5.5 Neutral beam production
Fig. 5.4.6 Neutral beam heating m JET
with 1 5 MW m tritium beams The graphs
give the resulting ion and electron
temperatures, the plasma energy, W, and
the rate of neutron production (The JET
team, Plasma Physics and Controlled
Fusion M, 1749A992))
Neutron
rate
A017 S-l)
Power 101
(MW)
Neutral beam production
The production of neutral beams for plasma heating involves several
stages, the basic elements of which are shown in Fig. 5.5.1 for the case
of a positive ion beam. The components of a negative ion beam system
are similar and will be described later.
In order to accelerate the particles to the required energy it is
necessary that they be charged. Thus in the first stage a plasma is produced as
a source of ions of the required species The ions are extracted from
this source and accelerated to the required energy. The resulting ion
beam must then be neutralized to produce a neutral beam capable of
crossing the tokamak magnetic field and entering the plasma. The
neutralization is achieved by passing the ion beam through a gas in which
charge exchange occurs. In the charge-exchange process, electrons are
transferred from the gas particles to the beam ions, transforming the
beam particles to neutral atoms. The result is a beam of energetic neutral
atoms.
Ion source
Ion sources produce not only the required atomic ions, say D+, but
also molecular ions DJ and DJ. These molecular ions will fall through
the same accelerator potential as the atoms and will therefore acquire

254 5.5 Neutral beam production
-Accelerator
Deflector
magnet
/ 1_
^~/
Fig. 5.5 1 Layout of neutral injection
system
Permanent
magnets
iQnnnnn
i) Hot\
V
Extraction
Fig. 5 5.2 Schematic diagrai
^-y
the same energy. However, because of their higher mass, the velocity
of the molecules will be lower. The molecules are dissociated in the
neutralizer and the resulting atoms have energies of one-half and one-
third of the energy of the main component. These particles will therefore
penetrate the plasma less well and will produce more heating at the
plasma edge.
The most commonly used system is the so-called bucket source. For
efficient confinement of the source plasma this utilizes a multipolar
cusp magnetic field around the boundary of the source as illustrated
in Fig. 5.5.2 The magnetic field, which is produced by permanent
magnets, falls to a low value in the central region. A plasma is
generated using tungsten filaments, and the ions are then extracted through
a grid. In such a source the atomic fraction of the extracted ions can
be 90%. A possible development of the source for long pulse or steady
state operation is the replacement of the filament by RF excitation of
the plasma.
Accelerator
The ions are accelerated from the source through a multi-aperture system
of either slots or circular holes which are carefully designed to minimize
the aberrations of each beamlet The structure undergoes heating from
incident ions and requires a cooling system between the apertures
Although the divergence of the individual beamlets emerging from
each aperture is quite low (~0.5°), the long path to the torus requires
some extra beamlet steering This can be achieved by an aperture offset
between two consecutive grids or geometrical shaping of the grids, or by
combination of both.
The neutralizer gas allows the neutralization of beam ions by charge
exchange, but unfortunately also produces re-ionization of the neutralized

5 5 Neutral beam production
particles. There are therefore two competing processes:
Charge exchange D+ + D2 -» D + D J
beam gas required slow
ion beam ion
neutral
Ionization D + D2
beam gas
neutral
D+ + D2 + e
unwanted gas released
beam electron
In a sufficiently thick target an equilibrium is reached in which the
ratio of the charged and uncharged components is given by the ratio of
the cross-sections for the two processes, that is
This ratio is a function of the beam energy and, unfortunately, the
fraction of the particles which are neutrals decreases rapidly with increasing
energy This is shown in Fig 5.5.3 together with the plasma penetration
capability of the beam as indicated by the penetration distance in a plasma
(H, D, or D-T) with n = 10^*^ m~^ calculated using the cross-sections
of Fig. 5 3 1. It IS seen that it is not possible, using positive ions, to
produce neutral beams efficiently at energies required to penetrate a plasma
having a radius of 2-3 m, as would be required for a,ifeactor.
The unwanted charged fraction of the beam leaving the neutralizer
has a power of the same order as that of the neutral beam used to heat
Fig 5.5.3 Graphs showing the energy
dependence of (i) the equilibrium neutral
fraction in a deuterium beam and (ii) the
penetration distance of the neutrals m a
plasma of density n = 10^° m^^ The
change of behaviour of the penetration
distance at around 100 keV indicates the
transition from charge exchange
dominance to ionization dominance
40 60 80 100 200 300
Beam energy (keV)

5.5 Neutral beam production
the plasma. The charged particles are therefore deflected by a
magnet and dumped before entering the influence of the tokamak magnetic
fields where they would otherwise be deflected on to the walls of the
injection port.
Negative ion beams
Although present neutral injection systems are based on positive ion
sources, it is envisaged that the problem of producing high energy beams
with a high neutral fraction can be overcome by using negative ion
sources. Such sources allow the achievement of much higher neutral
fractions at high energy than is possible with positive ion beams The negative
ions are produced either by double charge-changing at surfaces with a low
work function or by volume production in a low density plasma
The negative ions are passed through a neutralizing gas Unlike the
positive ion beam case the neutral fraction at first increases and then decays
as the beam passes through the neutrahzing gas. There are six cross-
sections describing the possible transitions between the charge states
-e, 0, and -fe, but only three are significant. Initially the dominant
process IS D~ -» D, creating the desired neutrals This is followed by an
attrition, through D -» D+. The transition D~ -» D+ also occurs but
plays a small role The cross-sections are given in Fig 5.5.4
The essential features of the process can be calculated using a simple
model based on the two dominant processes with cross-sections ct-io and
cToi, so that
dA^-
and
dx
-loA^"
■-nia-ioN- -CFoiN'')
5.5.1
200 400 600 800 1000
Beam energy (keV)

5.5 Neutral beam production
257
where A^~ and A^*^ are the densities of the negative ions and neutral atoms,
and n is the density of the neutrahzing gas. The solution of eqns 5.5.1
and 5.5 2 for N^ is
N^
--N^
-(e '
'")
5.5.3
where A^q is the initial negative ion density
The maximum value of A^o occurs for
ln(cT_io/cToi)
n(cT_io -CTQi)
and the maximum value of A^o is given by
No
where
The small effect of the cross-section ct_ii can readily be included
in the calculation, the cross-section ct_io simply being replaced by
(CT_io + (T-n)-
The experimental values of the cross-sections for beam energies %
between 0.5 and 1.0 MeV are represented approximately by
1.04 X 10--
0.34 X 10^"
g(MeV)
5.5.6
Using these values in eqn 5.5.3 gives A^*^ as a function nx/8\,, and the
resulting graph is shown in Fig. 5.5.5. From eqn 5 5 5 the maximum value
Fig. 5.5.5 Neutral density as a function
of nx/^b using the cross-sections from
eqns 5 5 6
'b(MeV)

5.6 Radio frequency heating
Fig. 5.5.6 Showing the advantage of the
higher neutral fraction of negative ion
beams when deep penetration is needed
The graphs are for deutenum beams
10
0.8
Fraction
06
04
0.2
0
^\ Neutral fraction
- \ (positive ions)
- \
\
\ /
T
Penetration distance^^^
y^ -
Neutral fraction
(negative ions)
200 400 600
Beam energy (keV)
Distance
(m)
of A^o has a neutral fraction, N^^^/Nq , of 58%, and using eqn 5.5.4 the
maximum occurs at
n/1020 ■
The benefit of negative ion beams is illustrated in Fig 5.5.6 which gives
the maximum neutral fraction in a negative ion beam neutralizer together
with the beam penetration into a plasma.
Radio frequency heating
Radio frequency heating transfers energy from an external source to the
plasma by means of electromagnetic waves. When an electromagnetic
wave propagates through a plasma the electric field of the wave accelerates
the charged particles which then heat the plasma through collisions The
collisional absorption scales as T^ so that, just as for ohmic heating,
collisional absorption of electromagnetic waves is ineffective as a direct
heating mechanism for hot plasmas.
However, electromagnetic waves in plasmas are subject to resonant
absorption which is a collisionless process and produces strong heating.
A magnetized, multispecies plasma has a number of resonant frequencies
which give rise to absorption of the energy of an incident wave. Due
to the non-uniformity of the tokamak magnetic field, each resonance
IS associated not only with absorption but also reflection, that is
resonant reflection. Thus when the wave approaches the resonance from the

5.6 Radio frequency heating 259
high magnetic field side strong absorption takes place When the wave
approaches from the low magnetic field side strong reflection may occur.
This phenomenon will be described in Section 5.7
The variety of wave modes in a magnetized plasma allows many
different radio frequency heating schemes. However, all consist of the same
general layout, namely, an efficient high power generator remote from
the plasma, a low-loss transmission line and an efficient antenna which
couples the electromagnetic energy to the plasma.
Once the energy has been coupled to the plasma it is required to
propagate, with negligible loss, to a localized absorption zone where, ideally.
It will be deposited in one transit of the absorption region. A desirable
property for any heating scheme is that the location of the absorption zone
should be externally controllable.
The cold plasma model provides a good first approximation to the
propagation of electromagnetic waves in a plasma It gives accurate
information except in certain critical regions in the vicinity of plasma
resonances, which will be discussed at length. In these regions, close to a
resonance, thermal corrections become important either because the wave
phase speed has become comparable with the thermal speed of a particular
species or because the perpendicular wavelength is no longer negligible
compared with the Larmor radius However, as will be seen, even for such
critical regions, it is still possible to extract some useful information from
the cold plasma model. This model can therefore be used to describe the
propagation of energy to the resonance region and hence to determine the
accessibility of the resonance. The cold plasma dispersion relation serves
also to identify the three principal radio frequency heating schemes In a
slab approximation it takes the form
£xnl - [(£x - nl)isj_ + £j|) + sl^,]nl + £||[(£x - njf + £^^1 = 0
5.6.1
where the equilibrium magnetic field is in the ^-direction, x and y
represent the radial and poloidal coordinates, and n\i{=ck\\/co) and
n±{=ck±/co) are the components of the refractive index parallel and
perpendicular to the equilibrium magnetic field, with co the wave
frequency, k\\ the wave number parallel to the magnetic field and k± the
'radial' wave number. The dielectric tensor has components
SXX = Sy^ = S± =
5.6.2
all other elements being zero. The summation is over electrons and all
ion species, the gyrofrequency, cocji= ZjcB/nij), contains the sign of

5.6 Radio frequency heating
the charge, and
Since n j is determined by the antenna and co is fixed by the generator,
eqn 5 6.1 can be solved for n^. An approximate solution to the problem
of the propagation of a wave through an inhomogeneous plasma can
be obtained by computing the solutions of eqn 5.6.1 as the density and
magnetic field change slowly as functions of the radial coordinate. These
solutions yield information on the propagation of a given wave across
the equilibrium magnetic field from the edge plasma to the centre of
the discharge A wave will only propagate when the solution of eqn 5.6 1
satisfies n\>0 For certain values of the frequency, density, and magnetic
field, a resonance occurs asn± -^ oo As already remarked, a resonance
IS associated with absorption. In the vicinity of a resonance the cold
plasma model becomes invalid since for k± -» oo, the perpendicular
phase velocity can no longer be much larger than the particle thermal
speeds Consequently the physics of the resonance region, and in
particular the absorption mechanism, requires a kinetic treatment. Nevertheless,
even within the cold plasma model it is possible to calculate the energy
lost by an incident wave in crossing the resonance region as described in
Section 5 7
The kinetic model distinguishes two channels through which an
incident wave can lose energy in the resonant region The first is by
transferring some of its energy to another propagating wave of the plasma
which IS resonant in the same region as the incident wave. This is a
reactive process and is referred to as mode conversion It is this process
which IS responsible for resonant absorption. The second is through a
collisionless, wave-particle resonant interaction which is a dissipative
process.
For particular values of the density, equilibrium magnetic field and ny,
the square of the perpendicular refractive index, rP^ can change sign and
therefore it will be equal to zero on some surface, n\ = 0. The plasma
conditions for which either n± -^ oo orn^-^ 0 define critical surfaces
for the propagation of a given wave. The former are referred to as
resonance surfaces, where wave absorption occurs, and the latter as cut-off
surfaces at which an incident wave is reflected. In addition to the cut-off
associated with a resonance, isolated cut-offs can also occur. Beyond a
cut-off point a wave decays exponentially. This does not imply the wave
IS damped but simply that the plasma is unable to support wave
propagation. Such a region of non-propagation is referred to as evanescent. If
an evanescent region is of finite extent some of the wave energy can leak
through to the propagation region and the wave is said to tunnel through
the evanescent zone This phenomenon will be discussed in Section 5.7.
If the evanescent region is too large the wave will be unable to cross this
region and will be totally reflected. When the antenna is situated in an
evanescent region, efficient transfer requires that the evanescent region

5 7 Physics of radio frequency heating 261
be minimized and that the antenna should be part of a low-loss resonant
circuit where high RF voltage is applied
Physics of radio frequency heating
Radio frequency heating has been used to heat magnetically confined
plasmas since the early days of fusion research. Three schemes have
emerged as the most successful, namely, ion cyclotron, lower hybrid and
electron cyclotron heating. Each method has been tested at the megawatt
level in major tokamak installations
The principle radio frequency heating methods can be identified by
using eqn 5.6 1 to obtain the resonances associated with each regime.
Since eqn 5 6.1 is a quadratic in n^, one of the solutions will tend to
infinity when s±, the coefficient of n^, becomes zero. Thus, £x = 0 is
the condition for a perpendicular, cold plasma resonance to occur.
The lowest frequency scheme is ion cyclotron resonance heating
(ICRH) for frequencies co ~ coa In this case a resonant frequency only
occurs when two or more ion species are present It is called the ion-ion
hybrid, or Buchsbaum, resonance The resonant frequency co^^ with two
ion species is
2_ CL>c\CL>c2i'i-+n2m2/nimi)
" (mjZi/miZj+njZj/niZi)
which gives a frequency in the range 30-120 MHz, depending on the
magnetic field and the species.
The lower hybrid resonance frequency lies between coa and coce, where
coce is the unsigned electron cyclotron frequency For the central regions
of a tokamak where a?^ ^ Q^, and neglecting terms ~ m^/m^,
ai^^coljil+coljcol). 5.7 2
This defines the lower hybrid resonance heating scheme which utilises
the frequency range ~l-8 GHz
Finally, the highest frequency scheme is electron cyclotron resonance
heating (ECRH) for frequencies &)~&)ce For a cold plasma and
perpendicular propagation the only resonant frequency in this regime occurs at
the upper hybrid frequency, &)uH, where
4h = «?e + «ce 5 7 3
The electron density and magnetic field in a tokamak discharge are such
that &)pe is much less than &)ce at the plasma edge whereas &>pe < &>ce at
the centre Hence the upper hybrid frequency is just above the electron

5.7 Physics of radio frequency heating
cyclotron frequency The electron cyclotron resonance heating scheme
requires sources in the range 100-200 GHz. The above resonances will
be described in more detail in the following sections where the three
heating schemes are treated separately
Wave polarization
An important factor which influences the strength of the damping of a
given wave mode in the resonance region is its electric field polarization.
For cyclotron resonance, a wave will be strongly absorbed if a significant
fraction of the wave energy resides in electric fields rotating in the same
sense as the cyclotron resonant particles In addition, the strength of the
electric field parallel to the equilibrium magnetic field will also be
important for electron dissipation As noted in Section 5.6, a slab geometry is
considered in which the equilibrium magnetic field is taken as the ^-axls,
the radial direction is represented by the x-axis and the poloidal direction
IS therefore given by the y-axis For simplicity, waves are assumed to
propagate in the x — z plane where the x-direction is the direction of
inhomogeneity
In the vicinity of a resonance, Ej > Ey where Ej and Ey are the
components of the wave electric field perpendicular to the equilibrium
magnetic field This result can be obtained from Maxwell's equations and
the dielectric tensor, e, which yield the linearized equation
{nH-nn-e)E = 0 5 74
where n = ck/co and I is the unit dyadic
The determinant of the matrix multiplying the electric field vector
gives the dispersion relation, eqn 5 6.1 The electric field polanzation of
one of the eigen-solutions of eqn 5 6 1 is given by the ratios of the electric
field components obtained from eqn 5.7 4 When fe|| = 0, E^ and Ey are
related by
Ex Sjy
Clearly £, <?C Ej near to a perpendicular resonance surface where
£x -» 0 This inequality is valid over a wider range of conditions for
the two-ion hybrid resonance In this case, when fey 7^ 0, and assuming a
cold plasma, eqn 5 7 4 gives the relation between Ej and E^
nx«||£x + (£||-ni)£z = 0 576
For the ion cyclotron range of frequencies, £|| > n\ and therefore
|i:.-^«l
Ex s\\
The relation between E^ and Ey is now given by
Ey (£X - «?)

5 7 Physics of radio frequency heating
263
Near to the two-ion hybrid resonance, s± — n^,-^0 and again Ey <^ Ej
Away from a resonance region, Ey^Ex, corresponding to a wave
whose electnc field polarization is partially transverse (Ey) and partially
longitudinal (Ex). In the resonance region, the polarization becomes
predominantly longitudinal. This is important for two reasons. First, since
a longitudinal polarization can be decomposed into an equal mixture of
right- and left-hand circular polarization, cyclotron absorption by either
electrons or ions may result, depending on the wave frequency and on
the proximity of the hybrid resonance to the cyclotron resonance region.
Second, the longitudinal polarization facilitates the coupling of the
incident wave to a longitudinal wave which propagates at frequencies in a
narrow band around the hybrid resonance frequency These longitudinal
waves are members of a class of waves known as Bernstein waves whose
significance for the resonance region is discussed below.
Local description
In this subsection the information presented is obtained from solutions
of the local dispersion relation for each wave mode treated separately.
Several features characteristic of all radio frequency heating schemes
are illustrated in Fig. 5.7.1 which gives the square of the perpendicular
refractive index for the extraordinary electron cyclotron wave
propagating across the toroidal magnetic field for co ~ &)ce- The extraordinary
electron cyclotron wave is the mode which, in the limit of perpendicular
propagation, illustrated in Fig. 5.7.1, is polarized with its electric field
entirely in the plane perpendicular to the equilibrium magnetic field. This
is in contrast to the ordinary electron cyclotron wave which in the same
limit is linearly polarized with its electric field aligned parallel to the
equilibrium magnetic field. These two modes are discussed more fully in
Section 5.10 In Fig. 5.7 1 the magnetic field increases from the low field
side on the right to the high field side on the left, and rP^ is plotted against
the major radius over the full width of the plasma The density varies
from zero on either side to a maximum at the centre. The expression for
Fig 5 7.1 nl ve
the electron cyclot:

5.7 Physics of radio frequency heating
n]^ is easily obtained from eqn 5.6.1 by putting n n = 0 and neglecting the
ion contribution. The most notable feature of Fig. 5.7.1 is a resonance,
where n± -^ oo, with its associated cut-off. This is often referred to
as a back-to-back, cut-off resonance pair. The separation between the
cut-off on the low field side and the upper hybrid resonance is a function
of density. The lower the density, the closer the cut-off is to the
resonance. The existence of the cut-off on the low field side of the resonance
means that if an extraordinary wave (with co ~ coce) is to reach the upper
hybrid resonance from this side it must tunnel through the evanescent
layer. The larger the separation between the cut-off and the resonance,
the smaller the fraction of incident energy which tunnels through the
layer. On the other hand, since there are no cut-offs on the high field side
of the resonance, an extraordinary mode launched from the high-field
side will propagate directly to the upper hybrid resonance. In doing so,
the wave would also cross the fundamental electron cyclotron resonance
where absorption can also occur, although the cold plasma model does
not exhibit a resonance at this frequency In order to obtain a
perpendicular resonance at the cyclotron frequency, and its harmonics, a kinetic
model of a hot, magnetized plasma must be used.
Full wave description
Diagrams such as Fig. 5.7.1 are only approximations to the local
properties of one solution to the wave equation for a particular frequency
and polarization. In the vicinity of cut-offs and resonances, it is no longer
sufficient to consider a single wave mode. Clearly, in the vicinity of a
cutoff it is necessary to take account, not only of an incident wave, but also a
reflected wave If the incident wave is not totally reflected, which is
usually the case, there will also be a transmitted wave which tunnels through
the evanescent region to a propagating region deeper in the plasma
The simplest description of resonant absorption and tunnelling is given
by the Budden model which describes the physics of the back-to-back
cut-off resonance pair referred to above This model consists of a second
order differential equation of the Schrodinger type.
where 0 is a normalized wave amplitude, ^ is a normalized spatial
coordinate and ko is the wave number for |^| ;>> ^c- The wave potential is
singular at ^ = 0 and has a zero at ^ = ?c- Hence the resonance occurs
at ^ = 0 and the cut-off at ^ = ?c- If the local dispersion relation is
obtained from eqn 5 7.8 the wave number has a resonance and cut-off at
these points The transmission coefficient, T, is defined as the fractional
power transmitted across the resonance for unit incident power. It can
be obtained from the solution of eqn 5 7 8 by calculating the ratio of the

5 7 Physics of radio frequency heating 265
intensities (|0p) of the transmitted and incident waves and is given by
T = exp(-ufeo?c)- 5.7.9
T depends only on the separation of the cut-off and resonance and does
not depend on whether the wave encounters the cut-off or resonance
first. However, there is an asymmetry with regard to reflection. When
the incident wave meets the cut-off first, the reflection coefficient R, is
related to the transmission coefficient, T,by R = (I — T)^ When the
wave IS incident from the opposite direction, R = O.lt should be noticed
that T + R < I. The missing energy is 'absorbed' at the resonance (by a
mechanism not specified in the cold plasma model).
In the Budden model the incident wave loses energy due to the
resonance where the perpendicular phase velocity of the wave becomes zero.
This behaviour is a result of including only the incident and reflected
waves in the second order eqn 5.7 8. A more accurate theory must allow
for the presence of another mode of propagation which becomes
degenerate with the incident wave in the resonance region. The degeneracy of
the two waves means that they have the same frequency and wave
number in the resonance region and can therefore couple. As a result, the
incident wave gives up a fraction of its energy to the second mode. This
IS the reactive loss mechanism associated with the resonance region. The
inclusion of a second propagating mode in the resonance region removes
the singularity from the wave equation but raises the order of the equation
from second to fourth. The additional wave can be the shear Alfven wave
It can also be one of the family of hot plasma modes known as Bernstein
waves. These are predominantly electrostatic waves winch propagate for
a small range of angles around ninety degrees to the equilibrium magnetic
field at harmonics of the ion and electron cyclotron frequencies
For the hot plasmas characteristic of tokamak discharges the Bernstein
waves are usually the most important For example, in the vicinity of
the two-ion hybrid resonance, the incident fast wave couples to an ion
hybrid wave (which belongs to the ion Bernstein family) rather than to
the shear Alfven branch when the plasma beta is greater than the electron
to ion mass ratio. An example of such a coupling mechanism is illustrated
schematically in Figs 5 7 2(a) and (b) which show the (co, k±) diagram in
the vicinity of the upper hybrid resonance for the extraordinary electron
cyclotron wave (X-mode) propagating across the equilibrium magnetic
field with n II =0.
In Figs 5.7.2(a) and (b) the X-mode is shown to bifurcate in the
vicinity of the upper hybrid resonance, &>uH/<^ce = V2 for cope/coce = 1-
The bifurcation is caused by the coupling of the X-mode to an electron
Bernstein (upper hybrid) wave. All Bernstein waves have cut-offs at
harmonics of the cyclotron frequency except the one at a hybrid frequency.
In the short wavelength limit, all Bernstein waves, including the hybrid
wave, are resonant at a cyclotron harmonic.
Although Figs 5.7 2(a) and (b) have been obtained from a uniform
plasma model, they can be used to interpret the behaviour in an inhomo-
geneous plasma. This can be done by considering a wave launched

5 7 Physics of radio frequency heating
Fig. 5 7.2 Full wave properties of
X-mode propagating perpendicular to the
magnetic field in the vicinity of the upper
hybrid resonance (a) X-mode launched
towards the upper hybnd resonance from
the low-field side (b) X-mode launched
from the high-field side In both cases
'i'pe/'i'ce = 1, and the Roman numerals
give the causal sequence
Reflected X-mode
Incident_X-rriode
Mode converted
" electron Bemstem
Transrnitted ~~*~-iX.^ ^ wave
X-mode
Mode converted
electron Bernstein
wave
across a tokamak discharge by an antenna outside the plasma The source
supplies power at a fixed frequency which is transmitted through the
inhomogeneous plasma where the equilibrium quantities vary as a
function of the radial coordinate. As the wave propagates into the plasma
It will be subject to an increasing toroidal magnetic field As it travels
across the magnetic field, the ratio &)/&>ce will therefore decrease This
charactenzes waves travelling from the low field to the high field side of
a tokamak Conversely, for a fixed frequency wave propagating from the
high field to the low-field side, &>/&>ce will increase
A wave incident from the low-field side will thus correspond to a point
moving down the dispersion curve in Fig 5 7 2(a) The causal sequence
of events is shown by the Roman numerals (i)-(iv) The incident X-mode
starts at point (i) On reaching the vicinity of the upper hybrid resonance
the wave is partially transmitted, (ii), and partially mode converted to an
upper hybrid wave (also (ii)) The fraction of the incident X-mode energy
which IS tiansmitted across the resonance region is denoted by T and,
assuming both waves are undamped in the coupling region, a fraction
1 — r IS converted to the upper hybrid wave. The upper hybrid wave
then encounters its cut-off where it is reflected (iii) and returns to the
coupling region For this crossing it is the upper hybrid wave which is the
incident wave However, the transmission coefficient is independent of
the direction of travel or of the wave mode for a given coupling Therefore,
a fraction T of the incident upper hybrid energy A — 7) is transmitted on

5.7 Physics of radio frequency heating 267
the upper hybrid branch (iv) and the remainder 1 - 7 - 7A - 7) is mode
converted to an X-mode (iv) which returns to the low-field side as the
reflected wave. The net result is that a fraction T of the incident X-mode
IS transmitted, a fraction A — 7)^ is reflected and a fraction 7A — 7) is
mode converted Since the mode converted upper hybrid wave remains in
the plasma, this energy is equivalent to the absorbed energy even though it
was assumed that the waves are undamped in the coupling region. Clearly
the energy gained by the upper hybrid wave has been lost by the incident
wave It can also be verified that the total wave energy is conserved
When the upper hybrid region is well separated from the cyclotron
resonances, which will be the case when &)pe ~ &>ce> the waves will be
undamped in the resonance region The mode converted upper hybrid
wave will then be absorbed at the fundamental electron cyclotron
resonance by a relativistic wave-particle cyclotron interaction This will be
discussed in Section 5 10
The case where the X-mode is incident from the high field side is
illustrated in Fig 5 7 2(b) Here, the incident wave is shown moving in
the direction of increasing a)/a)ct, (i) For this situation there is clearly
no reflection since the mode converted upper hybrid wave travels away
from the cut-off directly to the fundamental resonance This is the reason
for the asymmetry in the reflection coefficient Thus, a fraction 7 is
transmitted and a fraction 1 — 7 mode-converted or equivalently absorbed.
The Roman numerals in Fig. 5.7 2(b) again show the causal sequence It
IS clear that the key quantity for the above phenomena is the transmission
coefficient 7. This must be calculated from a solution of the relevant
differential equation in the resonance region, and can be obtained from
theories of varying levels of complexity. The simplest is the second-order
Budden equation 5 7 8. More complicated fourth order^Systems yield the
same value for 7 as the Budden equation. If detailed information on the
Bernstein waves is required then a fourth-order system must be solved.
Wave-particle collisionless dissipation
The above qualitative discussion of the upper hybrid resonance illustrates
the nature of the physical phenomena which occur in the resonance region
This description of the upper hybrid resonance will be used as a reference
model when the resonance phenomena of each of the principal heating
schemes are described. The extension of such models to include the effect
of collisionless wave dissipation in the resonance (coupling) region will
also be described.
The collisionless dissipation of an electromagnetic wave for ion
cyclotron, lower hybrid and electron cyclotron heating schemes is
governed by the wave-particle resonance condition
0) - ^v\\j ~ l\(jo^j\ = 0 5.7 10
where £ = 0,1,2, 3 . The Landau (or Cerenkov) resonance condition
IS given by £ = 0 For this resonance, wave energy is transferred to the

5.7 Physics of radio frequency heating
parallel degree of freedom of the resonant particles by the component
of the electric field parallel to the equilibrium magnetic field. Electron
Landau damping is significant for lower hybrid waves and for the fast
wave in the ion cyclotron range of frequencies Wave energy can also be
transferred by the component of the wave magnetic field parallel to the
equilibnum magnetic field through the mechanism known as transit time
damping (or magnetic pumping) under the Landau resonance condition
Transit time damping is significant for the fast wave in the ion cyclotron
range of frequencies and makes a contribution to the direct electron
dissipation of this wave which is comparable to that due to electron Landau
damping.
In all these cases the parallel phase velocity of the wave is required
to be resonant with electron velocities Both the lower hybrid wave and
the fast wave can have parallel phase velocities ranging from the electron
thermal speed to the velocity of light. Hence, these waves can couple to
both thermal and superthermal electrons making them relevant to heating
and current drive.
On the other hand £ 7^ 0 corresponds to electron or ion cyclotron
resonance. For these cases it is the perpendicular energy of the resonant
particle which is increased An important point to note is that, unlike
the Landau resonance, a particle can be in cyclotron resonance with a
wave irrespective of whether it is slow or fast {a)/k\\ < c or a)/k\\ > c)
The condition to be satisfied by a cyclotron resonant particle is, from
eqn 5.7 10
For i > 0, the resonance is sometimes referred to as the normal Doppler
resonance and requires a particle with a parallel velocity less than the
parallel phase speed. The particle may even be travelling in the opposite
direction to the wave depending whether it is in resonance on the high-
field or low-field side. For £ < 0, the resonance is known as the anomalous
Doppler resonance. In this case the parallel velocity of the particle must
be greater than the parallel phase velocity of the wave Hence, a particle
may only come into anomalous Doppler resonance with a slow wave The
anomalous Doppler resonance has the interesting property that the flow
of the energy takes place from the parallel motion of the resonant particle
to both the wave and the perpendicular degrees of freedom of the particle.
It IS useful to distinguish between the cold plasma resonances
discussed at the beginning of this section and wave-particle resonances The
physical significance of a cold plasma resonance becomes clear when
thermal corrections are included It is then found that the resonance is
replaced by a mode conversion to another wave branch which propagates
as a result of the thermal effects. Since a natural wave mode of a plasma
IS supported by all the particles of at least one species, it is clear that
the response of the plasma at a resonance will involve all the particles
of at least one species On the other hand, it has just been noted that a

5 7 Physics of radio frequency heating 269
wave-particle resonance is associated with a small sub-set of resonant
particles of one species.
However, a wave-particle resonance does result in the dissipation of
wave energy whereas a cold plasma resonance does not, by itself, produce
dissipation. The energy which is mode converted from the launched wave
to the hot plasma mode at a plasma resonance will eventually propagate
to a region where the wave satisfies the conditions for a wave-particle
resonance and the wave is then damped A cold plasma resonance will have
its most pronounced effect when it is situated at a position which is well
separated from wave-particle resonances (see Section 5 8) There are also
hot plasma resonances where mode conversion can occur such as the
second harmonic cyclotron resonance However, these harmonic resonances
are always associated with the corresponding harmonic wave-particle
resonance which will result in local dissipation except for the case, of
perpendicular propagation For the electrons local dissipation occurs even for
exactly perpendicular propagation This will be discussed in Section 5 10
For each of these collisionless absorption mechanisms, only those
particles which have the velocity required by the resonance condition
will gain energy from the wave. For a given collisionless absorption
mechanism the evolution of the plasma depends on the collision rate
and the power input. Since the resonant particles are a small sub-set
they will collide mainly with non-resonant particles. If these collisions
occur sufficiently rapidly the Maxwellian distribution is preserved, the
power absorption is maintained and bulk heating results. If the power
level IS increased, collisions may be too infrequent to maintain a thermal
distribution and a hot tail can develop.
A small population of energetic particles can have both beneficial and
deleterious effects. Energetic ion tails produced by minority ion cyclotron
heating can reach energies of 1 MeV and above. Provided they are
confined, these tails eventually relax by colliding with the bulk electrons.
Hence, strong ion cyclotron heating can result in bulk electron heating.
For some applications, such as radio frequency current drive and tail-
enhanced non-thermal fusion schemes, the creation of a superthermal
population is advantageous.
Evolution of the equilibrium distribution function
The evolution of the equilibrium distribution function under the
simultaneous influence of radio frequency heating and collisional
relaxation can be described by a modified Fokker-Planck equation:
~=Cif) + Qif), 5.7 12
ot
where C(/) represents Coulomb colhsions as discussed in Sections 2.10
and 2.12, and Q{f) describes the interaction of the radio frequency fields
with the resonant particles and is referred to as the quasi-linear term. The
quasi-linear interaction is the lowest-order nonlinear effect obtained by

5.8 Ion cyclotron resonance heating
averaging the nonlinear terms in the kinetic equation over a number of
wave periods in space and time, and yields the time evolution of the
equilibrium distribution function on a time scale long compared with the time
period of the radio frequency fields. The term quasi-linear is used because
the perturbed distribution and electromagnetic fields are taken from linear
theory. Mode coupling and higher-order nonlinear effects are neglected.
Quasi-linear theory was first derived for an unmagnetized plasma and was
later generalized to a magnetized plasma. For a magnetized plasma the
distribution function is also averaged over the gyro-phase angle in
velocity space. The quasi-linear term Q{f) is proportional to the intensity of
the incident electromagnetic wave and contains S{cti — ki\v\\ — i\cocj\),
under an integral over fe|| for the uniform magnetic field under discussion.
The latter dependence is simply an expression of the fact that only the
resonant particles are directly influenced by the wave.
In the general case, the solution of eqn 5.7.12 represents a formidable
computational problem. However, there are situations where a simplified
description can still represent the most important features of the
problem. One such case is that of fundamental ion cyclotron heating of a
minority ion species. For this situation, eqn 5.7.12 can be reduced to
a one-dimensional differential equation in velocity space for the heated
(isotropic) minority ion distribution function. This will be described at
the end of Section 5.8.
ion cyclotron resonance heating
The resonance frequency of a deuteron in a magnetic field of 5 T is
38 MHz. In a tokamak, the toroidal field falls off with major radius as
R~' and the ion cyclotron resonance is localized at a value of R for which
the wave frequency, co, satisfies co = codiR)- The resonance is subject to
Doppler broadening, resulting in a resonance width Sx = {ki\vri/cod)R-
In all practical cases this is much smaller than the plasma dimensions.
Ion cyclotron resonance heating has therefore the desirable feature that
the absorption region can be positioned simply by matching the wave
frequency to the known toroidal field.
Ion cyclotron heating in tokamaks relies on the fast magnetosonic
(compressional Alfven) wave to transport energy from the antenna to
the absorption region. The fast wave is the only wave in this frequency
range which can propagate directly across the magnetic field, requiring
only that the density be above the cut-off density, which is defined in the
next paragraph. The ion cyclotron (shear Alfven) wave is not suitable for
ion cyclotron heating of tokamaks. There are two main reasons for this.
The first is that it will not propagate above the ion cyclotron frequency
and would therefore have to be launched from the high field side of the

5.8 Ion cyclotron resonance heating 271
tokamak. Second, even in this case it would not penetrate beyond the
edge plasma due to mode conversion to an electrostatic wave.
The propagation of the fast wave can be described by means of the
approximate dispersion relation
n\ = is± + isxy - n^)(£x - is^y - n^)/(£x - nj). 5.8.1
Equation 5.8.1 can be obtained from eqn 5.6.1 by retaining only terms
proportional to £|| since £|| ;>> £x, Sxy,n\. Physically, this means that £1
is neglected compared with E±, where ^n and E± are the amplitudes of
the fast wave electric fields parallel and perpendicular to the equilibrium
magnetic field. This is a good approximation in the ion cyclotron range
of frequencies and requires co^ <^ &)?g.
Forthecentralregionsofatokamakdischarge,me/m, <§; &>L/&>cg < 1.
It therefore follows that co'^^ > &)^;. In the ion cyclotron range of
frequencies, co ~ coci and therefore the contribution of the
electrons to s± is negligible. Thus, for the cold plasma description,
s± ~ ~J2r '^p;/('^^ ~ '^c/)- However, the electrons do make a
contribution to Sxy. Using the condition of charge neutrality, which can be
written as coI^/cocq — JZ/ ^^jl^cj where the summation over j refers
only to the different ion species, the electron contribution to Sxy can be
included in the ion term. The result is £x3. — — X), i<^p/<^/<^c7(<i>^ —&>^,).
Substituting these expressions for £x and Sxy into eqn 5.8.1, the fast
wave dispersion relation can be written as
nj_ = = 2 T • 5.8.2
It can be seen from eqn 5.8.2 that n\ = 0 when the first bracket on
the right-hand side of this equation is zero. This gives the fast wave
cut-off condition, JZ; ^\jl(^cj{'^ + (^cj) = nj- For a pure deuterium
plasma and a wave frequency co ~ 2&)cD the above condition reduces
to &)pQ > OlSc^kj where copo and &)cD are the deuteron plasma and
cyclotron frequencies. A typical value of fey set by antennas in large
tokamaks is ~ 5 m~' so that for such an experiment the fast wave would
only propagate for electron densities He > 2 x lO'^m"^. The significance
of this result is that the fast wave is evanescent at the antenna which must
therefore be placed within a few centimetres of the cut-off density for
efficient couphng.
In the centre of a tokamak plasma, cti^-/(cti^ ~ ^lO ^ "r However,
as discussed in Section 5.7, for a two-ion species plasma the hybrid
resonance occurs when J^i '^p//(<^^ ~ <^c/) ~ ^- Thus, in the vicinity
of the hybrid resonance, the denominator of eqn 5.8.2 can vanish and

5.8 Ion cyclotron resonance heating
Ion-ion hybnd
resonance
Cut-off
surfaces
Minority cyclotron
resonance
Fig. 5.8.1 Loci of cut-off and
lesonances in the poloidal cross-
a tokamak. The fast wa
the hatched regions.
Fig. 5.8.2 Contoui of the wave power
flow emitted by an antenna located on tb
low field side Refracti
power near the centre of the
n± -» oo. Wherever there is a resonance, there must be an associated
cut-off, n± = 0, and this is given by the vanishing of the second bracket
in the numerator of eqn 5.8.2. A poloidal cross section of the cut-off and
resonant surfaces of the fast wave is shown in Fig. 5.8.1. The hatched
regions denote zones of evanescence. Also shown in the figure is a
resonance of a minority species which occurs along a vertical chord. The
relationship between a hybrid and minority resonance is discussed in the
next subsection.
Since the wave can propagate directly across the magnetic field, the
illumination of the resonance surface depends on the poloidal location of
the antenna. Generally the antennas are located near the equatorial plane
on the low field side so that the intensity of the wave has its maximum
value on the central part of the resonance surface. This results in peaked
power deposition profiles which favour the achievement of high heating
efficiency. Such an antenna arrangement is illustrated in Fig. 5.8.2 which
shows the power flow refracted to the centre of the minority resonance
surface by the plasma.
In a single ion species plasma the damping of the fast wave is weak
at the fundamental resonance due to the fact that the electric field rotates
almost entirely in the opposite sense to the ions. However, at the second
harmonic resonance {co = 2coc\) in a single ion species plasma, or in the
presence of a second ion species, a significant fraction of the
perpendicular electric field possesses the polarization required to couple to the
ions. As a result the main heating scenarios for the ion cyclotron range
of frequencies are the second harmonic and minority schemes.
Heating regimes in a two ion species plasma
There are two regimes of heating m a two ion species plasma. The two
regimes are differentiated by the ratio of the densities of the ion species.
In the first regime, referred to as minority heating, the two-ion hybrid
resonance does not occur. In the second scheme, the mode conversion
regime, the two-ion hybrid resonance is present.
The minority ion concentration is defined by the ratio, ij = nmm/'^maj,
of the densities of the minority and majority ion species For very low
minority ion concentrations, r] < 0.1%, the fast wave will undergo
weak cyclotron damping at the minority fundamental resonance. As
the minority concentration is increased the damping is increased until
the absorption reaches a maximum value at a critical concentration ijc.
For further increases of the minority concentration beyond this critical
value the hybrid resonance occurs and the wave polarization becomes
less favourable for cyclotron damping in the vicinity of the minority
resonance. In addition, the cut-off associated with the hybrid resonance
produces strong reflection of the fast wave. Because the hybrid cut-off
IS on the low-field side of the hybrid resonance, the fast wave must be
launched from the high-field side of the tokamak to propagate unimpeded
to the resonance. On the other hand, the minority resonance (for a light
ion minority) is accessible with a low-field side antenna.

Ion cyclotron resonance heating
273
@=@
Fig. 5.8.3 Plot of the square of the fast
wave perpendicular refractive index as a
function of major radius (a) minority
concentration is below the cntical value,
r] < r]i: and the ion-ion hybnd resonance is
not present, (b) minority concentration is,
above the critical value, r] > r]c and the
lon-ion hybrid resonance is present
The two regimes are illustrated by the dispersion diagrams shown in
Fig. 5.8.3. In Fig. 5.8.3(a) the concentration ratio is less than the critical
value with the result that there is no hybrid resonance and the fast wave
is able to propagate everywhere between the fast wave cut-offs on the
high and low field sides. The wave is most strongly damped on the high
field side of the minority resonance where the wave polarization is most
favourable. In Fig. 5.8.3(b), the concentration ratio is above the critical
value and the hybrid resonance and cut-off now appear. The minority
resonance is still accessible from the low field side but the damping decreases
as T] increases due to the less favourable polanzation. A wave launched
from the high field side will be mode converted to an ion hybrid wave at
the hybrid resonance and will damp on electrons due to electron Landau
damping. When the separation of the hybrid resonance and cut-off is not
too large some of the fast wave energy excited by a low field side antenna
can tunnel through the evanescence zone to the hybrid resonance and
undergo mode conversion. However, there is an upper limit of twenty
five per cent to the fraction of energy incident on the hybrid cut-off which
can be mode converted in a single transit compared to one hundred per
cent from the high field side. When the hybrid resonance occurs, minority
heating schemes can still be operated with a low field side antenna, but
the absorption at the minority resonance will be weakened and strong
reflection will be produced at the hybrid cut-off.
The effect of the hybrid resonance on fast wave heating is demonstrated
in Fig. 5.8.4 which gives results from experiments performed on the TFR
tokamak which had an antenna on the high field side. In each figure the
position of the hybrid and minority (proton) resonance is shown together
with the neutron counting rate which gives a measure of die heating. The
counting rate is only high when the hybrid resonance is at the centre
of the discharge, as in Figs 5.8.4(a) and (c). In Fig. 5.8.4(b), when the
proton resonance is at the centre but the hybrid resonance is at the edge,
the counting rate is low. This indicates that for the mode conversion
regime, it is the position of the hybrid resonance which is vital for strong
absorption, and also that the minority ion cyclotron damping is weak.
In order to understand how the two regimes of heating arise in a two-ion
species plasma and to obtain a quantitative theory of cyclotron damping
it is necessary to take account of the kinetic response of the minority ion
species. For the present discussion, only the kinetic modification to the £x
element of the dielectric tensor is required. The cold plasma expression
given by eqn 5.6.2 is replaced by
>i
^p2
{CO
)ly) l4l(^k\\VY2
[Z(Z12) + Z(Z_12)]
where the subscripts 1 and 2 refer to the majority and minority ion species
and vi2 IS the minority ion thermal speed, wxi = {Tj/mj)^/'^ and Z, zn
and z^n are defined below. The vacuum and electron contributions to
eqn 5.8.3 have again been neglected. It should also be noted that only the
effect of the thermal motion of the minority ions along the equilibrium

5.8 Ion cyclotron resonance heating
1(a)
100 150 ^
Fig. 5.8.4 Effect ofnu/no on the
neutron rate at different values of the
magnetic field m 'low density' plasmas.
Strong absorption (high count) only occurs
when the ion-ion hybrid resonance is at
the centre of the discharge. [Adam J. and
Equipe T.F.R., Proceedings of 9th
European Conference on Controlled
Fusion and Plasma Physics, Oxford 1979,
Invited Papers, UKAEA Culham
Laboratory, p. 355.]
magnetic field is included The effect of finite ion Larmor radius, which
IS important for second harmonic resonance, has been neglected.
The function Z(z) appearing in eqn 5 8.3 is known as the plasma
dispersion function and was first obtained by Landau in his theory of the
collisionless damping of electron plasma waves in unmagnetized plasmas.
The plasma dispersion function is defined as
Z(z) =
■ exp(-f2)df
: it~z)
5.8 4
where C is known as the Landau contour and was chosen in order to
satisfy causality requirements. In other words, the Landau contour is such
that there is no response until the field has been switched on, ensuring
that the cause must precede the effect This choice of contour provides
a prescription for integrating around the singularity which occurs on the
real f-axis and which yields the collisionless damping decrement The
plasma dispersion function, which is a complex function, even for a real
argument, has been tabulated by Fried and Conte This function always
anses in a kinetic description of wave phenomena in hot plasmas.
In eqn 5.8.3 the arguments of the plasma dispersion function are ? 12 =
(co + coc2)/V2kiivj2 and Z-n = (co - cod)/V2k\\VT2 Since co and cod
are both defined as positive quantities, Z12 > 1 On the other hand.

5.8 Ion cyclotron resonance heating 275
for the spatially varying equilibrium magnetic fields relevant to tokamak
plasmas, z-u can pass through zero when co = coc2-
The plasma dispersion function can also be written as
Z(z) = -2e"' / exp(f2)df+ 171^/2 expC-z^) 5.8.5
which IS valid for a real argument and shows explicitly the real and
imaginary parts of the function. It is clear from eqn 5.8.5 that when z > 1
the imaginary part of the function is negligible Under these conditions
the function can be expanded asymptotically as Z(z) ~ — 1/z. Thus, in
eqn5.8.3, (&)p2/2<i>fc||WT2)Z(zi2) ~ —&)p2/2&)(&) + &)c2)-This is referred
to as the non-resonant part of the minority ion response and describes
those minority ions which do not come into cyclotron resonance with the
(fast) wave The minority ion temperature does not appear in the non-
resonant response which can therefore be obtained from a cold plasma
model For low minority ion concentrations the non-resonant response
can be neglected.
The resonant minority ion response is described by the term
(&)p2/2&)fe||i;x2)Z(z_i2) in eqn 5.8.3 for which the exact plasma
dispersion function must be retained. The physical significance of the resonant
argument, z_i2, is that it is the ratio of the parallel velocity of a resonant
ion to the minority thermal speed Once this ratio exceeds about three
for a thermal population of minority ions the number of resonant ions
rapidly becomes negligible Since &)c2 is spatially varying, (co — coc2)/k\\
can match the velocities of thermal minority ions as well as more
energetic ones
The critical minority concentration
The above account of the thermal effects of the minority ions can be
used to explain how the critical concentration ratio of the two ion species
arises. Refemng to eqn 5.8 1, it can be seen that the fast wave will have a
resonance when s± — n}:=0. For a single ion species plasma, s± > n? in
the centre of a tokamak discharge. However, as discussed in Section 5,7,
£x = 0 at the two-ion hybrid resonance which can occur at the centre
of the discharge. Thus, s± — nl = 0 can be satisfied at the centre of a
tokamak plasma near to the two-ion hybrid resonance.
The condition for a resonance of the fast wave, allowing for the parallel
thermal motion of the minority ions is therefore given by
^P2
(co^-col^) " 2V2cok\iVT2
When cold plasma theory is used to describe the minority ions, their
response becomes singulai- a.s co ^- coc2, with the result that the minority
response can always balance that of the majority ions, no matter how low
the mmonty density. However, the minority ion response, given by the

5.8 Ion cyclotron resonance heating
third term in eqn 5.8.6, is no longer singular as co ^ coci (or z-n -^ 0).
Hence, for low minority concentrations, the minority response cannot
balance the majority response. Furthermore, the minority response
contributes an imaginary term corresponding to minority damping. In other
words, cold plasma theory breaks down for low minority concentrations.
In Sections 5.6 and 5.7 the propagation of an electromagnetic wave
through an inhomogeneous tokamak plasma was approximated by a one-
dimensional slab model in which the direction of the inhomogeneity
represented the radial coordinate. For the present discussion, the only
inhomogeneity which need be considered is that of the magnetic field
which is assumed to vary as B(x) = Bo(l — ^/R) where R is the major
radius. Taking co = &>c2@), the resonant argument, Z-12, of the plasma
dispersion function in eqn 5.8.6 is given by z_i2 = cox/y/2k\\Vj2R- The
condition for a resonance of the fast wave, given by eqn 5.8.6, yields the
position of resonance, x = Xres- Since Re Z(z_i2) < 0 for z_i2 > 0 and
Re Z(z-i2) > 0 for z-12 < 0, the (hybrid) resonance can only occur
on the high field side of the minority ion cyclotron resonance where
X < 0. A further condition to be satisfied for resonance of the fast wave
isImZ(z_i2) <S^ 1 which requires Iz-nl ^ 1-
Solutions of eqn 5.8.6 are illustrated in Fig. 5.8.5. This figure has been
obtained by writing eqn 5.8.6 in the alternative form.
Z(Z_12) :
_ 2kiivj2mi
Tf] 0) m2
[(l-a2)^" a>2 J
5.8.7
where a — Z\m2lZ2m\. The real part of Z is shown as a function of
z-n in Fig. 5.8.5. The quantity on the right-hand side of eqn 5.8.7 is
independent of z-\2 and is therefore represented by a horizontal line in
Fig. 5 8.5 whose height above the z_i2-axis is governed by the size of
T] for given ion species and minority temperature. Three horizontal lines
are shown corresponding to three values of the minority to majority ion
density ratio r]. For r] < ijc, there is no intersection of the horizontal
ReZ(z_,,)
Fig. 5.8.5 Plot of eqn 5 8 7 The curve
shows Re Z(z 12) The three honzontal
hnes represent the nght-hand side of the
equation for three different mmonty
concentrations Intersections of the
honzontal line with Re Z(z_ 12) produce
the ion-ion hybrid resonance when
ImZ(z_i2) « 1 at their
12 3 4 5 6 -12

5.8 Ion cyclotron resonance heating 277
line with ReZ(z_i2) and hence no resonance. This is called the minority
regime, shown in Fig. 5.8 3(a). For r] > ijc, the horizontal line intersects
Re Z(z~i2) twice, once for Iz-iil < 1 and once for \z-i2\ > U making
a resonant solution possible. This is referred to as the mode conversion
regime, shown in Fig. 5.8.3(b). For ?? = ijc, the horizontal line is tangent
to the curve, Re Z(z_i2). This condition marks the transition between the
two regimes
The physical interpretation of Fig. 5 8.5 is as follows. The argument
z_i2 IS proportional to the distance from the position where the fast wave
frequency is equal to the fundamental minonty ion cyclotron frequency.
For low minority ion concentrations ij < ijc, the condition for fast wave
resonance, eqns 5.8.6 or 5 8.7, cannot be satisfied For rj > r]c, there are
two possible positions where the resonance conditions could be satisfied.
The first position is close to the minonty ion cyclotron resonance where
Im Z is significant and is therefore ruled out. For the second position •=
where |z_i2| > 1, resonance of the fast wave is possible. The larger the
value of Iz_ 121, the smaller the value of Im Z and the stronger the effect
of the resonance. The increase in the magnitude of |z_i2| is equivalent
to an increase in the separation of the two-ion hybrid resonance from the
minonty cyclotron resonance. The former is a region of mode conversion
and weak ion damping and the latter a region of potentially strong, wave-
particle, ion cyclotron damping. The larger the value of the minonty to
majonty concentration ratio the larger the separation of the hybrid from
the minonty resonance. The cntical concentration, r] = r]c, illustrated
by the tangent line in Fig. 5.8.5, gives the condition j^here hybnd
resonance first becomes possible. However, the effect of hybrid resonance,
namely mode conversion, will not be strong for r] = rjc because there will
be strong cyclotron damping under these conditions. In fact, minority
absorption is close to its maximum value for r] = rjc- As r] increases
beyond the critical value r]c, the minonty damping region occurs further
from the hybrid resonance and the influence of the hybrid resonance
increases.
The critical density ratio which marks the beginning of the transition
between the two regimes of heating can be obtained from eqn 5.8.7 by
using the fact that the maximum value of Re Z is approximately unity.
Thus
_ 21qVT2_m_
CO m2
[(l-a2) ^ &,2 J
which shows that the occurrence of the two-ion hybrid resonance requires
higher minority concentrations as the minority temperature is increased
or as the parallel wave number is increased, both of which result in an
increase in minority ion cyclotron damping.
As a specific example, consider the case of a deuterium plasma with
a hydrogen minonty which is often denoted as D(H). When the
minority density is above the cntical value, a full-wave calculation for the
propagation of the fast wave across the two-ion hybrid resonance gives

Ion cyclotron resonance heating
a transmission coefficient
T = exp(-u??&)CH^/4cA) 5.8.9
where r] = hh/^d and ca is the Alfven speed corresponding to the
deuterium plasma. The expression for T given by eqn 5.8.9 has been obtained
by neglecting the weak damping in the region of the hybrid resonance.
In general there will still be cyclotron damping in the vicinity of the
hydrogen minority fundamental resonance. For typical JET parameters.
Bo = 3.4T, i? = 3 m, no = 5 X lO'^m-^ with hh/^d = 0.05 the
transmission coefficient T <^ \. This means that the fast wave energy
launched from the low field side which reached the hybrid cut-off would
be totally reflected Under these conditions the fast wave would be
subject to damping by the hydrogen minority both as an incident wave and
as a reflected wave. Conversely, fast wave energy reaching the hybrid
resonance from the high field side would be totally mode converted to an
ion hybnd wave.
For a D(H) plasma, the deuteron will also have a second harmonic
resonance which is degenerate with the hydrogen fundamental
resonance. Including the majority second-harmonic terms the transmission
coefficient is
{-il-f)"^
It IS clear from this result that the hybrid resonance will dominate the
second harmonic majority resonance provided r] > Pq where ySo =
2vj^/cj^. In a pure deuterium plasma the second harmonic resonance
has similar properties to the hybrid resonance. Thus, for large enough
values of ygp or small enough k\\, the fast wave will be mode converted to
an ion Bernstein wave for high field side incidence and reflected for low
field side incidence. Similarly, as fe|| is increased, the region of cyclotron
damping will eventually overlap the mode conversion region,
progressively increasing the damping and reducing the reflection from the low
field side.
However, there is still another possibility to consider in a plasma with
two, or more, ion species The discussion of mode conversion given above
IS based on the Budden model of a resonance and its associated cut-off
illustrated by Fig. 5.8.3(b), which shows the square of the
perpendicular refractive index of the fast wave as a function of the major radius.
This figure also shows the fast wave cut-off on the high field side of the
resonance. The effect of the high field side cut-off on the mode
conversion process had been ignored. It is now clear that this cut-off plays a
significant role in the conversion process. Thus, instead of two critical
points there are now three to consider, the fast wave cut-off on the high
field side, the ion-ion hybrid resonance and its associated cut-off This is
often referred to as a triplet configuration. Depending on the ion species
and the value of fey, conditions exist for which the reflected energy is

5.8 Ion cyclotron resonance heating 279
Fig. 5.8.6 (a) Time development of the
electron temperature at the
Shafranov-shifted axis from electron
cyclotron emission during mode
conversion heating m TFTR, with peak
ICRF power of 4 4 MW (b) Variation of
the radius, Rp, of peak electron power for
mode conversion heating dunng a scan of
the toroidal magnetic field Also shown is
the location of the mode conversion
surface [Majeski, R et al., Physical
Review Letters 76, 764 A996) ]
6^
4^
\h
nr
o
/ Plasma axis
A
1
^y
^n.?- = s
1
-8
1
36 40
B^{T)
reduced to zero. The incident fast wave is then totally converted to the
ion hybrid wave. It should be noted that for other values of k\\ the
converted energy is minimized and the reflected energy is maximal. For low
values of electron beta, the electron dissipation of the ion hybrid wave
IS significantly stronger than the electron dissipation of the fast wave.
Hence this mechanism can lead to enhanced electron heating and
possibly current dnve. Furthermore, as the absorption is associated with the
lon-ion hybrid resonance, which is a cold plasma resonance, this offers
the possibility of both on and off-axis heating and current dnve. It is also
worth emphasizing that mode conversion heating and current dnve uses
a low field side antenna.
Results from an expenment carried out on the TFTR tokamak are
shown in Fig. 5.8.6. The ICRF antenna launched a fast wave with a
parallel wave number k\\ ~ 10m~' for symmetnc phasing or 6m~'
with directed phasing for cunent dnve. The figure shows a doubling of
the central electron temperature and demonstrates that the peak electron

5.8 Ion cyclotron resonance heating
heating scaled with the position of the lon-ion resonance for a scan of
the toroidal magnetic field The on and off-axis currents derived from
differences in loop voltage were somewhat in excess of the theoretically
predicted currents.
Another version of fast wave heating has been proposed
specifically to produce non-inductive current drive in spherical tokamaks,
which achieve a higher plasma beta than conventional tokamaks. This
is called high harmonic fast wave heating which, as the name implies,
operates in a frequency range where o) > Qj. In a region of the
discharge outside an ion cyclotron harmonic resonance, the damping of
the fast wave is due to the electrons through the Landau resonance
andlmfcx/Refex ~ n'^I^P^^Q^ex^i-^^^) where y6e = 2iiQnT^/B^ and
Coe = ft^/feiifTe- Under conditions of high electron beta the electron
dissipation is strong so that both on and off-axis current drive appear to
be possible. For this application ion absorption is to be avoided. Under
conventional tokamak conditions, the ion damping at high ion cyclotron
harmonics {n > 5) would be negligible For the high beta conditions of
a spherical tokamak where values of n up to 20 can occur the damping as
the fast wave crosses many ion cyclotron harmonics can be significant.
This is because, for the low magnetic fields present in a spherical tokamak
the ion Larmor radius can be of the order or larger than the
perpendicular wavelength of the fast wave. For a deuterium plasma in NSTX with
a toroidal magnetic field ~0.25T, a density 5 x 10'^ m~-^, and a
harmonic number of n = 20, fe^p^ = 64Tq (keV). Hence, for a modest
deuterium temperature Tq = 0.5 keV, k]_p^ > 1. Although the high
beta conditions produce strong electron dissipation (through transit time
damping and electron Landau damping) the ion cyclotron damping can
also be strong. Strong electron or ion dissipation requires different ranges
of fe||. One of the challenges to high harmonic heating in a spherical
tokamak IS to design an antenna system which will result in a predominantly
electron absorption.
The ion cyclotron damping mechanism is due to those ions which
experience the wave electric field at the cyclotron frequency in their guiding
centre rest frame. The resonance condition is given in eqn 5.7.4. Since
the number of collisions experienced by resonating ions due to collisions
with the background species decreases with increasing energy, their
distribution function does not remain Maxwellian. Such distributions can be
calculated by solving the Fokker-Planck equation containing an
appropriate wave diffusion operator. The deviation from a Maxwellian distribution
can be substantial with a high energy tail extending above the thermal ion
energy by 1 to 3 orders of magnitude (up to several MeV in a large
tokamak).
Heated minority distribution function
Before describing the calculation of the heated minority ion distribution
function some further observations on the absorption mechanism and its

5.8 Ion cyclotron resonance heating 281
consequences will be given. Each wave absorption mechanism depends
on the properties of the particular wave and on the wave-particle
resonance. The properties of the wave are influenced by all the particles
in the plasma whereas the wave-particle resonance depends on a small
group of resonant particles.
Although the wave-particle resonance can be derived from a single
particle description, the net flow of energy between the wave and the plasma
can only be obtained by taking into account the equilibrium velocity
distribution of the resonant particles. This is because for any wave-particle
resonance, some particles gain energy from the wave and others lose
energy to the wave. For example, in ion cyclotron resonance a resonant
ion will receive an impulse mainly in the direction perpendicular to the
equilibrium magnetic field, and this impulse can be either retarding or
accelerating depending on the phase between the ion motion and the
wave. Averaging the ion impulses over all velocities, and assuming a
thermal distribution of the resonant particles, a net gain of energy by
the plasma is obtained. This causes an evolution of the heated particle
distribution as outlined in Section 5.7. In addition, for cyclotron
resonance, the resonant particles are constrained to move along certain paths
in velocity space. In the non-relativistic limit, these paths are given by
the circles.
where C is a constant. This result is easily obtained/ as follows. The
change in energy SE of a. non-relativistic, resonant particle is given by
SE = mv±Sv2, + mv\\Svn. 5.8.12
However, from quantum mechanics, this gain in energy must be equal to
the energy lost by the wave SE = hco where co is the wave frequency and
h is Planck's constant divided by 2n. Since the wave has a parallel wave
number k\\, it also loses parallel momentum, pp = hk^ which is gained
by the resonant particle. Hence
SE 0)
SE\\ ~ feijUji
giving
(jomSvv,
Combination of eqns 5.8.12 and 5.8.13 gives

5.8 Ion cyclotron resonance heating
Integration of eqn 5.8.14 immediately yields eqn 5.8.11. Making use of
the cyclotron resonance condition, eqn 5.8.14 also shows that Sv±/Sv\i =
^/kiiv± ;>> 1. It is important to emphasize that the velocity contours
given by eqn 5.8.11 only have physical significance when the cyclotron
resonance condition is simultaneously satisfied.
The distribution function for the heated, resonant ions can be
calculated starting from eqn 5.7.12. As already mentioned, this is a complicated
time dependent, nonlinear partial-differential equation in three spatial
and three velocity variables. In addition, the plasma is embedded in a
non-uniform equilibrium magnetic field. However, the problem can be
greatly simplified for the case of fundamental ion cyclotron heating of a
minority ion species. Since the minority ions relax collisionally on the
bulk electrons and ions, they can be treated as test particles. This means
that the Fokker-Planck term C(/), which involves the Coulomb
scattering potentials can be evaluated explicitly in terms of the bulk ion and
electron distribution functions which can be assumed to be Maxwellian.
The scattering term C(/) is independent of the test ion distribution
function. The problem is further simplified by assuming that the cyclotron
interaction occurs in a uniform magnetic field.
The Fokker-Planck equation given by eqn 5.7.12 is therefore reduced
to an equation for fiv±,v\\,t) where v± and Uji refer to the velocity
perpendicular and parallel to the uniform, equilibrium magnetic field.
It is convenient to express / in terms of spherical velocity coordinates
(u,^) where ^ = i; • Bo/\v\\Bo\. Since Legendre functions Piii^) are
eigenfunctions of the operator C(/) it is useful to expand / as a sum
of Legendre functions. Even though the Piii^) are not eigenfunctions of
Qif) this procedure is still very helpful since the expansion reduces
the partial-differential equation for f(v,^,t) to a coupled system of
differential equations f{v,t). In fact, the zeroth ^-moment yields
significant physical information and makes possible an analytic evaluation
of the heated, pitch-angle averaged minority ion distribution function
This was obtained by Stix who reduced eqn 5.7.12 to the following
magnetic-surface, pitch-angle averaged small Larmor-radius equation for
the evolution of f(v, t) for minority ions, assumed to be passing
particles, subject to fundamental cyclotron resonance heating and collisional
relaxation
^ = ^ \-av-f + ^f (^«V) + ^Hoy'-f] 5.8.15
dt v^ I 2dv 2 dv}
where a and y6 are the coefficients of the Fokker-Planck equation
discussed in Section 2.12 These diffusion coefficients have been represented
by analytic approximations The quantity Hqi comes from the quasi-
linear term and is given by Hqi = {P±)/2n^m.^ where (P^) is the radio
frequency power absorbed due to the fundamental minority ion cyclotron
resonance, averaged over a magnetic surface, and iis and nis are the
density and mass of the resonant ions on the magnetic surface. {Pj_) has been
assumed proportional to \E~^\^ where £+ = ^(ET^ + iEy) is the
component of the transverse electric field rotating in the same sense as the ions.

5.8 Ion cyclotron resonance heating 283
E~{= j{Ex - lEy)) and E^ have been neglected, as has the effect of
the parallel velocity in the quasi-linear operator. The final approximation
IS to assume that the radio-frequency pulse is of sufficient duration to
produce a steady state. Under these conditions 9//9f is set equal to zero
in eqn 5.8.15 and the following explicit solution for f{v) obtained
•" r.d + oL 7-/(i + R/ + {) ' "i
where a single species of background ion has been assumed, denoted by
subscript /,
C = {P±)ts/3nT„ Rf = nfZ}if/n,ie,
where
If = l/VlVT^, 4 = 1/^VTe
and
E = mv^/2, Ej :
with
mTf p^jl + Rf + m
' Mf [ 4 A+C) J
3/2)
n and m being the density and mass of the test ions and t^ the slowing
down time given by eqn 2.14.1.
The solution for f(v) given in eqn 5.8.16 allows an effective
temperature to be defined for each value of E, given by
Teff = -[d(ln/)/d£]~'. 5.8.17
For E <^ Ef, Tgff is somewhat above the background ion temperature.
For £ ;>> Ef, Teff approaches asymptotically the value 7^A+^), since for
these energies the wave-induced test ion diffusion is balanced by electron
drag. The theoretical distribution function given by eqn 5.8.16 has been
compared with data from minority ion heating experiments carried out
on PLT and JET. The PLT comparison is shown in Fig. 5.8.7.
At high energies, where the dominant slowing down process of the
minority ions is on the electrons, the minority ion distribution function
is expected to become anisotropic since the electron relaxation does not
involve angular scattering. Anisotropic minority ion distributions where

5.8 Ion cyclotron resonance heating
Fig. 5.8.7 PLT expenmental data for
hydrogen mmonty heating in a deutenum
plasma Hydrogen charge exchange
spectrum is shown together with
theoretical curve based on Zeff = 2.2 and
f = 13 8 [Rosea, J C et al, Physical
Review Letters 43, 1802 A979) ]
ln/(£)
20 30 40
Energy (keV)
the perpendicular energy exceeds the parallel energy will be generated
above a critical energy Ecnt given by
= 14.8re
where the summation is over the field (bulk) ions and Am is the atomic
number of the minority ions. Those ions with energies above Ecnt transfer
their energy to plasma electrons. Those with energies below Ecnt produce
bulk ion heating. The relative transfer of power to electrons or bulk ions
can be controlled by choosing the minority ion concentration.
It IS remarkable that such a simple model can describe the
experimental results so well. The cyclotron resonance interaction is described by
means of a uniform magnetic field model in contrast to the non-uniform
magnetic field of the experiment. For a uniform field a particle is either
never in resonance or always in resonance, whereas in the magnetic field
of the expenment particles are only in cyclotron resonance for a finite
time but many more particles can come into resonance than in the
uniform field case. Furthermore, the uniform field theory can only deal with
passing particles whereas strong ion cyclotron heating tends to push
resonant ions into the magnetically trapped regime. Such a case is illustrated
in Fig. 5.8 8, which gives a solution of the Fokker-Planck equation for a
tokamak magnetic field including the effect of both passing and trapped
resonant ions for second-harmonic cyclotron resonance of the bulk ions.
Finally, the distribution function given by Stix's theory is averaged over
a single magnetic surface whereas the expenmental distribution
functions were obtained from line-averaged measurements which include the
effects of many magnetic surfaces

5.8 Ion cyclotron resonance heating
Fig. 5.8.8 Contours of the steady state
ion distribution represented m midplane
velocity space coordinates (uyo, vj_q) for a
majority ion excited at its second harmonic
cyclotron frequency The oblique lines
mark the trapped-passmg boundary and
both figures show the accumulation of
heated ions which turn (have their banana
tips) in the resonance region A similar
result has also been obtained for
fundamental ion cyclotron resonance of
minority ions [From Kerbel, G D and
McCoy, M G , Physics of Fluids 28, 3269
A985)]
Fig. 5.8.9 Plots of f(v) versus E based
on eqn 5 8 16 for different levels (f) of RF
excitation at the mmonty-species cyclotron
frequency, with Zeff = 3 The ion velocity
distribution for injection at 200 keV into
the same plasma is also shown [Stix, TH ,
Nucleai Fusion 15, 737 A975) ]
0"'
0"^
0"^
o"^
^^"^--^...^mjection at 200 keV
K ^^~^~^--|
i^^^^^£^0 1
1\ ^^"^°
lU=io ^^^^
- k=o\
1 1 \ 1 1 1
100 150 200
A closely related problem is the calculation of the distribution function
for neutrally injected ions. In this case there is no quasi-linear driving term
but instead a source of monoenergetic injected ions at a given energy (see
Section 5.4) Solutions for the test ion distribution as a function of energy
for various levels of radio frequency power are shown in Fig 5 8.9. Also
shown in this figure, for companson, is the solution for a 200 keV deuteron
neutral beam injected into a 4keV tritium plasma
Summary of experimental progress
Ion cyclotron resonance heating by means of the fast wave has made
continual progress since the mid-seventies In 1979 the state of the art
was demonstrated on the TFR tokamak where 200 kW pulses of duration

5.9 Lower hybrid resonance heating
20 ms were injected with a high-field side antenna. This resulted in ion
temperature increases ~150eV at an average density of 3 x 10'^ m~^.
In 1980, with an upgraded TFR600, 500 kW were coupled producing
increases of both electron and ion temperatures ~200 eV At lower
density (~5 X 10'^ m~^) a temperature increase of 500 eV was obtained
However, increases of the plasma density, loop voltage, radiated power,
and impurity content were also observed By 1982 the level of injected
power in the ion cyclotron range of frequencies (ICRF) into TFR was
1 5-2 MW. At this power level the ion temperature saturated during the
radio frequency (RF) pulse due to the accumulation of metallic
impurities The electron temperature even began to decrease (after 25-30 ms)
during the pulse The limitation of the heating by impurity accumulation
observed on TFR is now thought to have been due to the small dimensions
of TFR and the lower single pass absorption
In 1984, 2.6 MW of ICRF from a low-field side antenna on PLT
produced a central ion temperature of 3.6keV at a central density of
5 X 10''^ m~^ A 7.2 MW, 10 s pulse was coupled to JET in 1986, also
with a low-field side antenna The best heating occurred with the minority
fundamental resonance on axis. In 1988,18 MW of ICRF power was
coupled to JET discharges producing central electron and ion temperatures
of 11 5 and 8 keV respectively
Ion cyclotron heating on JET has not been limited by impurity
accumulation as It was in TFR Nevertheless the production of an H-mode
plasma by ICRF alone and the coupling of large amounts of ICRF power
to such discharges was not achieved until the RF induced influx of
impurities had been significantly reduced This has been brought about by
the introduction of beryllium as a wall and limiter material. Of equal
importance has been the covering of the nickel Faraday screens for the
antenna by beryllium Impurity release has also been found to depend on
the antenna phasing The dipole antenna in combination with a beryllium
screen reduces the beryllium influx to negligible proportions The
reduction of RF produced impurities in JET has been one of the most significant
developments in the subject of ion cyclotron heating allowing very
successful operation of high power ICRF heating with good prospects for
future large tokamaks
Lower hybrid resonance heating
Lower hybrid resonance heating utilizes electromagnetic power in the
frequency range 1-8 GHz. At 3 GHz the vacuum wavelength is 0 1 m
thus allowing the energy to be transmitted and launched by means of
wave guides operating in their fundamental mode. This is one of the
principle advantages of this scheme

5.9 Lower hybrid resonance heating
The lower hybrid range of frequencies satisfies co^i <^ co <^ coce
Propagation in this frequency range is again well described by eqn 5 6 1
where the dielectric tensor elements are approximately
The use of lower hybrid waves was originally proposed with the object
of heating the ions. For this purpose it is essential to choose conditions
such that the lower hybrid resonance occurs in the plasma The condition
for this IS, from eqn 5 7 2,
A-2.3A,/VB„')
where nres is the election density at the lower hybrid resonance, A^ is the
atomic mass number of the ions, / is the frequency, and Bq is the magnef
field. Tokamaks operate in the range of densities 10'^ to 5 x 10^*^ m'"*
The frequency must be chosen so that nms matches the plasma density.
Thus, the location of the resonance which governs the ion absorption is
not completely under the control of the experimenter
However, bulk ion heating by lower hybrid waves has proved to be
problematic and unreproducible Nevertheless, interest in the use of lower
hybrid waves has increased very significantly since it was demonstrated
to be very effective in driving the equilibrium plasma current in a tokamak
discharge (see Section 3 13) As a result, most lower hybrid research has
concentrated on coupling the wave energy to electrorts rather than to ions.
For electron heating, a symmetric spectrum of n ^ is launched, whereas
for current drive an asymmetric spectrum is required
For electron coupling and current drive it is no longer essential for the
lower hybrid resonance to be present in the plasma. However, for lower
hybrid waves to reach the centre of the plasma the wave must be excited
with «|| > 1 Thus, in common with the fast wave in the ion cyclotro"
range of frequencies, the lower hybrid wave is evanescent at the edge e,.
the plasma requiring the lower hybrid antenna to be positioned close to the
plasma The antenna is required to excite the slow electromagnetic wave
in preference to the fast wave which does not have a resonance Since
the slow wave has a component of E parallel to the magnetic field it is
excited by aligning the wave-guide antenna with its short side parallel to
the toroidal field and using the appropriate transverse electric field (TE)
guide mode
Once the slow wave has tunnelled through the evanescent layer at the
plasma edge it is required to propagate unimpeded to the plasma centre
However, when the parallel refractive index is less than a critical value,
He, defined below in eqn 5 9 2, a confluence of the slow wave with the
fast wave occurs between the cut-off and the centre of the plasma Since
the slow wave is a backward wave (the group velocity is opposite in sign
from the phase velocity) conversion from the slow wave to the fast results

5 9 Lower hybrid resonance heating
Fig 5.9.1 Perpendicular refractive
index squared versus density for
(a)nil <ne,(b)«||=«cand(c)«|| > n.
in the energy being reflected Under these circumstances an additional
non-propagating region prevents the slow wave from penetrating further
into the plasma This is illustrated in Figs 5 9.1(a), (b), and (c), where
(a) shows the confluence of the fast and slow waves for n\\ < tic, (b)
shows the critical condition, tin ~ "c, where the two branches just touch,
and (c) where no confluence occurs and the slow wave propagates freely
to the centre of the plasma (or the hybrid resonance if it is present) For
the critical condition, the energy of the incident slow wave is divided
equally between the transmitted slow wave and the reflected fast wave
However, as soon as ti i is even a few tenths of one per cent below the
critical value, the transmitted energy becomes completely negligible and
total reflection occurs The critical value tic is given by the Stix-Golant
accessibility condition
"II
\-icol,/4c)r.si=nl)
5 9.2
In view of the above discussion this condition is very much an on-off
condition for a wave to reach the centre.
Another important characteristic of lower hybrid heating is that the
slow wave has the property that Wgx/wgn = ki\/k±, where Vg± and Ugi
are the perpendicular and parallel group velocities This means that the
energy does not go directly across the magnetic field but only reaches the
centre of the plasma (or the resonance, if it is present) after travelling a
number of times around the torus since k^ <^ k±
The standard method of exciting the required spectrum of ti n of lower
hybrid waves satisfying the Stix-Golant accessibility criterion, is the
lower hybrid grill launcher A simplified diagram of the gnll antenna
is given in Fig. 5 9 2. This shows an array of appropriately phased wave
guides arranged in two sets in which the small sides of the wave guides are
oriented to be parallel to the toroidal magnetic field. This arrangement
maximizes the coupling of the wave guide electnc field to the lower
hybrid wave The array is driven by klystrons, one for each wave guide,
all klystrons operating at the same frequency Two vertically adjacent
guides should be excited in phase and two horizontally adjacent guides
excited in quadrature The appropriate phase for each high power source
IS imposed at a low power level after the first amplifier The resulting ti^
spectrum is shown in Fig 5 9.2(b) in which the power is concentrated
around a value satisfying eqn 5 9 2 Because the group velocity of the
lower hybrid wave is predominantly in the toroidal direction there is no
need to use a number of launching structures around the torus. Thus,
unlike the cyclotron heating schemes, lower hybrid systems use a single
launching position
Since the original proposal for the grill antenna, lower hybrid
launchers have become increasingly sophisticated. As an illustration the lower
hybrid launcher on JET will be described. This consists of 384 wave
guides arranged in 12 rows with 32 wave guides in each row. The 12
rows are divided into 3 groups allowing the possibility of radiating three
different lower hybrid spectra simultaneously. Each of the 3 groups are

5 9 Lower hybrid resonance heating
289
Launcher
grill
n , n
XT
13
Power
spectrum
1.2 14 1.6 18 2.0 2.2 2.4
Fig. 5.9.2 (a) Schematic diagram of a
lower hybnd 'grill' antenna, (b) A typical
Founer spectrum for JET
sub-divided into 16 wave guides in a 4 x 4 array Each 4x4 array is fed
by one klystron, and the phase between the four horizontal wave guides
increases by 90° at each wave guide The four guides in the same column
have the same phase The next group of 16 wave guides may repeat the
previous phase change to give a periodic variation or it may advance or retard
the phase by 90° These three phase settings are referred to as A(p = 0,
90°, or —90° and give the three independent spectra referred to above
The lower hybrid launcher operates at a frequency of 3 7 GHz with
a maximum power of 15MW in the generator supplied in 20 second
pulses The grill is driven by 24 klystrons each one operating at 650 kW
and the surface power density at the plasma interface is 40 MW m~^ The
launcher is fed by transmission lines through a distance of 40 m
Lower hybrid coupling to the plasma is determined by the electron
density and its gradient in front of the launcher Hence, the distance
between the plasma and the antenna has to be adjusted This is facilitated
by curving the front ends of the wave guides toroidally and poloidally
to match the shape of the plasma surface. The system has independent
control of the launcher position and the plasma position. The launcher
can be moved radially over a distance of 210 mm during shots with a
maximum velocity of 100 mm s~ ^ Fast changes of the plasma parameter
in front of the launcher can be accommodated by a feedback loop acting
on the plasma position In practice, the launcher is only expected to be
moved radially by it 10 mm during a discharge The optimum coupling
occurs for an electron density in front of the launcher of 1 x 10^^ m~^.
Good coupling has been obtained with a reflection coefficient as low as
1 % In an H-mode discharge the lower hybrid system fefes driven a 1 MA
current with a reflection coefficient of ~3%
When the lower hybrid resonance is present in the plasma the
perpendicular wave number will increase as the wave approaches the resonance
This increases the coupling of the lower hybrid wave to the high ion
Bernstein harmonics due to finite Larmor radius effects The wave is
totally absorbed at the lower hybrid resonance If the resonance is not
present, the lower hybrid wave will still be subject to strong ion cyclotron
damping in a fusion plasma due to the presence of a-particles These
particles will have much larger Larmor radii than thermal ions and so will
couple to the lower hybrid wave at high Bernstein harmonics regardless
of whether the lower hybrid resonance is present
Since the lower hybrid wave has a much higher frequency than the fast
wave in the ion cyclotron range of frequencies it will have a larger parallel
electric field. This causes the wave to damp strongly on the electrons
through Landau damping The condition for electron Landau damping to
occur is n II Tg ~ 5 where T^ is in keV The resultant electron heating is
not confined either to the vicinity of the lower hybrid resonance, or to the
central regions of the plasma, and moves to the edge of the plasma for
Te > 5 keV
By concentrating the ny-spectrum at lower values, but still consistent
with the Stix-Golant accessibility condition, lower hybrid waves will
also couple to superthermal electrons which are important for current

5.10 Electron cyclotron resonance heating
(a) 101
Fig. 5 9.3 Contours of steady state
electron distribution in (u||, u_l) space for
lower hybnd current dnve (a) represents
contours ot constant /(U||, u_l) where i;||
and v± have been normalized to vjf, and
(b) shows the surface /(U||, u_l) truncated
at 0.02 times the maximum in /, in order
to show the plateau more clearly [From
Kamey, C F F and Fisch, N J , Physia of
Fluids 22, 1817A979)]
drive A striking feature associated with lower hybrid waves is the
generation of a superthermal tail when the antenna is phased to drive current.
The tail generation mechanism has no generally accepted explanation
even though it is the basis of lower hybrid current drive, and this is
referred to as the spectral gap problem. Several tokamaks have reported
the sustainment of the full plasma current by lower hybrid waves and
the corresponding reduction of the loop voltage to zero. A discussion of
non-inductive current drive, including lower hybrid current drive, is given
in Section 3.13. The electron velocity distribution function generated by
lower hybrid waves is shown in Fig. 5.9.3. This clearly illustrates the tail
in the direction parallel to the magnetic field.
Electron cyclotron resonance heating
Electron cyclotron resonance heating is the simplest of the radio
frequency heating methods. In contrast to ion cyclotron and lower hybrid
heating, there is no evanescent region between the antenna and the plasma,

5.10 Electron cyclotron resonance heating 291
although cut-offs can exist within the plasma. As a result, the antenna can
be retracted into a less hostile environment than for the other schemes.
Electron cyclotron heating has been made possible by the invention of
the gyrotron millimetre wave source. This and related devices have only
emerged since the mid-1970s. Gyrotron tubes capable of 0.5-1 MW
output and with frequencies in the range 100-200 GHz are now under intense
development. The frequency required for a reactor would be in the range
100-200 GHz which corresponds to vacuum wavelengths of 1-2 mm.
Since &)ce ^ <^pe only the electrons respond to electron cyclotron
waves and only the electrons are heated directly. However, under
reactorlike conditions the ions will be heated collisionally by the electrons. As
the density is increased, a limit is encountered above which electron
cyclotron waves cannot penetrate to the central regions of a tokamak.
Propagation is again described by eqn 5.6.1,
a?
n\ = \-^ @-mode)
5.10.1
(X-mode)
5.10.2
where only propagation perpendicular to the equilibrium magnetic field
B is considered {n\\ = 0). Equation 5.10.1 correspt^nds to a Hnearly
polarized wave with E\\B and is called the 0-mode. Equation 5.10.2
corresponds to an elliptically polarized wave where ELB and is referred
to as the X-mode.
Both the 0-mode and the X-mode are able to propagate directly across
the equilibrium magnetic field and so either may be used to heat the
plasma. In the cold plasma description the 0-mode does not possess a
resonance, whereas the X-mode has a resonance at &> = &)uH referred
to in Section 5.7. However, when hot plasma effects are included both
modes are found to have resonances at co = I &)ce where / is an integer. It
is these resonances together with the upper hybrid resonance which are
utilized for heating.
The accessibility conditions for the O- and X-modes are given by
eqns 5.10.1 and 5.10.2. When co « I coc^ the 0-mode condition is
^le/'^le = l^ and the X-mode condition is cti^/col^ = /(/ ± 1). The
significance of the two X-mode cut-offs, at low and high density, and
the accessibility information in general is best illustrated by means of a
Clemmow-Mullaly-AUis (CMA) diagram, shown in Fig. 5.10.1, which,
for fixed co, gives a plot of the square of the magnetic field col^/co^ against
the density &)^/&J.
Three wave trajectories, labelled 1-3, are shown in the diagram. The
first corresponds to the fundamental X-mode launched from the low
magnetic field side which does not reach any resonance since it first

5 10 Electron cyclotron resonance heating
Fig. 5 10 1 CM A diagram (plot of
square magnetic field versus density)
showing accessibility to X-mode and
0-mode resonances ( cut-offs, —
resonances, .. X-mode trajectories).
0.25
A ^v
1
E
6
ft)
^=2fflce
= ®ce
encounters the low density cut-off, where it is reflected. The second
corresponds to the second-harmonic X-mode (/ = 2) which is able to reach
the second harmonic resonance (but not the upper hybrid) from the low
field side. The third again corresponds to the fundamental X-mode but
from the high field side. In this case the wave can propagate to the
fundamental and the upper hybrid resonance. Finally, the 0-mode is indifferent
to the launching and will penetrate freely to the resonance provided the
density is below the cut-off value.
The three trajectories described in the last paragraph have been
interpreted in terms of the single mode WKB theory. As discussed in
Section 5.7, a more accurate approach requires a full wave theory. It is
then found that the X-mode, launched from the low field side, may be
able to tunnel through the evanescent layer to reach the upper hybrid
resonance. The fraction of the incident power which reaches the upper hybrid
resonance depends on the plasma density. The transmission coefficient
for this process is given by
T — exp(-7rfeo?c)
where
(■4)"
[(
-sr^
R
L

5.10 Electron cyclotron resonance heating 293
R is defined at the beginning of Section 5.8 and L is the scale length
of the equilibrium density. For large tokamaks the transmission is zero
for all practical conditions. The tunnelling to the upper hybrid resonance
from the low magnetic field side would therefore be negligible. When the
density is low, such that coL <?C col^, the transmission coefficient takes the
form T ~ exp(—ncoLr/IcoceC) which shows that coL/col^ < c/Rcoce
before significant tunnelling can take place.
The cut-off conditions for the O- and X-modes show that n/B^is
constant. This means that electron cyclotron heating cannot produce values
of local y6e(= Pe/(B^/2fJ-o)) in excess of 0 004 aTg (keV) where a = /^
for the 0-mode, and a = /(/ ^ 1) for the X-mode, the ^ referring to the
low and high density cut-offs respectively.
The discussion of accessibility for the O- and X-modes has been
restncted to the rather special case of propagation exactly perpendicular
to the equilibrium magnetic field. For the more general case of oblique
propagation, where n n 7^ 0, the high and low density X-mode cut-offs are
given by col^/col^ = /(/ it 1)A — n?). Thus, perpendicular propagation
gives access to the highest density. The 0-mode cut-off at the electron
plasma frequency is unchanged by finite n n. It should also be noted that
for oblique propagation, the two linearly independent modes, which are
still referred to as the O- and X-modes, possess both E^ and E± electric
fields
For conditions relevant to a tokamak reactor (Tg > 10 keV) the most
strongly absorbing resonances are the X-mode fundamental and second
harmonic, and the O-mode fundamental. At higher harmonics the
absorption becomes progressively weaker and the source development problem
greater It is therefore expected that electron cyclotron heating will be
restncted to the fundamental 0-mode or the second-harmonic X-mode
since both of these resonances are accessible from the low magnetic field
side of a tokamak.
The resonance condition, which determines the absorption region, is
given by eqn 5.7.10 with the suffix j now referring to electrons. An
electron cyclotron wave will be undamped outside this region but in crossing
the resonance zone will have its energy reduced by a factor exp(—r), r
being the optical depth. Like ion cyclotron heating, electron cyclotron
heating has the great advantage that the absorption region is controlled
by matching the wave frequency to the vacuum toroidal magnetic field,
the wave being resonant along the whole of a vertical chord in the minor
cross-section.
The fundamental resonance of the 0-mode and the second harmonic
resonance of the X-mode are both due to finite electron Larmor radius
effects of a hot plasma. An important property of both these waves is
that they are very strongly damped in the cyclotron resonance region
even for propagation perpendicular to the equilibrium magnetic field.
This property is due to the relativistic vanation of the electron mass with
speed. In contrast to ion cyclotron absorption, this variation is significant
for electron temperatures of only one or two keV. The higher the electron
temperature the stronger the absorption. For perpendicular propagation

5.10 Electron cyclotron resonance heating
the electron cyclotron resonance condition is
co-'^ = 0 5.10.3
y
where coce is the magnitude of the electron cyclotron frequency calculated
with the rest mass and y is the usual relativistic factor A — u^/c^)"^/^.
In the non-relativistic limit, y = 1, eqn 5.10.3 would be satisfied by all
the electrons at one radial location, say R = R^, assuming B depends
only on the radial coordinate R. The resonance would therefore have
zero width and would give rise to a singularity (or resonance) in the
corresponding wave equation. However, using the fact that for almost
all tokamak conditions the equilibrium energy of the electrons is small
compared with the rest energy, v^/c^ <?C 1, the y-factor can be expanded
to give the approximate resonance condition:
-0 5.10.4
where a local spatial dependence of the magnetic field has been included
in the second term but neglected in the (small) third term. The resonance
condition is now velocity dependent which is the characteristic feature
of a wave-particle resonance. Clearly, the resonance now has a finite
width and electrons with different energies satisfy the resonance
condition at different positions. If the zero energy electrons are resonant
at X = xo where co — Icoceixo) = 0, then the more energetic
electrons will be resonant further from this point. It is also clear that the
resonance condition can only be satisfied when co — Icoceix) < 0. In
other words, electron cyclotron resonance for perpendicular propagation
is asymmetric with respect to the cold resonance and can occur only on
the high magnetic field side of the resonance. A wave incident from the
low field side will come into resonance with low energy electrons first,
whereas a wave incident from the high field side will be resonant with
the most energetic electrons before the less energetic ones. The width
of the resonance 8x can be estimated by substituting the thermal speed
into eqn 5.10.4 and assuming a Hnear magnetic field profile in the
resonance region, &)ceU) = &>ce@)(l + x/R) giving Sx/R ~ v^Jlc^. For
a wave propagating obliquely to the magnetic field, Doppler broadening
will eventually dominate over relativistic broadening. In this limit
electron cyclotron waves are absorbed on both sides of the cold resonance and
the width is then given by 8x/R ~ (wie/c) cosO assuming k ~ l^ce/c
for low density (&)pe <?C &>ce)' For higher densities the value of fe must be
taken from the appropriate dispersion relation.
As already noted, a consequence of the relativistic absorption of the
0-mode fundamental and X-mode second harmonic is that these modes
can be used for heating by launching directly across the magnetic field
from the low field side. In contrast to ion cyclotron heating where the
second harmonic undergoes significant reflection for perpendicular
incidence from the low field side, the relativistic absorption removes the
reflection of the incident O- or X-mode from the low field side.

5 10 Electron cyclotron resonance heating 295
Returning to the resonance condition given by eqn 5.10.4 it is seen
that the weakly relativistic correction has resulted in the wave resonance
being replaced by a wave-particle resonance. Such singular integrals in
velocity space must be evaluated using Landau's prescription described
in Section 5.8. Carrying out this procedure for the fundamental 0-mode
gives the following expression for the optical depth
^ 1_ P^ !^^^.
The optical depths, to,x, maximized with respect to the density for the
fundamental 0-mode and second harmonic X-mode can also be written
in the form to,x = yo.x^(m)/(GHz)re(keV) where yo = 0.025 and
Yx — 0.15. Due to the relativistic broadening, energy incident from the
low field side is totally absorbed in one transit of the resonance and there
is no transmitted wave (or reflected wave) for typical tokamak conditions.
Electron Bernstein waves could also be used for heating and current
drive. Very little attention has been paid to this alternative because the
O- and X-modes can be launched in vacuum, remote from the hot plasma,
and will penetrate to the core of the discharge of a conventional tokamak,
whereas coupling to electron Bernstein waves is more difficult since they
do not propagate in vacuum. However, in the case of spherical tokamaks,
where a^ > Qg, the O- and X-modes are not accessible to the centre
of the discharge for the fundamental or second harmonic. The higher
harmonics do have accessibility but these modes are very weakly damped
and this makes the conventional use of ECRH unsuitable for a spherical
tokamak.
Electron Bernstein waves do not have any density limits and all
harmonics are damped very strongly making these waves promising
candidates for heating and current drive in spherical tokamaks. The main
problem for this scheme is to develop a reliable and effective coupling
method. There are two possibilities.
The first was originally discussed for ionospheric applications. Power
is launched on the 0-mode in the usual way. If the launch angle is arranged
so that n n has the critical value, ^cr, where n^^ = WceliiJ^ + (J^ce), then the
high density X-mode and 0-mode cut-offs are degenerate and the 0-mode
IS totally converted to the X-mode. The X-mode then propagates to lower
density where it meets the upper hybrid resonance and is converted to an
electron Bernstein wave (EBW). Finally, the converted electron Bernstein
wave propagates towards the plasma centre and is totally absorbed at the
first electron cyclotron resonance it encounters. This is referred to as the
0-X-EBW scheme.
The second possibility is based on the triplet scheme proposed for
mode conversion heating by the fast wave in a two ion species plasma.
In this case the X-mode low density cut-off, upper hybrid resonance and
high density cut-off form the triplet of critical points. For sufficiently
steep edge density gradients it is possible, in principle, to convert all the

5 10 Electron cyclotron resonance heating
Fig 5 10 2 Dependence of the increase
in plasma energy from 0-X-B heating on
the longitudinal vacuum refractive index
Nz of the incident 0-wave. The solid line
IS the calculated transmission function
multiplied by the maximum energy
mcrease [Laqua. HP etal., Physical
Review Letters 78, 3467 A997) ]
AW 0 8
(kJ)
incident X-mode energy from the low field side to the electron Bernstein
wave. This is referred to as the X-EBW scheme.
The 0-X-EBW scheme has been demonstrated on the W7-As Stellara-
tor and produced heating at densities more than twice the cut-off value.
Figure 5.10.2 shows the measured increment in the plasma energy by
0-X-B heating as a function of the vacuum parallel refractive index which
gives the variation with the launch angle. The measured values lie close
to the theoretical curve, shown for comparison.
Electron cyclotron resonance in a tokamak heats the electrons in a
similar manner to the heating of the ions by ion cyclotron resonance. An
electron which is in cyclotron resonance with the O- or X-mode
experiences an impulse predominantly in the direction perpendicular to the
magnetic field. Whether a given electron gains or loses energy depends
on the phase of the gyration of the electron relative to the phase of the
wave. The resonant electrons will again be constrained to move along
certain paths in velocity space as discussed in Section 5.8.
The electron paths will differ from the corresponding ion cyclotron
contours due to the relativistic corrections. However, the heated electron
distribution function can be calculated by solving the electron Fokker-
Planck equation with an appropriate, weakly relativistic, quasi-linear
term. The result of such a calculation for a toroidal magnetic field is
shown in Fig. 5.10.3. This illustrates an important difference between
electron and ion cyclotron heating. Comparing Fig. 5.8.8 with Fig. 5.10.3
it can be seen that the ion velocity contours have undergone much greater
distortion from the thermal lines than the corresponding electron velocity

Fig 5.10 3 Contours of electron
distribution function for second-hiannonic
X-mode hieating m thie COMPASS
tolcamak for an injected power of 1.5 MW
= iniV
Thie othier parameters are, n^ = 10
n = 1.5keV,/ = 60GHzand
p/R = 0 08, where p is the radius of the
resonant flux surface. The dashed lines
show the boundanes between trapped and
passing electrons [From O'Brien, M.R.,
Cox, M , and Start, D FH., Nuclear Fusion
26, 1625A986).]
5 10 Electron cyclotron resonance heating
"xo/%e
contours. This is due to the dependence of the electron cyclotron
resonance condition on v± through the relativistic variation of the electron
mass which causes a heated electron to fall out of resonance before it is
driven to very high energy. In contrast, the relativistic mass dependence
of a thermal ion is negligible. Hence, an ion can remain in cyclotron
resonance and continue to gain perpendicular energy. It is also worth
noting that the electron distribution remains Maxwellian near to the origin
because of the large collision frequency in this region Thg main distortion
of the electron distribution occurs between 4uTe and Suxe The distortion
diminishes for larger velocities because these electrons cannot come into
cyclotron resonance on this particular flux surface of radius p = 4 4 cm
An experiment designed to test the weakly relativistic hot plasma
theory of electron cyclotron absorption was earned out in PLT Transmitting
and receiving horns were positioned on opposite sides of the mid-plane
Both horns were oriented such that their axes were perpendicular to the
equilibrium magnetic field The experiment was therefore arranged to
detect the O-mode for perpendicular propagation
The incident 4 mm microwave power was supplied by a klystron at a
fixed frequency of 71 GHz The transmitted power detected by the
receiving horn was compared with the incident power to obtain the optical depth,
Texp The electron cyclotron resonance position was altered by varying
the central value of the equilibrium magnetic field The experiment was
corrected for refraction losses which could exceed absorption for lower
densities and temperatures This was done by repeating the transmission
measurements for lower magnetic fields such that no electron cyclotron
resonance was present in the plasma The results are shown in Table 5 10 1
where the experimentally determined optical depth Texp is compared with
the theoretical value tqi given by eqn 5 10 5 The theoretical values of
the optical depth were obtained by using the values of the local density
and temperature, «e('"), 7e(r), obtained from laser Thomson scattering

5 10 Electron cyclotron resonance heating
Table 5.10.1 A comparison of the measured experimental values of the
optical depth, Tgxp, with the corresponding quantity, tqi , calculated for the
propagationofthefundamentalordinary mode [seeeqn5 10 5] The data
were collected over two separate experimental runs and are partitioned
in this table
B{Ro)
(Tesla)
(eV)
(lO'^n
toi
19
2
2 15
24
25
2 15
23
24
25
160
290
240
650
900
270
420
760
850
0 38
07
07
1 1
13
130
0 96
26
27
■'^exp
0
0 5 ± 0 03
0 21 ±0 16 0 09 ±0 03
0 14 ±0 04 Oil
0 57 ±0 06 0 38 ±0 05
0 98 ±0 16 0 88 ±0 06
0 29 ± 0 06 0 3 ± 0 03
0 35 ±0 18 0 33 ±0 07
143 ±0 13 15 ±0 15
1 65 ± 0 30 19
Fig. 5 10.4 Schematic diagram of the
layout of the ECRH system for low field
side injection into COMPASS
TE02/01
Converter TEOl
It IS apparent from Table 5 10 1 that there is generally good agreement
between the theory and the experiment
A representative example of an ECRH system is given schematically in
Fig 5 10 4 This shows an ECRH layout for COMPASS with the gyrotron,
transmission system and antenna for low field side launch The salient
features of Fig 5 10 4 are the following The power emerging from the

5 10 Electron cyclotron resonance heating 299
gyrotron is mainly in the TEqi mode (~90%) with somewhat less than
10% earned by the TEqi and the remainder in higher modes The TEm„
notation refers to a mode of a cylindrical wave guide with a transverse
electric field where m and n are the azimuthal and radial mode numbers
It should be noted that at the high frequencies characteristic of ECRH
the wave guide transmission systems operate in over moded conditions
This means many different modes can propagate requiring considerable
care in ensuring only the desired mode is present The TEoi/02 mode
corrector and the TEoi/02 mode convertor result in the conversion of more
than 95% of the power to the TEqi mode, which is the desired mode
for transmission because of its very low loss The power remains in the
TEqi mode until it nears the tokamak wheie mode conversion to the
launching mode is required This occurs in two stages First, the power
IS transformed from the circular TEqi mode to the approximately linear
polarized TEn mode The final mode conversion is from TEn to HEn
which IS a mode which only exists in a corrugated wave guide but which
IS almost ideal for coupling to the plasma This is because the HEn mode
has an exact linear polanzation where the plane of polanzation can be
selected to match to the 0-mode or to the X-mode The transmission
system cames high power over a length of 50 m, and round five bends
before being coupled to the plasma The total loss between the gyrotron
and the plasma is no more than 15% The vacuum window, occumng just
before the antenna, is one of the critical components for an ECRH
system for a tokamak reactor For the higher frequency systems required
by a reactor, quasi-optical transmission lines offer an alternative to
wave guides
In conclusion, it should be mentioned that electron,Cyclotron
resonance heating has been successfully operated at the MW level Central
electron temperatures up to lOkeV have been observed on T-10 using
2 5 MW at 81 GHz and 1 1 MW at 75 GHz for a line averaged density of
1 5 X 10'^ m~^ The resonance fines of the two frequencies were placed
symmetrically about the centre of the plasma {r/a = ±0 2) In DIII-
D, central temperatures of 5 keV were obtained with 1 MW at 60 GHz
for a density of 0 7 x 10^^ m~^ Electron cyclotron resonance heating
IS a very versatile scheme which has various other applications in
addition to bulk heating It has been successfully employed to pre-ionize
discharges and assist the start-up Even though electron cyclotron waves
carry little momentum they can be used to drive the equilibrium plasma
current, in principle with comparable efficiency to lower hybrid waves
Another important application is the control of the current profile, either
by localized heating or by local current drive Finally, electron cyclotron
resonance absorption is capable of selective heating of energetic
electrons through the relativistic resonance condition and vertical incidence
To date very little use has been made of this unique property for tokamak
experiments It is worth noting that the relativistic cyclotron resonance
condition is the basis of the gain mechanism of a gyrotron, albeit for a
highly non-thermal distribution of electrons possessing an energy in the
range ~80keV with uxo ^ 2i;||o

Bibliography
Ohmic heating
A proposal for an expenment (Ignitor) in which ohnuc
heating plays a major role was made by
Coppi, B , Compact expenment for a-particle heating
Comments on Plasma Physics and Controlled Fusion
Vol 111,47A977)
Neutral beam heating
Introductory accounts of the subject are given by
Sweetman, D R , Cordey, J G , and Green, TS , Heating
and plasma interactions with beams of energetic neutral
atoms. Philosophical Transactions of the Royal Society A
300,589A981), and
Hemsworth, R S , In Plasma physics and nuclear fusion
research(ed Gi]],RD) Academic Press, London A981)
A more recent review is that by
Stork, D , Neutral beam heating and current dnve systems
Fusion Engineering and Design 14, 111 A991)
The physics of the beam-plasma interaction is descnbed in
the article. Trapping and thermalization of fast ions, by
Cordey, J G , Applied atomic and collision physics Vol 2,
Eds Bamett, C F and Hamson, M FA Academic Press,
Orlando A984)
The technological aspects are descnbed in the article.
Neutral-beam formation and transport, by
Green, T S , Applied atomic and collision physics Vol 2
(eds Bamett, C F and Hamson, M F A ) Academic Press,
Orlando A984)
The early heating expenments were reported at the 6th
European Conference on Controlled Fusion and Plasma
Physics, Moscow 1973 and published in Vol II of the
proceedings as follows
Furth, H P, Tokamak heating by neutral beams and adiabatic
compression, p 51
Sheffield, J et al Neutral injection on the CLEO tokamak,
p 328
Barnett, C F et al ORMAK and neutral injection, p 330
Expenments in which substantial heating was achieved are
descnbed in
Eubank, H , Goldston, R J et al PLT neutral beam
heating results Plasma physics and controlled nuclear fusion
research (Proceedings 7th International Conference,
Innsbruck, 1978)Vol 1,167 IAEA ViennaA979),and
Kitsunezaki, A , Angel, T et al High pressure plasma with
high-power NBI heating in Doublet III Plasma physics
and controlled nuclear fusion research (Proceedings 10th
International Conference, London, 1984) Vol 1, 57
IAEA ViennaA985)
The higher power heating on large tokamaks is descnbed in
Chapter 12
Radio frequency heating
Two state-of-the-art summanes are
Porkolab, M , Review of RF heating In Theory of
magnetically confined plasmas Proceedings of the International
School of Plasma Physics, Varenna 1977, p 339
Pergamon Press, Oxford A979),
and
Hwang, D Q and Wilson, J.R , Radio frequency wave
applications in magnetic fusion devices Proceedings of IEEE
69, 1030A981)
The first of these outlines the theory and its expenmental
status whilst the second also contains information on the
technology
An introduction to the subject is given in the book
Caims, R A , Radio frequency heating of plasmas Adam
Hilger, BnstolA991),
and another general account including much expenmental
information is given in
Golant, V E and Fedorov, VI, RF plasma heating in toroidal
fusion devices. Consultants Bureau, New York A989)
Physics of radio frequency heating
The standard work on waves in plasmas which has been
issued in its second edition with a detailed discussion of
developments in the subject is Stix, T H , Waves in plasmas,
Amencan Institute of Physics (New York), 1992 The theory
of waves with particular reference to radio frequency heating
IS given in
Swanson, D G , Plasma waves. Academic Press, San Diego
A989)
A detailed and comprehensive account of the theory of linear
waves in magnetized, uniform plasmas is provided by
Akhiezer, Al, Akhiezer, I A, Polovin, RV, Sitenko,
A G , and Stepanov, K N , Plasma electrodynamics Vol I.
Pergamon Press, Oxford A975)
Reviews of the three mam heating schemes and current dnve
are given in
Wave heating and current drive in plasmas, Eds Granatstein,
VL and Colestock, PL , Gordon and Breach, New York
A985)
A rigorous discussion of the Budden equation is given in
Budden, K G , The propagation of radio waves, Cambndge
University Press Cambndge A985), pp 596-602

Bibliography
The first account of Bernstein waves was given in
Bernstein, I B , Waves in plasma in a magnetic field. Physical
Review 109, 10 A958)
The original denvation of Landau damping, which is the
fundamental physical process underlying the absorption of
radio frequency power in hot plasmas, is given in
Landau, L D , On the vibrations of the electronic plasma.
Journal of Physics (USSR) 10, 25 A946)
An early account of linear mode conversion (in a plasma
physics context) is given in
Stix, T H , Radiation and absorption via mode conversion in
an inhomogeneous collision free plasma. Physical Review
Letters 15, 878 A965)
Later discussions of mode conversion are given in
Cairns, R A and Lashmore-Davies, C N , A unified
theory of a class of mode conversion problems. Physics of
Fluids 26,1268 A983), Colestock, P L and Kashuba, R J ,
The theory of mode conversion and wave damping near
the ion cyclotron frequency. Nuclear Fusion 23, 763
A983), Stix, TH and Swanson, D G , Propagation and
mode-conversion for waves in non-uniform plasmas, in
Handbook of plasma physics, Eds Rosenbluth, M N and
Sagdeev, R Z , Vol l, North-Holland, Amsterdam, p 335
A983)
An interesting discussion of the anomalous Doppler
(cyclotron) resonance is given by
Nezlin, M V, Negative-energy waves and the anomalous
Doppler effect, Usp Fiz Nauk, 120, 481 A976) [Sov
Phys. Usp 19, 946 A976)]
The original denvation of the quasi-linear theory was given
independently by
Vedenov, A A , Velikhov, E P and Sagdeev, R Z , Nonlinear
oscillations of a rarefied plasma. Nuclear Fusion 1, 82
A961)
and
Drummond, W E and Pines, D, Nonlinear stability of
plasma oscillation. Nuclear Fusion 1, Supplement, Part 3,
1049 A962)
Ion cyclotron resonance heating
The first account of the two ion hybnd resonance was given by
Buchsbaum, S J, Resonance in a plasma with two ion
species Physics of Fluids 3, 418 A960)
A very thorough and detailed account of the fundamentals
of ion cyclotron heating by means of the fast wave is
Stix, T H , Fast-wave heating of a two component plasma
Nuclear Fusion 15, 737 A975)
Later reviews are given in
Swanson, D G , Radio frequency heating in the ion-cyclotron
range of frequencies. Physics of Fluids 28, 2645 A985)
and in Hwang, D Q , Colestock, PL and Philips, C K
The theory of minority species fast magnetosonic wave
heating in a tokamak In Wave heating and current diive
in plasmas, Gordon and Breach, New York A985), Eds
Granatstein, VL , and Colestock, PL , p 1
The quasi-linear theory generalized to a magnetized plasma
was given first by
Kennel, C F and Engelmann, F, Velocity space diffusion
from weak plasma turbulence in a magnetic field. Physics
of Fluids 9, 2311 {1966}
A comprehensive account of the solution of the Fokker-
Planck equation with a quasi-linear wave term in a tokamak
plasma is given by
Kerbel, G D and McCoy, M G , Kinetic theory and
simulation of multispecies plasmas in tokamaks excited
with electromagnetic waves in the ion-cyclotron range
of frequencies. Physics of Fluids 28, 3629 A985)
Some early results using ion cyclotron heating are given by
Equipe, TFR, ICRF Heating in TFR 600 Proceedings of the
8th International Conference on the Physics of Plasmas
and Controlled Nuclear Fusion (Brussels, 1980), Vol 2,
p 75, IAEA, Vienna A981)
A later review of expenments is given by
Colestock, PL , An overview of ICRH expenments in Wave
heating and current drive in plasmas, Gordon and Breach,
New York A985) Eds Granatstein, VL and Colestock,
PL,p 55
Attention was drawn to the significance of the high field side
fast wave cut-off to mode conversion from the low field side
by
Majeski, R , Phillips, C K , and Wilson, J R , Electron
heating and current dnve by mode converted slow waves
Physical Review Letters 73, 2204 A994)
An explicit calculation demonstrating the possibility of
100% mode conversion from the low field side was given by
Fuchs, V, Ram, AK, Schultz, SD, Bers, A, and
Lashmore-Davies, C N, Mode conversion and electron
damping of the fast Alfven wave in a tokamak at the
lon-ion hybnd frequency Physics of Plasmas 2, 1637
A995)
The high harmonic scheme for electron heating and current
dnve in sphencal tokamaks is proposed by
Ono, M High harmonic fast waves in high beta plasmas
Physics of Plasmas 2, 4075 A995)
Lower hybrid resonance heating
The two onginal discussions of the lower hybnd accessibility
condition are by
Stix, T H, The theory of plasma waves, McGraw-Hill,
New York A962)
Golant, VE , Plasma penetration near the lower hybnd
frequency Zhurnal Technicheskoi Fisiki 41, 2492 A971)
[Soviet Physics-Technical Physics 16, 1980 A972)]
Summanes of the theory of lower hybnd heating and
expenments are given by

Bibliography
Bonoli, P, Linear theory of lower hybnd waves in tokamak
plasmas and Porkolab, M, Lower hybnd wave
propagation, heating and current dnve expenments, in Wave
heating and current dnve in plasmas, Gordon and Breach,
New York A985) Eds Granatstem, VL and Colestock,
PL , p 175 and p 219 respectively
The onginal proposal to use a phased array of wave guides
(the gnll) as the lower hybnd antenna was made by
Lallia, P, A LHR heating slow wave launching structure
suited for large toroidal expenments Proceedings of 2nd
Topical Conference on RF Plasma Heating (Texas Tech
Univ, Lubbock, Texas) Paper C3 A974)
The first expenment which succeeded in dnving the whole
of the plasma current in tokamak by means of lower hybnd
waves IS descnbed in
Bemabei, S , et al, Lower hybnd current dnve in the PLT
tokamak Physical Review Letters 49, 1255 A982)
Electron cyclotron resonance heating
The first expenment to utilize high power electron cyclotron
heating (with a gyrotron) is descnbed in
Alikaev, VV, Bobrovskii, G A , Poznyak, VI, Razumova,
K A , Sanmkov, V V, Sokolov, Yu A , and Shmann, A A ,
ECR plasma heating in the TM-3 tokamak in magnetic
fields up to 25kOe, Fizika Plasmy 2, 390 A976) [Soviet
Journal of Plasma Physics 2, 212 A976)]
The effect of relativity on electron cyclotron absorption
was first noted in the Russian literature One of the first
treatments is given in
Dnestrovskii, Yu N, Kostomarov, DP, and Skrydlov,
N V, Plasma waves in cyclotron resonant regions, Zhur-
nal Teknicheskoi Fiziki 33, 922, A963) [Soviet Physics
Technical Physics 8, 691 A964)]
One of the early and most thorough treatments of the rel-
ativistic effects on electron cyclotron absorption was given by
^hkarofsky, I P, Dielectnc tensor in Vlasov plasmas near
cyclotron harmonics Physics of Fluids 9, 56\ A966).
A very readable introduction to electron cyclotron heating is
contained in the review
Manheimer, W M , Electron cyclotron heating in tokamaks,
infra-red and millimeter waves. Vol II (ed Button, K J )
Academic Press, New York A979)
A comprehensive review is given by
Bomatici, M , Cano, R , DeBarbien, O , and Engelmann, F,
Electron cyclotron emission and absorption in fusion
plasmas. Nuclear Fusion 23, 1153 A983)
The CMA diagram is descnbed in
Stix, TH , Waves in plasmas, Amencan Institute of Physics,
New York A992), p 14, Swanson, D G , Plasma waves.
Academic Press, San Diego A989), p. 29
Other accounts of the theory and experimental results are
given by
Chu, K R , Theory of electron cyclotron resonance heating
and England, A C , and Hsuan, H , Electron cyclotron
heating in tokamaks and tokamak reactors, in Wave
heating and current drive in plasmas, Gordon and Breach,
New York A985) Eds Granatstein, VL , and Colestock,
PL,p 317 and p 459 respectively
A more recent account of ECRH expenments is given by
Prater, R, Recent results on the application of electron
cyclotron heating to tokamaks. Journal of Fusion Energy
9, 19A990)
The companson given in Section 5 10 of the theoretical
value foi the optical depth of the 0-mode fundamental with
expenment is taken from
Efthimion, PC, Arunasalam, V, and Hosea, JC,
Ordinary-mode fundamental electron-cyclotron resonance
absorption and emission in the Pnnceton Large Torus,
Physical Review Letters 44, 396 A980)
Attention was drawn to the relevance of the conversion of
the ordinary mode to the extraordinary mode at the plasma
resonance for a particular incident angle to high density
heating in a paper by
Preinhaelter, J and Kopecky, V, Penetration of high
frequency waves into a weakly inhomogeneous magnetised
plasma at oblique incidence and their transformation
to Bernstein waves Journal of Plasma Physics 10,
1A973)
An expenmental demonstration of heating above the cut-off
density in the "^l-ks stellarator is descnbed by
Laqua, HP, Erckmann, V, Hartfuss, H J , and Laqua, H,
Resonant and non-resonant electron cyclotron heating at
densities above the plasma cut-off by 0-X-B mode
conversion at the W7-As stellarator Physics Review Letters
78, 3467 A997).
Electron Bernstein wave heating of sphencal tokamaks
through the X-EBW (tnplet) scheme was proposed by
Bers, A , Ram, A K , and Schultz, S D , Coupling to electron
Bernstein waves in tokamaks Proc 2nd Europhysics
Topical Conf on Radio Frequency Heating and Current Drive
of Fusion Devices, Brussels 1998, edited by Jacquinot J ,
Van Oost, G and Weynants, R R (European Physical
Society, Petit-Lancy, 1998) p 237

Mhd stability

Mhd stability
The strongest instabilities in tokamaks are those which, in their simplest
form, are described by the magnetohydrodynamic model of the plasma
The basic destabilizing forces arise from
(i) Current gradients and
(ii) Pressure gradients combined with adverse magnetic field curvature
The resulting instabilities are divided into two categories'
(i) Ideal modes—instabilities which would occur even if the plasma
were perfectly conducting, and
(ii) Resistive modes—which are dependent on the finite resistivity of the
plasma.
Both ideal and resistive instabilities have an infinite spectrum of
possible modes, each member being characterized by its mode
numbers. In the case of a circular, large aspect-ratio tokamak the modes take
the form exp i{m9 — ncj)), m and n being the poloidal and toroidal mode
numbers.
The stabilizing effects for mhd modes are illustrated in Fig. 6.1.1 They
arise from
Fig 6 1.1 Magnetic field line bending
and magnetic field compression are
stabilizing for mhd modes The magnetic
field curvature is stabilizing if the negative
pressure gradient is in the direction of the
centre of
(i) Magnetic field line bending—the production of a perturbed magnetic
field perpendicular to the equilibrium field. This effect is larger for
shorter wavelengths, that is it increases with m,
(li) Magnetic field line compression—the production of a perturbed
magnetic field parallel to the equilibrium field, and
(iii) Good magnetic field curvature—the centre of curvature being in the
opposite direction to the pressure gradient
The stabilizing effect of line bending is minimized on magnetic
surfaces for which the magnetic field helix matches that of the mode.
This resonance occurs for rational surfaces on which m = nq, where
q IS the safety factor. Although the stabilizing effect is stronger for
Bending of
magnetic field lines
Compression of
magnetic field

B.I Mhd stability
Fig. 6.1.2 Showing how exclusion of
resonant surfaces from the tokamak
plasma reduces the number of potential
modes of instability. These modes are
restricted toqo < m/n < (?a and are
indicated by astensks At low fi, high
m-modes are stabilized by line bending
and by good average field line curvature
high-m modes, instabiHty can occur if they are localized around a resonant
surface
In the limit of m and n approaching infinity the modes are sufficiently
localized that stability becomes a magnetic surface property In this case
the stability criterion must be applied to all magnetic surfaces.
For low mode numbers the modes are not localized However, for
instability, their resonant surfaces must satisfy m/n = ^ for a value of
q existing inside the plasma or close to its surface Part^Df the stability
of tokamaks derives from the exclusion of resonances for all but a few
of the low m-modes by the hmited range of ^-values across the plasma.
This IS illustrated in Fig 6 1 2 for a case where the highest value of q is
around 3 and the lowest value is just greater than unity
The present chapter deals with linear stability theory Its main purpose
is to locate the boundanes in parameter space between stable and unstable
regions. It might be thought that it would be necessary to operate in a
stable region However the matter is more subtle and for some modes it is
possible that a certain level of instability is acceptable in order to achieve
otherwise better conditions. Experimentally, tokamaks usually display
signs of mhd instability. It is the task of nonlinear theory, introduced in
Chapter 7, to determine the level of saturation of these instabilities and
to calculate their deleterious effects.
The three principal theoretical procedures for determining
stability are:
(i) The energy principle, in which the potential energy change resulting
from a plasma displacement ^(a:) is examined,
(ii) Calculation of the eigenfunctions and corresponding eigenvalues for
the frequency, m. The sign of the imaginary part of &> then determines
stability.

6.2 Stability theory
(iii) Solution of the marginal stability equation (&>, = 0). Its solution
satisfies the required boundary conditions for a configuration on the
stability boundary.
Stability theory
The basic method of determining the stability properties of a system is to
analyze the behaviour of perturbations to a chosen state. In tokamaks this
state is usually one given by a time independent solution of the governing
equations. The linear stability of the system is determined by examining
the behaviour of infinitesimal perturbations which satisfy the
governing equations and the boundary conditions. It is plausibly assumed that
all possible perturbations which satisfy these conditions will arise from
microscopic fluctuations of the initial state. Thus if the system is unstable
to any form of infinitesimal perturbation the corresponding instability will
appear. Simple theory predicts that such instabilities have an exponential
growth which will continue until the assumption of a linear perturbation
fails. The perturbation is then limited in amplitude, that is 'saturated', by
nonlinear processes, the nature of which depends on the particular case.
Linearization of the governing equations is accomplished by writing
each factor in the equations as the sum of its equilibrium value and the
small perturbation. Thus
P = Po + Pi-
The products of two such factors p and q is
pq = poqo + poqi + qopi + p\q\
and similarly for the product of more factors. When the governing
equations are written in this form, the leading terms in each expression,
such as Poqo, describe the equilibrium solution and cancel The terms
which are linear in the perturbed quantities, such as poq\ and qop\ are
retained, and the higher order terms, such as p\q\, are clearly neghgi-
ble if the perturbation is sufficiently small. Mathematically, at least, the
perturbation can be taken to be infinitesimal and this provides a rigorous
basis for the linearization procedure.
The formal procedure for calculating the behaviour of small
perturbations by solving the linearized equations involves taking Laplace
transforms. The resulting solution has a part which depends on the initial
conditions and a part which is a homogeneous solution of the equations.
The homogeneous solution is comprised of the eigenfunctions of the
system, each having as an eigenvalue the quantity o) appearing in the time

6.3 Growth rates 307
dependent factor e~""' of the solution. In general co is complex and
It is seen theiefoie that the real part of &> describes the real frequency of
the mode and the imaginary part determines stability, instability
corresponding to CO, > 0. A common procedure for determining stability is
therefoie to take the time dependence to be e~""' and to solve the
governing equations foi the eigenfunctions and the corresponding eigenvalues
of CO. Since the factors e~""' are the only time dependent factors in the
solutions, time derivatives in the equations are simply replaced by —ico.
By analogy with the theory of waves the equation D(co) = 0 which gives
the eigenvalues is called the dispersion relation. Indeed, formally the
dispersion relation governing stability is just an extension of the wave
dispersion relation.
In the ideal mhd model the above procedure can be followed, or
alternatively the change in potential energy corresponding to a given
plasma displacement ^(jc) can be calculated. This does not involve any
time dependence. The plasma is unstable to any perturbation ^(x) which
makes the potential energy change i5W[^] negative. An account of this
method is given in Section 6.4.
In all methods the calculation is simplified if there are coordinates
along which the equilibrium is constant. In a tokamak the toroidal
symmetry means that the toioidal angle 0 is such a coordinate. In this
case the perturbations can be Fourier analysed in 0. Each component has
the form e'"'"'^ and can be treated separately, the component being
characterized by the mode number n. Sometimes the equilib^um variation in
the poloidal angle 9 is sufficiently small that the Fourier components in
9 are separable. The eigenfunctions then have the form e'("'^~"'^). More
generally the Fourier components in 9 are coupled.
Some confusion arises from the use of the symbol m to describe both
the mode number and the Fourier components. The mode number is an
integer 'eigenvalue' which characterizes the eigenmode. In the case of
a vibrating string the harmonic mode numbers of a given mode,
determined by counting nodes, does not change if the mass distribution of the
string is varied but a Fourier decomposition would have many
components. Similarly, the plasma modes with a given mode number m can be
described in terms of Fourier components. In a tokamak the structuie of
the eigenfunction involves the coupling of these components.
Growth rates
The simplest theoretical approach to stability is first to decide which
equilibria are stable and which unstable, and then to calculate the growth

6.3 Growth rates
rate of the unstable cases. This procedure is theoretically sound but often
does not relate to reality.
The missing element is the time dependence of the equilibrium. If an
equilibrium is in an unstable state it is necessary to ask how it reached that
state. In principle an unstable configuration can be established so rapidly
that the instability growth during the setting-up phase is negligible. In
this case the simple exponential growth, e'", associated with this
configuration will occur. However, in a tokamak the time scale for equilibrium
changes is usually very long compared to typical linear growth times.
Looked at on this time-scale it becomes apparent that when the unstable
regime is entered the growth rate is zero and that the early growth will be
at a very low growth rate.
This behaviour can be illustrated by a simple model. Let the growth
rate, yip), be proportional to the amount by which some equilibrium
parameter, p, exceeds a critical value pc, that is
dy
y = (/7-/7c)-— 6.3.1
dp
P - Pc = pit - to), 6.3.2
where Iq is the time at which the stability boundary is passed. If the
characteristic time, r, for equilibrium change is defined by writing
eqns 6.3.1-6.3.3 allow the equation for the growth of a small perturbation
^ to be written
df y*
-^ = y^ = —it-to)^, 6.3.4
dt X
where y* characterizes the linear growth rate through
* dy
y = —Pc-
dp
The solution of eqn 6.3.4 is
y*(f - fo)'
? = ^0 exp -
2t
The behaviour is illustrated graphically in Fig. 6.3.1 for a case for
which y*T = 100, and nonlinear effects become important at a level
?/?o = 10.

6.4 Energy principle
Fig. 6.3.1 Illustration of instability
growth following passage of the
equilibrium through marginal stability at
t = ?o with a growth rate y proportional to
(f — fo). The dashed curve gives the
associated simple exponential growth for
comparison. The ratio of the equilibrium
time T to the characteristic instability time
y*"' is taken to be 100.
10 4h-
^
<? r
; er^C-'o)
Energy principle
The energy principle of ideal mhd is based on the concept that if a
physically allowable perturbation of an equilibrium lowers the
potential energy, then the equilibrium is unstable. The instabilities it describes
are called ideal modes. The potential energy change due to an arbitrary
displacement will be calculated using the equations given in Section 2.20.
The energy change resulting from a displacement ^(a:) of the plasma
is given by the volume integral.
'-'\i
^■FAt
where F{x) is the force arising from the displacement.
From eqn 2.20.2 the linearized force is
F = JixBo+ Jox Bi-Vpi, 6.4.2
where the subscripts 0 and 1 refer to the equilibrium and the perturbation.
The pressure change pi is related to the displacement by integrating the
linearized adiabatic eqn 2.20.4 to give
= y/7oV-^-^-Vpo.
6.4.3
The perturbed magnetic field is obtained by integrating Faraday's
induction eqn 2.20.6 together with the perfect conductivity eqn 2.20.7

6.4 Energy principle
to give
Si = Vx(^xSo)- 6.4.4
The perturbed current density may now be obtained from Ampere's
eqn 2.20.5
7i = V X ByliJLQ. 6.4.5
Substitution of eqns 6.4.2-6.4.5 into eqn 6.4.1 then gives 5W in terms
of^
5W^ =-^ J (^ V(y/7oV ■ ? + ^ Vpo).
+ —^[(V X Vx(^xSo))xSo
+ (VxSo) xVx(^ xSo)])dT
and using the vector relationships 3 and 5 of Section 14.1 together with
Gauss's theorem this equation may be written
+ ^-j (py+—Bo-B^^-AS. 6.4.6
The surface term is zero if the normal displacement at the surface is zero,
as it would be at a perfect conductor. When there is a vacuum region
outside the plasma (and there are no surface currents in the equilibrium
configuration) the surface term represents the transfer of energy to the
vacuum region. This energy is / B^/I/xq dr where B^ is the perturbed
magnetic field and the integral is over the vacuum region. Equation 6.4.6
for SW may therefore be written
SW = \f (ypo(V■?J + (^Vpo)V■?
2 Jplasma V
+ ^ - 70 • (-Si M)) dT + /" (fiv/2/^o) dr 6.4.7
M I Jvacuum
where fi i (^) is given by eqn 6.4.4 and B^ satisfies V x Sy = 0 together
with the required, ^-dependent, boundary conditions.
If 5 W is negative for any physically allowable % the plasma is unstable.
If, on the other hand, hW \s, positive for all allowable % the plasma is stable.
It is sometimes possible to use the energy principle to obtain a sufficient
criterion for stability. This is done by arranging the terms of 5 W in a

B.5 Tokamak instabilities
311
form such that, when the criterion is satisfied, SW is positive for all
displacements. A more common procedure is to use a trial function to
make SW negative and hence demonstrate instability.
If the eigenfunctions and eigenvalues, co, of a problem are required it
is necessary to introduce the kinetic energy
K = j ^-pa/^dt
and to obtain an extremum of the Lagrangian
This is equivalent to solving the full linearized ideal mhd equations. An
example of such a solution is shown in Fig. 6.4.1.
Tokamak instabilities
Fig. 6.4.1 Showing the poloidal
component of the displacement | for ai
ideal mhd instability in a tokamak.
The first class of instabilities consists of the so-called ideal mhd modes.
In the theory of these modes it is assumed that the plasma is perfectly
conducting. Since the plasma is nof perfectly conducting tlfe implications
of ideal mhd stability analysis require some comment. If the ideal mhd
theory predicts instability then it is to be expected that instability will
occur, but there is no reason to believe that resistivity will not be important
in the nonlinear development of the instability. These instabilities are
'ideal' in the sense that instabihty would occur even if the plasma were
perfectly conducting.
On the other hand, if the plasma is predicted to be ideal mhd stable, the
plasma may or may not be stable. In particular there is the possibility of
resistive modes of instability. These are usually paired with the types of
ideal mode since, for a particular ideal mode, the source of free energy is
still available when the constraint of perfect conductivity is relaxed. For
example, it will be seen that the tearing mode is the resistive analogue of
the kink instability.
The remaining part of the present chapter will introduce the various
mhd instabilities and establish their stability boundaries as determined
by linear stability theory.
The instabilities which will be described are:
(i) Kink instability An ideal mhd instability driven at low y6 by the
current gradient. At high y6, pressure gradients
also contribute to the instability.
(ii) Tearing mode The resistive form of the kink instability.

6.6 Large aspect-ratio tokamak
(iii) Internal kink
(iv) Resistive m — 1 instability
(v) Ballooning modes
(vi) Mercier instability
(vii) Vertical instability
This instability has mode number
m = Lit principally affects the plasma
core where q < 1 and is driven by the
pressure gradient in that region.
Similar to the internal kink, principally
affecting the plasma core, but with a
different energy source.
A localized instability driven by the
pressure gradient.
A limiting case of the ballooning mode.
An instability arising from plasma
elongation, in which the whole plasma
is subject to a vertical motion.
Large aspect-ratio tokamak
Tokamaks typically have an aspect ratio, R/a, of 3^ and large tokamaks
usually have vertically elongated cross-sections. Precise mhd stability
calculations for these configurations are carried out using numerical
computer codes. However, the understanding of the underlying structure of
the problem, involving the types of instability and stability limits, derives
from calculations for a large aspect-ratio, circular cross-section tokamak.
In this limit much of the calculation can be carried out analytically and
such calculations provide both a good introduction to mhd stability and
a terminology to discuss more complex cases.
It might be expected that in the limit of very large aspect-ratio the
stability of a tokamak plasma would be the same as that of a cylinder.
It turns out that although this is the case for some modes, for others the
toroidal nature of the instability persists even at large aspect ratio. The
explanation follows from the fact that a tokamak, by definition, has a
safety factor q of order 1. This means that
Thus, as the aspect ratio is increased the ratio of poloidal to toroidal field
must be decreased. Geometrically this means that no matter how large
R/a, the field lines still traverse only q ~ 1 times around the torus to
complete a poloidal transit. As the aspect ratio is increased this toroidal
feature persists. Had the ratio Bq/B^ been held constant q would be
proportional to a/R, and in the large aspect-ratio limit the plasma would
be described by cylindrical theory and would have the stability of a pinch
configuration. The two basic consequences of the tokamak ordering are
(i) the number of low-mode number resonant surfaces is restricted, and

6.7 Kink instability 313
(ii) the curvature of the magnetic field lines on the inboard (smaller major
radius) side of the plasma is away from the plasma, in contrast to a cylinder
where the curvature is everywhere toward the plasma.
A further assumption which can substantially simplify the calculations
is that of low y6. When this assumption is made the equilibrium pressure
balance leads to further simplifications. In leading order the equilibrium
equation Vp = 7 x B takes the form
dp d Si 1 B, d
—+ — 1 —rBe = 0. 6.6.1
dr dr 2/^0 /xq r dr
In the low-y6 approximation p is taken to be of order Bq/I/j-q, that is
y6p ~ 1, and since B^ ~ {R/a)Bg, eqn 6.6.1 implies
dB^ 1 dp
Thus writing a/R = s, the large aspect-ratio, low-y6 ordering can be
summarized as follows:
and
dB^
dr
Je ~ £J0-
This set of assumptions simplifies the basic stability equations. In carrying
out the stability analysis the ordering also implies an expansion of the
perturbed quantities. For example SW can be expanded in powers of s,
and in the simplest cases only the leading order term need be considered.
6,7 '^'"'^ instability
The potentially strongest ideal mhd instability is the kink mode. It is so
named because it leads to the kinking of the magnetic surfaces and the
plasma boundary. At low y6 its driving force comes from the radial gradient
of the toroidal current. At higher y6 the pressure gradient contributes to
the instability.
For a circular, large aspect-ratio tokamak with low y6( ~ s^) the
potential energy of a perturbation can be derived using the form of SW

6.7 Kink instability
given by eqn 6.4.7. In this case B^, and R are taken to be constants.
A full calculation using this ordering shows that the leading order term
in 5 W is essentially that of a cylinder with a number of small terms
removed. Thus the calculation can be carried out using coordinates
(r, 9, (p) where (i?0) corresponds to the z coordinate of a cylinder.
Taking d/dr ~ A/r) d/d9 > (l/R) d/d(p, the minimizing perturbation has
V ■ ^ = 0, ^,. ~ ^0 ;>> ^0 and B^i ~ 5^1 > B^j. In this approximation
eqn 6.4.7 gives
Jo \/^o
Ja f^O
Jzo(B, i^e -
where B^ = Bj^ + Bg^, a is the radius of the plasma and b the radius
of a perfectly conducting wall. The first integral term in eqn 6.7.1
gives the plasma contribution SWp and the second gives the vacuum
contribution 5 Wy.
The perturbations are Fourier analysed in the form e'^'"^"'"^), and
V ■ ^ = 0 becomes
^e = --^{r^,). 6.7.2
mar
Then, using eqn 6.4.4, the magnetic perturbations are
R dr I Im q,
r^r\
where q{=rB,j)/RBg)is the safety factor.
It is convenient to take the Fourier amplitude ^, to be real, and then Bq \
is real, and^g and B, \ are imaginary. Allowing for the phases, substitution
of eqns 6.7.2 to 6.7.4 in the plasma part of eqn 6.7.1 gives
1 d R \{n \\ d
r dr B^ [\m q) dr

6.7 Kink instability 315
After some cancellation, and integration by parts to remove terms
involving ^, d^, /dr(=^d^^/dr), eqn 6.7.5 becomes
Iqa \m qaj \m qa J j
where the subscript on ^r has now been dropped and the subscript a
indicates the value at r = a.
The vacuum contribution to 5 W is most readily calculated by solving
forthe flux function V^ defined by Bh =-(l/'")9V^/36'and B(?i =3f/3r.
Then if satisfies Laplace's equation
1 d / df\ m^
and since
By = Brl + Bgy
^^*^H^/
the vacuum term can be written
m Ja
-i^liv^'-^im)]
and using eqn 6.7.7
n^R ( dir\\'
MO V dr J1^
The solution of eqn 6.7.7 is
if = ar"' + fir'"'.
For a conducting wall at r = b, B, (b) = 0, and
condition is
^ = 0, r = b.
,,
--(-")[|
6.7.8
6.7.9
so the outer boundary
6.7.10
At r = a, Br is continuous so that, taking B^i from the plasma
equation 6.7.3 with the vacuum solution Br\{a) = —imxl/a/a, the inner

6.7 Kink instability
boundary condition for the vacuum region is
V.« = Be«(—-l)?a- 6.7.11
Substituting boundary conditions 6.7.10 and 6.7.11 into eqn 6.7.9 gives
the solution
^ = B,.p-l)^''^ W ^^ 6.7,12
and substituting eqn 6.7.12 into eqn 6.7.8
5W. = ^,.xf^-lVa\2 6.7.13
m \m qa J
where
1 + (fl/^)^'"
1 - (fl/^J'" ■
The complete form of i5W is now obtained by adding eqns 6.7.6 and
6.7.13 and this gives
S|f[(-S"-'-"'](;'
<?/
qa \m qaj \m qaj ^ '
6.7.14
If there is a conducting wall at the surface of the plasma, the boundary
condition is ^a = 0. It is seen from eqn 6.7.14 that in this case SW > 0
and the plasma is stable. For any position of the conducting wall, including
^-»cx), i5Wispositiveforallmodeshavingm/n < ^^. If ^ is an increasing
function of r, modes having a resonant surface within the plasma will have
m/n < qa and will therefore be stable.
Since outside the plasma q a r^, modes with resonant surfaces
outside the plasma have m/n > qa. Such modes can therefore be unstable.
A straightforward way to determine stability for a particular case is to
solve the eigenmode equation
I [(pa,2 - F^)r^(r?)] - ^m\pco' " ^'^ " ''^J ^ = «'
where p is the plasma density, F = (m — nq)Bg/rfiQ , and the mode
has a time-dependence exp — icot. The boundary condition to be applied
at the origin is ^ ex r"^~\ and that at the plasma surface is
d _ m{m-nqa9 ( ^ \ _
This condition represents the requirement of pressure balance and the
condition that the plasma boundary remains a flux surface.

6.7 Kink instability
Fig. 6.7.1 Growth rate of modes
m = 1,2, and 3 for the parabolic current
profile J = jo(l - (''la)')< as a function
J4i^
U.8
0.6
0.4
0.2
00
m=l
/ \ m=2
r\
\ \ i\
0 1 2
m=3
3
Fig. 6.7.2 Stability diagram for kink
modes foi the current distributions
J = jo(l - (; /a)-)" The vertical axis
measures the peaking of the current as
given by qalqo(= " + 1) and the
horizontal coordinate is proportional to
l/(?„ and therefore to the total cuirent
Mode numbers (" )
1 2 1 323 1 2 3 4 567
8765 4 7 3 857 2
Figure 6.7.1 gives growth rate, y(= (W,), for a parabolic current
distribution and Fig 6 7.2 shows the regime of stability for the class
of current profiles j = jo{\ - {r ja)^Y. The broad band of instability in
the upper part of this diagram is due to the destabilizing effect of the
current gradient close to the surface of the plasma arising from the flatness
of the current profiles The protrusions of instability into the lower part
of the diagram, where the current profiles are more peaked, are due to the
proximity of the external resonance surfaces of the various modes to the
surface of the plasma and hence to the current gradients in the plasma
The onset of stability as the resonant surface reaches the plasma surface
from outside, that is qa -> m/n, is a misleading feature resulting from
the ideal mhd model It can be seen from Section 6 9, on the stability
of teaiing modes, that the inclusion of resistive effects removes this
stability boundary and leads to instabilities with resonant surfaces inside
the plasma

6.8 Tearing modes
Tearing modes
The teanng instability in a tokamak is driven by the radial gradient of the
equilibrium toroidal current density The name derives from the tearing
and rejoining of magnetic field lines which occur during the instability
as a consequence of finite resistivity
The growth of the instability is sufficiently slow that, over most of the
plasma, inertial effects are negligible Also, over most of the plasma the
resistivity is negligible and the motion conforms to ideal mhd However,
at the resonant surface for the mode the d x B contribution to Ohm's
law goes to zero and, in the neighbourhood of this surface, the r]] term
becomes important in balancing the induced electric field, E
Thus the theory of teanng modes involves solving one set of equations
over most of the plasma and another set in a resistive layer around the
resonant surface. The complete eigenfunction then requires a matching
of the resulting solutions and the condition for matching determines
the growth-rate eigenvalue The matching procedure is illustrated in
Fig. 6 8 1
Outer region
In the outer region inertia is negligible and the perturbed plasma is in
force equilibrium, that is
j X B = -Vp,
Fig. 6.8.1 Showing a typical form of
Br(r) The full line in the expanded view
of the inner region is the actual (resistive)
solution. The dashed line shows the
continuation of the outer (ideal) solution

6.8 Tearing modes 319
and since the curl of a gradient is zero
V X 7 X B = 0. 6.8 1
Using the vector relation 14 1 7 with V B = 0 and V 7 = 0, eqn 6 8.1
becomes
B Vj-j VB = 0 6.8 2
The large aspect-ratio ordering will now be applied Taking
£ = a/i? <?C 1, the ordering of the equilibrium quantities is
r Ar
Je ~ SJ4>
and the appropriate ordering of the perturbed quantities is
B^l ~ sBrl ~ sBgi
where the suffix 1 refers to the linear perturbations
With this ordering the required component of eqn 6 8 2 is the toroidal
component and since j VB^ <^ B Vy^ the equation governing the
outer region is
(B.Vj^)i=0 6.8 3
It IS convenient now to introduce a magnetic flux functions In the present
ordering V ■ B = 0 gives
3(rB,i) dBey ^^
dr de
and so the appropriate flux function, ^, is defined by
r 00 or
Thus, substituting eqns 6 8 4 into Ampere's law,
2 1 3 3V^ 1 3V
Wnting eqn 6.8 3
B-Vy^i+Bi ■ Vj^ = 0 68 6
and taking the perturbations to have the form e'('"^~"'^\ eqns 6.8.4 - 6.8 6
give
^-^)vV-

6.8 Tearing modes
and so, using q = rB^/RBg, the equation for the outer region is
id dV:^^ di,/dr ^^^
r dr dr r^ ^ (] _ 11\
If eqn 6 8.7 is multiplied by rij/ and integrated over a region ri to r2 it
gives
dj0/dr
/;{'
iBg/fie)a-(nq/m))'^ J V dr y
The first two terms represent the stabilizing effect of line bending and the
third represents the energy associated with the destabilizing effect of the
equilibrium current gradient The boundary term describes the Poynting
flux.
Equation 6 8 7 can be integrated outward from r = 0 and inward from
r — a using the appropriate boundary conditions. However, the equation
has a singularity at the resonant surface, r — rg, where q = m/n. It is
in a layer around this surface that eqn 6.8 7 fails and a separate analysis
taking account of resistivity and inertia is required. The matching of the
inner and outer solutions is carried out by equating the values of dip-/dr
and of if in the region of overlap. More precisely, because the solution is
linear, it is only the ratio (dip-/dr)/\lf which is involved. Equation 6.8 7 is
solved in the two regions r > rg and r < r^ and these solutions determine
the discontinuity. A', in ip-'/ir across r = r^, A' being defined by
A' = y £ ^ 0.
This proceduie is not quite straightforward and the details will be
described in Section 6 9. Having obtained A', it is equated to the change
in V^'/V^ across the inner layer as determined from the solution of the full
equations, including resistivity and inertia, in this layer
Resistive layer
Two equations govern the behaviour in the resistive layer. Ohm's law and
the equation of motion. The required form of Ohm's law is
E + vxB = r]j
Taking the curl of this equation and using Faraday's and Ampere's laws
gives
dB n
+ Vx(d X S)= —V X V X B 688
dt fio
The linearized form of the radial component of eqn 6 8.8 relates the linear
quantities B^ and v,

6.8 Tearing modes 321
The separate modes are obtained by taking the perturbed variables to
have the form exp(yf + im9 — mcj)). Thus, using eqn 6 8.4 to write
Br = —im ^jf/r and regarding r as constant in the layer, eqn 6 8.9 becomes
Yf + Be(\~—\v, =^VV
\ m / un
6.8 10
The resistive layer is narrow and so the radial derivatives in V^ dominate
Equation 6.8 10 then gives the required form of Ohm's law
dr2
r] r] \ m/'
Equation 6.8.11 will be solved in conjunction with the equation of motion,
and the resulting solution determines the change, A[^, in V^'/V^ across the
layer The solution has an almost constant ij/ through the layer and this '^-^
allows eqn 6 8.11 to be integrated across the layer to give
n^-vi^-m)'
Because the layer is narrow the equilibrium quantities are to be regarded
as constants except that, since A — nq/m) = 0 at the resonant surface,
this factor must be expanded in the form
(l-^) = -(^). where. = (r-r,). ''
Equation 6.8 12 then becomes
MX
d..
It IS now necessary to evaluate Vr/i^ from the equation of motion
p-j^jxB-Vp
at
Taking the curl of this equation gives
dv
V X j X B = Vxp— 6.8.14
dt
Equation 6 8 14 is the same as eqn 6 8 1 with the addition of the inertial
term. Thus, again taking the axial component of the equation and
assuming incompressibility, the dominant additional term in the inner layer is

6.8 Tearing modes
given by
yp d^v,
Including this term in the analysis, eqn 6.8.7 becomes
ypr^ d^Vr _ ^(-. _ M\ ^V _ dj^
m2 dr2 ~ ^0 V m ) dr^ dr "^
Using eqn 6.8 11 to eliminate d^ifr/dr^ in eqn 6 8.15 gives
\pr]yr^q^l^
di'^ yPVY'' 1 I p'qr'^q pyr'^ dr
Since if/ IS taken to be constant, eqn 6.8.16 is an inhomogeneous equation
for V, The solution is a sum of parts which are odd and even in s. Only the
odd part, ansing from the first term on the right hand side of eqn 6 8.16,
contributes to the integral in eqn 6 8.13
Equation 6.8.16 is written in a more convenient form by introducing
the characteristic length d and new variables x and y defined by
/4
/ 2 2\'/'^
pyr^q
and y =
d nP-Bgq'd^ ij/
where y and Vr here represent only the odd part of the solution of
eqn 6 8 16. Thus, making the substitutions, eqn 6.8 16 becomes
d^y
-4r = -xa-xy) 6 8.18
dx^
and equation 6.8.13 becomes
a; = ^^ r
(l-xy)dx. 6.8.19
The limits of the integral have now become effectively ±oo on the scale of
the layer Substitution of the solution y{x) of eqn 6.8.18 into the integral
of eqn 6 8.19 gives the required quantity A^^^.
The solution y and the form of the integrand in eqn 6 8.19 are shown in
Fig 6.8.2 The integral of eqn 6.8.19 IS equal to 2.12 and hence, equating
Ajj^ to A' yields the dispersion relation for the tearing mode
A'= 2.12^^^. 6 8.20

6.8 Tearing modes
Fig. 6.8.2 Solutions for \ and A
across the resistive layer
Substitution for d from eqn 6 8.17 into eqn 6.8 20 gives the growth rate
\2/5\
=0 55('rAfV^!!^i:^
A'4/^
Written as a function of the characteristic resistive diffusion time
tR =
and the Alfven transit time
B^/{fJ.QP)
the growth rate is
0 55 /
^ ~ 3/5 2/5 \''
/2
a
—
R
aq_
(aA')^/
For B^ ^ 5 T, a deutenum plasma with n^ = 10^° m"^, Tg = 5 keV and
a = 1 m has characteristic times tr ~ 10 mins and ta ~ 0 1 /xs, giving a
growth time y^^ ~ Tj^' t/ ~ 70 ms The layer width can be determined
using eqns 6 8 17 and 6 8 20. This gives d ~ a{x\/x-R)^/^ and for the
above example the width is ~0 15 mm This is an order of magnitude
less than the ion Larmor radius and it is seen therefore that the simple
model of the resistive layer is of limited applicability However, the outer
solutions retain their validity and, as will be described in Section 7 3, the
resistive layei analysis can be replaced by a more satisfactory nonlinear
treatment.

6.9 Tearing stability
6.9 Tearing stability
The stability of tearing modes is determined by the solution of eqn 6.8.7
and the resulting value of A' It is seen from eqn 6.8.21 that marginal
stability corresponds to A' = 0. Instability occurs for A' > 0. To
determine stability therefore it is only necessary to find the sign of A' However,
eqn 6.8 7 is singular at the resonant surface and some care is needed in
the calculation
If eqn 6.8.7 is expanded about the radius, rg, of the resonant surface,
with
V m /
(r-rs)
then, keeping only the dominant terms, eqn 6 8 7 becomes
dV ^ /dj/dr q\ jr ^^
dr2 \Be/fioq'/,^r-r,
d^2
69.1
where s = r — r^ and k = —{n.QJ'q/Bgq'),^ Equation 6.9 1 has a
singularity at i' — 0 and the general solutions are also singular at this
point. The leading terms of the two independent solutions have the form
f=l+Ks\n\s\+ ■
f = A(s + \ks^ + )
and so the expanded solutions for r < r^ and r > r^ are given by
f = \+Ks\n\s\^ hA".?+ r < rs
ir =\+Ks\ns^ hA+.?+ ■ r > r^,
where A~ and A+ are constants to be determined It is seen that, although
■^r IS finite at i' = 0, the solutions have the singular derivatives
if' = K{\n\s\ + \) + A~ r<r,
f = K{\n\s\ + l) + A+ r>n
However, in calculating the jump in ^j/' between s = ±.s the singular
terms cancel leaving
Thus A' can be calculated numerically by determining the value of A
which gives a solution of eqn 6.8.7 which satisfies the regularity condition.

6.9 Tearing stability
325
V^ = 0 at r = 0, and the value of A+ which gives a solution which satisfies
the chosen boundary condition at the edge of the plasma
This outer boundary condition is dependent on the position of any
conductor, such as the vacuum vessel, outside the plasma and this will be
discussed in more detail later in this section For the case of a conducting
shell at the surface of the plasma the boundary condition is
/ m \
ir=\ VyiJioo^jir r = a,
6.9 2
where y is the growth rate, cr is the conductivity of the shell and S its
thickness. In the limit of a perfectly conducting shell cr^-oo, and condition
6 9 2 becomes ^^(a) = 0. In the opposite, high resistance, hmit cr -» 0
and the boundary condition becomes ip-'{a) = —(m/a)\l/(a) giving the
solution which falls to zero as r -» oo
Thus, given the boundary condition, A' can be calculated numerically
by solving eqn 6 8 7. One procedure is to start solutions at r = rg with
trial values of A~ and A+ and to adjust these values until the resulting
solutions satisfy the boundary conditions at r = 0 and r = a.
For sufficiently large m, depending on the current profile, tearing
modes are stable. This is due to the m^ dependence of the stabilizing
line bending term in eqn 6.8 7
Values of Ts A'for them = 2 mode are given in Fig 6.9 1 for a parabolic
current profile with and without a perfectly conducting wall. Without a
conducting wall A' > 0 and the mode is unstable for all positions of
the resonant surface. The presence of a conducting wall {Inly affects A'
for values of rg close to a. For resonant surfaces sufficiently close to the
plasma edge the conducting wall makes the mode stable
Fig. 6 9.1 Plotsofr,A'(;,)form = 2
and toroidal current density
y = yo(l-('V«^)). A'> Ogives
instability The lower curve shows the
stabilizing effect of a perfectly conducting

6.9 Tearing stability
Fig. 6.9.2 Stability diagram for tlie
m = 2 kinlc and teanng modes for curre
iistiibutionsy = yo(l - (r-/a^)y
cJtability for qo > 2 results from the
absence of a resonant (q = 2) surface
^J%
In Fig. 6 9 2 the region of instability of the m = 2 mode is shown for
current profiles of the form
'{'-Gf
It is seen that the tearing instability is continuous with the kink instability
as the resonant surfaces pass through the plasma boundary For these
profiles and normal tokamak operation (.^o ^ 1) the presence of a <? = 2
surface in the plasma implies instability of the m = 2 tearing mode.
The values of rgA' for low m modes, in the limit r, -» 0, are
m
2
3
4
rsA'
11.22
2 46
-2.01
Conducting wall boundary condition
When m = 2 teanng modes are observed at low amplitude they usually
have a finite real frequency. This is due either to a natural frequency of
the mode arising from effects not included in the above analysis, or to
a rotation imparted to the plasma by, say, neutral beam injection. This
affects the influence of a conducting shell because the penetration of
magnetic perturbations into the shell is a strong function of the frequency
At low frequency the field penetration is characterized by a resistive time
Ts ~ fioabS where b is the radius of the shell, S its thickness and a its

Fig. 6.9.3 Showing the geometry
involved m calculating the plasma
boundary condition in the presence of a
conducting vessel
B.9 Tearing stability 327
Vessel
conductivity. At sufficiently high frequencies cor^ » 1 field penetration
does not occur because eddy currents shield out the perturbation.
Figure 6.9.3 gives the geometry. The required boundary condition at
the surface of the plasma is obtained by solving the equations for tp- in
the outside regions. Ampere's law can again be written in the form of
eqn 6.8.5. In the vacuum region this becomes
1 d df
6.9.3
In the conducting shell j =aE and in the large aspect-ratio
approximation the required component is that in the 0 direction. Thus
1 d Air
r dr dr
yif + IJ-oaE^.
From Faraday's equation, V x E =
of f given in eqns 6.8.4,
6.9.4
-dB/dt so that, using tlie definition
6.9.5
Thus, taking the time dependence to be exp —icot, eqns 6.9.4 and 6 9,5
give the equation for the conducting shell'
1 d dif (m^ . \
r dr dr V '" /
6.9.6
Considering the first vacuum region the solution of eqn 6.9 3 has the form
f = Cr'" + Dr~'" a < r < b
and consequently
1 + / (a/bf"
(fl
vV'/a al-fia/bf"
where
(r/i^), - (m/b)
6.9.7
/ =
ir/fh + im/b)'

6.9 Tearing stability
It remains to calculate {if'lif)b by matching the solution through the
resistive shell to the outer vacuum solution which has the form
iff = Fr~'" b + S < r < oo. 6.9.9
For frequencies of interest the effect of the resistive shell is to produce
a change in ij/' across the width S with only a small change in if It is
convenient therefore to integrate eqn 6 9.6 across the shell using a constant
if approximation. Thus
Using eqn 6.9.9 and taking S <^b
Substitution of eqn 6 9.11 into eqn 6.9.10 gives {if'/if)b, and substitution
of this expression into eqn 6.9 8 with the approximation S <^ b/m gives
Ts = '—— 6.9 13
is the characteristic resistive time constant of the shell. Equation 6 9 7
together with eqn 6.9.12 now provide the boundary condition to be applied
at the surface of the plasma.
For &), Ts ;>> 1, / ^- 1 and iif'/if)b -^ oo implying ifb -^ 0. This is
the result of the decreasing penetration of the magnetic field perturbation
at high frequency, making the resistive shell behave as a perfect conductor.
In the opposite limit ft^r^s -^ 0, f ^- yTs/(m+yTs) and the shell appears
as a good conductor (/ « 1) for high growth rates and loses its effect
completely for y -^ 0. Thus for &)r = 0 the conducting shell does not
affect the stability boundary, at which y = 0 and therefore / = 0, it only
affects the growth rate
For finite perturbations interaction with the vacuum vessel can cause a
lowering of the frequency of an instability and at large amplitude the mode
locks to the vessel, bringing the frequency to zero. This in turn introduces
the possible effect of static error fields arising from the structure of the
external coils. These effects are described in Sections 7 10 and 7.11.

6.10 Internal kink
Internal kink
N J '
Fig 6 10 1 Showing (a) the
displacement of a circular flux surface for
an m = 1 perturbation and (b) the radial
dependence of ^ for an unstable
displacement.
The internal kink instability is characterized by having the azimuthal
mode number m = I, and toroidal mode number « = 1 Consequently
the resonant surface for this mode, given by m =; «^, is ^ = 1. Thus
the instability only occurs if there is a ^ = 1 surface in the plasma,
and consequently a sufficient condition for stability is that the minimum
value of q be greater than unity. With a current density which decreases
monotonically with radius the minimum value of q is qo, the value on
axis The internal kink mode is then stable if ^o > 1
The internal kink mode is distinguished from other modes by the fact
that m = I, n = I implies a radial displacement whose azimuthal
variation is given by cos(^ — 0). For each poloidal plane this corresponds to a
simple displacement of each flux surface as illustrated in Fig. 6.10 1(a).
The significance of this becomes apparent from the large aspect-ratio
approximation, s = a//?<?Cl, for the potential energy for internal modes
given by eqn 6.7.6.
l^oRo Jo V dr
-i)r
ia-
dr + Ois^),
6 10.1
where ^ is the amplitude of the radial displacement, and the small term
is Ois^) with respect to the leading term.
It is seen that for m = 1, a rigid displacement, ^ = constant, reduces
the integrand to its minimum value, that is zero However, eqn 6 10 1 is
for internal modes having ^a = 0, the surface terms in SW having been
neglected. Thus a constant ^ IS not allowed Figure 6 10 1(b) shows a form
for^(r) which is wholly internal and makes 5 W zero. The displacement is
rigid within the <? = 1 surface and zero outside The inevitable distortion
between these two regions is taken up at the ^ = 1 surface At this surface
the perturbation has the same helicity as the magnetic field Consequently
the energy change can be made arbitranly small by localization of d^/dr.
From eqn 6 10.1 the resulting energy change is proportional to
/:(
(q'xy dx
and this is 0{S), going to zero asS -^ 0.
It is seen therefore that, in the leading order in s, the minimum value of
SW IS zero Thus the mode is marginally stable to this order and stability
depends upon the sign of the 0{s^) term in eqn 6 10 1 This term can
be straightforwardly calculated for a cylinder but the toroidal result is

B 10 Internal kink
completely different This can be seen from the toroidal SW which can
be written in the form
SW= (l~\)sWc + 27T^R^l-^(-ySWj,
where ^o is the zero order constant displacement described above, SWq
IS the value of SW for a cyhnder, SWj is a dimensionless representation
of the toroidal contribution and r\ is the radius of the ^ = 1 surface. It is
seen that for the important n = I mode only the toroidal term remains.
The toroidal calculation is quite complicated For the large aspect-ratio
case with simple current profiles and small r\ ja the result for 5 Wt is
5Wt = 3A - ^o)
(il-^
6 10 2
_/(;'(p-p02rdr
where pi=/7(ri) and, since <3'(ri)=l, Bei ={ri/R)B^ Equation 6 10.2
gives instability for fip\ > 0 3. For larger r\ ja instability is predicted for
lower values oi^p\, as shown in Fig. 6 10 2.
The result described above is dependent on the profiles having the
assumed form In particular it was assumed that the q profile is similar to
that in Fig. 6 10 1 However, for q profiles which are flat within the ^ = 1
surface the result is different For m = « = 1 the factor {njm — XjqY in
Fig 6 10.2 Ciitical value of/ipi as a
function of r\ for current profiles
] = yo(l - O-^/a^))". (Bussac, M.N
et al. Ph^s. Rev Lett. 35, 1638 {\91'>).)

6 10 Internal kink
331
eqn6 10 1 becomes A — 1/^)^ andif^ remains sufficiently close to 1 this
factor is reduced to 0{s^). This invahdates the separation of the leading
term in eqn 6 10.1 from the 0{s^) term When the analysis is carried
out with the changed ordering a different type of instability is found.
Physically the term involving A — \/q)^ describes the stabilizing effect
of magnetic field line bending, and the constant ^ solution allows this
stabilizing effect to be avoided When ^ % 1 the line bending contribution
becomes less important and is comparable with the destabilizing terms.
The most unstable mode then takes the form of a convective cell as shown
in Fig 6 10.3 rather than a ngid shift The magnetic field fines are almost
parallel to the perturbation helix and the convection almost interchanges
the field lines For this reason this form of the m = 1 instability is called
a quasi-interchange instability.
When the m = 1 mode is taken into account, the stability diagram
6.7 2 IS modified to the form given in Fig 6 10.4, further restricting the
predicted stable region. The experimentally observed behaviour of the
Fig. 6 10.3 Flow pattern of
quasi-interchange (go = 1.0) and ngid
shift (go = 0-8).
Fi g. 6.10 4 Kink stability diagram
(Fig 6 7 2) with inclusion of internal kink
stability boundary

6.11 Resistive n:
m = I instability is described ii
oscillations
Section 7.6 which deals with sawtooth
Resistive i
-- 1 modes
As with the m > 1 kink mode described in Section 6 7 the introduction
of resistivity extends the instability of the internal kink mode. The effect
of resistivity again appears in the behaviour of a narrow layer about the
resonant surface, in this case the ^ = 1 surface. The degree of instability
is measured by the potential energy SW characterizing the configuration.
For SW < 0 the ideal mode described in Section 6.10 is unstable As SW
is increased there is a range of small SW around zero where a resistive
form of the kink mode is unstable. As SW becomes more positive the
instability persists as an m = 1 tearing mode. This behaviour is illustrated
schematically in Fig. 6 111 which shows the dependence of the growth
rate on SW
The separation of the regimes is determined by a number of variables,
the range over which the resistive kink is unstable having the ordering
SW
where ^o is the core displacement
Fig. 6.11.1 Schematic graph of the
dependence of the growth rate of the
m = 1 mode on 5W, illustrating the
transition from the ideal tank (SW < 0) to
the tearing mode (SW > 0) through the
resistive tank mode.

6 11 Resistive m = 1 modes 333
In all cases the basic eigenfunction has the form of the ideal mode, that is
^=^0 r<ri, ^=0 r>ri, 6 111
where q{r\) = 1 The resistive kink and the tearing mode will now be
described in turn
Resistive m = \ kink mode
In the resistive layer. Ohm's law and the equation of motion take the forms
derived for the tearing mode layer as given by eqn 6 8 11 and eqn 6 8 15
without the small dj^/dr term With m = n = \ these equations can be
expanded around r = ri to obtain
6112
6113
The solution of eqns 6 112 and 6 113 which matches the puter solutions
given by eqns 6 11.1 is
-d^f
"d^
^ d^
/here
!/; = -■
x = -
= y^ + yxl
i^
q'{ri)Be{ny
"''1 A ~
and y
>
= ytH
' = -2''['-'''7Wr^)
2 f _„2
erf(i') = —= I e da,
V^ Jo
and the eigenvalue is given by
Thus the growth rate of the resistive kink instability is
. {q'Be/^/H^fr!' .,,,
y = r—n^- 6114
and this may also be written
It IS seen that the growth rate is closer to the mhd time than the resistive
time. If ^ IS assumed to be parabohc around the axis and r\ is sufficiently

6.11 Resistive n
small, q'{ri) = 2A — qo)/ri. Using Spitzer resistivity and noting that
Bgin) = (ri//?)B0, eqn 6.11 4 then gives
6x10³ fil-qo)B^\y'
Y = —TT, ^e in keV, 6 115
rJ/'(«/1020)i/3 \ nR )
where «is the electron density For typical experimental values the growth
time y ~ ^ lies in the range
' 'A-^0J/3'^^'
small tokamaks having the faster growth rates
The m = \ tearing mode
As with the higher m-number tearing modes described in Section 6.8, the
growth rate of the m = 1 tearing mode is determined by matching outer
solutions to resistive layer solutions using the quantity A' The resulting
relationship is the same and is given by eqn 6.8 20 which, for the present
case, takes the form
A' = V2(r(|))V5/V'rr/n, 6117
where F is the gamma function and V2 (F (|)) =2 12 It remains to
calculate A', and for m = 1 this can be done analytically.
The radial component of V x B? + d x S) = 0 together with
Br = -d/r) 3^^/361 gives
if = B0{q-l)^
For r < ri, ^ can be separated into its zero order constant part ^o, and an
additional part ^i, so that
if = Beiq-l)i^o + ^i) 6 118
Now ^1 IS localized to the ^ = 1 surface and its value can be obtained
from the equation for SW which from eqn 6.10 1 can be written
SW(r)=7t^Rr\%a-qf(^) +g^Adr. 6 11.9
The minimizing solution is given by the Euler-Lagrange equation
g^ 6 1110
d /b
dr y^i
and substitution of eqn 6.11 10 into eqn 6.119 followed by an integration
by parts gives
SWir):=n^R-^ril-qr^^' 6 11.11

6.11 Resistive m = 1 modes 335
Since ^^' = ^o?i', and close tor = ri,(l - q) = -q'x,eqn6 11 11 can
be written
swin) 1
so that
_ SW I
^'~~n^R{rq'^Bl/iJio\,^0^
Thus, using eqns 6.11 8 and 6.11.12, the forms of V^ and V^'as r ^- ri are
f = {B0q')ix^i
if' = {Beq')i^Q
f^) =^. 6 11.13
Substitution of eqn 6.11 12 into eqn 6.11.13 now gives
(r_\ n^R{rq'^Bl/no),,eo
For r > r\ the constant term in ^ is zero and consequently
(%-\ =0 6 1115
Equations 6.11.14 and 6.11.15 give the required A',
n^R{rq'^Bl/^Jio),,
A = -^ . 6.11.16
The teanng mode only occurs for i5W > 0, giving the unstable positive
sign to A'. The stabihzing role of 5 W in A' is clear from its appearance
in the denominator of eqn 6 11 16 The growth rate of the m = \ teanng
mode IS now obtained by substituting for A' from 6.11 16 in eqn 6 117
This gives
V 4/5
, Tt-Kira ha I" /an
y=055
As i5W ^ 0 the mode is transformed into the resistive kink instability
described earlier and when 6W < 0 the mode becomes an ideal kink

6.12 Localized modes
Unified m = 1 theory
The ideal kink, resistive kink, and m = I tearing mode can be analysed
together. This results in a single dispersion relation from which the three
modes appear in different limits. The dispersion relation is
f^(Y/Yvk)^^^-'^^
{r{y/y,k)^f^ + 5^
where a normalized potential energy is defined by
SWu--
2R{rBeq')lliJiQ
and Y^k is the resistive kink growth rate % t^" ' The ideal kink is
obtained in the limit of large y The quantity inside the outer bracket in
eqn 6 11.18 is then equal to one, and y = i5Wh/th As i5Wh -^ 0
eqn 6 1118 gives the resistive kink growth rate, y = y,jk, since
r(x) -^ 1/x as X -^ 0 The tearing mode occurs for i5Wh > 0, that
is ideal mode stable, and for y <§c y,^k The gamma functions are then
equal to constants and the growth rate becomes that of the tearing mode
as given by eqn 6.11 17
Localized modes
In the description of kink modes in Section 6 7 it was implicitly assumed
that the mode numbers m and n were small
High-« modes tend to be strongly stabilized by the energy required to
perturb the magnetic field However, the component of the equilibrium
magnetic field which is involved in the stabilization is that parallel to
the wave vector, and at a resonant surface this component is zero
Consequently high-« modes are concentrated around their resonant surfaces,
that IS the surfaces for which q = m/n In the limit« ^- oo the number
of such surfaces becomes infinite and their separation approaches zero
This limit allows a theoretical treatment of localized modes
In a cylindrical plasma the relevant part of the potential energy SW is
'Ihh
d?/
t^4-
where k = {m/r)ie + kj^ A necessary condition for the contribution
of the stabilizing first term to exceed that of the destabilizing pressure

6 13 Ballooning modes
gradient term is given by the Suydam criterion
where here, ^7^ = (B^rBg)'/(BJrBg)
In a tokamak the situation is much more complicated. The principal
difference is that, unlike the cylinder, the effective curvature of the
magnetic field lines changes sign along their length On the inner side of the
torus the curvature is away from the plasma and is stabilizing whereas
on the outer side it is toward the plasma and is destabilizing Calculation
of stability involves the appropriate averaging of these curvatures for the
most unstable displacement.
For a large aspect-ratio tokamak of circular cross-section the analogous
criterion for stability is the Mercier criterion
8/20 \q J
'{-p')(.l-qn
The term p'q represents the stabilizing contribution of the average
curvature of the toroidal magnetic field For q > I this is sufficiently
large that the resultant curvature is good and a negative pressure gradient
is stabilizing
Inequality 6 12 1 is only a necessary stability condition This is
because the toroidal geometry has only been partially ajjowed for A
complete treatment requires that the perturbations be more nilly optimised
to extract the free energy associated with the destabilizing curvature on
the outer side of the torus The resulting instabilities are called ballooning
modes and these are described in the following section
6.13 Ballooning modes
The locaHzed modes described in Section 6 12 are stabiHzed when the
appropriate average curvature of the magnetic field lines with respect
to the pressure gradient is sufficiently stabilizing The curvature is
stabilizing on the inner (smaller R) side of the torus and destabilizing on
the outer side of the torus, as shown in Fig 6 13.1 At low pressures the
average effect is stabilizing provided q > I However, if the pressure
gradient is too high a different situation arises. It is then possible for the
perturbation to be concentrated in the region of destabihzing curvature
The potential energy thus released can be greater than that required for
the line bending inherent in the vanation of the perturbation along a field
line The resulting instability is the ballooning mode

6.13 Ballooning modes
Fig. 6.13.1 Showing the stabihzing
curvature on the inner side of the torus
and the destabilizing ci
The ballooning instability is quite complex, but it is possible to
estimate the conditions for ballooning to be important from the following
simple picture The destabilizing energy available from the pressure
gradient is
5Wd'
-dp/dr
where Re represents the destabilizing curvature of the magnetic field line
and ^ the radial displacement The energy required for line bending is
where n/k\\ characterizes the length parallel to the magnetic field over
which the displacement vanes This is given by the distance along a field
line from the inside to the outside of the torus and so kw is of order l/qR.
Thus, taking Re to be the radius of curvature of the toroidal magnetic
field (~/?o) is seen that ballooning becomes important when the pressure
gradient is sufficiently large that
corresponding to an ordering ;6 ~ e/^^ where £ is the inverse aspect-ratio.
The determination of ballooning mode stability starts from the
equation for SW m the limit of large mode number. This is written in an
orthogonal coordinate system {\l/,x,(p) based on the magnetic surfaces
The poloidal flux if/ labels the magnetic surface, / is an angle around
the surface and 0 is the toroidal angle There is freedom to choose the
measure of the coordinate / The poloidal area element of the coordinate
system is given by i d^^ d/, J being the Jacobian.
In this coordinate system the required expression for SW is
SW -.
ll^ll^l'
-2/20
R^B^
I 1 n 1/
i/Bp XdX^Y]
Jdxdxff 6 13.1
The perturbation X is defined by X = RBp^^ where Bp is the poloidal
magnetic field and ^^ is the displacement normal to the flux surface.

B 13 Ballooning modes
339
The operator ifc|| is defined by ife|| = (JB)"'(9/9/+mv) where n is the
toroidal number and v = JB^/R.k^ and /Cg are the normal and geodesic
components of the magnetic field line curvature, the geodesic curvature
being the curvature of the field line within the magnetic surface. The first
and second terms give the energy involved in bending the magnetic field
lines and the third and fourth terms give the energy arising from the
coupling of the pressure gradient with the normal and geodesic curvatures.
The first and third terms correspond to the contributions used in the
introductory description of ballooning given above To relate the coordinates
to the more familiar variables of cylindrical geometry, ^ corresponds to
the radial coordinate r, and / to 0.
Minimization of eqn 6.13.1 leads to an Euler equation This equation
can be solved by extending the periodic vanable / to the infinite range
—oo < y < +00 and using the eikonal transformation
X = Fexp
{-infvdx)
J dy
-(-^J'^J
2/.0 dp I fRBl fy dv \
^Ay \F = Q.
Marginally stable states will have solutions which are zero at y ^- ±oo
but have no other zeros. The condition for instability is that a solution of
eqn 6.13.2 which is zero at y ^- —oo has a zero for a finite value of y.
A symmetric solution for a marginally stable case is shown in Fig. 6.13.2.
Fig. 6 13.2 Solution of eqn 6.13.2 for a
marginally stable configuration.

6 14 Ballooning stability
6.14 Ballooning stability
Calculation of stability against ballooning modes requires the solution
of eqn 6 13.2 at each flux surface. Usually the stability of a set of
representative surfaces is determined by numerical computation.
A simple model which can be analysed more directly is the large
aspect-ratio tokamak with circular flux surfaces. In the calculation of SW
for this case it is assumed that the equilibrium has y6 ~ (a/R)^. However,
instability occurs for (r d/7/dr)/(B^/2/2o) ~ a/R The results obtained
are therefore formally only applicable when the local pressure gradient
is enhanced. Nevertheless this model brings out important results and
provides a conceptual framework for discussing ballooning modes.
For this case SW takes the form
-l[
A + A')
/dF\
- a(Asm9 -]
)se)F^\de, 6.14.1
A = s9 —a sin 9
r_dq_
' qdr
and
IfipRq^ dp
B2 d7'
s being the surface average magnetic shear and a a measure of the
pressure gradient responsible for the instability. The term proportional
to {dF/d9)^ represents the stabilizing effect of line bending and the
a cos 9 F^ term gives the destabilizing effect of the pressure gradient
coupled with the cos 9 dependent normal curvature of the magnetic field
lines. The a A sin 0 F^ term gives the shear dependent contribution arising
from the geodesic curvature, A being related to the shear by the equation
dA
d^ '
s — a cos 9,
a cos 9 giving the 9 dependence of the shear around the surface.
Minimization of SW leads to the Euler equation
— \{l + {s9-asm9f)—UaLC^ei-a sine*) sin6'+cos6']F = 0
d9 I d9 \
6.14 2
and the form of the solution of eqn 6.14.2 determines stability. Marginally
stable surfaces have values of s and a for which the solution has F ^- 0
a.t9 ^- ±oo and no other zeros. The stability boundary in (s, a) space

6 14 Ballooning stability
2.0
1.0
0
Stable
A)
\\ Unstable \
B)
Fig. 6.14.1 (a) Ballooning mode
stability diagram for circular flux surfaces
showing the first A) and second
B) stability regions, (b) Marginally stable
pressure for a parabolic current profile The
associated q and s profiles are also shown.
has been determined by numerical calculation and the result is shown in
Fig. 6.14.1(a).
The stable region at large s and small a is due to the stabilizing effect
of line bending As the shear is decreased and the pressure gradient is
increased instability arises as might be expected. However, surprisingly,
further reduction of shear leads to a second region of stability.,The origin
of this can be seen from eqn 6.14.1 In the limit of small s and large a,8W
takes the stable positive definite form
-h'-'ii:-sh^'}
Fig 6.14 2 Bean configuratioi
achieving second region stability.
The two terms in eqn 6.14.3 have arisen from the 9 dependent part
of the shear as represented by the a sin 9 contribution to A. Thus the
second region of stability is generated by a modification of the toroidal
equilibrium at low shear caused by the pressure gradient.
Each point in the {s,a) diagram corresponds to a particular flux surface
m the plasma Thus a complete plasma configuration is represented in
this diagram by a line. This line will start from the origin and, in the case
with zero pressure gradient and zero current density at the boundary, will
terminate at the point a = 0,s = 2.
For a given current profile the shear is determined. Figure 6.14 1(a)
may then be used to calculate a pressure profile which is at the margin of
stability for the first region at all radii across the plasma. Figure 6.14.1(b)
gives the result for a parabolic current profile, this profile corresponding
to a shear s = l/((a/rJ - 1).
The second region of stability can be obtained either by adjusting the
required pressure and q profiles in a tokamak of usual cross-section, or by
shaping the plasma boundary to a 'bean' shape as illustrated in Fig. 6.14 2.

6.15 Axisymmetric modes
The introduction of resistivity leads to a resistive ballooning mode.
In the absence of other physical effects such as finite Larmor radius
and viscosity these modes are universally unstable but have a small
growth rate.
The high-n analysis described above does not comprehensively deal
with ballooning modes The low mode number pressure driven
instabilities need to be treated separately This becomes especially the case when
the magnetic shear is small The plasma is then susceptible to instability
if the region with slowly varying q has a q value which is close to a
rational value m/n for low mode numbers. These instabilities are often
called infernal modes.
Axisymmetric modes
Elongated tokamak plasmas are susceptible to an axisymmetric instability
in which the plasma undergoes a basically vertical motion. Since the
eigenmodes have a toroidal dependence e"'""^ such instabilities are also
called n = 0 modes.
In the absence of a conducting wall a circular cylindncal plasma is
neutrally stable to a rigid displacement. If however the plasma is elongated
It IS unstable to a motion in the direction of elongation. In the presence
of a perfectly conducting wall there is a critical elongation for instability
The practical case is more complicated. Firstly because of toroidal
effects and secondly because of the presence of adjacent structures of
varying degrees of conductivity.
The elongation of the plasma is due to currents in external conductors
A simple example of such an equihbrium is shown in Fig. 6.15.1. If the
plasma is displaced there will be a perturbed vertical force on the plasma,
®
0
0
Fig. 6.15.1 Elongated equilibrium with
external conductors.
0

6.16 ^ limit
343
resulting from the changed position of the plasma and from currents
induced in the plasma and possibly in the external conductors. The plasma
is unstable if the resultant force is such as to increase the displacement.
In simple cases the instability can be described in terms of the
equilibrium magnetic field produced by external currents Thus in the
case of an almost circular, large aspect-ratio plasma without stabilizing
conductors, stability is determined by the magnetic field decay index
n = -(R/B^) dB^/dR where B^ is the vertical magnetic field and R the
major radial coordinate The criterion for stability is that n > 0.
The stability analysis for practical cases requires a numerical
calculation. However, some insight may be obtained from simpler cases for
which an analytic treatment is possible. Figure 6.15.2 shows a cylindrical
elliptical plasma with minor and major semi-axes a and b surrounded by
a perfectly conducting confocal elliptical shell with semi-axes a' and b'.
The current density in the plasma is uniform. The criterion for stability
against a vertical motion is
b-a ( b + a\^ ^ ,^ ,
Fig. 6.15.2 Elliptical plasma and
conducting shell.
If this cntenon is violated instability occurs on an inertial time-scale.
If the surrounding shell has a finite conductivity, failure to satisfy
criterion 6.15.1 leads, as before, to an inertial instabihty. If, on the other
hand, the criterion is satisfied, instability still results, but now with a
growth rate related to the resistive penetration time of the^hell, tr. For
large tr the growth rate is given by y = {Dx^)~^ where the quantity
b-a \b' + a'J
measures the extent to which criterion 6.15.1 has been satisfied.
It has been found from numerical calculations that there is a toroidal
stabilizing effect. This increases the critical elongation at which there is
a transition from inertial growth to growth on the resistive time-scale, tr.
limit
y6 IS a basic mhd parameter measuring the confined pressure and, since
there are mhd instabilities driven by pressure gradients, it is natural
to expect that fi will be subject to a stability limitation. However, the
concept of a y6 hmit is not precise. Stability depends on profiles, and
any optimization introduces the questions of which modes of
instability to include and what mode numbers to allow. Furthermore there is

Fig. 6 16.1 Early calculation of p limit
for JET showing an approximate linear
dependence on I/aB^ for I/aB^ <3
(Wesson, J A. in Stringer, TE Computer
Physics Communications 24, 337 A981))
uncertainty as to the seventy of the nonlinear consequences of the van-
ous modes Nevertheless the intrinsic usefulness of a concise analytic y6
limit in assessing possible tokamak performance has prompted a number
of investigations.
The simplest case to consider is the limit imposed by ballooning
modes. In the introductory discussion of ballooning mode stability in
Section 6.13 it was seen that a hmit y6 ~ s/q^ might be expected,
where s = a/R. In terms of operational parameters this would mean
y6 ~ {I/aB(j))^/s. However, this is not correct.
The first indication of the correct scaling came from optimized stability
calculations for JET. When plotted against //aB^, the fi dependence was
found to have the essentially linear dependence shown in Fig. 6.16 1. The
turnover at high y6 is due to the instability, at low q, of the low-m modes
included in the calculation.
The approximate linear scaling can be understood by considering the
case of a large aspect-ratio circular plasma. The definition of y6 is
P =
In /o° pr Ar
na^Bl/2^lo
and integrating by parts
dp 2
2/^0 r _^
" a^BJ Jo Ar
The pressure gradient stability limit plotted in Fig 6 14.1 can be
represented reasonably well by a straight line as shown in Fig. 6 16.2. This
line is i' = 1.67a, which can be written
IjlqR q^ dr

3.16 ;S limit 345
Fig 6.16 2 Approximation of the
ballooning mode stability boundary s(ci)
by a straight line
An equilibrium which satisfies this equation everywhere has a y6
determined by eqn 6.16.1, that is
Ra^ Jo dr V^
Taking the central value of q to be limited, this y6 is maximized with
respect to qir) by a configuration in which the current is carried within
a constant current density central region, outside which the current is
zero This limiting case is physically unrealistic but it serves to illustrate
the essential features. The shear is stabilizing, and is most effective in
producing a high y6 when used to produce a pressure gradient in the outer
region In the inner region where dq/dr = 0 the contribution to the
integral in eqn 6.16.2 is zero, and the whole contribution comes from the
outer region, (r/a) > {qo/qa)^^'^, where q = qa{r/a)^. Taking q^ = 1,
eqn 6.16.2 gives
-D-
6.16.3
Equation 6.16.3 for the maximum y6 has the expected s/ql factor but
the radial dependence resulting from optimization has introduced the
further factor {qj — 1). The function y6m/£ is plotted against l/qa in
Fig. 6.16.3 where it is seen that fi^, expressed as a percentage, is quite
well represented by the linear relation
%y6m = 28-

346 6.16 p limit
Fig. 6.16.3 Plotof ^m/e as a function of
qa from eqn 6.16.3 together with straight
line approximation.
or, in terms of operational variables.
%pn, = 5.6-
/inMA
This result is unrealistically optimistic, the current profile is singular and
would be unstable to tearing modes. A more reasonable numerical value
can be obtained by retaining the scaling
%^„ = c— 6.16 4
qa
and calculating the value of c by substituting into eqn 6.16.2 the q{r)
resulting from a parabolic current distribution with ^o = 1' that is
(l-irVa^)
This current distribution is weakly unstable to kink modes but can be
made stable by a small modification. The result is y6 = 0.011s. The
constant c is now determined using the fact that for this case qa — 2
Thus eqn 6.16.4 becomes
%^„ = 15 —
qa
If this result is expressed m terms of the plasma cuirent, using
qa — {B/R){2na'^/fj.oI), the limit becomes
%y6m

6.16 ;S limit
347
Computer calculations by Sykes and by Troyon have shown this result to
have wider applicability and to include elongated and D-shaped plasmas.
The stability limit for a given configuration can be written
where g is often called the Troyon factor. The value of %y6 with g = 2.8
is called the Troyon limit. The quantity
y^N =
I/aB
is called the normalized fi and the stability limit is then expressed as
y^N < g-
Experiments have been found to be limited to a y6 value around that
given by eqn 6.16.5 except when the pressure and q profiles allow entry
into the second region of stability. More generally however the current
profile will not be close to the optimum. The optimization procedure
led to concentration of the current toward the axis. This is the same as
increasing the internal inductance l\. Indeed the pre-optimization formula
6.16.2 can be rearranged to show the ti dependence and in the simplest
approximation this leads to a linear dependence on l\
This result is borne out experimentally and Fig 6.16.4 shows a
comparison of experimental results with the formula
%^ = Al,--,
6.16.6
Fig. 6.16.4 Experimental values of ^
plotted against IJ/aB for discharges m
DIIID (Taylor, T.S et al., Plasma Physics
and Controlled Nuclear Fusion Research
(Proc. 13th Int. Conf. Washington 1990)
Vol. I p. 177 I A E A Vienna A991).)
10
8
(%N
4
2
0
•i3N>4
D 3.6<^<4
o2.5<^<3.5
0''
X °
■ "W^
/ ^6^
'y
/qdqO o
o
°
o
/^(MAm-^r')

When configurations are such that part of their profile lies in the second
stability region the above considerations are not appropriate.
Furthermore, for realistic configurations the stability diagram of Fig. 6.14.1
oversimplifies the situation, there being no exact stability relation s(a).
However, in general terms the first and second stability regions are joined
in the low shear region. This allows access to substantially higher fi
values, and y6 = 12.5% has been achieved in DIIID. The aspect-ratio scaling
of the y6 limit favours low aspect-ratio and a y6 of 40% was obtained in
the START experiment described in Section 1119.
Bibliography
An excellent account of ideal mhd stability is given in the
book Ideal magnetohydrodynamics by Freidberg, J.P Plenum
Press, New York A987). The book MHD instabilities by
Bateman, G MIT Press A978) includes a detailed
discussion of tokamak stability, and this subject is reviewed in the
article Wesson, J.A. Hydromagnetic stability of tokamaks.
Nuclear Fusion 18, 87 A978) A useful set of repnnts is
included in the book by Jeffrey, A. and Tanuiti, T. Mag-
netohydrodynamic stability and thermonuclear containment.
Academic Press, New York A966). A general article on ideal
mhd stability is given in the chapter, Hydromagnetic
stability of a plasma by Kadomtsev, B B in Reviews of plasma
physics (ed Leontovich, M A ) Vol 2 Consultants Bureau,
New York A966) The book Theory of toroidally confined
plasmas by White, R B , Impenal College Press, London
B001) has several chapters devoted to stability.
Mhd stability
In the early work the stability problems were made tractable
by employing the large aspect-ratio expansion. The references
to these contnbutions will be given under the appropnate
headings below. The solution for general geometry became
possible when numencal techniques were introduced in
Sykes, A. and Wesson, J.A. Two-dimensional calculation of
tokamak stability. Nuclear Fusion 14, 645 A974).
Later developments of computational methods are
described in
Grimm, R.C , Greene, J.M., and Johnson, J.L. Computation
of the magnetohydrodynamic spectrum in axisymmet-
nc toroidal confinement systems. Methods of computer
physics Vol. 16 p. 253. Academic Press, New York
A976), and
Gruber, R., Troyon, F, Berger, D, Bernard, L.C., Rous-
set, S., Schreiber, R, Kemer, W, Schneider, W., and
Roberts, K.V Erato stability code Computer Physics
Communications 21, 323 A981).
The codes referred to in the above papers deal with ideal
mhd. An extension to resistive instabilities is descnbed in
Charlton, L A et al. Compressible linear and nonlinear
resistive mhd calculations in toroidal geometry. Journal
of Computational Physics 86, 270 A990)
Energy principle
The original papers are
Bernstein, I B , Frieman, A E , Kruskal, M D , and Kulsrud,
R M An energy principle for hydromagnetic stability
problems Proceedings of the Royal Society A223, 17
A958).
Hain, K, Lust, R, and Schluter, A Zur stabilitat eines
plasmas Zeitschriftfur Naturforschung 12A, 833 A957)
Kink stability
The basic paper for tokamaks is
Shafranov, V.D. Hydromagnetic stability of a current-
carrying pinch in a strong longitudinal magnetic field.
Zhurnal Tekhnicheskoi Fiziki 40, 241 A970) [Soviet
Physics—Technical Physics 15, 175 A970)].
A summary with results for a range of cases is given in
Wesson, J A., Hydromagnetic stability of tokamaks. Nuclear
Fusion 18, 87 A978).
Tearing modes
The fundamental paper on resistive instabilities is
Furth, H.P, Killeen, J., and Rosenbluth, M.N. Finite
resistivity instabilities of a sheet pinch. Physics of Fluids 6,
459A963).
A numerical treatment is given in

Bibliography
Wesson, J.A., Finite resistivity instabilities of a sheet pinch.
Nuclear Fusion 6, 130 A966).
Tearing stability
Methods and results for the tokamak case are given in
Furth, H R, Rutherford, P.H , and Selbeig, H. Teanng mode
in the cylindrical tokamak. Physics of Fluids 16, 1054
A973).
Internal kink
The cylindrical problem is described in
Shafranov, V.D. Hydromagnetic stability of a current caijy-
ing pinch in a strong toroidal field. Zhurnal Tekhnicheskoi
Fiziki 40, 241 A970) [Soviet Physics—Technical Physics
15, 175 A970)].
Rosenbluth, M N., Dagazian, R Y., and Rutherford, RH.
Nonlinear properties of the internal kink
instability in the cylindrical tokamak. Physics of Fluids 16,
1894A973)
The toroidal problem is analysed in
Bussac, M.N , Pellat, R., Edery, D., and Soule, J.L. Internal
kink modes in toroidal plasma with circular cross-section
Physical Review Letters 35, 1638 A975).
Resistive m = 1 modes
These modes are analysed in
Coppi, B , Galvao, R., Pellat, R , Rosenbluth, M , and
Rutherford, P. Resistive internal kink modes Fizika
Plasmy 2, 961 A976) [Soviet Journal of Plasma Physics
2,533A976)].
Reviews of m = I stability are given in
Ara, G etal Magnetic reconnections and m = 1 oscillations
in current carrying plasmas Annals of Physics 112, 443
A978)
and more recently in
Migliuolo, S Theory of ideal and resistive m = 1 modes in
tokamaks Nuclear Fusion 33, 1721 A993)
Localized modes
The onginal paper is
Meicier, C Un cntere necessaire de stabilite hydiomagne-
tique pour un plasma en symetrie de revolution Nuclear
Fusion I, 47 {I960)
and a detailed denvation is given in
Mercier, C and Luc, H The magnetohydrodynamic
approach to the problem of plasma confinement in closed
magnetic configurations EUR 5127e. Commission of the
European Communities, Luxembourg A974)
The cnterion for resistive localized modes was given by
Mikhajlovskij, AB. The stability criteria for the
g-mode in a toroidal plasma Nucleai Fusion 15,
95 A975)
The Suydam criterion is denved in
Suydam, B.R. Stability of a linear pinch. Proceedings
of Second United Nations International Conference
on the Peaceful Uses of Atomic Energy, Geneva
1958, Vol. 31, p. 157. Columbia University Press,
New York A959).
Ballooning modes
The problem of ballooning modes in tokamaks was addressed
in the papers
Todd, A.M.M , Chance, M.S , Greene, J.M., Grimm, R.C.,
Johnson, J.L., and Manickam, J. Stability limitations on
high-beta tokamaks Physical Review Letters 38, 826
A977); and
Coppi, B. Topology of ballooning modes Physical Review
Letters 39,939 A977).
A precise derivation of the ballooning mode cnterion is
given in
Connor, J.W., Hastie, R.J., and Taylor, J.B. Shear,
periodicity and plasma ballooning modes Physical Review Letters
40, 396 A978)
The instability of resistive ballooning modes was
descnbed by
Bateman, G. and Nelson, D B. Resistive-ballooning-mode
equation. Physical Review Letters 41, 1804 A978).
The modification to ballooning mode theory for reduced
shear is discussed in
Hastie, R J and Taylor, J B. Validity of ballooning
representation and mode number dependence of stability. Nuclear
Fusionll, 187A981);
and a numencal analysis of infernal modes is descnbed in
Manickam, J , Pomphrey, N , and Todd, A.M.M. Ideal mhd
stability properties of pressure dnven modes in low shear
tokamaks. Nuclear Fusion n, 1461 A987).
A helpful discussion of ballooning modes is provided in
the book
Freidberg, J P. Ideal magnetohydrodynamics Plenum Press,
New York A987)
Ballooning stability
The large aspect-ratio ballooning mode eqn 6.10 1 was
derived by
Connor, J.W, Hastie, R J , and Taylor, J.B. Shear,
periodicity and plasma ballooning modes Physical Review Letters
40,396A978)
and the curves of Fig 6.10.1 were given by

Bibliography
Lortz, D and Niihrenberg, J. Ballooning stability boundanes
for the large aspect-ratio tokamak. Physics Letters 68A,
49 A978).
The second region of stability is discussed in
Greene, J.M and Chance, M.S The second region of stability
against ballooning modes. Nuclear Fusion 21, 453 A981).
Axisymmetric modes
A simple model is described in
Laval, G., Pellat, R., and Soule, J.L. Hydromagnetic stability
of a current-carrying pinch with noncircular cross-section.
Physics of Fluids 17, 835 A974).
The subject is reviewed in
Wesson, J.A Hydromagnetic stability of tokamaks. Nuclear
Fusion 18, 87 A978)
and calculations for a practical case are given in
Perrone, M R. and Wesson, J A. Stability of axisymmetnc
modes in JET. Nuclear Fusion 21, 871 A981)
i3-limit
Ideal mhd /J limits are best determined using two-
dimensional computer codes together with the ballooning
mode cnterion. This was first earned out in
Bernard, L.C., Dobrott, D, Helton, F.J., and Moore, R.W
Stabilization of ideal mhd modes. Nuclear Fusion 20,
1199A980).
and an analysis of these results indicating the /J-limit scaling
was carried out by Wesson, J.A. and presented in
Stnnger, T.E Mhd problems relevant to JET. Computer
Physics Communications 24, 337 A981).
The substantiation of the /J-lirmt scaling is based on detailed
calculations given in the papers
Troyon, E, Gruber, R, Sauremann, H., Semenzato, S ,
and Succi, S. Mhd limits to plasma confinement. Plasma
physics and controlled fusion 26 A A) 209 A984) (Proc.
Uth European Physical Society Conference, Aachen,
1983); and
Sykes, A., Turner, M.E, and Patel, S. Beta limits in tokamaks
due to high-n ballooning modes Proc. 11th European
Conference on Controlled Fusion and Plasma Physics II,
363 (Aachen 1983).
An analytic explanation of the /J limit was given by
Wesson, J.A, and Sykes, A. Tokamak beta limit. Nuclear
Fusion 25, 85 A985).
A discussion of the expenmental evidence and its relation to
theory is presented in the paper
Strait, E.J. Stability of high beta tokamak plasmas. Physics
of Plasmas 1, 1415 A994).
Experimental results on the fi limit are described in
Troyon, E and Gruber, R A semi-empirical scaling law for
the p limit in tokamaks Physics Letters llOA, 29 A985),
and
McGuire, K.M. Observations offinite-p mhd in tokamaks.
Report PPPL-2134, Plasma Physics Laboratory,
Pnnceton, NJ. A984).
The use of bean shaping to achieve higher /J is described in
Miller, R.L. and Moore, R.W. Shape optimization of
tokamak plasmas to localized magnetohydrodynamic modes.
Physical Review Letters 43, 765 A979).

Instabilities

7.1 Instabilities
instabilities
From the earliest experiments it was clear that tokamaks are subject to a
variety of macroscopic instabilities. Although these instabilities are not
fully understood they can mainly be attributed to identifiable mhd modes.
During the current rise it is often found that bursts of magnetic
oscillation occur. Following the discovery of this activity using magnetic coils
around the plasma surface, the oscillations are called Mimov
oscillations. The azimuthal variation of the magnetic fluctuations allowed them
to be identified with a decreasing sequence of m numbers. It seems likely
that these modes are tearing modes, having resonant surfaces q = m
close to the surface of the plasma. The magnetic oscillations also occur
throughout the pulse and an example is shown in Fig. 7.1.1.
The plasma emits soft X-rays with an intensity dependent on the
electron temperature and density. It is usually found that, at sufficiently lai-ge
currents, this emission undergoes oscillations having a sawtooth time
dependence as shown in Fig. 7.1.2. The cause of these oscillations is an
m = 1 instability occurring in the central region of plasma. The sawtooth
form of the observed X-ray emission is attributed to repeated relaxation
to a stable state, the relaxation being brought about by the instability.
The two instabilities described above do not prevent satisfactory
operation of the tokamak. Disruptions, however, can involve a sudden loss
Fig. 7.1.1 Oscillations of the poloidal
magnetic field measured outside the
plasma (JET)
Fig. 7.1.2 Sawtooth oscillations of the
soft X-ray emission (JET)
Soft X-ray
emission

7.1 Instabilities
Fig. 7.1.3 Early experimental
observation of current collapse brought
about by a plasma disruption (Gorbunov,
E P. and Razumova, K A Plasma Physics
6, 515 A964) from Atomitaya Energiya 15,
363A963))
of confinement and a rapid decay of the whole current, leading to an
end of the discharge. An example of the current collapse is shown in
Fig. 7.1.3. Disruptions occur over a range of conditions and are a complex
phenomenon involving a sequence of only partially understood events.
The instability usually involves the growth of an m = 2 mode to a large
amplitude.
The interaction of magnetic perturbations with the vacuum vessel
reduces the rotation frequency of tearing modes and often leads to a
locking to magnetic error fields. These error fields can then be the seed
for the growth of an instability which leads to a full disruption.
It is seen that tearing modes play an important part in^the observed
instabilities. They appear in their nonlinear form in whicfi the magnetic
topology within the plasma is substantially changed. The simple nesting
of the axisymmetnc toroidal surfaces is broken and so-called magnetic
islands appear in the plasma.
When islands of different modes interact, magnetic surfaces are
destroyed. The magnetic field lines no longer map out a surface but instead
follow a space filling trajectory. Under such conditions the field is said to
be ergodic. Ergodicity clearly changes the confinement properties of the
magnetic field and may lead to enhanced transport.
The axisymmetric instabihty described in Section 6.15 is stabiHzed by
feedback control, but the loss of control can lead to a vertical instability
followed by a disruption.
Other instabiHties are driven by the presence of fast ions. The fishbone
instability is caused by the fast ions resulting from neutral beam injection,
and a potential instability for a reactor plasma is the toroidal Alfven mode
driven unstable by a-particles.
The edge localized mode, or ELM, is a transient instability which can
lead to a repetitive loss of energy from the plasma edge It appears in
various forms, the cause of which is not clear. Another instability which
appears at the edge of the plasma is the so-called MARFE. This is not
an mhd instability, its mechanism being the unstable energy loss arising
from the increase of impurity radiation with reduced temperature at low
temperatures.

7.2 Magnetic islands
Magnetic islands
When mhd instabilities occur in a plasma they usually bring about a
change in the magnetic topology. This occurs at surfaces with rational
values of ^. At these surfaces the magnetic field lines break and reconnect
to form magnetic islands as illustrated in Fig. 7.2.1. The formation of
magnetic islands is generally associated with resistive instabilities and
particularly tearing modes. However, since the plasma is not perfectly
conducting, island formation will occur to some extent in the nonlinear
development of all mhd instabilities with a resonant surface in the plasma
Consider the equilibrium configuration around a resonant surface, s,
having q = q^ = m/n The magnetic field lines on this surface define
a helix A perturbation resonant with this surface has the form expim/
where
x = e--(P
m
is an angular coordinate orthogonal to the helix The equilibrium field ii
this orthogonal direction is
B* = Bg(l- -q(r))
and close to the magnetic surface this may be written
Fig. 7.2.1 Reconnection of magnetic
field producing magnetic islands

Fig. 7.2.2 Geometry of magnetic field
hnes of a magnetic island m the (z, x)
X-point
7.2 Magnetic islands
X=Xq mX=n
0-point ^Separatrix
The geometry of the change in the magnetic topology arising from the
resonant perturbation is illustrated in Fig. 7.2.2. It can be calculated by
determining the trajectory of a magnetic field line from the equation
7.2.2
Ar _ B^
The radial field perturbation may be taken to have the form
Br = fir(r)sinm/
so that, substituting eqns 7.2.1 and 7.2.3 into eqn 7.2.2, the differential
equation for the field line is
IrSinm/ d/.
Taking Br to be essentially constant over the radial extent of the island,
integration of eqn 7.2.4 gives the equation of the field fine
: —(cosm/ — cosm/o)
is the width of the magnetic island and xo is the value of / for which the
field fine under consideration has z = 0.
The magnetic field lines within the magnetic island lie on a set of
helical magnetic surfaces with their own magnetic axis. This is labelled
the 0-point in Fig. 7.2.2. The island is bounded by the separatrix, the two
parts of which meet at the X-points. The distance between the X-points
is one full wavelength.
For Bg = ^T and rq'/q = 1 an m = 2 mode would have an island
size w/r — 46r , so that a field perturbation B^ = 10 gauss would give

7.3 Tearing modes
an island width ~10% of the radius. The magnetic island can also be
described in terms of the helical flux, defined by
r dx dr
The flux function is
ij/ = ij/Q{r) + -ij/cosmx 7.2.6
where
and
From eqns 7.2.6 and 7.2.7 the equation of a flux surface is
z\i^) = ^,(fcosmx-f)
Beq'
and, since the separatrix has ^^ = — ^, the full island width at x = 0 is
•m:
7.2.8
Tearing modes
In tokamak plasmas tearing modes take the form of magnetic islands. The
growth of these islands is usually driven by the same destabilizing effect
as linear tearing modes, that is current gradients in the plasma. However,
the growth is limited by resistive diffusion, inertia generally playing a
negligible role.
It is seen from eqn 7.2.5 that the island width is proportional to B/ ,
so that growth of the island implies growth of perturbed radial magnetic
field. The island growth is limited by the diffusion of this field and a
simple description of the growth can be obtained from the resistive
diffusion equation for Br- From Maxwell's equations 2.20.5 and 2.20.6 and

7.3 Tearing modes 357
Ohm's law, E = nj,
dB n ,
= -^V^B. 7.3.1
Ot fJ-O
In the region of the magnetic island the radial derivatives are dominant
and the r component of eqn 7.3.1 becomes
9fir V 9^-Br ^_
Integrating eqn 7.3.2 over the island width, w, and taking Br to be
approximately constant across the island, gives
ri 3Br|'
w/2
^ . 7.3.3
dt jiQ dr \,^_^f2
Now from eqn 7.2.5, Br a w^, and eqn 7.3.3 can therefore be written
dw V 1 SBrl'
w/2
- I . 7.3.4
dt IflQ Br dr |r^_i„/2
Since Br is related to the helical flux function ij/ by the relation
Br = —hn-^r/r, eqn 7.3.4 can be written
dt ~ 2/20 f \,,-w/2
Introducmg a generalization of the quantity A' defined in the linear theory
of Section 6.8, A'(u;) is defined by
A'(u;) being determined from the outer solutions. Equation 7.3.5 now
gives the equation describing the growth of the island:
^:.-^A». 7.3.6
dt 2/20
Equation 7.3.6 is only an approximation. A more precise calculation has
given
^ = 1.66^(A»-au;) 7.3.7
dt fj-o
where the changed numerical factor results from the inclusion of the
plasma flow and the term aw comes from a more detailed treatment of
the magnetic island region, a being related to the local plasma properties.
It is seen that the saturated island size Ws is given by
A'{Ws) = awg.
A typical plot of A'(u;) and aw is shown in Fig. 7.3.1. The simple relation
A'(Ws) = 0 is often used to obtain an approximate value of Ws.

7.3 Tearing modes
Fig. 7.3.1 Plots of A'(u)) and ai
which determine the growth and
of teanng mode magnetic islands
The strongest instability usually occurs for the m = 2 mode. This
typically has a value of rsA'(O) ~ 10. Thus, from eqn 7.3.7, the
characteristic growth time may be taken as Tg ~ 0.1(u;/a)TR where tr is
the resistive diffusion time {ixo/r])a^,a, being the plasma radius. Using
Spitzer resistivity, given by eqn 2.16.2, this becomes
^4.5
O''^'
,27,3/2 ^
Te in keV.
7.3.8
In a small plasma with a = 0.25 m and T^ = 500 eV, an m = 2 island
covering 10% of the radius would have a typical growth time ~10ms.
This is much shorter than the typical duration of the discharge and it is
likely that the actual size of an island will be close to its saturation value.
In a larger plasma at a higher temperature it is likely that the resistivity
will be neoclassical and taking a neoclassical enhancement factor of 3,
eqn 7.3.8 becomes
' 1.5
O"
2rV^,
[ikeV.
For w/a = 0.1, a plasma with a radius of 1 m would have a growth
time of ~ 1 s at 3 keV and 5 s at 10 keV. It is again likely that the islands
will grow to their saturation size. However, at the time of disruption,
conditions are dramatically different as described in Section 7.7.
Internally driven tearing
In the analysis given above the tearing is driven by forces external to the
island, and the drive is represented by the value of A' as calculated from
the tearing mode equation 6.8.7. It is also possible for a drive to arise
within the island as a result of mechanisms which modify the current
distribution.

7.3 Tearing modes 359
The simplest case results from a modification of the resistivity within
the island. This could for example arise from enhanced impurity radiation
or the effect of an injected pellet. The behaviour is most clearly seen in
terms of the helical flux, introduced in Section 7.2, and the associated
helical current density jh. Faraday's law gives the electric field £}, arising
from the helical perturbation
dt
Thus using Ohm's law, E = ijj,
-J- = irij\ 7.3.9
The simple tearing mode analysis, taking rj constant, uses the term ryjh
but if there is a helical perturbation, rj^, to the resistivity there is a fiirther
contribution. For small perturbations eqn 7.3.9 can then be written.
The new term is destabilizing when the resistivity in the island is
increased. In the steady state dir/dt = 0 and the helical current is given by
and the associated flux perturbation which defines the resulting magnetic
island is given by Amperes law
vV = MJh.
Neoclassical tearing modes
Another form of tearing mode arises from the modification of the
bootstrap current as a result of the reduction in the temperature and density
gradients which drive this current. Thus, when these gradients are reduced
within the magnetic island by transport parallel to the field lines, the
resulting reduction of the bootstrap current leads to a helical current Ejb.
The electric field perturbation is given by
£h = '?(jh-<5jb), 7.3.12
and the behaviour can be illustrated by considering the case of strong
particle trapping. The bootstrap current is then proportional to the pressure

7.3 Tearing modes
gradient, being given by
£'/2 ,
dp\
dr /
If the pressure gradient were completely removed in the magnetic
island the perturbed current would be Ejb = —jb and eqn 7.3.12 becomes
-t)y
where eqn 7.3.11 has been used to give jh.
Faraday's eqn 7.3.9 now becomes
Uo 9r2 "
))■
Integrating eqn 7.3.14 across the island and using the same procedure as
that following eqn 7.3.2 leads to the equation for island growth
df
- JL
2/20
(^' + ^)
where y6p = B|/2/U,o, and a = (—Sp'q/pq') and is usually positive.
Figure 7.3.2 gives results of an experiment showing the growth in island
width of a neoclassical tearing mode, followed by a decay as y6p falls.
The bootstrap term in eqn 7.3.15 approaches infinity as w approaches
zero and for positive a would always predict instability. The instability
Fig. 7.3.2 Evolution of a neoclassical
teanng mode m JET The mode is triggered
by a sawtooth collapse and evolves in
response to the changing Pp
(cm)

7.3 Tearing modes
would grow until the right hand side of eqn 7.3.15 is zero, giving the
equation for the saturated island width
Fig. 7.3.3 Schematic drawing showing
how the magnetic island short-circuits the
heat flow for a larger island (a) flattening
the temperature, whereas the heat flow for
a narrower island (b) is essentially
unaffected
Equation 7.3.15 predicts tiiat every resonant surface would be
unstable. However, the connection length along tiie magnetic field within the
island increases with decreased island width and for sufficiently small
islands the connection length is too long for effective short-circuiting
of the heat and particle fluxes, as illustrated in Fig. 7.3.3. This means
that for small islands the destabilizing effect is essentially removed and
that consequently there will be a critical 'seed' island size required for
neoclassical tearing modes to grow.
The parallel thermal conduction will be effective in removing the radial
temperature gradient when the radial heat flow parallel to the field is larger
than the normal heat flow —/c^dT/dr ~ k±AT/w where AT is the
temperature difference across the island. The radial heat flow from
parallel conduction is ~ —k\i (AT/Ax)Br/B, where the parallel connection
length Ax ~ AR/ns{w/r) with s = rq'/q,n is the toroidal mode
number and from eqn 7.2.5. Br/B ~ nsw^/\6rR. Combining these results,
the condition for temperature flattening is
\l/4 ,
8ri?\
With anomalous perpendicular transport the threshold island width for ion
temperature flattening to occur is typically of the order of a millimetre.
However, at typical tokamak temperatures collisions are ineffective in
restricting the heat flow parallel to the magnetic field and the appropriate
radial heat flux is n^vjATBr/B where iij is the particle density and vj
the thermal velocity. Under these conditions the critical island size for
temperature flattening is
n6x±rR~
V "T ns ^
1/3
where the thermal diffusivity xx = atx/^j. The resulting critical island
size for ion temperature flattening is typically of the order of a centimetre.
Another mechanism which could provide a critical island size for
growth comes from the additional currents which flow due to ion
polarization. These arise from the different E x B flows of the ions and electrons
because of the difference in the size of their banana orbits.
The neoclassical drive for the tearing of small islands is further reduced
if the island width is less than the width of the ion banana orbit. This
typically occurs for island widths less than 1-3 cms. The drive from electrons,
with their much smaller banana orbit, is basically unaffected.

7.4 Mirnov instabilities
7.4 Mirnov instabilities
Magnetic fluctuations found to occur during the current rise are shown in
Fig. 7.4.1 together with their observed spatial structure. The decreasing
values of the mode number, m, are associated with the decreasing value
of q at the surface of the plasma. This decrease follows from the
definition qa = B^a/BgaR which together with the relation jiqI = InaBga
gives
f^oRI
As the current is increased there will be a negative current gradient at
the plasma surface. During this time the integral q surfaces move outward
toward the plasma edge, and tearing mode instabilities with m ~ ^^ are
then expected to occur as the resonant surfaces meet the destabilizing
current gradient.
Fig. 7.4.1 Development of magnetic
fluctuations dunng the current nse,
together with their spatial dependence
indicating, successively, modes m = 6, 5,
and 4 (Mimov, S V and Semenov, IB.,
Soviet Atomic Energy 30, 22 A971), from
Atomnaya Energiya 30, 20 A971))
f(ms)

7.4 Mirnov instabilities
Minor
cross-section
Eii
4 6A5)
5.0A4)
Fig. 7.4.2 Cme photographs of
instability observed during the current nse
m the DITE tokamak The time from the
start of the pulse is given together with the
poloidal mode number, m (Goodall,
D J H and Wesson, J A Plasma Physics
26,789A984))
Further evidence of such instabilities has also been obtained by cine
photography of the plasma during the current nse. The sequence of frames
in Fig. 7.4.2 shows the deformation of the plasma surface. The associated
mode numbers are found to satisfy m ~ ^^
If the current rise is sufficiently fast, a sidn current is produced This
gives nse to a ^ profile having a minimum. Such a profile allows two
resonances for the same values of m and n, and this configuration leads to
the possibility of a double tearing mode. The region between the resonant
surfaces has only a small shear and if the surfaces are sufficiently close
instability occurs. It is possible that this explains the observation that the
skin current can penetrate faster than simple resistive diffusion would
allow. This is described in Section 7.5
Mirnov oscillations of the magnetic field can persist beyond the
current rise and are tiien observed as continuous oscillations as illustrated
in Fig 7.1.1. They occur most strongly at low m, particularly m — 2.
The magnetic fluctuations are measured on pick-up coils outside the
plasma but they imply magnetic perturbations inside the plasma and these
in turn imply the existence of magnetic islands on the surfaces having
q = m/n.
The frequency of the oscillations is typically 1-10 kHz and the
propagation velocity normally has the sign of the electron drift velocity. An
extended theory of tearing modes including finite Larmor radius effects
predicts a mode frequency of the order of the electron drift frequency
co^e — (mTe/eBine)dne/dr, where m is the mode number. This is in
rough agreement with the observations.

7.5 Current penetration
Current penetration
The instabilities which occur during the current rise are believed to
be driven by the destabilizing current gradient. If the current rise is
sufficiently rapid it is expected that these instabilities will cause
anomalous penetration of the current. There is experimental evidence that such
current penetration can occur.
In the absence of instability the normal current penetration time is of
order ixoo^/r]. If the current rise is sufficiently slow compared to this
time the current profile is peaked around the plasma axis. If however the
current rise is faster, a sicin current is formed as shown in Fig. 7.5.1. The
corresponding q profile has a minimum. This allows two resonances close
to the minimum having the same value of m/n, and the configuration is
unstable if the two resonances are sufficiently close. The reason for this
is easily seen from the tearing mode equation
Fig. 7.5.1 Skincu
associated (^-profile
Fig. 7.5.2 (a) A minimum m q allows
two resonant surfaces with the same values
of m and n f* is the corresponding helical
flux (b) The two resonant surfaces lead to
two sets of magnetic islands
v^
dj/dr
0-S
/^o
The term on the right represents the effect of the current gradient and is
destabilizing when the coefficient of ^j/ is negative. The region between
the resonances combines a destabilizing current gradient and a small value
of 1 - {nq/m).
It seems likely that this instability would accelerate current penetration.
A simple model of the process is obtained by considering the helical flux
of the equilibrium configuration associated with the resonant surfaces
under consideration. This flux is that of the helical field B* defined in
Section 7.2,
Resonant
surfaces

7.6 Sawtooth oscillations
Fig. 7.5.3 Graphsof?(r), i/r*(r), and
j(r) before the instability (dashed lines)
and after the instability (full lines). The
instability flattens q and enhances the
current penetration.
The flux function, ij/*, associated with this field is defined by
-^ = B*. 7.5.1
dr
It is seen that at resonant surfaces ij/* has a maximum or a minimum. An
example is given in Fig. 7.5.2(a). The resulting instabihty will initially
produce islands on both of the resonant surfaces as shown in Fig. 7.5.2(b).
The instability ultimately leads to the resistive reconnection of parts of
the flux, reducing the current gradient in the unstable region and flattening
the q profile as illustrated in Fig. 7.5.3. It is seen that this produces an
enhanced penetration of the current.
Sawtooth oscillations
Under a wide range of operating conditions tokamaks are subject to a
relaxation oscillation in the centre of the plasma. This appears as a
sawtooth oscillation of the temperature and density and is also observed on
other diagnostics. Figure 7.6.1 shows the sawtooth temperature variation
in the centre of the plasma together with the inverted behaviour which
occurs in the outer region. It is clear that during the stable ramp phase
heating raises the temperature and that at the collapse the associated
thermal energy is released to the outer part of the plasma in the form of a heat
pulse.
The collapse is due to an instability which has an m = 1, n = 1 structure
and is associated with the existence of a ^ = 1 surface in the plasma. The
sawtooth oscillations usually start when aq = 1 surface first appears. The
q profile also oscillates with a sawtooth-like behaviour. During the ramp

Sawtooth oscillations
Fig. 7.6.1 X-ray emission from (a) the
central region of the plasma and (b) the
outer region. (TFR)
phase the current density around the axis increases and at the c
is reduced. Correspondingly the central value of q falls during the ramp
and rises at the collapse. The change is typically a few per cent.
When the instability was first observed it was realized that the collapse
phase was much shorter than the characteristic resistive time tr = fJ-or-^/v
where ry is the radius of the q — 1 surface. Whereas tr was typically 10 ms
the collapse times could be ~100 /xs. Thus if the collapse is associated
with a magnetic rearrangement an explanation of its rapidity was required.
A model which included a fast magnetic reconnection was proposed by
Kadomtsev. Initially this model was thought to provide a complete
explanation of the process but subsequent analysis has given rise to some
difficulties. These will be examined later. First it is necessary to describe
Kadomtsev's model.
Kadomtsev's model
The magnetic field lines on the ^ = 1 surface define a helix and the
reconnection process is concerned with the flux perpendicular to this helix.
These magnetic field lines wind around the torus with 6.9/d(p = 1. A
helical sheet which has dO/dcp = 1 can be defined and this is shown in
Fig. 7 6.2. The magnetic field lines at the ^ = 1 surface lie in this sheet.
For ^ 7^ 1 the field lines intersect the sheet, giving rise to a helical flux.
Since the unit normal to the sheet has components
1 . r/R
the leading order expression for the helical magnetic field, B*
i<pB^, is
B* = Be- {r/R)B^
= Be{l-q),

7.6 Sawtooth oscillations
Fig. 7.6.2 Schematic diagram of the
geometry of the hehcal sheet which
contains the magnetic axis and the <? = 1
field line.
Fig. 7.6.3 The flux surfaces indicated by
the full lines approach the X-pomt where
they break and join to form a reconnected
flux surface
Magi
axis
q=]
\v'/
rii
// \v
[ surface
/ \ \ \ III
' \ \ \ / / /
\\ / /
\ III \\\
\\V/7
W //
/ / \ V
the corresponding helical flux being given by dV^*/dr = B*. The helical
field changes sign at the ^ = 1 surface and in Kadomtsev's model the
helical flux between the axis and the ^ = 1 surface reconnects with an equal
and opposite flux outside the ^ = 1 surface. The process of reconnection
is illustrated schematically in Fig. 7.6.3. The flux is progressively
reconnected, the structure passing through the states illustrated by the sequence
shown in Fig. 7.6.4. The reconnected flux forms an island which grows
and ultimately takes the place of the original nested flux surfaces. The
reconnection actually takes place in a narrow layer of thickness h as
illustrated in Fig. 7.6.5 There is a current sheet in this layer driven by the
electric field v\B* where v\ is the velocity of the incoming plasma, thus
J-wifi*/'?
From Ampere's law
J ~ B*liiQh
and so, combining expressions 7.6.1 and 7.6.2
u = -^
7.6.1

7.6 Sawtooth oscillations
Fig. 7.6.4 Development of the magnetic
field structure dunng the sawtooth
instability according to Kadontsev's model
(foUowmg Sykes, A and Wesson, J A ,
Physical Review Letters 37, 140 A976))
The in = 1 instability displaces the <? < 1
region (shown shaded) and restores qo to a
Fig. 7.6.5 Reconnection takes place m
narrow layer of thickness S, the central
-ire moves into the layer with velocity i;
d the plasma leaves the layer with
velocity V2
The displaced core transmits a pressure ~B*^/2/2o which causes a
flow along and out of the layer with a velocity, V2, given by
pvj ~B*V2/xo. 7.6.4
Taking the flow into the layer to take place over a length ~ ry, continuity
requires
and using relations 7.6.3 and 7.6.4 to eliminate v\ and U2 in 7.6.5 gives
an expression for 5
or, writing
tr = —r{ and ta =
B*/^/tIoP
The characteristic time of the collapse is given by the time for the core
to move across the radius ry,
The velocity v\ is obtained using relations 7 6.3 and 7.6.6 to give
tk~(trTa)'/2, 7 6.8
that IS, the collapse time is the geometric mean of the resistive diffusion
time and the Alfvenic time Since ta <?C tr this model was able to bring the

(a) Initial state
V^l d
Sawtooth oscillations
(b) Final state
model of the sawtooth collapse
predicted collapse time close to the experimental values Typical values
were tr ~ 10 ms, ta ~ 1 /xs and tk ~ 100 fj.s.
The reconnection of the flux can be calculated from the flux diagram
for tp-ir) shown in Fig 7.6.6. The flux element d^^ covers region dr_ at
r = r_ on the inner side of the <? = 1 surface and is equal to the flux
covering dr_|_ at r = r_|_ on the outer side. These two fluxes will connect
and will finally cover a region of dr at a radius r, both to be calculated.
The reconnection starts at ri where ij/ = V^max, and this first reconnected
flux will form the new centre of the plasma. Thus V^@) in the final state
is equal to V^^ax m the initial state.
The incompressibility of the toroidal magnetic field means that the
sum of the poloidal areas covered by the initial fluxes must equal the area
covered by the final flux, tiiat is
_ dr_ + r+ dr+
7.6.9
From Fig. 7.6.6 it is seen that the initial radial dependence of the flux
V^(r) gives the inverse relations r_(^) and r+(V^) and hence r^(V^) and
r\{ir) The final flux distribution, V^f, can therefore be calculated from
r^iip-f) after integrating eqn 7 6.9 to obtain
rHff) = j^drl(ir) + j' drl(f).
This solution holds out to the radius at which the initial and final values
of if/ are equal. Beyond this radius if/ is unchanged.
Figure 7.6.7 summarizes the changes in the magnetic field from the
initial to the final state. It is seen that there are discontinuities at a radius
somewhat larger than rj and in particular that there is a discontinuity in
Bgf, which implies a current sheet in the reconnected state.
Numerical simulations essentially verify Kadomtsev's model as a
solution of the resistive mhd equations However experimental results have
ansen which seem to be in conflict with various aspects of the resistive
mhd model and these will be described in turn.

370 7.6 Sawtooth oscillations
Fig. 7.6.7 Changes of the magnetic
fields and the helical flux in Kadomtsev's
model of the sawtooth collapse, the
subscnpt f refemng to the final state
(b) Final
?
"p^/
^M^'
~^^f*
=' \'
i) The collapse time
From relation 7.6.8 it is seen that the Kadomtsev collapse time is
proportional to Tj Thus for larger tokamaks such as JET there should be a
large increase in the collapse time as compared with the smaller devices
in which sawtooth oscillations were first observed. However, the collapse
times are comparable For JET the predicted collapse times are typically
~10ms whereas the observed times are ~100/U,s A re-examination of
the theory led to the realization that in high temperature plasmas the
electrical impedance of the reconnection layer is not resistive and that
the reconnection is collisionless, the rate being determined by electron
inertia
Using relations 7 6 4 and 7 6.5
v\ 7.6 10
TA
and substitution into the relation x = r\lv\ gives the reconnection time
r~^. 7 6.11
The physics of the reconnection now enters through the calculation of the
layer thickness h
When electron inertia is dominant there are two possible cases
depending on the factor determining the duration of the electron's
acceleration In the simplest case the time is just the residence time as the
plasma passes through the layer In the other case the time is determined
by 'collisionless viscosity' The electrons travel along the magnetic field
with their thermal velocity, and the shear in the magnetic field causes
them to move out of phase with the accelerating electnc field.

7.6 Sawtooth oscillations 371
In the layer, Ohm's law can be written
„,r = ,i + 4(^ + i2iA 7.612
where I is the length available for acceleration, which is ~ {B/B*)ry ~
^/(l — ^o)- The dominant term in dj'/df is v V j where d ■ V is
approximately the residence time v\/&. Since r] = l/sQOi^x^ where Tg is the
electron colhsion time, eqn 7.6.12 becomes
1 / 1  WTe\
7 6.13
Using eqn 7 6.2 for j and eqn 7 6 10 for v\, eqn 7 6 13 gives the layer
thickness 5
The relation 7 6 14 shows clearly the regimes in which the different
impedances dominate. For electron inertia to be more important than
resistivity requires ta < Tg and typically this requires T (keV) > (n/10^°)
The condition for electron viscosity to dominate electron inertia is
A — ^o)i'Te/^ > 1/tA, and this can be written approximately
^g>^ 7615
where fi^ = nTe/{Bl/2fj.Q). The inequality 7.6.15 is easily satisfied and
electron viscosity provides the dominant mechanism in high temperature
tokamaks.
Substitution of 7 6.14 into 7.6 10 gives a general formula for the
collapse time and shows the relationship of the three regimes.
tA
(ta/Tr + {c/nCOpf A + (;6e/(/WeM,))'/'))
ii) Quasi-interchange
Because of the high electrical conductivity of the plasma the slow
redistribution of current during the ramp phase would only lead to a small
change in q in the central region, typically 0.02-0 05. If q were
approximately equal to one following the collapse, as predicted by Kadomtsev's
model, It would still be quite close to one at the end of the ramp phase when
the instability occurred, giving a rather flat ^-profile A configuration with
a sufficiently flat q -profile would be unstable to an ideal quasi-interchange
instability with a fast growth rate. This argument is modified somewhat
by the effect of neoclassical resistivity, which if it is operative, leads to a
further localized reduction of q around the magnetic axis.

Sawtooth oscillations
(a) quasi-interchange
?ig. 7.6.8 Showing the contrasting
£ion-hnear development for (a) the
quasi-interchange and (b) the reconnecting
teanng mode
Figure 7.6.8 illustrates the difference between the form of a quasi-
interchange instability and that of a reconnection. An identifying feature
of the quasi-interchange is the formation of a cold bubble. When the JET
soft X-ray images of the plasma during the collapse were examined they
were found to agree with the quasi-interchange model. The comparison
of a non-linear simulation of the quasi-interchange instability with the
soft X-ray images in Fig. 7.6.9 makes the similarity clear. The initial
JET soft X-ray diagnostic gave rather poor resolution but a subsequent
high resolution system confirmed the earlier result. However, there is
a problem with this interpretation of the collapse. This arises from the
measurement of the ^-profile, which will now be examined.
iii) Measurement of qo
When accurate measurements of ^ became possible they led to a number
of difficulties. The first definitive measurement, using polarimetry, gave
values of qo well below one, typically between 0.7 and 0.8. This is in
conflict with the calculation predicting only a small change from ^o ~ 1
during the ramp phase. Even more problematical, the value of ^o remains
well below one during the whole sawtooth period as shown in Fig. 7.6.10.
The difficulty is that, although the small change in q observed during the
ramp phase is consistent with that calculated from resistive diffusion of
the equilibrium, qo remaining below one implies that full reconnection
does not occur. It should be noted, however, that in some experiments
measurements do give qo close to one.
qo was measured in JET using both polarimetry and the motional
Stark effect. Under conditions where the observed instability had the
appearance of quasi-interchange the value of qo was typically around
0.7, completely inconsistent with the requirement, qo — 1, for a quasi-
interchange instability.
Fig. 7.6.9 Compan
quasi-interchange simulation (P Kirby)
with the deformation a
the soft X-ray e
(R Granetz)
reconstructed from

7.6 Sawtooth oscillations
Fig. 7.6.10 Time dependence of qo
during sawtooth oscillations on TEXTOR
as measured by Faraday rotation The
noise level has been reduced by overlaying
many sawteeth to give the averaged
behaviour during the sawtooth period, r^,
shown in the figure (Soltwisch, H. and
Stodiek, W presented at 29th Annual
Meeting ofA.PS. Division of Plasma
PV'«. San Diego A987))
iv) The spontaneous onset
The sawtooth collapse is often preceded by growing oscillations. These
oscillations arise from the finite frequency of the mode, and their presence
indicates that the growth time is longer than the period. However, in other
cases the instability appears without such precursors implying a sudden
onset of the growth.
Whatever the cause of the instability, it would be expected that it
would arise through a change in the equilibrium during the^^amp phase.
Instability would first arise at marginal stability and hence zero growth
rate. The growth rate would then increase as the underlying equilibrium
developed. However, the time for an equilibrium change to produce a
configuration having a growth rate equal to that observed is very much
longer than the sawtooth collapse time. In JET the discrepancy in these
times is typically two orders of magnitude. This spontaneous onset of the
instability is not understood.
v) Stability during the ramp phase
There is a difficulty in understanding the stability of the m = 1 mode
during the ramp phase iiq^ is substantially below one. Such a configuration
is expected to be unstable to the resistive kink mode which has a growth
rate proportional to the two-thirds power of ^' at the ^ = 1 surface. A
simple q profile gives a growth time of typically less than a millisecond
while the ramp phase can be hundreds of milliseconds.
A possible explanation is that the.? profile is flattened around the.? = 1
surface, and there is some experimental evidence for this. This flattening
could be the result of the previous collapse phase. However no consistent
model of this behaviour has been found.

vi) The thermal collapse
If the magnetic reconnection process is not completed, as implied by qo
remaining well below one, it would be expected that the unreconnected
core would remain confined. However, the flattening of the temperature
across the whole of the q < I region is in conflict with this conclusion. A
possible explanation seemed to be that, although the simple model
predicts that the magnetic surfaces in the remnant core would remain nested,
the magnetic surfaces become broken and the resulting ergodization could
then allow the plasma energy to escape along the magnetic field lines.
However, a well-known phenomenon is the rapid inward movement of
impurities into the core at the time of a sawtooth collapse. The timescale
for this redistribution can be as short as the flattening of the temperature
profile. If ergodization of the magnetic field were the explanation of
the electron temperature collapse in the collapse time Tc, the electrons
would travel a distance ~UTetc along the magnetic field lines during the
collapse. For a 100/as collapse at a temperature of lOkeV the electrons
would travel 4 km. Taking nickel impurity as an example, nickel atoms
would have a thermal velocity 330 times smaller than that of the electrons.
During the collapse they would therefore travel only 12 m along the field.
Clearly they cannot reach the centre of the plasma on this timescale by
motion along the ergodic field.
This result implies that the impurity inflow must be due to motion
which is essentially in the poloidal plane and if the impurities move in this
way it seems likely that the plasma electrons and ions do also. While there
is no explanation of this behaviour it should be noted that such poloidal
motion is precisely that observed in the soft X-ray, quasi-interchange like,
images of the sawtooth collapse in JET.
It is seen from the above enumeration of the difficulties in explaining
sawtooth behaviour that there is uncertainty about the q profile, both as
to its central value and its shape. This directly leads to uncertainty as to
the nature of the m = 1 instability involved. From Sections 6.10 and 6.11
it is seen that the stability of the internal kink depends critically on the
level of shear and therefore qo, and that the resistive kink depends on the
value of ^' at the ^ = 1 surface and therefore on the shape of the q profile
around this surface.
It is remarkable that a phenomenon which initially appeared to have
a simple and elegant explanation should give rise to such difficulties of
understanding.
Disruptions
The tokamak disruption is a dramatic event in which the plasma
confinement is suddenly destroyed. In a major disruption this is followed by a

7.7 Disruptions
Fig. 7.7.1 Current traces showing
disruptions on the current nse, flat-top and
current fall (JET)
Fig. 7.7.2 Showing typical time
dependence of the m = 2 magnetic
fluctuations, central temperature, and
plasma current during the period of a
disruption. In this example the disruption
IS precipitated by a density increase as
shown.
Pre-precursor
phase
1 \
1
Li A A ^^
'Precursor!
^ phase ]*
1) -V
Fast —-i )-—
phase 1
'\i
Quench
phase —-I
complete loss of the current as shown in Fig. 7.7.1. Disruptions pose a
serious problem for tokamak development. This is firstly because they
limit the range of operation in current and density, and secondly because
their occurrence leads to large mechanical stresses and to intense heat
loads.
The sequence of events is illustrated in Fig. 7.7.2. There are essentially
four phases and these are summarized below. The physical processes
involved are described in Section 7.9.
Pre-precursor phase
There is a change in the underlying conditions leading toward a more
unstable configuration. This change is often clear, as in the case of

7.8 Causes of disruptions
an increase in total current or plasma density. Sometimes however a
disruption is precipitated without an identified change in the conditions.
Precursor phase
When the underlying change reaches a critical point there is an onset
of mhd instability. This is most obvious in the growth of the magnetic
oscillations of an m = 2 mode which had previously been absent, or had
saturated at a low amplitude. The time during which the growth occurs is
variable but is typically ~10 ms in medium sized tokamaks. Other low-m
modes are also observed.
Fast phase
After the mhd instability has undergone considerable growth a second
critical point is reached at which much more rapid developments occur.
The central temperature collapses on a timescale typically of the order of
a millisecond. A rapid flattening of the radial current profile is observed
and this gives rise to a characteristic short negative voltage pulse, typically
10-100 times the applied positive voltage.
Quench phase
Finally the plasma current decays to zero. The decay time depends upon
the particular conditions and on the plasma position control but current
decay rates greater than 100 MA s~' occur.
Causes of disruptions
There are several identified causes of disruptions. Operating limits for
steady operation are imposed by both low-^ disruptions and density
limit disruptions. These are thought to be due to unstable current
profiles which lead to large amplitude tearing modes. These instabilities
can also lead to disruptions if the current rise is too rapid. Another
cause of disruptions is the existence of magnetic field errors which
seem to provide a seed for the growth of tearing modes. Disruptions
can also be caused by solid fragments which fall into the plasma.
Finally, the vertical instability, described in Section 7.12, can end in
a disruption.
In the absence of a detailed theoretical understanding of disruptions it
is convenient to have an operation-based description which describes the
operational limits. The low-^ and high-density limits can be combined
in a diagram which was found by Hugill to give some pattern to the

7.8 Causes of disruptions
Rg. 7.8.1 Typical Hugill diagram
showing the operating regime as limited by
disruptions. <?„ is the safety factor at the
surface of the plasma and n the mean
electron density. The parameter
IQ-^^RR/B^, is called the Murakami
parameter.
l/q.
-
-
-
Low ^a boundary ^\^^ ^-^..^
^ /
y^ ^ ^ '• Extended boundary
with additional heating
1 1 1 1 1 1 1
experimental behaviour In this diagram the boundary of operation as
limited by disruptions is plotted against l/qa and hR/B^, this latter
parameter having been introduced by Murakami. Such a plot is shown
in Fig. 7.8.1. It is found that disruptions generally restrict operation to
a region qa > 2, and to electron densities such that (lO~^^nR/B^)qa is
below a critical value in the range 10-20 m~^T~'. Some improvement
in this density limit is found with the application of additional heating.
Using the relationship B^/Rqa = Gr/5) J, where J = I-^x/na^ is
the average current density in megamps per square metre, the density
limit can be written n/lO^^ = A to 2)Gr/5) im^^ ~ 1 JxtT^.
Using data from a number of tokamaks Greenwald has generalized this
empirical result to give a critical value n/10^*^ = kJ where k is the plasma
elongation and J is now the average current density in megamps per
square metre over the plasma cross-section. For an eliptical plasma J =
luK/Ttab and the critical density is then given by n/10^*^ = I-^x/na^.
The basic causes of disruptions will now be examined in turn and the
physics of the disruption process and its consequences will be described
in the next section.
Low-g disruptions
The underlying cause for low-^ disruptions is probably the increasing
incompatibility of stability of m = 1 and m = 2 modes as qa is lowered.
If the value of qo is restricted by an m = 1 sawtooth instability, then
increasing the current, and hence lowering qa, forces the q profile to be
more unstable. This can be seen from Fig. 6.10.4 where the stability line
^0 = 1 meets the m = 2 kink stability boundary at qa = 2.

7.8 Causes of disruptions
Fig. 7.8.2 Saturated helical
perturbations arising from them = 2
instability given as a percentage of the
minor radius, (/ is the total current
normalized to jra^/o)- For <?„ > 2 the
graph gives the teanng mode island width,
and for qa < 2 it gives the surface
deformation of the kink mode with a
conducting wall at r = 1 2a. (Sykes, A.
and Wesson, J. A., Plasma physics and
controlled nuclear fusion research, Proc.
8th International Conference, Brussels
1980 Vol. 1, 237,1.A.E.A Vienna A981).)
30
20
(%)
10
54
Island
width
3 _'
2 15
•
* Surface
' deformation
w
9
1
0.2 0 4
In the absence of the sawtooth instability, increasing the total current
would increase the current density at the axis. However the sawtooth
oscillations restrict qo by flattening the central q profile. The natural
consequence of this is an increased current gradient in the outer part of
the plasma. As qa = 2 is approached the ^ = 2 surface moves outward
toward the surface of the plasma and sees an increasing destabilizing
effect of this current gradient. The resulting tearing/kink instability then
grows to a catastrophic level.
Numerical calculations have brought out this m = I, m = 2
incompatibility and a graph of the nonlinear amplitude of the tearing and kink
modes is shown as a function of qa in Fig. 7.8.2. It is seen that the
calculated amplitude becomes very large as qa approaches 2.
Evidence for the role of the m = 2 mode was provided by an
experiment in JET. The surface value, qa, of the safety factor was reduced
during the discharge until disruption occurred and this was repeated for
a range of values of the Murakami parameter. The trajectories of the
discharges up to the disruption are plotted in Fig. 7.8.3. It is seen that the
disruptions all occur close to qa = 2.
Density limit disruptions
One mechanismfor disruptions at high density results from the increase in
impurity radiation as the density is increased. This radiation appears
predominantly at the edge of the plasma where low Z impurity atoms are not
fully stripped. The resulting cooling of the plasma produces a contraction

7.8 Causes of disruptions
Fig. 7.8.3 Trajectones of JET discharges
m the Hugill diagram showing a disruption
boundary close to qa = 2. (Wesson, J.A.
etal Nucleai Fusion 29, 641 A989).)
nR/B0(lO"m-2T-')
of the current profile which leads to an increased destabilizing current
gradient inside the ^ = 2 surface as described in Section 7.9.
As the density is increased and an increasing fraction of the heat loss is
in the form of radiation, a smaller fraction is conducted out of the plasma
boundary. In the limit of 100% radiation there is no conduction loss and
the plasma becomes thermally disconnected from the boundary. It is then
possible for the plasma to contract. As it does so the current profile adjusts
and the value of q at the contracted edge of the plasma approaches an
unstable value.
A simple model of the radiation process can be obtained from the
energy balance equation applied to the outer region of the plasma,
^d7)
K-,
= nsn^R{T)
7.8.1
where K is the thermal conductivity, taken to be constant, n^ is the edge
electron density, n-i is the impurity density and R{T) is the radiation
function.
Multiplying both sides of eqn 7.8.1 by K{AT/Ar) gives
2d7
dry
d7J
= n^n^KR{T)
.AT
d7'
7.8.2
Taking n^ and n^ to be constant and integrating eqn 7.8.2,
Gpiasma " G^dge = ^ri,n,K j" RiT) dT 7.8.3
where the heat flux Q = —KdT/dr, Qplasma is the heat conducted from
the core of the plasma, and 2edge is that conducted from the plasma at the
edge. The form of RiT) is taken to be such that R is negligible at both the
low edge temperature and the high internal plasma temperature so that
the integral can effectively be taken over all T. Examples of this function

7.8 Causes of disruptions
for coronal radiation are given in Section 4.21. When 100% radiation is
reached 2edge -» 0 and eqn 7.8.3 gives
Gplasma=ai(nenz)'/^ 7.8.4
where aj is a constant.
This condition can be used to derive a plausible model of the disruption
boundary for ohmic heating. First the energy balance equation is written.
27ragpiasma = 7Ta^T]f
where r] and j refer to average values so that, using eqn 7.8.4 and
T] ~ T~^/'^, the critical condition has the form
It is now necessary to determine T, and this is done using the energy
balance relation
nf (X —. 7.8.6
TE
Using the ohmic confinement relation, te oc na^, eqn 7.8.6 gives
T oc (aj)'^^^, 7.8.7
and ehminating T using relations 7.8.5 and 7.8.7 gives
■4/5
(nenz)'/'cx^. 7.8.8
Using Ampere's law, j is related to qa by
;■ oc -i-. 7.8.9
HoRqa
Neglecting the factor a'/^, eqns 7.8.8 and 7.8.9 now give the disruption
condition
1 =.<"'"->'''" 7.8.10
qa B^
where a is a constant. If Hz is taken to be proportional to n^ the quantity
on the right of eqn 7.8.10 is almost the Murakami parameter. Since this
parameter is based on an empirical description of the experimental results,
a precise relation is not to be expected. The derivation of eqn 7.8.10 brings
out clearly that it is the edge values of the electron and impurity densities
which are relevant in this disruption process. When additional heating or
a-particle heating predominates, eqn 7.8.4 indicates that the achievable
density increases with the heating power.

7.8 Causes of disruptions
381
Fig. 7.8.4 Temperature profile
neighbourhood of the radiating layer
assumed in the contraction instability
model.
the
When the 100% radiation condition is reached the subsequent inward
movement of the radiation layer and contraction of the current channel
can in principle develop in either of two ways. In the first the contraction
follows a continuing increase either in the electron or the impurity density.
In the second the contraction is an unstable process. This instability can be
understood in terms of a simple model in which the radiation is idealized
to take place in a narrow layer around a radius Op, and stability is then
determined by analysing the power balance for this layer. Figure 7.8.4
shows the form of the temperature around the layer. The power balance
equation is
df
g(flp) = rpiop) - Cn^iap)apS -
KTq
The left-hand side gives the rate of change of the plasma energy per
unit length, 8. The first term on the right is the ohmic heating, p being
the resistance per unit length. The second term gives the power radiated
from the layer of thickness 5, n being the electron density in the layer
and the radiation being taken to be proportional to n^ with C a constant.
The final term describes the power loss from the layer through thermal
conduction, Tq being the temperature characterizing the layer and a—Up
is the distance over which the temperature falls to a negligible value. In
equilibrium the three terms on the right-hand side of eqn 7.8.11 are in the
ratio 1: ^ : A — ^) where q) is the radiated power fraction.
Linearizing eqn 7.8.11 at constant current yields the stability equation
Up AS
[ P dflp
lap An ^
n dflpy
where y is the growth rate of a perturbation of Up, te = Sjp-p is
the energy confinement time, and only the dominant contribution to the
last term has been retained. Stability to contraction is determined by the
sign of Y and depends on the changes in plasma resistance and the
electron density in the radiating layer as the contraction takes place. If the
plasma resistance is taken to be proportional to 1 ja^, and the experimental
observation that dg/dap > 0 is used, the criterion for instabihty is
flp An 1
i- >
n dflp 2
1 1-
Ifp a — Up
The final term on the right-hand side is normally strongly stabilizing, the
large factor I/{a — Op) representing the need for the radiating layer to be
close to the boundary to conduct the power out of the plasma. However
as the radiated fraction increases this term decreases and as ^ -» 1 it
becomes negligible, the requirement to conduct power to the boundary
being removed. For ^ = 1 the plasma can be said to be disconnected from
the boundary. When this condition is reached the criterion for instability

7.9 Physics of disruptions
n dflp ^'
This criterion is difficult to apply because of the uncertainty as to how
the density changes in response to a change in the radius of the radiation
layer. However, it clearly exhibits the destabilizing effect of the layer
moving into a region of higher density to produce increased radiation.
The mhd destabilization of the contracting current channel can be
understood by writing the safety factor q in terms of the plasma current
and the effective plasma radius Op. Thus
Ga =
and it is seen that qa^ decreases as a^. The effect is to produce a more
unstable configuration in a similar way to that brought about by approach
to the low-^ disruption boundary.
Physics of disruptions
The physical processes involved in disruptions are not understood in detail
but the general pattern of the behaviour can be described.
The basic events are:
(i) The evolution of an unstable current profile leading to the growth of
a tearing mode, the m = 2 mode being particularly important,
(ii) The nonlinear growth of this tearing mode,
(iii) A sudden relaxation of the equilibrium in which the current profile is
flattened and there is a dramatic loss of confinement with a collapse
of the plasma temperature.
(iv) The total current decays,
(v) Under some circumstances the increased toroidal electric field
associated with the increased plasma resistance produces runaway
electrons. These electrons can carry a large current which sometimes
persists after the plasma current decay phase.
(vi) Both the loss of plasma energy and the current decay induce currents
in the vacuum vessel which can produce very large forces on the
vessel.
These events will be described in turn.

7.9 Physics of disruptions
Fig. 7.9.1 Illustrating the destabilizing
form of a current profile with a negative
current gradient inside the <? = 2 surface
Tearing mode instability
The common feature of the causes of disruptions Hsted in Section 7.8 is
that they lead to a current profile which is unstable to tearing modes and
in particular to an m = 2 mode. Thus, in the pre-precursor phase a slow
change in the equilibrium moves the current profile to marginal stability
and the onset of precursor oscillations marks the crossing of the stability
boundary.
It is seen from eqn 6.8.7 that a negative current gradient is destabilizing
for radii inside the resonant surface and most destabilizingwhen close to
this surface. Figure 7.9.1 shows a current profile which has these features.
The steep current, gradient is in part due to the constraint on qQ imposed
by sawtooth oscillations. This causes a flattening of the current profile in
the central region and increases the current gradient outside this region.
A similar effect would be produced by increased resistivity arising from
a concentration of impurities in the central region.
With qo constrained, increasing the total current and hence lowering q^
leads to an increasingly unstable current profile brought about by a
combination of the increased current gradient and the outward movement of
the ^ = 2 surface. If the current is increased rapidly there is not sufficient
time for the current to diffuse into the plasma and a sicin current forms
as shown in Fig. 7.9.2. This enhances still further the current gradient at
the edge of the plasma and under these circumstances the normally stable
higher m modes can be driven unstable as a resonant surface with q = m
passes through the steep edge current gradient.
As described in Section 7.8 a density hmit is imposed by the
contraction of the plasma current profile caused by increased surface radiation.
A contraction of the current profile can also result from a loss of
confinement in the outer region. A further enhancement of this effect can result
from the loss of confinement brought about by the instability itself, the
magnetic island formed by the instability leading to increased transport.

7.9 Physics of disruptions
Fig. 7.9.2 A skin current leads to a large
current gradient at the plasma edge making
the configuration susceptible to a
kink/teanng instability through the
neighbouring resonant surface.
Fig. 7.9.3 An example of the growth of
mhd instabilities m a disruption, with
expanded traces around the time of
mode-locking The bottom trace gives the
time integrated Br signal, showing the
continued instability growth following
mode-locking (Wesson J A et al, Nuclear
Fusion 29, 641{19&9))
yarb)(n = l) 2
-H#
—^
10.50 10.60 10.70 / 10.80
Time (s)
Growth of the tearing mode
Figure 7.9 3 presents the time development of a teanng mode instability
during the precursor phase of a disruption The instability first appears as
low level magnetic oscillation. The oscillatory form of the growth derives

7.9 Physics of disruptions
Fig. 7.9.4 The temperature across the
midplane of a magnetic island is flattened
through the equalization of the temperature
around the interior flux surfaces
from the motion of the helical instability around the torus. The velocity
of this motion, and therefore the frequency, is given by the sum of the
natural propagation velocity of the instability and the mass velocity of the
plasma. The mass velocity of the plasma can be produced, for example,
by the injection of momentum associated with neutral beam heating.
The oscillatory magnetic signal displayed in Fig. 7.9.3 is the time
derivative of the poloidal magnetic field at the edge of the plasma as
measured by the voltage induced in a pick-up coil.
The instability is seen to grow in a sporadic way, each burst constituting
a minor disruption. The oscillatory signal then disappears. However, this
is not due to a departure of the instability, it is due to the removal of
the oscillation. This is caused by the phenomenon called mode-locking,
described in Section 7.10. Essentially mode-locking occurs when the
amplitude of the instability is sufficiently large for it to interact with
external conductors, such as the vacuum vessel, in such a way as to
extract momentum from the plasma bringing the mode propagation to
a halt.
The subsequent growth of the instability to a large amplitude can be
followed by integrating the induced signal, B, to give the amplitude of
the perturbed magnetic field. It is seen from Fig. 7.9.3 that following
locking Br grows continuously as the fast phase of the instability is
approached.
The growing magnetic perturbation implies the growth of a
magnetic island in the plasma. A precise calculation of the island size from
the externally measured magnetic perturbation requires a knowledge of
the radial dependence of the eigenfunction. However, in calculating the
change in the perturbed magnetic field between the pl^ma surface and
the ^ = 2 surface, it is often a good approximation to neglect the current
gradient term in the tearing mode equation 6.8.7. The perturbed flux if
for them =2 mode then varies as r~^ and so, since Br "^ i^/r, the radial
magnetic field at the resonant surface is
The corresponding island size is then given by eqn 7.2 5.
Magnetic Islands 'short circuit' the radial transport through parallel
transport around the magnetic surfaces as illustrated in Fig. 7.9.4. Apart
from a narrow layer close to the separatrix of the island the high electron
thermal conductivity parallel to the magnetic field ensures that the
temperature IS constant on each magnetic surface. As a consequence the electron
temperature is almost constant across the magnetic island. This flattening
of the temperature profile through the island has been observed
experimentally A similar but weaker effect flattening effect is to be expected
for the plasma density.

7.9 Physics of disruptions
The fast phase
The calculated, and directly observed, m = 2 magnetic island size grows
to a width of typically 20% of the plasma radius. This by itself is not
adequate to explain the sudden energy loss from the central region and
the general loss of confinement. The explanation of this behaviour is not
clear. There are two pieces of experimental evidence.
The first is that there is a flattening of the current profile which leads
to the idea that a broad break up of magnetic surfaces has occurred with
multiple magnetic reconnections taking place. This is a generalization
of the single reconnection which leads to current profile flattening in
Kadomtsev's sawtooth model. The growth of teanng mode islands on
many surfaces could lead to an ergodization of the magnetic field structure
as described in Section 7.13. An account of the evidence for tiie current
flattening will be given below.
The second experimental result relating to the rapid energy loss is that
there is a gross m = 1 structure to the soft X-ray perturbation at the time
of the energy loss. This seems to be in conflict with the concept of a
multi-mode turbulence imagined to underlie tiie current flattening.
The evidence for the current flattening is the observation of a negative
spike in toroidal voltage at the time of the rapid phase as shown in
Fig 7.9.5. This IS measured as a negative voltage induced in a toroidal
voltage loop on the vacuum vessel, close to the surface of the plasma.
This voltage is the opposite of that expected since Lenz's law requires
that the increased resistance of the plasma, indicated by the subsequent
current decay, would lead to a positive voltage to maintain to current. The
geometry is illustrated in Fig. 7.9.6. The voltage on the primary winding,
which lies some distance outside vacuum vessel, is very small and so
the large negative voltage in the voltage loops means the magnetic flux
Fig. 7.9.5 At the time of disruption,
indicated by the fall m T^, there is an
increase m plasma current and an
associated negative voltage spike (Wessc
J A , Ward, D J , and Rosenbluth, M N
Nuclear Fusion 30, 1011 A990))
2
/p(MA)
1
"";
n(V) 0
"^^^"--^
"^. ^.
/ '^
\l

7.9 Physics of disruptions
387
Fig. 7.9.6 The negative voltage spike
measured on the voltage loop is due to the
flux change induced by the ii
plasma current
through the space between the loop and the primary has increased. Since
^ B ■ dl = fj-ol, this increase in the magnetic field Unking the plasma
current means that the plasma current itself has increased. As seen from
Fig. 7.9.5, this is observed.
That the current profile is flattened now follows from a
consideration of the magnetic energy associated with the plasma current. This
energy is
where L is the inductance associated with the plasma current. More
precisely It is the inductance given by the sum of the magnetic energy inside
the plasma and the magnetic energy between the plasma and the primary.
On the timescale of the negative voltage spike the magnetic energy is
essentially conserved and so the observed increase in current implies a
lowering of the inductance. Since the external part of the inductance is
determined by the geometry, this lowering of the inductance must be due
to a flattening of the current profile. Alternatively it can be said that the
negative electric field at the surface of the plasma implies an outward
Poynting flux. Since / increases, this outward flow of energy implies
lowering of the internal inductance of the plasma and again of a flattening
of the current profile.
Current decay
After the rapid energy loss phase the plasma current falls, Usually
decaying to zero. Since the temperature drops during the energy loss the
resistance of the plasma increases and, unless the primary voltage is able
to adjust, some current decay is expected from this cause. However the
current decay is usually faster than such a mechanism would allow. It has
long been conjectured that the increased plasma resistance implied by the
current decay could be due to an impedance arising from mhd turbulence
persisting from the energy loss phase.
However the irreversibility of the current decay implies that some other
process is involved. This is probably a cooling due to impurity radiation.
The cooling could be caused by the temperature falling to a level where
radiation is substantially increased. In the more rapid current decays the
explanation lies in an influx of impurities into the plasma, probably
resulting from the outflowing heat pulse arising from the rapid energy loss. The
rapid current decay is then due to a very low electron temperature,
typically a few eV. The extremely high ohmic heating implied by such a low
temperature is balanced by radiation from the impurity atoms.
Runaway electron current
Figure 7.9.7 shows the runaway electron current which sometimes
persists after the current decay phase, the electrons carrying this current
are relativistic and probably received their initial acceleration during the

7.9 Physics of disruptions
Fig. 7.9.7 Runaway electron current
formed at a disruption together with an
expanded trace showing the decay of the
ohmic current (JET)
rapid cooling of the plasma by impunties. The electric field during this
time is
--^JQ
T-3/2
where j^ is the ohmic component of the current. Since ij oc T^
E = ^,h. 7.9.1
From Section 2.17 the criterion for electron runaway has the form
and substituting for E from eqn 7.9.1 electron runaway is expected for
< C3-
7.9 2
Counter-intuitively a low electron temperature is required, the increase
in the ohmic electric field outweighing the increased collisional drag.
Initially Jq takes its pre-disruption value. The electron density n is
increased through the influx of impurities but at temperatures of a few

7.9 Physics of disruptions 389
eV criterion 7.9 2 allows a large and immediate runaway current to anse.
The precise behaviour is quite complex because the runaway current, jV,
subtracts from the total current, j, to give a reduced ohmic current. Thus,
the electric field driving the runaway current is diminished according to
E = rj(j-jr)
The ohmic current decays away leaving the runaway component which
has a very slow decay rate. The runaway electrons are ultimately lost to
the vacuum vessel with the production of hard X-rays.
Another mechanism which can be involved in the production of
runaway electrons is the scattering of plasma electrons into the runaway
region of velocity space as a result of close collisions with already existing
runaway electrons as described in Section 2.17.
Vacuum vessel currents
Disruptions cause large forces on the vacuum vessel. These are 7 x S
forces, the currents being induced by transient electric fields produced in
the vessel during the rapid energy loss and the current decay. The forces
arise in three ways.
Firstly the loss of plasma pressure leads to an increase in toroidal
magnetic field pressure inside the plasma, i5(B?/2/2o) ~ Sp, and from
flux conservation this lowers the toroidal magnetic field between the
plasma and the vacuum vessel. The resulting difference in magnetic field
across the vacuum vessel implies a poloidal current which crossed with
the toroidal magnetic field produces an inward force. The inward
pressure is approximately equal to the volume average change in plasma
pressure, Sp.
The subsequent current decay also produces a rearrangement of the
toroidal magnetic field. In a rapid current decay the toroidal magnetic
field pressure i5(B?/2/2o) which initially balances the poloidal magnetic
field, -^B^^/ljiQ, IS transferred to the vacuum vessel. The relative
magnitude of this force and the opposing force due to the loss of plasma
pressure depends on the poloidal fi. For y6p = 1 the forces are equal but
have different time dependences.
The third force anses from a toroidal current driven dunng the plasma
current decay, the induced voltage is Ly / where L\ is the effective
inductance of the vacuum vessel and / is the plasma current. The current induced
in the vessel is therefore
where R^ is the toroidal resistance of the vessel. This current, coupled to
the poloidai magnetic field Bga, leads to a pressure on the vessel

7.10 Mode locking
= Ly/Ry, Tdecay is the plasma current decay time, and
where i
■^vessel < ■'^decay-
All of the forces typically have pressure of the order ^Bq^/I/j-q and for
a safety factor qa = 2 this pressure is ~ {a/R)'^B'^/24fio. For a/R = j
and Btp = 5 T this pressure is ~10^ N m~^, that is 10 tonnes m~^. For
present large tokamaks this leads to hoop forces of several hundred tonnes
and in a reactor tokamak the force would be an order of magnitude larger.
Mode locking
The influence of a conducting shell on stability was analysed m
Section 6.9. In a tokamak the vacuum vessel provides such a shell. For
finite amplitude perturbations there is a further interaction between the
plasma and the wall resulting from a drag force which acts to reduce
the phase velocity of the instability, and therefore its frequency. When
the phase velocity is reduced to zero, the mode is locked to the vessel.
However there is always a small driving effect tending to increase the
frequency to its 'natural' value and this would introduce a very low
residual frequency were it not for small error fields which, if large enough,
intervene to completely lock the mode. An example of the growth and
subsequent locking of a tearing mode is shown in Fig. 7.10.1 and the
geometry is illustrated in Fig. 6.9.3.
The interaction which reduces the phase velocity is due to currents
induced in the vacuum vessel by the magnetic field perturbation of the
instability. For a stationary instability the relative phase of the currents
and fields is such that they j x B force in the direction of the wave
vector is zero. However a finite propagation velocity introduces a phase
shift and the resulting force on the vessel is in the direction of the wave.
It IS quite straightforward to calculate this force and this will be done
Fig. 7.10.1 The magnetic signal Bg
shows the frequency and growth of an
n = 1 teanng mode The reduction m
frequency corresponds to a fall of the
propagation speed, and the removal of the
gross oscillation indicates the final mode
locking (JET)

7.10 Mode locking 391
below. Because the magnetic perturbations have their origin in currents
in the plasma there is also a force on the plasma. This is more difficult to
calculate but for a simple analysis it is sufficient to use the conservation of
momentum to deduce that the force on the plasma is equal and opposite to
that in the vessel. The force on the plasma, being in the opposite direction
to the wave velocity, is the force which brings about the slowing of the
wave and the reduction in its frequency. The rate of slowing is
basically described by Newton's equation of motion. Because the mass of the
plasma is very small, in present tokamaks <10~^ g, the electromagnetic
forces required to slow the instability are correspondingly small, typically
the weight of 1 kg.
Neglecting for the moment the effects of viscous damping and of error
fields, and using the large aspect-ratio approximation, the rate of change
of the observed frequency is related to that of the plasma velocity by
dco , dv
— =k-— 7.10.1
df df
where
k = -iQ-^i^. 7.10.2
The acceleration is determined by the equation of motion. Integrating
the force over the plasma volume and taking the motion to be rigid the
toroidal equation is
r[ pdV^ = T^ = R[ F^dV
where T^ is the toroidal torque, F^ the toroidal force density and p is the
density of the plasma involved in the rotation. In the poloidal direction
the equation of motion is
jprHvY^ = Te=^JFerdV
Tg being the poloidal torque, Fg the poloidal force density and the poloidal
rotation frequency vg/r is taken to be constant in r.
Equations 7.10.1-7.10.4 now combine to give
dco _ mTg nT^
dt Jpr^dV R^fpdV'
As discussed above it is more straightforward to calculate the balancing
forces in the vessel and this procedure will be used.

7.10 Mode locking
Thus, using the subscript v to refer to the vessel, 7^ = — T^v and
0 = — r^v where T^v and Tq^ are given by integrals over the vessel,
-/
F^vdV
Te^= / Fe^rAV. 7.10.7
Since there is no contribution from the vacuum regions the inner and outer
radial limits on the integrals can be conveniently extended to r = a and
r -» oo, the only contribution actually arising in the vessel. The force
density along k is
F = ]B, 7.10.8
where j is the perturbed current along the perturbation, that is,
perpendicular to k. In the large aspect-ratio approximation this force is basically
in the 6 direction and so, in leading order,
Fey = F 7.10.9
and the (p component of the force density, {k^/k)F, is
Thus, using eqns 7.10.6 to 7.10.10, eqn 7.10.5 can be written
— = / / Fr^drdO
dt mj J^
where
™2 „2
J
f ppdr R^ f prdr'
The current j is given by Ampere's law, which takes the same form as
eqn 6.8.5, and Br is similarly given by eqn 6.8.4. Thus, substituting into
eqn 7.10.8
F = -L1^VV. 7.10.13
Substituting eqn 7.10.13 into the integral of eqn 7.10.11 gives
f rFr'drd9 = -^[('-^'-^) d9. 7.10.14
This is calculated by writing
f = Re(V^(r)e""^)

7.10 Mode locking 393
where ^r is complex. Equation 7.10.14 then becomes
SI Fr^ArAd = —lm(ir*ir'\ 7.10.15
J Ja 2/20 ^ ^a
and substituting eqn 7.10.15 into eqn 7.10.11
n(f*if'^ 7.10.16
Using eqn 6.9.7 for i^'/if with eqn 6.9.12, eqn 7.10.16 can now be written
^^ , 7.10.17
d&) _ aJ
dt ~ 2/20 '
dt 110 \b'
1 + -T 1
■©
where Ty is the resistive time constant of the vessel, given by eqn 6 9 13
In general the time dependence of co is determined by eqn 7 10 17
together with an equation for the growth of xj/a {=aBr {a)/m). The result
of such a calculation is shown in Fig 7 10 2. However, it is seen directly
from eqn 7 10 17 that in the absence of a driving term o) will decrease
monotonically, and if ^a is saturated o) will finally decay exponentially
to zero.
Equation 7.10.12 implies that the first term in J dominates This is
because the force is principally poloidal and the inertia of poloidal rotation
is much less than that of toroidal motion. However, there are strong
Fig. 7.10.2 Self-consistently calculated
growth and mode-locking for an m = 2
teanng mode (Nave, M F.F and Wesson,
J A Nuclear Fusion 30, 2575 A990))
0.1
■^ 0
Bg
A0^ s"')
^^^^
y^ Island width
1111111 Magnetic
ill illl 11 signal
\. Frequency
\
0 05 0 10 0 15

7.11 Error field instability
poloidal damping mechanisms resulting from toroidal effects whereas the
toroidal motion suffers no such damping. It appears from the experimental
results that it is more appropriate to retain only the second term in J. The
integral in this term depends upon the radial extent of the accelerated
plasma. This can be localized around the magnetic island formed by the
instability or, through viscosity, involve most of the plasma.
The presence of a pre-existing magnetic perturbation, arising for
example from small magnetic field errors, can play a role in determining
the phase of the locking process. For example an error field giving rise
to a force ~ fi cos@ — 0o), where (p is the phase of the oscillation and
y6 > 0, would transform the small o) form of eqn 7.10.17 to
h y6 COS@ - 0o)
7.10.18
where co has been replaced by dcp/dt. It is seen from eqn 7.10.18 that as
d0/df -» 0 the final locked phase will be 0 = 0o + Gr/2)
Error field instability
It has been found that small deviations from toroidal symmetry of the
magnetic field can lead to the growth of m = 2 tearing modes and
terminate the discharge with a disruption Field errors can arise from (i) the
internal winding structure of the coils, (li) the connections to the coils,
and ill) misalignment of the coils. Although the field errors can be made
as small as a few gauss it turns out that, under some circumstances, such
errors can cause disruptions
The deviation from coil current symmetry introduces perturbing
components to the magnetic field Thus, for example, the non-symmetric part
of the currents can produce anm = 2,n = I contnbution to the magnetic
field The radial component, Brib), provides an inhomogeneous
boundary condition for the teanng mode equation 6 8.7 at a radius b outside
the plasma. Solution of this equation for a given current profile allows a
calculation of the saturated island width using the criterion A'{w) =0
described in Section 7.3.
A simple estimate of the modification to A' can be obtained by
assuming the plasma current outside the resonant surface to be negligible.
The solution of eqn 6.8.7 is then
where the first term represents the perturbed magnetic flux due to plasma
currents and the second term is that due to the error currents in the coils.

V^es is the value of the error component at the radius, rg, of the resonant
surface. Putting ip- = xf/s at this surface gives
Thus the contribution to (V^7V^)r,+£ from the error field is 2(m/r)V^es/V^s-
The solution for r < rg is determined by the boundary condition ^^@) = 0
and its form is therefore unaffected by the error field, and so the resulting
A' can be written
A' = A^ + 2- -4^ 7.11.1
where Aq is the value of A' in the absence of the error field. Since the
island width, w is proportional to ip-l' , eqn 7.11.1 can be rewritten
A' = A^ + 2- —)
where We is the island width which would result from the error field alone
which, using eqn 7.2.8, is given by
An estimate of the saturated island width is now given by A'(w) = 0 and
eqn 7.11.2 gives the formula for w.
m /We\2
A^(u;) + 2-(-^) =0
Aq being determined from the solution of eqn 6.8.7.
If the plasma is spun toroidally, say by neutral beams, it is to be
expected that the island size will be substantially diminished if the angular
frequency of rotation, o), is sufficiently high that &)t > 1 where r is the
nonlinear growth time of the tearing mode island. Calculations predict
such an effect and it is observed in experiments that spinning the plasma
can indeed prevent disruptions which would otherwise occur.
Even without spinning, tearing modes are observed to rotate toroidally,
typically at a frequency around the electron diamagnetic frequency. For
very small error fields this rotation prevents large island growth, but if
the error field is above a critical level the tearing mode locks to the frame
of the error field and the island grows to a large size. The critical level of
error field is dependent on the plasma density, higher densities allowing
a larger error field.
The requirement that the m = 2 error field be small, with Br of the
order of a gauss, presents a difficult requirement for a reactor. If error
field instabilities persist under such conditions the instability must be
prevented by active means, for example by spinning the plasma or by
feedback control.

7.12 Vertical instability
The saturated island width is clearly dependent not only on the error
field, but also on the intrinsic tearing mode stability of the current profile.
To explain the observed behaviour it is necessary for the error field to have
a strong additional effect to that of the intrinsic tearing mode. Calculations
for specific cases generally give only small error field increments to the
island size and it is not understood how such small modifications cause
the observed growth to large islands and to disruption. However it is
quite clear that the error fields are responsible, because disruption can be
avoided by reducing the magnitude of the error.
Vertical instability
Fig. 7.12.1 Showing the
the plasma with the vacuum vessel m
vertical instability, resulting in a halo
which cames current to the vessel.
The instability of elongated plasmas to a gross vertical displacement
was discussed in Section 6.15. Because of this instability tokamaks with
elongated plasmas have feedback control to hold the vertical position of
the plasma. Nevertheless the vertical instability can occur, either through
a failure of the control system, or as a result of the gross perturbation
resulting from a disruption. The potential threat of this instability became
clear on JET when it led to forces on the vacuum vessel of several hundred
tonnes.
For small vertical displacements of the plasma a toroidal current is
induced in the vacuum vessel as the poloidal flux is compressed between
the plasma and the vessel. For these small displacements the flux of the
Vessel toroidal magnetic field is not compressed because it does not link the
plasma. Consequently the poloidal current induced in the vessel is small.
However, for the large displacements which are observed experimentally
the plasma can make substantial contact with the vessel. The toroidal
field is then trapped between the plasma and the vessel driving a large
poloidal current in the vessel. The resulting force can dominate that of
the toroidal currents.
The geometry of this behaviour is illustrated in Fig. 7.12.1. It is seen
that the outer flux surfaces intersect the vessel over a 'halo' region.
Because the plasma is cold at this stage there is no pressure gradient
and the plasma current in the halo flows parallel to the magnetic field
lines. On entering the vessel the current circuit is completed along a path
determined by the conductance of the metal structures. The resulting
forces can therefore be a threat to other components inside the vessel.
In the overall force balance the destabilizing force is due to the
interaction between the poloidal field coil currents and the plasma current. Let
this force be Fp,c. Since the total force on the plasma must be zero, the
destabilizing force must be balanced by the force Fp^ on the plasma due

7.13 Ergodicity
to the vessel currents. Thus
The total force on the vessel is the sum of the force from the plasma,
—Fp,v, and the force from the coils Fv,c, so that using eqn 7.12.1 the
force on the vessel is
^vessel = ^p,c + i\,c = -^coils- 7.12.2
It is seen from eqns 7.12.1 and 7.12.2 that the force is transmitted from
the poloidal field coils to the vessel via the plasma.
7.13 Ergodicity
When an instability with a given helicity occurs in the plasma, the
magnetic topology is changed at any magnetic surface which is
resonant with the instability. The magnetic perturbation produces a magnetic
island as described in Section 7.2.
If the perturbation has more than one helicity then, at small amplitude,
each helicity produces narrow islands on its resonant surface. Although
the magnetic topology is changed, each island has magnetic surfaces
and the regions between the islands retain their laminar magnetic
surfaces. However, if the amplitude of the multiple helicity pdturbation is
increased, a fundamental change arises. The field lines around the separ-
atrices no longer lie on magnetic surfaces. If a field line is followed, its
trajectory is found to remain within a certain region but moves
throughout this region. After sufficient distance the field line will approach any
points in the region arbitrarily closely. In the limit the field line 'fills' the
volume concerned. This space-filling property of the field line is called
ergodicity.
An example of this behaviour is illustrated in Fig. 7.13.1. The model
is in slab geometry, the magnetic field being
Bx = B'^y
B^ = Bq = constant
By = y(cos(k^z + kxx) + cos(k.z - kxx))
= IByCOSk^ZCOSkxX.
This is a sheared magnetic field with two perturbations at an angle to each
other. These perturbations are resonant at the surfaces
^ kx B'x ■
The magnetic field is periodic in z with periodicity length In/k^.

398 7.13 Ergodicity
J >^^i^ r c c^^^fiy > ^ > >--<^< c^
A1)
> ■■-—'" ( (.Cc<^:>:>
--c;:^::^-^- «==■-
„.—-^.^ <• ^ CCc< --0^
' ^~^^-^""' ^
- --. " ^3^ ^ -
^ ^ - *'~^- -.
(IV)
•.-;/- <<©>> :' :--. ■;
Fig. 7.13.1 Diagrams showing change
in magnetic field topology as the
magnitude of the perturbing magnetic field
IS increased
The trajectories of the magnetic field lines do not of course have this
periodicity. These trajectories are determined by the equations.
dx
d^ "
dy
dz "
and their ix,y) position can be plotted at the periodic planes
z = n{2n/kj), n = 1,2,... (In the analogous tokamak problem these
planes would be a single plane, 4> = constant.) Figure 7.13.1 gives such
plots for four levels of perturbation. For Fig. 7.13.1(i) the perturbation
amplitude, By, is such that the island width is equal to half the
separation between the resonant surfaces. Figures 7.13.1(ii), (iii), and (iv) have
perturbations twice, three times, and ten times this value.
In (i) the two island strings are well separated and the magnetic field
lines map out laminar surfaces. In (ii) a region around the separatrix is
seen to be ergodic. In (iii) and (iv) the ergodic region covers a substantial
part of the volume between the original resonant surfaces, and field lines
now join these two surfaces.

7 14 Fishbone instability
Fig. 7.13.2 Calculated IB
magnetic field lines with a chosen poloidal
plane in a tokamak In (a) mhd
perturbations produce magnetic islands and
in (b) a higher level of perturbation leads to
a substantial region of ergodic behaviour
The condition for the regions of ergodicity to join is essentially that
the island widths become comparable with their separation—so-called
island overlap. If many surfaces are involved the behaviour of the field
lines becomes increasingly stochastic, allowing a description in terms of
field line diffusion. It is of course difficult to observe this type of behaviour
directly in an experiment but it is widely supposed to play a role in the
plasma behaviour by increasing transport.
Figure 7.13.2 illustrates the effect of mhd perturbations on a tokamak
magnetic field. The two parts show the calculated intersections of a
number of field lines with a given poloidal plane. In (a) the perturbations have
broken the singly nested structure and have produced magnetic islands.
In (b) a higher level of perturbation has given rise to a large ergodic region
such as might occur during a disruption.
7.14 Fishbone instability
It has been found that under certain conditions the injection of a high
energy neutral beam to heat the plasma can lead to an instability and
consequent energy loss. The instability is apparent from several diagnostics.
The bursts of soft X-ray emission which are superimposed on the usual
sawtooth oscillations are shown in Fig. 7.14.1(a) and the magnetic
oscillations which are observed during a burst are shown in Fig. 7.14.1(b)

7.14 Fishbone instability
(a) 1.8,
470 475 480 485 490 495 500
Time (ms)
Fig. 7.14.1 Fishbone instability (a) soft
X-ray emission, (b) poloidal magnetic field
fluctuations, and (c) an expanded trace of
these fluctuations. (McGuire, K etal
Physical Review Letters 50, 891 A983))
and (c). It IS the form of these oscillations which has given the name
fishbone to this instability.
It seems that the instability is due to an interaction between the injected
particles and !tn m — I, n — I mhd perturbation. The interaction is of
the resonance type characterized by Landau damping, but here causing
growth. The resonance is between the toroidal wave velocity of the
instability and the toroidal drift experienced by trapped particles, in this case
trapped energetic particles from the injected beam. Since the requirement
for a particle to be trapped is that its velocity be sufficiently perpendicular
to the magnetic field, this instability would not occur for injection parallel
to the magnetic field.
The toroidal drift is most easily seen as the drift of the banana orbit of
the trapped particles. At each successive bounce point the orbit is shifted
in the toroidal direction. Considering a strongly trapped particle v± > wn,
the vertical drift velocity Vd = jv]_/cocR, given by eqn 3.10.6, leads to a
poloidal displacement between bounces ofrAO = Vdtb, where Tb is the
bounce period. Since dcp/dO = ^, the associated toroidal displacement
between bounces is RAcp = (qvdR/r)rb. Thus the toroidal drift velocity
of the banana orbit, RA(p/rb, is
- 1^

7.14 Fishbone instability 401
For particles which are not strongly trapped the expression is more
complicated.
The stability analysis leads to a dispersion relation for co of the form
ico ~ f (j)(co,v,r) df ,
+SWp + co / "^^ — ^-Zd3i;dr=0 7.14.1
COA J cod — CO or
where (WA = {B^/R)/{iXQp)'^l'^ and 5Wp is the normalized mhdpotential
energy change of the plasma. The last term is the contribution from the
trapped particles. The instability is driven by 9//9r, the radial gradient
in the fast particle distribution function. The velocity space integral has
a resonance at velocities for which oj = codiv^) where cod — Vd(f>/R-
The first two terms of eqn 7.14.1 describe the mhd m = I internal kink
mode. The additional term introduces a new root to the dispersion relation.
The instability associated with this root requires a sufficiently high energy
density of the trapped particles. This energy is measured by an effective
beta for these particles, ySh- The precise stability condition depends on the
distribution function of the fast particles but approximate solutions can
be obtained for particular cases. For the steady state distribution function
which results from fast particle injection at a particular energy and the
associated slowing down, the dispersion relation takes the form
ico ~ CO / coAm \
+SWp + afih ln(l--^) = 0 7.14.2
COA COdm ^ CV /
where a is a quantity of order unity and codm is the value ofcod at injection.
At marginal stabiHty co is real and the imaginary part of eqn 7.14.2
gives the critical value of y6h for tiie fishbone instability. Recalling that,
for real x, Inx = In |x| + jri the criterion for instability is
;6h > -^^^. 7.14.3
ancoA
For the case of marginal mhd stability, that is SWp = 0, and eqn 7.14.2
can be solved to give
This demonstrates the instability criterion 7.14.3, instability occurring
for coi > 0, and gives a real frequency of half the toroidal drift frequency
of the injected ions.
More generally the dispersion relation takes the form
J(-(---*Oy^\sW, + SW, = 0 7.14.4
COA
where the diamagnetic frequency ci)„ anses from the finite Larmor radius
of the plasma ions and SW^ represents the contribution of the fast ions.
Depending on the circumstances, a range of instabilities is possible with
frequencies from cod down to co„.

7.15 Toroidal Alfven eigenmodes
Fig. 7.14.2 Stability diagram in the
(ai,i, ^ph plane where ^ph is the poloidal
beta of the hot particles Outside the stable
legion there is the fishbone instability, with
the real frequencies indicated, and the
MHD m = 1 kink mode which appears at
small ^ph (From Coppi, B et al, Physical
Review Letters 63, 2733 A989)))
-
-
-
a>~ft)»|
MHD \.
Stable
1
Fishbones
i
«~«d
The presence of fast ions and the corresponding term in eqn 7.14.4
also allows for stabilization of the m = 1 mode under conditions where
it would be otherwise unstable. Such stabilization was observed in JET
during ICRH heating. The stabilization took the form of so-called monster
sawteeth and is descnbed in Section 12.3. The general features of the
stability boundary predicted by eqn 7.14.4 are shown for a typical case
in Fig. 7.14.2
Toroidal Alfven eigenmodes
The simple forms of mhd waves were descnbed in Section 2 24. In a
tokamak these waves take a more complex form, partly because of the
toroidal geometry and partly because of the shear in the magnetic field.
The effect of shear is included in the large aspect-ratio eigenmode
equation
-f
dr
3d£l
drj
-\){poj'~-F'}r^+co'r
^=Q

7.15 Toroidal Alfven eigenmodes 403
where ^ is the radial displacement and F — (m — nq)Be/ix\l r. For a
given frequency the coefficient of the highest derivative in eqn 7.15.1 has
a zero at the radius r for which
-nq = ±
Be/{iiQP)y^'
The corresponding solutions to eqn 7.15.1 are therefore singular. Thus
rather than having a spectrum of discrete eigenmodes, the solutions form
a continuous spectrum For each {m,n) the frequency ft;(r) is given by
eqn 7.15.2. Figure 7.15.1 gives a typical graph of ft;(r) for several mode
numbers.
In toroidal geometry there is an interaction between the Fourier
components. For a given n, the curves ft;(r) break and join at their intersections,
to leave gaps in coir) as shown in Fig. 7.15.2. In addition there is a single
mode within the gap, this Toroidal Alfven Eigenmode (TAB) sometimes
being referred to as the gap mode.
Fig. 7.15.1 Typical fonn of the
spectrum a){r) in a cylinder The curves
are for a given axial wavenumber, and
there is a separate curve for each m
Fig. 7 15.2 Showing how, for a given
toroidal mode number n, the a){r) curves,
which are separate for each m in a
cylinder, are modified in a torus The
curves for the cylindncal modes m\ and
mi 'reconnect' and also produce a discrete
'gap' mode at the intersection
J*k-« Gap mode

7.15 Toroidal Alfven eigenmodes
Whereas the shear Alfven waves of the continuum are strongly
damped, the weaker damping of the TAB can be overcome by a
destabilizing interaction with fast particles.
In particular it is thought that the a-particles produced in a reacting
plasma could produce an instability in which a resonance between the
a-particles and the wave leads to a release of the free energy associated
with the radial a-particle density gradient.
Calculation of the driving and damping leads to a growth rate y
given by
m 4'^"Vft;o 2/ \VaJ
Va
coo-^ 7.15.4
2qRo
is the real frequency of the basic Alfven mode, with Va = B/{fxop)^!'^,
Pa is the beta value of the a-particles and w^a is their diamagnetic
frequency, given for poloidal mode number m by
Va IS the average a-particle velocity and F{x) = x{\ + 2x + 2x )e~^ .
The damping term D in general has contributions from several effects.
The form of F{VA/Va) shows that the instabihty is predominantly
associated with a-particle velocities around or above the Alfven velocity.
In a 50: 50 deuterium-tritium plasma with n = 10^*^ m'^ and B = 5 T
the Alfven velocity is 7 x 10^ m s""'. a-particles, formed with an energy
3.5 MeV, have an initial velocity of 1.3 x lO' m s""' and so the potential
for instability exists.
In a reactor the a-particle production rate balances the loss of fast
a-particles through slowing down. Thus the density of fast a-particles
has the form
Ha ~ n^(av)rs
where (av) is given in Fig. 1.3.1 and Ts is the slowing down time. Since
Ts oc T^^^/n and, approximately, (av) oc T^
iiaOinT'^/^. 7.15 6
Using relation 7.15.6 and substituting typical reactor values into
eqn 7.15.5 it is found from eqn 7.15.3 that, in the absence of the damping
term, the TAEs would be unstable to all m numbers. Stability therefore
depends on the magnitude and m dependence of the damping

7.15 Toroidal Alfven eigenmodes
Fig. 7.15.3 Graphs showing the
m-dependence of the contnbutions to the
normalized damping rate of TAB modes
for an ITER equilibnum (from
Connor, J W etal, Proc 21st European
Phys Soc Conf on Controlled Fusion and
Plasma Physics, Montpelher 1994)
Damping
Ion Landau damping
Radiative damping
There are four important contributions to the damping term D i
eqn 7.15 3:
(i) Coupling to the damped continuum, damping operating predom-
inandy at low m and varying as m~^/'^ at high m
(ii) Ion Landau damping with little m dependence,
(iii) Trapped electron collisional damping which is proportional to m?.
(iv) Radiative damping due to coupling with Alfven waves, scaling as
e-i/m_
These contributions are shown in Fig 7.15.3. In addition to the
damping, finite orbit effects limit the increase of the driving term in
eqn 7.15.3 with m. The combined effect of these contributions is such
that in present large tokamaks small m numbers, typically 3-6, are most
unstable. In a reactor the m number would be higher.
Fig, 7.15,4 Spectrum of TAB density
fluctuations as measured by beam emission
spectroscopy on TFTR together with that
of the magnetic fluctuations, Bg, measured
by a Mimov coil (Wong, KL etal.
Physical Review Letters 66, 1874 A991))

7 16 MARFEs
TAEs were first observed experimentally in TFTR in an experiment
using neutral beam injection to provide the fast ions. Figure 7 15 4 shows
the frequency spectrum of density fluctuations together with that of
the magnetic fluctuation Be The experimentally observed frequencies
showed agreement with eqn 7.15.4 withm the experimental uncertainty.
MARFEs
The MARPE is a radiation instability which appears m tokamaks as a
toroidally symmetric ring of enhanced radiation. It usually occurs on
the inner side of the torus but also appears around the X-point of divertor
configurations. The underlying cause is an instability in which the plasma
is locally cooled by radiation in circumstances where the cooling itself
leads to increased radiation and hence further cooling.
The main element in this process is provided by the increase in line
radiation from impurities witii decreasing temperature. An example of
this is given by the coronal radiation of low Z impurities such as
carbon and oxygen as shown in Fig. 4.25.1. It is seen that for temperatures
in the range 10-40 eV the radiated power can rise by orders of
magnitude. A second contribution to the instability arises when, in order
to maintain pressure balance along the magnetic field, plasma flows
into the MARFE thus increasing the density and hence the radiation.
The counterbalancing effect is thermal conduction, both parallel and
perpendicular to the magnetic field. Figure 7.16.1 illustrates the geometry.
The basic equation describing the behaviour is the energy balance
equation
dt
{3nT) = V-KVT - Pr
where K is the thermal conductivity and Pr is the radiated power
density. Stability can be determined by linearizing this equation together
with those describing the plasma dynamics and solving these equations
to determine the sign of the time derivative. This procedure can be
simplified by finding the condition of marginal stability, this being that the
Fig. 7.16.1 The MARFE region, shown
shaded, is cooled by radiation and heated
by the stabilizing perpendicular and
parallel heat fluxes

7.16 MARFEs 407
right hand side of eqn 7.16.1 is equal to zero, that is
3 dT d dT
— K^— + -Kii—=n,n,R{T). 7.16.2
ox ox oz oz
In eqn 7.16.2, x is the coordinate perpendicular to the magnetic field, and
z that along the field, n, is the impurity density and R is the radiation
function which is taken to be a function of the temperature only. For the
MARFE, X is the radial coordinate. The Fourier components along the
magnetic field have the form e'^>^ where for periodicity k^ = l/Rq. Thus
hnearizing eqn 7.16.2 and denoting the linear parts with tildes,
fex^ - klK\\f = fi,n^R{T) + n,h^R{T) + n,n^R(T). 7.16.3
At marginal stability there is pressure balance along the magnetic field
lines and so n^ is determined by the equation.
A detailed calculation would be required for h, but for present purposes
it is adequate to take
Thus substitution of eqns 7.16.4 and 7.16.5 in to eqn 7.16.3 gives the
equation governing stability
, d^f
(^«^ll -
and the last two terms
, d^f
(^l^ll -
- tiiti
can
-n,n
'{4-
AR\
'drj.
be combined to
dr
iK
y
give
)f.
7.16.6
It is seen from the last term that the effect of the density perturbations is
effectively to enhance the temperature dependence of the radiation.
Equation 7.16.6 can readily be solved for any particular case but some
basic features can be extracted using a simple model. Thus the coefficient
of f on the right hand side is taken to be constant over the region where
d{R/T^)/dT < 0 and the solution is taken to be small outside this region.
Taking the width of the region to be A, this gives a rough condition for
instability
-"."e?^'^(^)>f^^x+fc^/^l, 7.16.7
Each of the terms in eqn 7.16 7 has a sensitive parameter. For low Z
impunties the radiation term vanes by orders of magnitude in the
temperature range of tens of eV. The perpendicular thermal conduction varies

7.16 MARFEs
as 1/A , A being determined in part by the width of region over which
the radiation is substantial and this in turn depending on the temperature
gradient. Finally the parallel thermal conduction is sensitive to the
temperature since ^n is proportional ioT^ . Because of these sensitivities,
and uncertainties about both the transport and the coronal or non-coronal
form of the radiation, no precise calculation of stability is possible.
However, to obtain some insight and ascertain the general plausibility, simple
assumptions will be made to estimate the size of the terms in the stability
criterion.
Since the perpendicular conduction is anomalous the value of ^x
is uncertain. Using ^x = riXL, the typical measured values of n ~
3 X 10''^ m-3 and Xi. ~ Sm^ s"' give Ka_ ~ lO^^ m^' s^' and the first
term on the right hand side of inequaHty 7.16.7 is
The parallel thermal conductivity is given by eqn 2.23.9 and so, taking
In A = 12 and writing the temperature in eV,
For a large tokamak k\\ ~ 0.1 m~' s~' and so
k\K\\ -lO^^r/^^ m-^s-'. 7.16.9
Comparing relations 7.16.8 and 7.16.9 it is seen that perpendicular
thermal conduction is dominant on the right hand side of inequality 7.16.7
forA<3/r^^^'^m.
Using the coronal radiation curve of Fig. 4.25.1 for carbon to estimate
the radiation term in inequality 7.16.7 a typical value at n = 3x 10'^ m~^
andr ~ 20 eV might be
dr \T^) -^
where / is the fractional impurity level njn^. Taking perpendicular
thermal conduction to be dominant and comparing relations 7.16.8 and
7.16.10 It is seen that with these assumptions instability would occur for
so that a 10% impurity level would sustain a MARFE with a width greater
than 3 cm.

7.17
ELMs
The discovery of the H-mode of tokamak operation was accompanied
by the observation of short bursts of a new, Edge Localized Mode of
instability—ELMs. These bursts were detected by magnetic pick-up coils
and soft X-ray diodes, and have subsequently been found in association
with H-modes in other tokamaks. Each burst of instability causes a
reduction in density and temperature in the outer zone of the plasma, and the
periodic behaviour constitutes a relaxation oscillation. A fall in
temperature across most of the plasma radius is sometimes observed and the
existence of ELMs causes some deterioration of confinement through the
time-averaged reduction of the H-mode transport barrier.
With each ELM there is a burst of Hq, radiation, caused by the influx of
hydrogen released from the wall as aresult of the instability. Figure 7.17.1
shows such Hq, bursts in two ASDEX discharges with neutral beam
injection. In the first case each burst is continuous, and such ELMs are often
called 'grassy'. In the second case the Hq, pulses are single and larger.
Fig. 7.17.1 Ha emission showing ELM
activity dunng H-modes witli neutral
injection in ASDEX, (a) with continuous
bursts, and (b) with separated large ELMs
The figure also shows the response of the
electron density (ASDEX Team, Nuclear
Fusion 29, 1959A989))

giving rise to the name 'giant' ELMs. In both cases the associated restraint
on the growth of the electron density is seen.
An attempt has been made to categorize the types of ELMs more
precisely. Although useful, the definitions are somewhat imprecise.
• Type I ELMs are essentially giant ELMs. This type is a particular
threat because of the large heat loss pulse involved and the consequent
unacceptably high heat load on the divertor
• Type II ELMs are intermediate category which avoid the heat pulse of
type I but do not lead to a severe loss of general confinement
• Type III ELMs are continuous 'grassy' ELMs which are associated
with a substantial deterioration of confinement.
Fig. 7.17.2 Discharges with and without
ELMs, showing the increase in electron
density and impunty accumulation
associated with the ELM-free case Note
that the iron emission line signals are
amplified in the case with ELMs (ASDEX
Team, Nuclear Fusion 29, 1959 A989))
Another feature is brought out in Fig. 7 17.2 which shows results from
two discharges, one with ELMs and one without. The ELM restnction on
density is again seen, but the continuous increase in he in the ELM-free
discharge is seen to be accompanied by an increase in the iron impurity
line radiation. The increase in impunty level is also apparent from a com-
panson of the behaviour of the total radiation It is found quite generally
that ELM-free H-modes lead to impunty accumulation and, in discharges
with ELMs, there is a trade-off between the reduced impurity level and
deteriorated confinement.
The cause of ELMs is not clear. It is perhaps not surprising that
the increase edge gradients in H-modes leads to instability, but no
unequivocal identification of the type of instability has been made. The
existence of a magnetic perturbation indicates an mhd source. The
candidate instabilities include tearing modes driven by the current gradient,
ballooning modes driven by the pressure gradient, and a surface kink
instability. It is difficult to know the form of the current profile at the
edge, but measurements of the pressure gradient have been made. The
indications are that the pressure gradient is of the order of that required
for ballooning modes but is somewhat below the critical level. The

7.18 Operational overview
411
observed mode numbers, with m typically around 10, are consistent with
a ballooning mode interpretation, but the relaxation oscillation form of
the instability is not understood.
Operational overview
Chapter 6 and the present chapter give an introduction to mhd stability
theory and an account of the observed behaviour of the instabilities.
These instabilities limit the operating regime of the tokamak. The
precise form of the limitation depends upon the details of operational
procedures and the resulting profiles, but there is a general pattern to the
behaviour which can be described in an approximate way.
The simplest procedure is to use the framework provided by the
stability diagram of Fig. 6.10.4 to map the current profile parameter
V of that diagram on to the internal inductance £.[. Stability can then
be discussed in terms of an iii,qedge) diagram. The variable qa has
been replaced by ^gdge to encompass the case of divertor plasmas. Thus,
whereas for a large aspect-ratio circular plasma ^gdge = Qa, for a plasma
with a bounding separatrix ^gdge will be taken to be ^95, the value of q
on the flux surface containing 95% of the poloidal flux.
The resulting diagram is shown in Fig. 7.18.1. The first constraint is
that due to m = 2 instability which generally presents a h^d disruptive
boundary at ^gdgg ~ 2. As ^edge approaches 2 from above the resonant
surface, q = 2, approaches the plasma boundary from inside the plasma
and the m = 2 tearing mode is transformedmto am = 2 kink. The region
unstable to tearing modes is not shown in the diagram. Their stability is
Fig. 7.18.1 Illustrating the operational
boundanes imposed by mhd constraints
and the values of the mhd ^ limit within
the operating region. The figure is only
indicative, the precise values depending on
geometry and profiles.

7.18 Operational overview
dependent on the current profile and the predicted magnetic island sizes
can be quite small. The m = 2 tearing mode becomes important when
^edge -^ 2, or for a narrow current profile with higher £i, which has ^ ~ 2
at the edge of the effective current channel.
The central value of q is usually limited by sawteeth. Simple theory
would put the boundary at ^o = 1 but, as described in Section 7.6, the
boundary is probably better placed at qo = 0.7. This limits the value of
ii and, as shown in Fig 7.18.1, is most stringent at low q.
The surface kinks present a less precise boundary and for this reason
the corresponding line in the diagram is shown dashed. Both the stability
and the consequences of these modes depend upon the edge current profile
which itself depends on a variety of factors. In particular a fast current
rise produces a high edge current density gradient as a result of the skin
current effect.
Having indicated the general position of the stability boundanes it is
now possible to determine the fi limitation Taking the form of the y6 limit
given by relation 6.16.6, that is
^c(%) = 4£i— /in MA,
and using the approximate empirical relation
the critical y6 for R/a = 3 and b/a = | is
q95
The resulting lines of constant y6c are plotted in Fig. 7.18.1.
The diagram is only indicative and the use of specially chosen profiles
together with contributions from the second region of stability can allow
substantially higher values y6 to be obtained.
5a^B / b^\ / 2 /q\2\
Bibliography
Although the instabilities described in this chapter have and a more extensive theoretical treatment by
been subject to intensive experimental study, the under- White, R.B. Resistive instabilities and field line reconnec-
standing of the phenomena involved is incomplete and tion, in Section 3.5 of Handbook of plasma physics
uncertain. As a result there is a shortage of review art- (eds Galeev, A A and Sudan, R.N.) Vol. 1 North Holland,
icles There is a companson of theory and experiment in Amsterdam A983).
Chapter 11 of A general account of nonhnear effects is given in
Bateman, G. MHD instabilities. MIT Press, Cambridge, Biskamp,D. Nonlinear magnetohydrodynamics, Cambridge
Mass. A978); University Press A993).

Bibliography
413
Tearing modes
The nonlinear growth of teanng modes was first described by
Rutherford, P.H Nonlinear growth of the tearing mode
Physics of Fluids 16, 1903 A973).
A more detailed treatment of the quasi-linear theory is
given by
White, R.B., Monticello, D.A., Rosenbluth, M.N., and
Waddell, B.V. Saturation of the tearing mode. Physics of
Fluids 20, &00 A977).
Two-dimensional calculations of saturated island widths are
described in
Sykes, A. and Wesson, J.A. Saturated kinks and tearing
instabilities in tokamaks. Plasma physics and controlled
nuclear fusion research (Proc. 8th International
Conference, Brussels 1980) Vol. 1, 237. I.A.E.A Vienna
A981).
The internally driven mode is discussed in the context of
disruptions in
Rebut, PH. and Hugon, M. Thermal instability and
disruptions in a tokamak Plasma physics and
controlled nuclear fusion research (Proc. 10th Int
Conf., London, 1984) Vol. 2, 197 I A.E A. Vienna
A985).
and the neoclassica teanng mode is analysed in
Carrera, R., Hazeltine, R D , and Kotschenreuter, M Island
bootstrap current modification of the nonlinear
dynamics of the teanng mode Physics of Fluids 29, 899
A986).
The neoclassical teanng mode was first reported by Chang, Z
et al Observation of nonlinear neoclassical pressure-
gradient-driven tearing modes on TFTR Physical Review
Letters 74, 4663 A995)
The small island stabilization effects are discussed in
Fitzpatnck, R Helical temperature perturbations
associated with tearing modes in tokamak plasmas Physics of
Plasmas 2, 825A995)
Wilson, HR, Connor, J.W, Hastie, R.J., and Hegna, C.C
Threshold for neoclassical magnetic islands in a low
collision frequency tokamak. Physics of Plasmas 3, 248
A996)
and
Poli, E et al Reduction of the ion drive and pg scaling of
the neoclassical tearing mode Physical Review Letters 88,
B002)
Mirnov instabilities
Mimov, S V. and Semenov, LB. Investigation of the
instabilities of the plasma string in the Tokamak-3
system by means of a correlation method Atomnaya
Energiya 30, 20 A971) [Soviet Atomic Energy 30,
22A971)]
Current penetration
The idea of double tearing modes leading to current
penetration was described by
Stix, TH Current penetration and plasma disruption.
Physical Review Letters 36, 521 A976).
Numerical simulations of the nonlinear development of
double tearing modes were carried out by
Carreras, B , Hicks, H.R., and Waddell, B.V. Teanng
mode activity for hollow current profiles. Oak Ridge
National Laboratory Report ORNL/TM6570, Oak Ridge,
Tennes-seeA978).
Experimental observations on the instabilities are described
Granetz, R.S., Hutchinson, I.H., and Overskei, D.O.
Disruptive mhd activity during plasma current rise in Alcator
A tokamak. Nuclear Fusion 19, 1587 A979).
Sawtooth oscillations
Experimental observations on the sawtooth behaviour of the
soft X-ray emission were described by
von Goeler, S , Stodiek, W, and Sauthoff, N. Studies of
internal disruptions and m — 1 oscillations in tokamak
discharges with soft X-ray techniques Physical Review
Letters 33, 1201 A974)
The fast reconnection model was proposed in
Kadomtsev, B.B Disruptive instability in tokamaks Fizika
Plasmy 1, 710 A975) [Soviet Journal of Plasma Physics
1, 389 A976)]
Numerical calculations on the reconnection were carried
out by
Danilov, A.F, Dnestrovsky, Yu N , Kostomarov, D P, and
Popov, A M. Fizika Plasmay2,187 A976) [Soviet Journal
of Plasma Physics 2, 93 A976)]
and calculations demonstrating the relaxation oscillation
behaviour by
Sykes, A and Wesson, J.A Relaxation instabihty in
tokamaks Physical Review Letters 31, 140A976).
A role for turbulence was suggested in
Dubois, M. and Samain, A. Evolution of magnetic islands in
tokamaks Nuclear Fusion 20, 1101 A980).
Early doubts about the full reconnection model were
expressed in
Dubois, M A., Marty, D A , and Pochelon, A. Method of
cartography oiq = \ islands dunng sawtooth activity in
tokamaks Nuclear Fusion20, 1355 A980).
Further doubts were reported by
Edwards, A W. et al. Rapid collapse of a plasma sawtooth
oscillation in the JET tokamak. Physical Review Letters
57,210A986)
The quasi-interchange model was introduced in
Wesson, J A Sawtooth oscillations Plasma Physics and
Controlled Fusion Research 28 (lA), 243 A986).

414
Bibliography
The key aspects of the attempts to understand sawtooth
oscillations are reviewed in
Hastie, R.J. Sawtooth instability in tokamak plasmas.
Astrophysics and Space Science 256, 177 A998).
CoUisionless reconnection was proposed in
Wesson, J.A. Sawtooth reconnection. Plasma physics
and controlled fusion research (Proc. 13th Int. Conf.,
Washington, 1990) Vol. 2, 79.1.A.E.A. Vienna A991).
and the importance of coUisionless electron viscosity was
pointed out by
Yu, Q. A new theoretical model for fast sawtooth collapse
and confirming its interchange structure. Nuclear Fusion 35,
1012A995).
The sawtooth 'trigger' problem was described by
Wesson, J.A., Edwards, A.W., and Granetz, R.S.
Spontaneous m = 1 instability in the JET sawtooth collapse.
Nuclear Fusion 31, 111 A991).
The possible role of stochasticity was discussed by
^ichtenberg, A.J. Stochasticity as the mechanism for the
disruptive phase of the m = 1 tokamak oscillations. Nuclear
Fusion 24, 1277 A9&4).
The literature on the sawtooth instability is now very
extensive. A review of m = 1 stability theory with some
discussion of nonlinear effects is given in
Migliuolo, S. Theory of ideal and resistive m = 1 modes in
tokamaks. Nuclear Fusion 33, 1721 A993).
Many numerical simulations have been carried out.
Toroidal calculations are described in
Aydemir, A.Y., Wiley, J.C, and Ross, D.W. Toroidal studies
of sawtooth oscillations in tokamaks. Physics of Fluids
81,774A989).
Disruptions
The phenomenon of disruptions was observed by
Gorbunov, E.R and Razumova, K.A. Effect of a strong
magnetic field on the magnetohydrodynamic stability of
a plasma and the confinement of charged particles in the
'Tokamak' muchine. Atomnaya Energaya 15, 363 A963).
[Journal of Nuclear Energy, Part C, 6, 515 A964)].
A substantial experimental investigation is described by
Sauthoff, N.R., von Goeler, S., and Stodiek, W. A study of
disruptive instabilities in the PL.T tokamak using X-ray
techniques. A^udear Fuj'fon 18, 1445 A978).
The Murakami parameter n^/S^ was introduced in
Murakami, M., Callen, J.D., and Berry, L.A. Some
observations on maximum densities in tokamak experiments.
Nuclear Fusion 16, 347 A976).
and the Hugill diagram was introduced in
Fielding, S.J, Hugill, J., McCracken, G.M., Paul, J.W.M.,
Prentice, P., and Stott, PE. High-density discharges with
gettered torus walls in DITE. Nuclear Fusion 17, 1382
A977).
The Greenwald formulation of the density limit was
introduced in
Greenwald, M. et al. A new look at density limits. Nuclear
Fusion 28, 2199 A988).
and a comprehensive review of density limits was given by
Greenwald, M. Density limits in toroidal plasmas. Plasma
Physics and Controlled Fusion 44, R27 B002).
Numerical simulations of the interaction of tearing modes
leading to the fast phase of the disruption were carried out
at the Oak Ridge National Laboratory and are described in
several papers including
Carreras, B., Hicks, H.R., Holmes, J.A., and Waddell, B.V
Nonlinear coupling of tearing modes with self-consistent
resistivity evolution in tokamaks. Physics of Fluids 23,
1811 A980).
A model of the precursor phase was developed at the
Culham Laboratory and is summarized in
Wesson, J.A., Sykes, A., and Turner, M.R. Tokamak
disruptions. Plasma Physics and Controlled Fusion Research
(Proc. 10th Int. Conf., London, 1984) Vol. 2, 23.1.A.E.A.
Vienna A985).
The role of radiation in the precipitation of disruptions is
discussed by
Rebut, PH. and Green, B.J. Effect of impurity radiation
on tokamak equilibrium. Plasma Physics and Controlled
Nuclear Fusion Research (Proc. 6th Int. Conf., Berchtes-
gaden 1976) Vol. 2, 3.1.A.E.A. Vienna A977).
Ohyabu, N. Density limit in tokamaks. Nuclear Fusion 9,
1491 A979); and
Ashby, D.E.T.F. and Hughes, M.H. The thermal stability and
equilibrium of peripheral plasmas. Nuclear Fusion 81,911
A981).
The role of impurity influx in fast disruptions was first
recognized by
Ward, D.J., and Wesson, J.A. Impurity influx model of fast
tokamak disruptions. Nuclear Fusion 32, 1117 A992).
and evidence for a low temperature and large density
increase produced by an impurity influx is described in
JET Team, Sawtooth Oscillations and Disruptions in JET
Proc. 14th Int. Conf. on Plasma Physics and Controlled
Nuclear Fusion Research, Wurzburg 1992, vol 1, p. 437.
A paper giving results of internal measurements during a
disruption is
Hutchinson, I.H. Magnetic probe investigation of the
disruptive instability in LT-3. Physical Review Letters 37, 338
A976).
An account of various experimental aspects of disruptions is
given in
Wesson, J.A. et al. Disruptions in JET Nuclear Fusion 29,
641 A989).
and a numencal simulation is descnbed in
Bondeson, A., Parker, R.D., Hugon, M, and Smeulders, P.
Nuclear Fusion 31, 1695 A991).

Bibliography
415
Mode locking
The basic physics is outlined in
Nave, M.F.F. and Wesson, J A. Mode locking in tokamaks.
Nuclear Fusion 30, 2575 A990)
Error field instability
Instabilities associated with error fields were desciibed in
Scoville, J.T. et al Locked modes in DIIID and a method for
prevention of the low density mode Nuclear Fusion 31,
875A991).
An introductory account of the theory was given by
Lee, J.K et al. Magnetic islands driven by external sources
Nuclear Fusion 23, 63 A983).
and a more complete analysis is given in
Fitzpatrick, R. Interaction of teanng modes with external
structures in cylindrical geometry. Nuclear Fusion 33,
1049 A993).
Vertical instability
The first observations of the serious consequences of the
vertical instability were reported in
Noll, R et al. Stabilization of vertical position and control
of plasma shape in JET. Froc. 11th Symposium on Fusion
Engineering, Texas, 1985 Vol. I p.33.
A more detailed account of the behaviour is given by
Lao, L L. and Jensen, TH. Magnetohydrodynamic
equilibria of attached plasmas after loss of vertical stability in
elongated plasmas. Nuclear Fusion 31, 1909 A991).
Toroidal Alfven eigenmodes
The TAE spectrum was described by
Cheng, C.Z., Chen, Liu and Chance, M.S. High-n ideal
and resistive shear Alfven waves in tokamaks Annals of
Physics 161, 21 A985)
The possibility of a-particle driven instability was
discovered by
Fu, G.Y. and Van Dam, J.W. Excitation of the toroidicity-
induced shear Alfven eigenmode by fusion alpha particles
in an ignited tokamak Physics of Fluids B 1, 1949 A989).
MARFEs
The observation of a cold, dense region on the inboard side
of the plasma was the first reported by
Baker, D R., Snider, R.T., and Nagami, M. Observation of
cold, high density plasma near the Doublet III limiter
Nuclear Fusion 22, 807 A982).
Further observations and analysis, and the designation
MARFE, appeared in
Lipschultz, B., Marmar, E S., Pickerell, M.M., Terry, J L.,
Watterson, R., and Wolfe, S.M. Nuclear Fusion 24, 977
A984).
In this paper the name MARFE is said to be an abbreviation
of 'Multifaceted Asymmetric Radiation From the Edge'.
However, it may not be a coincidence that it is also formed
by the first three letters of one author's name and the last
two letters of another's.
The first theoretical treatments of the phenomenon were
Stringer, T.E. A theory of MARFEs Proc *l2th European
Conference on Controlled Fusion and Plasma Physics I,
86 (Budapest 1985).
Ergodicity
An introduction is given in the article
White, R.B. Resistive instabilities and field line
tion. Handbook of plasma physics (eds Galeev, A.A.
and Sudan, R.N.) Vol. 1, Section 3.5 North Holland,
Amsterdam A983).
Fishbone instability
The expenmental observation of the fishbone instability was
described in
McGuire K. et al. Study of high-^S magnetohydrodynamic
modes and fast ion losses in PDX. Physical Review Letters
50, 891 A983);
and the proposed theoretical interpretation was given by
Chen, L., White, R.B., and Rosenbluth, M.N. Excitation
of internal kink modes by tiapped energetic beam ions.
Physical Review Letters 52, 1122 A984).
Neuhauser, J. Schneider, W., and Wunderlich, R. Thermal
instabilities and poloidal asymmetnc in the tokamak edge
plasma. Nuclear Fusion 26, 1679 A986).
ELMs
The ELM instability was mentioned in
Wagner, F et al. Regime of improved confinement and
high beta in neutral beam heated divertor discharges of
the ASDEX tokamak. Physical Review Letters 49, 1408
A982),
and was designated an 'ELM' in
Keilhacker, M et al. Confinement studies in L and H-type
ASDEX discharges. Plasma Physics and Controlled
Fusion(Pioc. 11th European Conf Aachen, 1983) Vol. 26,
lA, p.49A984).
A more complete account is to be found in the review
ASDEX Team, The H-mode of ASDEX. Nuclear Fusion 29,
1959A989).

Microinstabilities

8.1 Microinstabilities
Microinstabilities
Instabilities predicted by the single fluid mhd model are described in
Chapters 6 and 7. However, calculations which include finite Larmor
radius and kinetic dissipation effects indicate that additional instabilities
should occur in a tokamak. There is a class of such instabilities which
have a wavelength comparable to the ion Larmor radius and these are
termed microinstabilities.
Microinstabilities provide a mechanism for the generation of fine scale
plasma turbulence and may therefore be important for an understanding
of anomalous transport in tokamaks. While a full calculation of the
turbulence saturation level must involve nonlinear effects, the linear mode
characteristics are useful for identifying possible drives and conditions
for this turbulence. Furthermore, when the resulting particle and heat
transport is high, the plasma density and temperature profiles may adjust
to be close to the threshold predicted by linear theory. Linear mode
characteristics, such as time and length scales, may also be relevant for
characterizing the turbulent state, to provide estimates for the plasma
transport as described in Section 4.18. The linear properties of a variety
of microinstabilities are introduced in the following sections, but first it
is worthwhile describing some more general properties of this class of
instability.
Because of their disparate masses, electrons and ions respond
differently to electromagnetic field perturbations and they therefore play
different roles in the evolution of the microinstability. Typically, one
species will provide the drive, while the other provides the damping.
Dissipation often plays a crucial role in causing instabilities; this can
be either collisional as in a low temperature plasma, or due to a Landau
resonance when the collision frequency is low. The resulting instabilities
are classed as dissipative. However, some microinstabilities are reactive
and do not require dissipation. The ion temperature gradient mode, which
is described in Section 8.3, is an example of this type.
The properties of microinstabilities are often dependent upon the
geometry of the confining magnetic field. However, for a tokamak the
stability analysis is usually complicated and it is often helpful to use
simple models for the geometry in order to identify the important physical
mechanisms. The level of simplification depends on the importance of
the various particle drifts and trapped particle effects. If magnetic
curvature drifts are expected to be important for the instability mechanism, the
toroidal geometry must be taken into account. The simplest geometry is
then that of the large aspect ratio, circular cross-section, low y6, tokamak
equilibrium described in Section 3.6. The major and minor radii are then
denoted by R and r respectively, while 6 and 0 denote the poloidal and

3.1 Microinstabilities
419
toroidal angles. Perturbations can be Fourier analysed in the poloidal
and toroidal angles, with mode numbers m and n. In toroidal geometry
the equilibrium is independent of 0, and n is a precise quantum number.
However, the curvature drifts couple the poloidal harmonics so that
instabilities for which curvature drifts are important typically involve several
poloidal harmonics.
When curvature drifts are not important, the qualitative aspects of the
instability can be studied without the effects of toroidal geometry. In such
cases it is convenient to analyse the instability using a 'slab' model of
the magnetic geometry. This results from considering an annulus which
is centred on the rational surface of interest as shown in Fig. 8.1.1a. This
is then cut and opened to form the slab of plasma shown in Fig. 8.1.1b. It
is conventional to define a new orthogonal coordinate system x, y, and z,
where x = r — r^ is the coordinate measuring the radial distance from
the rational surface r = r^, at which the safety factor q = m/n, z is in the
direction of the magnetic field at the rational surface (approximately the
toroidal direction) and y is in the direction perpendicular to both of these
(approximately the poloidal direction). Note that neither the poloidal
nor the toroidal Fourier harmonics are coupled in a plasma slab so a
perturbation, /, can be expressed in the form / = f(x) exp[ikyy +
z=2jcRg ik^z], where kyy and k^z represent mO and —rKp respectively. The parallel
wavenumber is given by ife|| = il/B)B ■ V. In toroidal geometry
m — nq
Fig. 8.1.1 Annulus of tokamak plasma
(a) cut and opened to form a 'sheared slab'
plasma (b).
and the slab equivalent is
/C|| =
where ky = m/r is the poioidal mode number, and Ls = Rq/s is the
shear length, with s — {r/q)dq/dr the magnetic shear.
The class of microinstabilities can be divided into those which are
predominantly electrostatic and those for which electromagnetic
perturbations are important. They can be further categorized according
to the basic plasma wave from which they develop. Examples to be
described later are given in Table 8.1.1. Electrostatic modes are described
in Sections 8.3 and 8.4, and the electromagnetic instabilities are covered
in Section 8.5.
Table 8.1.1 Plasma waves and their associated instabilities
Electron drift wave Alfven wave Sound wave
'Universal',
Trapped electron
Microtearing
Ion temperature
gradient

8.2 Electron drift wave
Electron drift wave
Fig. 8.2.1 Movement of the c(
density surface due to the £ x J? motion in
an electron drift wave, represented by the
full curve at an initial time and the dashed
curve at a later time.
Drift instabilities are a particularly important class of microinstabili-
ties which have often been invoked as the source of plasma turbulence
responsible for anomalous transport in tokamaks. These modes, discussed
in Sections 8.3 and 8.4, are essentially electrostatic in nature and result
from tapping the free energy of the density and temperature gradients of
the plasma.
Drift instabilities develop from a basic wave of the plasma, called the
electron drift wave. The electron drift mode, described in the next section,
is a particularly important example. This drift wave can be illustrated by
considering a slab of plasma in a shearless, uniform magnetic field. The
geometry is shown in Fig. 8.2.1 which illustrates the plasma slab with the
magnetic field in the z direction and an equilibrium density gradient along
the X direction. A wave having the form exp i(—(wf + ky-y) has surfaces of
constant density as shown in the figure. Thus regions of increased density
He in the planes of constant x. In Fig. 8.2.1 these are labelled by n > 0,
while the regions of low density are labelled by n < 0.
Because of their low inertia, electrons flow rapidly along the field
lines, generating an electric field parallel to the magnetic field in order to
establish force balance along the magnetic field given by
ei5|l+V||pe =
8.2.1
where p^ is the electron pressure, E is the electric field and || denotes the
component in the direction of the magnetic field. Linearizing eqn 8.2.1
leads to a relation between the perturbed electron density h^, and
electrostatic potential (p
e(p
111
where n^ and Tg are the equilibrium density and temperature
respectively. The electrostatic potential implies a perturbed electric field in the
y direction, directed from the regions of increased density to those of
decreased density as indicated in Fig. 8.2.1. The associated E x B drift
enhances the density in the less dense regions and reduces it in the more
dense regions, causing the density and potential perturbations to oscillate
in time. The resulting wave, which propagates in the y direction, is the
drift wave.
The diamagnctic drift Ddj = B x Vpj/iijB^ does not give rise to a
perturbed density. This can be seen from the continuity equation
~d7
8.2.3

8.2 Electron drift wave 421
where dj is the ion velocity. Substituting for njDdi it is seen that the
diamagnetic flow has zero divergence and does not therefore contribute
to dn-i/dt.
The wave frequency is obtained using the quasi-neutrality condition
He = hi with hi being determined from eqn 8.2.3. For waves such that
(j}/k\\ » UTi, so that the parallel ion motion is negligible, the continuity
eqn 8.2.3 for the ions becomes
i = WEx —,
dx
where uex = — (l/B)9^/9}' is the x component of the perturbed E x B
drift. Now, choosing the equilibrium frame in which E^ = 0 and equating
the values ofhe and hi given by eqns 8.2.2 and 8.2.4, leads to the frequency
where co^ is the electron diamagnetic frequency
_ kyTedn
eBn dr'
No damping or growth of the mode is predicted by this simple model.
However, the introduction of electron dissipation either through collisions
or Landau damping will destabilize the drift wave in the shearless slab
geometry. The resulting microinstability is called the electron drift mode.
Because it was originally thought to be unstable in all relevant tokamak
conditions it is sometimes referred to as the universal instability. Actually
the magnetic geometry has a significant influence on the electron drift
mode stability. Introducing a sheared magnetic field stabilizes the mode
in slab geometry through so-calledi/zearJampmg, and the term 'universal
instability' is therefore a misnomer. However, in toroidal geometry shear
damping is suppressed and additional drives exist due to the presence of
trapped electrons. Instability occurs when these additional drives exceed
the residual shear damping as is discussed in Section 8.3.
The two classes of particles in a tokamak, trapped and passing, behave
differently in the electrostatic potential perturbation. Consequently,
different dispersion relations are obtained, depending on whether it is the
passing or trapped particle dynamics which is important. In particular,
when the mode frequency u), exceeds the particle bounce frequency, oibj,
for a particular species j, trapping can be neglected for that species. This
leads to a natural categorization into passing and trapped particle
instabilities, and examples of these will be considered in turn in the following
two sections.

8.3 Passing particle instabilities
8.3 Passing particle instabilities
Two of the most important drift instabilities that result from the passing
particle dynamics are the electron drift mode, and the rji or ion temperature
gradient (ITG) mode. Their dispersion relation is derived in this section
using the gyro-kinetic equation described in Section 2.11. A related
instability called the rj^ mode is also discussed.
The electron drift and ITG modes are described first. It is necessary
to identify certain characteristics of their mode structure, as this allows
considerable simplification in the derivation of the dispersion relation.
Trapped particle effects are neglected here and this implies modes with
CO > cobj, where cobj is the bounce frequency of the trapped particles.
The assumed ordering is
k\\VTe » <i^ » k\\VTi,
8.3.1
so the electrons move rapidly to respond to the electrostatic potential.
Following the derivation of eqn 8.2.2, this allows their response to be
written as a Boltzmann distribution
where h is the electron density perturbation and (p is the perturbation in
the electrostatic potential. The ordering of fe|| uxi above will be used later
to simplify the equation for the ion response. It is also assumed that the
drift frequency associated with the ion magnetic curvature drifts, cooi, is
much smaller than the mode frequency, so that
COdi = 2SnC0*i <?C 0
8.3.2
wherein = Ln/R,Ln = (dlnn/dr)~' is the density scale length and ft;*i
is the ion diamagnetic frequency. Equation 8.3.2 implies peaked density
profiles, though some comments will also be made on the flat density
profile limit.
The ion dynamics are particularly important for the radial mode
structure of electron drift and ITG modes and finite ion Larmor radius (FLR)
effects must be included in order to determine this. Though a description
of the essential characteristics of the ITG mode can be obtained using the
Braginskii fluid equations, care is necessary to take account of
cancellations which occur between components of the FLR stress tensor and tiie
diamagnetic drift contribution to the convective derivative, and it turns
out that less algebra is involved in the kinetic approach. Thus assuming
a leading order Maxwellian velocity distribution, /m, for the ions, tiie

8.3 Passing particle instabilities 423
perturbed ion distribution function can be written
/i = -y/m + g exp —— sinag
where g is independent of the gyro-phase angle, ag, and the subscript _L
denotes the component perpendicular to the magnetic field. Integrating
over velocity space and ensuring quasi-neutrality, 11^ = 1x1, then requires
ne(p
^(f> f°° f°°
— {l + r) = 27T / v±gJo(z)dvxdvii,
e J-00 Jo
, r ke d/M
Icoci dr
where r = T^/Ti, z = k±v±/ci)ci and the Bessel Function
/o(z) = ^^e-'^=°^^d0.
The function g is to be evaluated by solving the gyro-kinetic equation for
the ions which can be written
.^]=0, S.33
where d/ is the poloidal arc length element of a flux surface and r is
the flux surface radius. Spatial derivatives are at constant particle energy,
K and k is the wave-vector. The equilibrium drift velocity, Vd, results
from the inhomogeneity of the magnetic field in the torus and is given by
COcl L "' '^1 J
where e is a unit vector parallel to the magnetic field and the magnetic
moment /a = miv\/2B. For a large aspect ratio, low fi tokamak, with
£2 = 52^ _ 2{r/R) cos 61), the drift term in eqn 8.3.3 is
\{^^<M-<
cosO + — sin 0
where kr and ke are the radial and poloidal wave numbers. Equation 8.3.3
then simplifies to the following equation to be solved for g
^Joiz){co-col)fM, 8.3.4
where cbdi = k ■ ^d and the velocity-dependent drift frequency, co^^, is
defined by
-Hik-ih]
and r]i = n 7// Titi'is the ratio of the density scale length to the temperature
scale length, the prime denoting a radial derivative. The parameter rjj plays

8.3 Passing particle instabilities
a crucial role in the stability of one of the passing particle modes, which
is therefore often referred to as the 'rji mode'.
The 'drift wave ordering' of inequality 8.3.1 exploits the slow parallel
velocity of the ions. This allows a solution of eqn 8.3.4 to be obtained by
treating the parallel derivative term as small so that, expanding to second
order in this term.
CO-col r wii 3 "^ 92 1
g = Jo(z)fM r^ 1 -i L_ _ L^
co-codi \^ CO- codi dl {co - (Wdi) 31 j
8.3.5
Equation 8.3.5 can be further simpHfied by making use of eqn 8.3.2 and
performing a subsidiary expansion in codi/co. In this limit the velocity
integrals in the quasi-neutrality expression can be evaluated to give the
eigenvalue equation
,32 / Sn \V 9 ., V 2£„ / ^ isin^ 3 \
^) } .^ = 0.
where s is the magnetic shear, b = {kePiY and the radial variable x is
the distance from a reference mode rational surface, r = rs, defined by
m = nq{rs) where n is the toroidal mode number, io has been expanded
for small fexPi, where pi is the ion Larmor radius evaluated with the
thermal velocity, and kr has been interpreted as a radial derivative, which
then determines the radial mode structure. The parallel derivative has
become the second operator on the left hand side, and Q. is the mode
frequency normalized to the electron drift frequency, ft;*e-
Equation 8.3.6 can be used to illustrate the properties of the electron
drift and r]^ modes as follows. In order to balance the last bracketed term
with the rest (which are small, <?C 1) either ^ ~ 1 or rji > 1. For rji )>> 1
two modes can be identified depending on the strength of the toroidal
coupHng term (that involving cos^ and sin^). For very weak toroidal
coupling, a balance of the second and last terms yields a mode frequency
(J) ~ {klvj^cji^iT]^ . This solution is called the slab branch of the r]^ mode
because it does not involve toroidal coupling effects. In a shearless slab
k\\ is constant. However, for a sheared slab the effective k\\ depends on
the radial mode width which can be calculated from eqn 8.3.6. Then
kl = ibrQ/LfiLs, which gives co = (iSnSiji/qy^^co^g for the ITG mode

8.3 Passing particle instabilities 425
in a sheared slab. In a torus, a second type of iji mode structure can occur,
resulting from a balance between the toroidal coupling term and the last
term. This has a mode frequency (v~^ (rjico^icodi)^^^ and is known as the
toroidal branch of the iji mode. Finally, the ordering ^ ~ 1 gives rise to
a branch with co ~ co^^, and this is called the slab branch of the electron
drift mode. Other orderings exist which give rise to more branches (for
example a toroidal electron drift mode), but the three modes introduced
above provides a convenient illustration of the principal mode
characteristics These modes will now be described in turn, using eqn 8.3.6 to
illustrate the discussion.
Electron drift mode
It is interesting to review the history of this mode, which was first analysed
in a shearless slab geometry. In this case the mode structure is derived from
an equation which is similar to the Schrodinger equation. Maintaining
this analogy, the potential is found to form a 'well' in the radial direction
when variations in the density profile are taken into account. This leads
to a confined mode, known as the Krall-Rosenbluth mode, which is
unstable. However, on the introduction of a sheared magnetic field in
the slab, the mode structure is completely different. In this geometry it
can be deduced from eqn 8.3.6 by dropping the curvature term (so that
poloidal Fourier harmonics are not coupled) and Fourier analysing in
the poloidal direction. The resulting equation, which describes the radial
mode structure, is
where the electron drift wave ordering, ^~ 1, is assumed. For typical
tokamak values, the radial variation due to the magnetic shear
dominates that due to the density profile which has therefore been neglected.
The radial structure is still described by a Schrodinger equation with a
parabolic potential but now with a potential hill rather than a well. Such
a potential is not able to confine the mode and it was therefore originally
thought that the electron drift wave branch could not exist in the presence
of magnetic shear. However, an 'outgoing wave' solution is physically
acceptable provided there is a dissipation mechanism at large distances
from the mode rational surface which can act as a sink for this energy
and localize the mode. Such a mechanism does indeed exist. In
deriving eqn 8.3.6 a large co/kwvj, expansion was made and so ion Landau
damping was neglected. However, k\\ increases with x and at large x
ion Landau damping does became an important dissipation mechanism.
Although it does not appear explicitly in eqn 8.3.6, it conceptually
justifies selecting the 'outgoing wave' solution. This is illustrated in Fig. 8.3.1.
Because the outgoing wave is transferring energy from the mode to the
Landau resonance, it is stabilizing. For this reason, and because of the
important intermediary role of the magnetic shear, the effect is known

8.3 Passing particle Instabilities
Fig. 8.3.1 Sketch of the energy flow for
the electron drift mode showing the free
energy source driving the mode at the
rational surface, r = rj, and the outgoing
wave transfemng the energy to large
distances where it is dissipated by ion
Landau damping.
Resonant
surface
as shear damping. Initial analytic calculations indicated that for values
of shear typically found in a tokamak, this shear damping is small and
the perturbative inclusion of drive terms from the electron Landau
resonance led to the belief that the electron drift mode was unstable However,
subsequent numerical calculations showed that the perturbative treatment
inadequately described the effects of the electron Landau resonance and
the mode is in fact stable
Toroidal electron drift mode
In a torus the mode structure can be quite different from that in a slab.
However, the ideas which have been developed in the analysis of the slab
mode remain useful for discussing this mode. An important method of
analysing the structure of toroidal modes is the 'ballooning'
transformation, which gains its name from its use in the analysis of mhd ballooning
modes (Section 6.13). A simplified treatment can be derived by expanding
q> in poloidal Fourier harmonics
(p:
= E=
m(e-e^).
'Mm(y),
where the (as yet) arbitrary free parameter, ^o, will be needed to determine
the radial structure of ^. It is convenient to define the new radial
variable y = skex so that eqn 8.3.6 yields a differential-difference equation
for Mm (y):
dV
"d^
+ —^{y — m) Urn- ^Um
2^L '
4)"
"T^

8.3 Passing particle instabilities 427
where a = 2sn/bs^r,a = Sn/bxqs and A. is the eigenvalue, related to
the complex mode frequency by
1 / ^-1 \
Note that a results from the toroidal geometry and this provides the
coupling of the Fourier harmonics, Um- For high toroidal mode
number (f) is radially localized and equilibrium variations other than shear
can be neglected. A solution then exists which is of the form Um{y) —
uo(y — m). Fourier transforming
1
the eigenmode equation becomes
8.3.7
At this level, Oq is an arbitrary free parameter, frequently referred to as the
'ballooning angle'. The mode frequency depends on Oq, and a full
determination of this frequency requires a higher order calculation in which
the finite radial width of the mode and radial variatiom in co^ are taken
into account. A self-consistent ordering is possible if the mode is
localized at a radial position where the electron diamagnetic frequency ft;*e is
maximum. The higher order theory then predicts that 6o must be chosen
so that the eigenvalue A. is stationary. Equation 8.3.7 can be solved for
the mode frequency, Q and contains information about the mode
structure in a torus. First, a connection can be made with the slab results
discussed above by setting a = 0. The mode structure is described by a
Schrodinger equation and for a = 0 has the same anti-well potential in
r] derived for the slab mode. Hence the same travelling wave solution is
obtained, though an outgoing wave in real x-space maps onto an
incoming wave in rj-space. Increasing a leads to a completely different mode
structure which results from the modifications to the potential due to the
curvature term. In particular, as a is increased, the srjsinr] term leads to
minima in the 'potential' which help to confine the mode. Two examples,
one for a = 0 and one for a = 3, of the 'potential' and the corresponding
eigenfunction in rj are shown in Fig. 8.3.2. For a = 0 the potential is a
hill and shear damping is strong. This is indicated by the eigenfunction,
which represents a wave whose amplitude increases toward large \r]\. For
larger a a local well forms in the potential and the eigenfunction can
be partially confined within this. However, some of the eigenfunction
'tunnels out', though its amplitude is reduced and the shear damping is

8.3 Passing particle instabilities
Fig. 8.3.2 Plots showing the 'potential'
for the electron drift mode and the
corresponding eigenfiinction as a fiinction
of the ballooning coordinate rj, for the
toroidal coupling parameter a = 0 (left)
and a = 3 (right).
then less effective. Thus the electron drift wave is generally more unstable
in a toroidal plasma than in the slab. This situation is shown in Fig. 8.3.2
for a = 3.
The rji, or ion temperature gradient, mode
The existence of two types of ITG mode structure has been illustrated
below eqn 8.3.6: a 'slab' branch, which evolves from the sound wave
with CO ~ {kjv^co^irji) ' , and a toroidal branch with co ~ (??i&;*i(i>di)'^^-
In contrast to the electron drift wave, the mode frequency is different from
co^e and in fact is complex. This results in a different mode structure for
the ITG modes than that found for the electron drift wave. The reason
for the difference is that the shear damping parameter, cr/ Q, depends on
CO so that It now becomes complex The mode structure is found to be
governed by a 'Schrbdinger' equation with a potential well, which results
in a confined mode and does not exhibit the 'outgoing wave' nature of the
electron drift mode. This suppresses the shear damping so that the ITG
modes can be readily destabilized.
The properties of the ITG mode, whose growth rate depends on the
value of r]i, have been derived above by solving the ion gyro-kinetic
equation under the assumption that the resonance associated with the magnetic

8.3 Passing particle instabilities
429
-
-
-
-
Unstable
Unstable
1
Stable
\ Stable
curvature drift is negligible. It was seen that this requires the toroidal
coupling term to be small, which in turn requires rji to be large. Equation 8.3.6
predicts that this branch is unstable for all positive iji, but when a
more complete analysis is performed, in which the curvature drift
resonance IS retained, it is found that this is not the case. In fact the mode
is stable for rji < rjic where rjic ~ 1. The specific form of rjic depends
on the branch being considered For example, by employing the bal-
loomng transformation, it is possible to derive the threshold for the
toroidal rji mode
Fig. 8.3.3 Stability diagram for the
toroidal ITG mode (from Biglan H., et,
Physics of Fluids Bl 109 A989)).
^^(l + r-^)(l + 2s/q)Sn
Sn > Snc
"- (l + r-i)(l + 2./?)-
This expression exhibits the interesting feature that when the density
profile is sufficiently flat the threshold is a critical temperature gradient
rather than a critical rji. For this reason, this instability is also referred to
as the ion temperature gradient (or ITG) mode. The full stability diagram
is illustrated in Fig. 8.3.3.
The ?7e mode
There is another passing particle instability, which is similar to the
ITG mode, but where the roles of the ions and electrons are reversed
This is the r]^, or ETG (electron temperature gradient), mode This mode
can be classified as 'electrostatic' because its existence can be
demonstrated without addressing the associated electromagnetic perturbations.
However, for typical tokamak conditions the electromagnetic
perturbations are important and can have significant implications for electron heat
transport.
The perpendicular wavelength of the rje mode lies between the electron
and ion Larmor radii Thus k±p\ ;>> 1 so that in eqn 8.3 3 Joiz) -^ 0,
resulting in g = 0 and the ion response being a Boltzmann distnbution
The electron response can be calculated from the gyro-kinetic eqn 8 3.3
with the subscripts i replaced by e Following a similar analysis to that
of the ITG mode, the eigenvalue equation is the same as eqn 8.3.6, but
with the subscripts i and e interchanged. Taking the slab limit of eqn 8.3.6
corresponds to dropping the third term (that involving cos^ and sin 6).
Neglecting finite electron Larmor radius effects and assuming Tg = Tj
then results in the following dispersion relation for ij^ modes:
kjw
H
CO*e
{l + Ve)) + l + -
= 0.
In the limit r^g Ji> 1 an unstable mode exists whose complex frequency is

8.4 Trapped particle instabilities
The above analysis of the rje mode neglected the electromagnetic
perturbations to allow a simple picture of the essential elements of the instability.
The importance of the electromagnetic perturbations can be illustrated by
considering Ampere's law
kUw
■- WJh
where A \\ is the perturbed vector potential and ]\\ is the perturbed current.
In a collisionless plasma the current is obtained from the parallel force
balance equation for the electrons
m^(i)V\\^ = e(fe||^ — &;A||) — k\\p,
where une is the electron velocity perturbation parallel to the magnetic
field and p is the pressure perturbation. The ions move slowly along the
field lines because of their high inertia so that the current is given by
j\\ = nev\\e. Substituting this expression for the current into Ampere's
law and neglecting the pressure perturbation for simplicity results in the
following relation between A\\ and ^
coA
1
kii^ l+fei(c/a;peJ'
where c/cope = (me//U.o«e^)'^^ is the coUisionless skin depth. For
perpendicular wave-lengths above the electron gyro-radius this ratio is
close to unity for typical tokamak parameters and the magnetic
perturbations must be taken into account for an accurate quantitative description
of the T]s mode. Note that the difference between the rji mode and ij^ mode
is that electrons satisfy force balance along the magnetic field lines for
the T]i mode and so there is no perturbed parallel electron flow and no
significant perturbed parallel current to drive the magnetic perturbations.
The importance of the electromagnetic perturbations may have significant
implications for the electron heat transport.
Trapped particle instabilities
Trapped and passing particles behave differently in an electrostatic plasma
wave. In particular, trapped particles effectively average out their parallel
velocity over a bounce period and therefore the parallel dynamics are less
important than for passing particles for modes with co < co^. Secondly,
in their bounce orbit they do not explore the full poloidal and toroidal
circumferences and they tiierefore exhibit some stability characteristics
which are similar to those experienced by particles confined by a
magnetic mirror. This leads to a new class of instabilities—the trapped particle

8.4 Trapped particle instabilities
431
modes. These can be separated into two classes: dissipative, where the
collision frequency plays an important role in the stability, and collision-
less, where collisions are not necessary for instability. Theory predicts
that the dissipative modes are more dangerous, and are therefore more
likely candidates for the tokamak plasma micro-turbulence. However,
the physics responsible for the collisionless mode is more transparent
and serves as a useful illustration of the different dynamics of the trapped
and passing particles. The next subsection is devoted to a description
of a collisionless trapped particle mode, and dissipative trapped particle
modes are then described in the subsequent subsection.
Collisionless trapped particle instability
The essential characteristics of the collisionless trapped particle
instability can be illustrated by considering plasma oscillations which have
a sufficiently low phase velocity, ci>/k\\ <?C wtj , that, it can be neglected
relative to the parallel velocity of both passing particle species. Thus, the
passing particle dynamics are dominated by their parallel motion and,
as for the electrons in the passing particle instabilities, they take up a
Boltzmann distribution
-n{l
where the subscript p indicates the passing particle contribution and the
fraction of trapped particles is approximated by ^Jls, s being the inverse
aspect ratio. The trapped particles have zero bounce averaged parallel
velocity and the particle drifts are more important for these than for the
passing particles. They are trapped between magnetic mirrors and
therefore spend most of their time in the bad curvature region on the outboard
side of the tokamak. This makes them susceptible to instabilities which
resemble flute-like modes as follows. Consider an initial density
perturbation which has a long parallel wavelength, as illustrated in Fig. 8.4.1.
The magnetic curvature drift is in the opposite direction for electrons and
ions and the component in the flux surface results in the charge
polarization shown in the figure. Note, that because the trapped particles spend
High density
Fig. 8.4.1 The physical mechanism for
the trapped particle instability The charge
polarisation caused by the curvature drift
of the trapped particles results in an £ x J?
flow which enhances the amplitude of an
initial density wave and results in
instability
Low density
Qb
Constant
density
'ripple'

8.4 Trapped particle instabilities
most of their time on the outboard side, the curvature drift of a particular
species has a preferred direction, whereas the passing particles
experience both the good and bad curvature regions and average this effect out.
The associated local electric fields drive small-scale E x B flows which
enhance the initial perturbation and lead to instability. The passing
particles provide a background 'sea' which does not respond in this way
and tends to reduce the instability growth so it is important to retain their
contribution. Thus, to describe the instability it is essential to retain the
physics of both the magnetic curvature and E x B drifts as well as the
dominant passing particle dynamics.
For this collisionless trapped particle mode finite Larmor radius effects
are not important and tiie trapped particle response to the electrostatic
perturbation is described by die drift kinetic equation. The bounce-
averaged parallel dynamics are neglected to obtain tiie trapped particle
response
ntj = -Vl^n^^ + V2F /" gij d\
{co - o)dj) gij = (co- co^j) fuj—'
where the subscript t indicates tiie trapped particle contribution and tiie
bar over a quantity indicates a bounce average. The non-Boltzmann part
of tiie distribution function, gij, the magnetic drift frequency mj and
velocity dependent diamagnetic frequency cojj are defined in Section 8.3.
Assuming quasi-neutrality and averaging any remaining quantities over
the trapped particle bounce orbits results in the dispersion relation:
V2£ V ^i ^e y TiCO-COdi T^CO-COds'
This equation can easily be solved for co, but a particularly simple
illustrative expression for the complex mode frequency, co is obtained by taking
Te = Ti and co^j > codj, which is relevant in the large aspect ratio limit,
to obtain
CO^ = cbdeime + Viscose).
For a density which decreases with minor radius co^e > 0 while cbde < 0,
and instability tiien occurs for y/2sR/L„ > 1. The crucial role of the
perturbed E x B and magnetic curvature drifts is apparent through tiie
dependence of the growth rate on &;*£ and cbde-
Dissipative trapped particle instabilities
The condition for collisions to be important is that the effective collision
frequency be of the same order as the relevant drift frequency. In this
regime collisions provide a mechanism whereby trapped particles can

8.4 Trapped particle instabilities 433
be scattered into passing and vice versa. This leads to collisional, or
dissipative, trapped particle modes and two examples of such modes
will be described below. For the trapped ion mode, both the trapped
electrons and ions play a role in the instability which is a dissipative
version of the collisionless mode described in the previous subsection.
The ion collisions are found to be stabilizing, while the electrons are
destabilizing. In the second example, the trapped ions do not play a
role and stability is determined by the trapped electron dynamics. This
mode is classified as a dissipative trapped electron mode. In both cases,
although collisions are important, they must not be so frequent as to
prevent the trapped particles completing a banana orbit. This requires
that the collision frequency satisfies, Vj < scobj for the species being
considered, where cobj is the bounce frequency.
Trapped ion mode
This instability evolves from the collisionless trapped particle mode. It
occurs when the effective collision frequency of the trapped particles
exceeds the magnetic drift frequency, codj ■ The collision frequency then
replaces codj in eqn 8.4.1. In equihbrium the particle species adopt a
Maxwellian velocity distribution and the fraction of trapped particles is
then ~V2£. Furthermore, an electrostatic perturbation will cause the
distribution function to deviate from a Maxwellian, while collisions tend
to restore it. Thus, a simple model which retains the essential physics of
the collisions can be incorporated by a term in the continuity equation for
the trapped particles, as follows
dnn (B X Vcp) Vf r—
-^ + ^—^ ■ Vnty = 'Mmj - VTen),
where the second term on the left represents convection due to the E x B
drift. The effective trapped particle collision frequency is vj/s which acts
to maintain the trapped particle density fraction at ^^Jlen. Note that the
magnetic drift frequency is not retained for the modes considered since
this is dominated by the effective collision frequency, Vjjs > codj, that is
where v*y = Vj/scobj is the species colHsionality. LineariziBg eqn 8.4.2
and neglecting the equilibrium electric field, the non-Boltzmann part of
the trapped particle density perturbation is given by
n \(v + ivj/sj Tj

8.4 Trapped particle instabilities
The passing particle response is again described by a Boltzmann
distribution for both species and then quasi-neutrality results in the
dispersion relation
/2^Ue^ri,
4(
co-co,,\ 1 /
CO + iVi/sJ ' Te V
CO — CO^s
co + iv,/s
This can have an unstable root, whose characteristics are easily illustrated
by considering the limit Ve/s > co and treating the last term on the right
as a perturbation. The relevant root is then
' 1+T^
A + TJ Ve
The competing nature of the two species collision frequencies is clear, the
electrons being destabilizing while the ions are stabilizing. For the high
electron collision frequency assumed here, the ions 'win' and the mode is
stable. However, the imaginary part of co is maximized for Vg ^ s^^^co^^
in which case it is positive and the mode is unstable. This is illustrated for
a typical set of parameters in Fig. 8.4.2 where the growth rate is plotted
as a function of the electron collision frequency.
Dissipative trapped electron mode
Another type of dissipative trapped particle mode is related to the electron
drift mode described in the previous section. Trapped ions do not play an
essential role in this mode, which is driven by the combined effects of
the trapped electron collisions and an electron temperature gradient. The
perturbed E x B drift is the only drift retained in this simple model. The
main contribution to the instability drive results from the low energy
trapped electrons and it is essential to retain the velocity dependence
of the electron collision frequency. In the simplest model the trapped
particle effective collision frequency has the form Vgff = v^Vj^/sv^ and
the non-Boltzmann part of the trapped electron distribution function, gte
Fig. 8.4.2 Vanation of growth rate with
electron coUisionality, v,e, for the trapped
ion mode where Vi = (me/2m,)'/^ye is
assumed and the other parameters are
'-&
0.1
0
-0.1
-0.2
Pv
0.2
-
^^4
0.6
0.8 1.0

8.5 Micro-tearing modes 435
can be calculated from the drift equation
(CO + iVeff)gte = ^S^yfuico - C^l^).
The parallel motion of the trapped electrons has dropped out on bounce
averaging, whereas this parallel motion dominates the passing electron
dynamics which therefore adopt a Boltzmann distribution. In keeping
with the drift wave ordering introduced in eqn 8.3.1, the ion parallel
velocity is neglected and, using the ion continuity equation, the following
expression for the ion density perturbation is obtained
Quasi-neutrality then yields the dispersion relation
— = 1 - V2g f ^~^*^ /Md^i;, 8.4.3
c^*t J c^ + w^ff
where the integral term of eqn 8.4.3 is assumed to be <§c 1. Thus the mode
frequency is close iou) = co^s^ and in the limit Vgff ^ <^*e the growth rate
is given by
J Veff
The key role of the velocity dependence of the collision frequency is now
apparent, since without it there is no growth. However, with the collision
frequency model assumed here, instability is found with a growth rate
The main drive for this instability comes from the electron temperature
gradient although for r]^ ^ s the magnetic curvature becomes important
and results in a slower instability.
Micro-tearing modes
The micro-tearing mode differs from the modes described in Sections 8.3
and 8.4 in that magnetic perturbations are important and can result in
small scale magnetic islands. In this respect these modes are similar to
the gross tearing mode which has been described in Section 6.8.
However the modes considered here have short wavelength with high poloidal
mode number, m. In this case the tearing parameter. A' ~ —2m/r and

8.5 Micro-tearing modes
/
/A\\=-rA\\
A
\ /In
is therefore negative. Thus the standard tearing mode theory, which is
based on resistive mhd, predicts stability. Two effects can compete with
A' and result in growth of a magnetic perturbation to a saturated island.
First, the nonlinear effects of the island structure can modify the plasma
equilibrium and particle drifts and so produce drive mechanisms which
are absent in the linear theory. The saturated magnetic island width results
from the balance between the dominant nonlinear drive and the
stabilizing A'. These nonlinear islands are discussed later. In the second case,
kinetic effects can lead to micro-tearing instability driven by an electron
temperature gradient in a sufficiently collisional plasma. These modes
are described by linear theory and will be addressed first.
Electrons and ions respond differently to a magnetic perturbation,
largely as a result of their differing masses. The different charge flows
lead to a current perturbation which must satisfy Ampere's law
r^ii
Fig. 8.5.1 Charge accumulation in
response to a time-dependent perturbation
in the parallel component of the vector
potential, Ay.
-m;ii,
8.5.1
where x represents the radial distance from the rational surface and A\\
and i\\ are the components of the perturbed magnetic potential and current
density parallel to the equilibrium magnetic field. Equation 8.5.1 is an
approximation in which the dominant variation is assumed to be in the
X direction. In fact, the current is highly localized around the rational
surface. To illustrate this, it is convenient to introduce a helical magnetic
perturbation of tiie form
■-'^err
8.5.2
where ^ = m{6 — (p/qs) witii qs = m/n the safety factor at the rational
surface, 0 and 0 are the poloidal and toroidal angles and y is the growtii
rate. In this approximation Ap is related to the radial magnetic field
perturbation by Br = (im/r)A||. The time varying magnetic perturbation
leads to an electric field, ^n = —yA\\ which accelerates tiie electrons
along the magnetic field. The ions are much heavier and are not affected
by this electromagnetic contribution to tiie electric field. Thus charge
accumulations arise and result in a perturbed electrostatic potential, (p, as
illustrated in Fig. 8.5.1. The resulting electrostatic electric field opposes
tiie electromagnetic contribution and tiie net electric field is
In the region of phase space defined by v\\ > co/kn the electron speed
parallel to the magnetic field is fast relative to the phase velocity of the
wave and the electrons effectively 'short out' the electromagnetic
contribution to £11 so that kii(p ~ iyA\\ and no current results. Thus the
current only flows where co/k\\vi\ > 1. Because fe|| = (m/r)x/Ls, this
corresponds to a narrow layer around the rational surface for thermal
velocities.

8.5 Micro-tearing modes 437
Equation 8.5.1, can be integrated across the current layer to give
~^\ -^\ =-f^oj]\d, 8.5.3
ax l^^i ax \^^_i
where the integration limit. / is much larger than the current sheet width
d, but small compared with the equilibrium scale lengths. The left hand
side of eqn 8.5.3 is the jump in the radial derivative of A\\ across the
current layer, which must be matched to the jump in the outer solutions
as represented by
^11
dx \ ''' dx
where rf" is the limit as the minor radius tends to the rational surface, r =
rs from r > r^ and r < r^ respectively. The required Aj?"' are solutions
of the ideal mhd equations outside the current layer. Equations 8.5.3
and 8.5.4 are matched to give the dispersion relation
A'A|| = —^.QJ\\d. 8.5.5
For the high m perturbations considered here A?"' ~ r'" for r < r^ and
~r~'" for r > Ts and so A' = —2m/r. In general the external solutions
are determined as described in Section 6.8 for the global tearing mode.
In the layer region, kinetic effects must be included to calculate
the current, j\\, and the layer width, d. The growth rate is derived
from the matching condition 8.5.5 as described shortly for a simple
analytic model. The results of accurate numerical calculations of the
linear micro-tearing growth rate are shown in Fig. 8.5.2. It is seen that
the micro-tearing mode is stable at both low and high collision
frequencies, but a window exists for intermediate collision frequencies in
which the mode is unstable in the presence of an electron temperature
gradient.
The detailed mechanism responsible for micro-tearing mode
instability is complicated. However, a useful model which demonstrates
the essential physics of the micro-tearing mode can be described in the
'semi-collisionar regime. In this regime the electron flow velocity, uy
along the field lines is limited by collisions with the ions. Thus the
parallel flux nv\\ = Dek\\n, where Dg = Vj^/v^ is the collisional diffusion
coefficient, so that v\\ = k\\D^. As discussed above, the current layer
exists in the region for which the electron parallel flow is less than the
phase velocity of the perturbation, resulting in the following relation
between the layer width and the growth rate
k\\v\\ = feJ4/Ve = k]d^v^^JL]v, = y. 8.5.6
In early calculations, the electrostatic potential, (p was neglected within
this layer, and flien the current perturbation is simply
;il = £||/?? = -yA\i/r], 8.5.7

438 8.5 Micro-tearing modes
jg. 8.5.2 Numencal calculation of the
growth rate of the linear micro-tearing
mode as a function of electron collision
frequency, Vg, for four different values of
the electron temperature gradient
parameter, r}e. (Gladd N.T., et ah, Physics
of Fluids 23 1182A980).)
0.1
0
-^.1
-
5
""^"^
10
\'7e=3
\ 2 \
, , 1 \\ \
50 IC
where r] is the plasma resistivity. Combining eqns 8.5.5, 8.5.6 and 8.5.7
leads to the growth rate
-"Yo
where yo is the growth rate in the collisionless limit
kyVjsA'
^s
yCOpe,
with c/cope the collisionless skin depth. However, later more detailed
calculations show that the electrostatic perturbation is important in the
layer and then the high m mode is stable in the absence of plasma
density and temperature gradients. When these gradients are introduced, an
extra drive for the magnetic perturbation results from the cross-field drifts
which modifies the parallel current through V ■ j|| = —V ■ j±. The drive
comes from the electron temperature gradient parameter, ij^. In the
electron drift kinetic equation the coefficient of r]e is velocity dependent and
care must be taken when performing the velocity integrals to weight this
coefficient with the correct velocity dependence. Indeed, if no velocity
weighting exists the coefficient of rje is zero. However, by taking the
velocity dependence of the collisions into account a micro-tearing
instability can occur for a sufficiently high r]^. This corresponds to retaining

8.5 Micro-tearing modes 439
the so-called 'tiiermal force', discussed in Section 2.23. An approximate
analytic form for the growth rate in the semi-collisional regime is:
j^ ^ r 2rA7/4) -] ??e(l + 5??e/4)
CO*. Lv^r(ll/4)J (VeMe)
L8V2;ri/4r(ll/4)J Pe \c0pj \lJ A + 5??e/4)i/2 '
8.5.8
Equation 8.5.8 shows the competition between the field line bending
measured by A', which is stabilizing, and the electron temperature gradient
drive measured by rje- Equation 8.5.8 demonstrates that the temperature
gradient has two effects. It reduces the field line bending term andprovides
the drive for the destabilizing term. The mode is stable for rjg = 0-
For sufficiently high collision frequency eqn 8.5.8 predicts stability,
while for low collision frequency the drive dominates and the mode is
unstable. Equation 8.5.8 was derived using an expansion in co^e/v^ and
so is invalid in the limit Vg -^ 0- However, in the absence of collisions
there is no thermal force and then stability is expected. The growth rate
is therefore maxinndsed at an intermediate electron collision frequency, in
qualitative agreement with the numerical results illustrated in Fig. 8.5.2.
In the above discussion of microtearing modes a narrow 'layer' around
the rational surface has been identified in which the plasma inertia and
resistivity are important. If the island width associated with a
perturbation in the radial component of the magnetic field exceeds the width of
this so-called 'resistive layer' then the linear theory is inadequate and
the effect of the island structure on the plasma density and temperature
profiles must be taken into account. These nonlinear effects can lead to
extra drives for the island growth and theory suggests that small scale
magnetic islands may be present in tokamaks even in the low and high
collision frequency regimes in which the linear theory predicts stability.
The simplest nonlinear theory, applicable to large scale islands with
a width much greater than the ion Larmor radius and driven by the
current gradient outside the island, has been described in Section 7.3. Island
growth results when A' > 0 and the island width, w, is predicted to evolve
at a rate proportional to the parameter A'. In the case of nndcrotearing
modes, m > 1 and then A' ~ —2m/r so that this simplest theory
predicts that such islands will not occur. However, the island itself can perturb
the equilibrium current density parallel to the equilibrium magnetic field
and this can provide an additional drive for the island growth. The
saturated island width is determined by a balance between this drive and the
stabilizing negative A'.
There are several candidates for the drive mechanism. First, the
reconnected flux witiiin tiie island allows the density and temperature
profiles to be flattened across the island and this reduces the bootstrap
current. The resulting perturbation provides the drive for the
neoclassical tearing mode discussed in Section 7.3. Second, the presence of a
magnetic island may alter the plasma resistivity in its vicinity through an

Micro-tearing modes
electron temperature perturbation. This temperature perturbation results
from a balance between the net local power density input, P (that is,
the difference between the ohmic and auxiliary heating sources and the
radiation and electron-ion heat transfer sinks) against the electron heat
conduction. The different topologies of the field lines inside and outside
the island affect the power balance relation and a current perturbation
results from the change in resistivity caused by the temperature
perturbation. This current sustains the magnetic island provided the ratio of the
net input power within the island to the magnetic shear, P/s, is negative.
The resulting saturated magnetic islands are called 'thermal islands'. A
further example of a drive mechanism arises from the effect of the island
structure on the ion and electron drifts. Finite ion Larmor radius effects
result in different cross-field drifts for the two species. This gives rise to
a perpendicular current which, through V • j = 0, implies a parallel
current capable of sustaining the island against the A' stabilization. Detailed
calculations indicate that the existence of these so-called 'drift' magnetic
islands again depends on the parameter r]^, which is the ratio of the
electron density scale length to the temperature scale length. In particular,
drift effects can sustain magnetic islands provided rjg lies within a
certain range. This range is determined by the propagation velocity of the
islands, which in turn depends on the dominant dissipation mechanism.
Therefore the r^g range in which drift effects can lead to island growth
depends on the collision frequency regime of the tokamak plasma and the
identification of this regime is rather subtle.
Bibliography
Microinstabilities
General surveys of microinstabilities in tokamaks have been
given by
Kadomtsev, B.B. and Pogutse O.P., Turbulence in toroidal
plasmas. Reviews of plasma physics (ed. Leontovich,
M.A.), Consultants Bureau, New York, Vol. 5, 249 A975).
Tang, W.M. Microinstability theory in tokamaks. Nuclear
Fusion 1?,, 1089A978).
and
Connor, J.W. and Wilson, H.R. Survey of theories of
anomalous transport. Plasma Physics and Controlled Fusion 36,
719A994).
Passing particle instabilities
The first paper to identify the electron drift mode in a
sheared slab of plasma and realize the importance of shear
damping was
Pearlstein, L.D. and Berk, H.L., Universal eigenmode in a
strongly sheared magnetic field. Physical Review Letters
23,220A969).
The instability drive due to the electron Landau resonance
was not treated correctly in this first work, as pointed out in
papers by
Ross, D.W. and Mahajan, S. M. Are drift waves unstable?
Physical Review Letters 40, 324 A978).
and
Tsang, K.T., et al. 'Absolute universal instability' is not
universal. Physical Review Letters 40, 327 A978).
The role of the toroidal geometry in suppressing the shear
damping in a tokamak plasma was first addressed by
Taylor, J.B. Does magnetic shear stabilize drift waves?
Plasma physics and controlled nuclear fusion research
(Proc. 6th Int. Conf., Berchtesgarten 1976) Vol. 2, 323
I.A.E.A. Vienna A977).
and later studied in more detail using the ballooning transform
in papers by
Hastie, R.J., Hesketh, K.W., and Taylor, J.B. Shear
damping of two-dimensional drift waves in a large aspect ratio
tokamak. Nuclear Fusion 19, 1223 A979).
and then in an important paper by

Bibliography
Cheng, C.Z. and Chen, L. Unstable universal drift eigen-
modes in toroidal plasmas. Physics of Fluids 23, 1771
A980).
who demonstrated the existence of a new class of electron
drift mode in a tokamak, the toroidal branch, which does not
exist in a plasma slab. These toroidal treatments were only
valid at a radial position in the tokamak plasma where the
diamagnetic frequency is a maximum. A development in the
theory of these instabilities in a tokamak identifies a more
general class of toroidal mode, which can exist at any radial
location. They exhibit a shear damping which is comparable
to that of the slab mode, as shown in the paper
Connor, J.W., Taylor, J.B., and Wilson, H.R. Shear damping
of drift waves in toroidal plasmas. Physical Review Letters
70, 1803 A993).
Early work on the ITG mode is described by
Galeev, A.A., Oraevskii, V.N., and Sagdeev, R.Z.
'Universal' instability of an inhomogeneous plasma in a magnetic
field. Zhumal-Experimentalnoi i Teoretiches-koi Fiziki 44,
903 A963) [Soviet Physics JETP 17, 615 A963)].
and a good description of the mode in a slab geometry is
given by
Horton, W. and Varma, R.K. Electrostatic slab theory of
tokamaks from two-component fluid equations. Physics
of Fluids 15, 620 A972).
The ITG mode properties in a toroidal geometry were first
addressed by
Horton, W., Choi, D., and Tang, W.M. Toroidal drift modes
driven by ion pressure gradients. Physics of Fluids 24,
1077A981).
while a detailed description of the linear mode characteristics
in a torus is given by
Guo, S.C. and Romanelli, F. The linear threshold of the ion-
temperature-gradient-driven mode Physics of Fluids B5,
520A993).
A general class of ITG mode has also been identified in a
paper by
Romanelli, F. and Zonca, F The radial structure of the ion-
temperature-gradient-driven mode. Physics of Fluids B5,
4081 A993).
which has a similar mode structure to the general toroidal
electron drift mode discussed above. The rj^ mode has been
addressed in some detail in the paper by
Lee, Y.C., et al. Colhsionless electron temperature gradient
instabiUty. Physics of Fluids 30, 1331 A987).
Trapped particle instabilities
The trapped particle modes are described in a general review
article on the subject by
Kadomtsev, B.B. and Pogutse, O.P. Trapped particles in
toroidal magnetic systems. Nuclear Fusion 11, 67 A971).
In that article the trapped ion mode was considered in the
absence of an ion temperature gradient, r]^ = 0 and ion
collisions are then destabilizing. In a later paper by
Biglari, H., Diamond, PH., and Rosenbluth, M.N. Toroidal
ion pressure gradient driven drift instabiUties and transport
revisited, Physics of Fluids Bl, 109 A989),
the effects of ?7i > 0 were investigated and it was found that
for r]i > 4/3 ion collisions become destabilizing, tapping the
free energy source of the ion pressure gradient. An analytic
threshold for the trapped electron mode has been derived by
Manheimer, W.M., et al. Marginal stability calculation
of electron temperature profiles in tokamaks. Physical
Review Letters 37, 287 A976).
A more complete, numerical investigation of trapped electron
instabilities (and other modes) is described in
Rewoldt, G., Tang, W.M., and Chance, M.S. Electron
kinetic toroidal eigenmodes for general magnetohydro-
dynamic equilibria. Physics of Fluids 25, 480
A982).
Micro-tearing modes
The Unear theory of micro-tearing instabilities has been
studied in a series of papers by Drake et al. In particular, physical
'pictures' of the instability are presented in
Drake, J.F and Lee, Y.C. Kinetic theory of tearing
instabilities. Physics of Fluids 20, 1341 A977).
A review which summarizes the nonUnear theory of micro-
tearing instabilities and gives an exhaustive source of
references is the article by
Smolyakov, A.I. Non-Unear evolution of tearing modes in
inhomogeneous plasmas. Plasma Physics and Controlled
Fusion 35, 657 A993).

Plasma-surface
interactions

9.1 Plasma-surface interactions
9.1 Piasma-surface interactions
Impurities present a number of problems in tokamak plasmas. One is
the radiative power loss, principally due to line radiation from partially
stripped ions. Another is fuel dilution. This arises because impurity atoms
produce many electrons and, for a given plasma pressure, these electrons
take the place of fuel particles. At high concentrations impurities prevent
the plasma being heated. This is particularly a problem during the plasma
start-up phase since impurities radiate most strongly at low temperatures
before they become highly ionized. Impurities can also lead to disruptions
as a result of edge cooling and consequent current profile modification.
The fractional impurity level which produces a radiation power equal
to 10% of the total thermonuclear power is presented in Fig. 4.21.2.
Impurities of low atomic number are clearly a much less serious problem
than those of high atomic number.
Impurities originate either from the material surfaces facing the plasma
due to a variety of plasma surface interactions or, in a reactor, to helium
from the fusion reactions. The impurities most easily released are those
adsorbed on the surfaces with low binding energies, for example water
and carbon monoxide molecules. There are also bulk impurities in the
soUd, such as carbon, chlorine, and sulphur which can migrate to the
surface. These species may be desorbed thermally or by the impact of ions,
atoms, electrons, or photons. They can normally be removed from the
system by baking the vacuum vessel or by cleaning with glow discharges.
It is also possible for the wall material to be introduced into the plasma
by such processes as sputtering, arcing, and evaporation. Sputtering is a
momentum transfer process which releases atoms when energetic ions,
either hydrogen or impurities, strike solid surfaces. The walls can also
be sputtered by neutrals arising from resonant charge exchange between
hot ions in the plasma with cold neutrals. Arcing can occur between the
plasma and the wall or limiter, driven by the sheath potential. Evaporation
occurs when the power load is sufficient to heat the surfaces to
temperatures near their melting point. Details of these processes are given in
subsequent sections of this chapter.
The particle flow to material surfaces is primarily due to diffusion
from the plasma core into the boundary region or to ionization of neutrals
in the boundary plasma. In the boundary layer the plasma flows along
the magnetic field and then interacts with a solid surface. Ions which
are incident at this surface may then be neutralized and backscattered or
released in other ways to re-enter the plasma. This process is known as
recycling. When a neutral atom from the surface arrives in the plasma it
is excited and ionized by collisions witii electrons.
In magnetic confinement devices the plasma is confined within closed
magnetic flux surfaces, normally generated by a combination of fields

Fig. 9.1.1 Schematic diagram of
poloidal flux surfaces m a tokamak
(a) with a htniter and (b) with a divertor.
The toroidal field is normal to the page.
9.1 Plasma-surface interactions
(a) Limiter operation
/Wall
(b) Single null
divertor operation
Divertor target
due to external conductors and by currents flowing in the plasma. Such
fields can only be generated within a restricted volume, and there is
therefore a boundary determined by the Last Closed Flux Surface (LCFS).
The shape of the LCFS is determined by the magnetic fields. However,
closed magnetic surfaces may be interrupted by a solid surface which then
determines the position of the last closed flux surface. Such a solid surface
is called a limiter Alternatively the closed surface may be determined
entirely by the magnetic fields so that outside the LCFS, the plasma flows
towards and eventually interacts with a solid surface. This is the basic
geometry of a divertor The two situations are compared in Fig. 9.1.1.
The essential difference between the two is that with a limiter the LCFS
is in contact with a solid surface, while with a divertor the solid surface
is removed some distance from the LCFS.

9.2 The plasma sheath
The plasma sheath
A neutral gas in contact with an absorbing surface flows to the surface
at a velocity characterized by the thermal velocity. This velocity differs
from the sound speed only by a numerical factor. In the case of a plasma
the flow velocity to an absorbing surface is again around the sound speed
but the underlying behaviour is more complicated.
The electron thermal velocity is larger than that of the ions by the
square root of the mass ratio. However, an electric field is set up which
brings the two flows to equality by decreasing the electron flow and
enhancing the ion flow. The resultant flow is driven by the combined
electron and ion pressures and is restrained by the ion inertia. The
principal electric field is located in a narrow sheath near the surface, its width
being several Debye lengths. A small electric field, the presheath, extends
more deeply into the plasma. Figure 9.2.1 shows the spatial variation of
electric potential, ion velocity, and the ion and electron densities.
The electric potential is described by Poisson's equation
Fig. 9.2.1 Typical spatial v;
the electnc potential, ion velocity and the
ion and electron densities across the
plasma sheath
-{ne-n,)
9.2.1
where n^ and n^ are the electron and ion densities. Defining the potential
to be zero at the sheath edge the electrons take up a Boltzmann distribution
given by
ne = noexp^. 9.2.2
A simple form for tij can be obtained if the ion energy is represented by
^mjUj = jfTi^Vg — ecp
where Vo is tiie velocity with which the ions enter tiie sheath. Then, since
the ion flux n^Vi is a constant, n^ is given by
«i = «o -j—
where iio is the plasma density outside the sheath.
Equations 9.2.1 to 9.2.3 give the differential equation for 0
\\m,vl-e<p)
The value of Vq, is determined by requiring that the solution of eqn 9.2.4
over the narrow sheath region matches the slowly varying small potential

9.2 The plasma sheath 447
outside the sheath. Thus, taking small (p, eqn 9.2.4 becomes
where A,d is the Debye length. A slowly varying solution of eqn 9.2.5
requires
Wo-Cre/m,)'/^ 9.2.6
The above calculation has implicitly neglected the ion temperature. The
generalization of eqn 9.2.6 is
Vo = Cs 9.2.7
where, within the Hmitations of the model, c^ ~ (T^ + Ti)/m^. Thus the
plasma enters the sheath at the sound speed.
The potential, 0o, across the sheath is determined by the requirement
that the total current to the surface be zero. The ion current density into
the sheath, and therefore to the material surface, is
;, = Hoecs. 9.2.8
The electron flux from the sheath to the material surface is 1 /An^c^, where
He is the electron density at the surface and Cg = {^T^/nm^)^!^. Thus,
using eqn 9.2.2 to relate ng to rio, the electron current density is
;g = -^noe(8rg/umg)'/2exp ^. 9.2.9
Substitution of eqns 9.2.8 and 9.2.9 into the requirement j^ + jg = 0 now
gives
1 / Srg y/^ e0o _ /Tg + rA'/^
and so (f)o is given by
e(po _ 1
^^ . 9.2.10
27t(l + TJT,)j
For a deuterium plasma with T, = Tg, -e0o = 2.8rg.
More generally it is necessary to include the effect of secondary
electrons produced at the surface by electron and ion bombardment Such
electrons are accelerated out of the sheath by the electric field. The
modified form of eqn 9.2.10 is
-ir = 2^"L2u(i + r./rg)J' '■^■''
where S is the total secondary electron emission coefficient due to ions
and electrons.

9.2 The plasma sheath
Ion impact on the surface can cause erosion by sputtering, desorp-
tion, and other mechanisms. In addition the thermal loading can lead to
sublimation or evaporation. Impurities are transported into the plasma
and cause energy loss by radiation. These processes are described in
Sections 9.6 to 9.8 and 9.11. If the plasma is in contact with a solid
surface at a fixed potential, the plasma potential is determined by the sheath
potential. Electric fields can, however, appear in the boundary by having
two or more surfaces in contact with the plasma at different potentials. For
example the electron temperature can vary radially in the boundary layer
in contact with a conducting limiter. The plasma potential thus varies
radially, setting up an electric field. Electric fields, either externally induced
or occurring naturally in the boundary, can have a significant effect on
transport.
The energy of the plasma ions reaching the surface is determined by
their thermal energy and the sheath potential through which they fall,
given by eqn 9.2.11. The ions are accelerated by the sheath and when
they reach the surface their energy distribution is very approximately an
accelerated and truncated Maxwellian. The electrons are decelerated by
the sheath, their distribution remaining Maxwellian but with a reduced
density. It is important to note that, because of the sheath potential, only
the high energy tail of the electrons arrives at the wall and is observed
experimentally. Examples of experimentally measured distributions are
shown in Fig. 9.2.2. The sheath also influences the flow of power to a
surface. The energy transported to a surface by a Maxwellian distribution
of ions or electrons is 27 per particle. Adding the energy due to tiie
acceleration of ions in the sheath, the power flux to the surface, P, is
given by
[27, 2 1, ({l-SfmJm^W
Equation 9.2.12 can be conveniently written
P = y^TT^
where T is the ion flux density and y^ is the sheath power transmission
factor. The factor /s is approximately 6.5 for a hydrogen plasma with
Ti = Te and 5 = 0. At high density, collisions within the sheath can
reduce the effective value of y^.
In practice 5 is often close to unity and the sheath power transnndssion
coefficient y^, can be significantly enhanced. Equation 9.2.11 shows that
as 5 increases the sheath potential drops. Thus there is a large uncertainty
in the sheath power transmission coefficient, although the effective value
of S cannot exceed ~0.8 because of space charge effects.

9.3 The scrape-off layer
; (a) Ion characteristic
T =80 eV
0 20 40 60 80 100 120
Grid voltage (Volts)
Fig. 9.2.2 Integral energy distnbutions
measured in the plasma boundary of the
DITE tokamak (a) ions, (b) electrons.
(Pitts, R.A. Physics of Fluids 3, 2871
A991).)
-60
-40
-20
0
O
'O
~
-
0
0
0%
(b) Electron characteristic
7^ = 11 eV
^^<>^^^XK0oo:A>cc<s^^
Grid voltage (Volts)
9.3
The scrape-off layer
Radial distribution of n^ and T^ in the scrape-off layer
In the scrape-off layer (SOL) perpendicular flow across the magnetic
field is balanced by parallel flow along the open field lines towards the

9.3 The scrape-off layer
Fig. 9.3.1 Schematic diagram of the
plasma flow from the confined plasma ml
the SOL by cross-field diffusion and alon
the field in the SOL to the limiters or
divertor target
limiter or divertor target plate. These flows are illustrated schematically
in Fig. 9.3.1. The diffusion coefficient for both power and particles across
the field is generally 'anomalous', being higher than predicted by
neoclassical theory. In steady state, provided there are no other sources or
sinks (such as ionization) in the scrape off layer, the loss along the field
from any given flux tube is balanced by the net flow across the field into
the flux tube. We can thus write
dr L drj L^
9.3.1
where £)_l is tiie cross-field diffusion coefficient and L^ is the
connection length along the flux tube to the flow stagnation point. With die
assumption that D± and Cs are independent of radius, eqn 9.3.1 is readily
d to obtain
n{r) =«(a)exp{-(r
where
-a) An}
_ \D±U
9.3.2
9.3.3
a is the minor radius at the limiter or last closed flux surface, and A.„ is
the scrape off thickness, or e-folding length, for density.
The electron heat balance can be considered in an analogous way
leading to a temperature profile.
T^{r) = T,{a) exp{-(r - a)/XT} 9.3A
where approximately
1-
^T 5/2 + X±^n/D±XT^ '
9.3.5
A.T is the electron temperature e-folding length, and x± is the cross-field
thermal diffusivity. Equations 9.3.2 and 9.3.4 lead to a radial distribution
for the power flux similar to those for n^ and Tg.
Equations 9.3.3 and 9.3.5 give the e-folding lengths in the scrape-
off layer in terms of the cross field transport parameters. In practice.

9.3 The scrape-off layer 451
since the cross-field transport coefficients are not known, the measured
values of A.„ and A.t are used to deduce D± and x±- Measurements of the
e-folding length for ng and Tg can be made with electrical probes, provided
the impurity content is small. Typical values are ~10mm. If there are
no sources in the scrape-off layer, this measurement together with the
assumption that Tg = T^, enables c^ to be calculated and a value for
Dj. deduced. This is typically ~lm^s""'. There is experimental evidence
that D±_ is inversely proportional to density. However, since density and
temperature changes in the boundary are correlated, this behaviour can
also be interpreted as a temperature dependence of D±. Absolute values
of D±_ comparable with the Bohm diffusion coefficient, D^ — T/l6eB,
are frequently obtained, although the scaling with Tg and B is not. If either
particle or energy sources are present in the SOL then the calculation of
transport coefficients is much more difficult.
It is possible to make rough estimates of the expected values of the
density and temperature at tiie LCFS by using global particle and energy
balances. The integrated particle flux to the limiter must be equal to the
total flux diffusing out from tiie confined plasma. A particle replacement
time, Tp, can be defined as
hV
r„ = — 9.3.6
Tp
where r„ is the total particle outflux, n is the average plasma density and
V the plasma volume.
Using eqn 9.3.2 the total flux to a single poloidal Hmiter is
f°°
na I n(a
Fl = 47ta / n{a) exp(-(r - a)/A.„)cs dr. 9.3.7
Carrying out the integration in eqn 9.3.7 assuming Cs does not vary with
radius and equating r„ from eqn 9.3.6 to Fl gives the edge density
Tp 4naX.nCs
Using a simple edge transport model for Tp, taking into account the
ionization mean free path of atoms entering the plasma,
n{a) = —krn^ « 5 x lO^^hl m'^ 9.3.9
6Vn
where ctu7 is the ionization rate coefficient, Vn is the initial neutral velocity
and A.r is the flux e-folding length. This expression gives a remarkably
good fit to a wide range of Hmiter experiments, as illustrated in Fig. 9.3.2.
However, for scans at constant current on any one machine the slope of
the data is less than n(a) oc nl. This is probably due to decreasing edge
temperature as the density increases.
To obtain an upper bound to the edge temperature T^ia), it can be
assumed that all the power is lost by particle flow across the sheath, that

9.3 The scrape-off layer
Fig. 9.3.2 Relationship between the
edge density rieia) and line average
density tie for a range of tokamaks with
limiters. The line represents the model of
eqn 9 3.9. (Erents, S.K, et al, Nuclear
Fusion 28, 1209 A988), Pericoli-Ridolfini,
V. Nuclear Fusion 31, 127 A991),
Matthews, G F, etal, Nuclear Fusion 28,
2209A988).)
Edge density
n,(a) (m-3)
ALCATORA
A ALCATORC
*TFR 600
DITE^
v^^M
JSMA JET
-^ 4MA JET
.Ad
3MAJET
©TIO
2MA JETJ.;f
*/„ ®TEXTOR
IMA JET 1^
'I ^TOSCA
/Equation 9.39
Line average density (m )
is there is no radiation. Equations 9.3.7 and 9.3.9 are used to calculate
the particle flux and eqn 9.2.12 is used for the power lost per ion/electron
pair Such a calculation is only valid for limiter tokamaks. The case of
divertors is more complex because much of the recycling takes place in
the scrape-off layer near the target plates (see Section 9.10).
Parallel transport outside the LCFS
The simplest model capable of reproducing the main features of transport
along the magnetic field in the scrape-off layer is the isothermal
fluid model. Steady-state, inviscid, isothermal one-dimensional flow is
determined by conservation of particles and momentum
-(nv) = S
9.3.10
dv dp
nmv—= --mvS 9.3.11
dz dz
where S is the source rate of particles due to cross-field transport or
ionization, p = n{Te + TO, and m is the ion mass. The second term on

tiie right hand side of eqn 9.3.11 is die drag due to acceleration of tiie
ions from die source. Equations 9.3.10 and 9.3.11 give
AM ^ 5A + M^)
dz nc, A - M2) ^-"-'^
where M = v/c^ is the Mach number.
From eqn 9.3.12 it is seen that, as M tends to unity, dM/dz tends to
infinity and the plasma solution breaks down. M = 1 indicates the start
of the plasma sheath. Equations 9.3.10 and 9.3.11 give the conservation
of momentum
d ,
— ip + nmv^) =0
dz
n{M) 1
—^—- — 9 3 13
n@) 1 + M2 ^-^-'^
where n@) is the density at the stagnation point u = 0. It is seen that
n(M)/n@) tends to 0.5 as M tends to 1.
The electron density distribution is given by the Boltzmann relation,
eqn 9.2.2, and so using eqn 9.3.13 the plasma potential 0(M) is given by
(j)(M) = —-Inil + M^), 9.3.14
e
and (p tends to -0.69 Te/e as M tends to 1.
Many other models, both fluid and kinetic, have been proposed for
parallel flow. However, for the most important parameters the predictions
of the different models are similar.
Impurities which are produced at surfaces in contact with the plasma
and flow into the scrape-off layer are also subject to the presheath electric
field and their own pressure gradient. In addition, they are subject to the
factional force of the ion flow towards the limiter. The flow velocity is
difficult to calculate and there is little experimental information.
9.4 Recycling
In most tokamaks the pulse length is at least an order of magnitude longer
than the particle replacement time. Thus on average each plasma ion
goes to die divertor target plate or limiter and returns to the plasma many
times during the discharge. This process is called recycling. A global
particle replacement time may be defined as the ratio of the total particle
content within the last closed flux surface to the total particle influx (and

tiierefore efflux) across fliis surface. This time should not be confused
widi the central particle confinement (or equilibration) time which is
tile time for a particle to be lost from the centre of the plasma and is
therefore of order a^/D±, where a is the plasma minor radius. For a
limiter tokamak the recycled particles enter the plasma predominantly
as neutrals but are ionized and then trapped by the magnetic field after
traversing only a fraction of the plasma radius, as discussed in Section 9.5.
The situation is more complicated in the case of the divertor, where most
of the ionization may take place near the target. Under some conditions
there may be no particle source in the core plasma and the density at the
LCFS is determined by the density gradient along the separatrix from
the target (see Section 9.10). The particle confinement, or replacement
time, then has little meaning.
Although the recycling of particles involves processes both in the
plasma and in the surface layer of the solid, the present section will
concentrate primarily on the processes occurring in the solid. When a
plasma ion or neutral arrives at a solid surface it undergoes a series
of elastic and inelastic collisions with the atoms of the solid. It may
either be backscattered after one or more collisions, or slow down in
the solid and be trapped. The trapped atoms can subsequently reach
the plasma again after diffusion back to the solid surface. The ratio
of the flux returning to the plasma from the solid, to the incident
flux, is known as the recycling coefficient. In addition, tiie flux of
plasma particles and radiation may release gas which was previously
adsorbed on tiie wall as described in Section 9.6. This additional
influx of particles can lead to effective recycling coefficients which
are significantly greater than unity. Large quantities of hydrogen can
be built up in wall materials in contact with the plasma, the
equilibrium concentration depending on the incident flux, the ion energy, and
the wall material and temperature. These processes are discussed in
Section 9.12.
The backscattering of ions incident on a surface depends primarily
on the ion energy and on the ratio of the masses of the surface atom
and the incident ion. Scaling laws which depend on ion energy give
an approximate value of the particle backscattering coefficient R^ for
ions incident on all materials. A similar general law can be obtained for
the energy reflection coefficient, R^. Values of R^ and R^ as functions
of reduced energy are given in Fig. 9.4.1. The curves are derived from
Monte Carlo calculations for a wide range of ion-target combinations.
The scatter in experimental data is typically 25% and the Monte Carlo
calculations generally agree with the available experimental data within
these limits. It is seen that both particle and energy reflection coefficients
increase with increasing mass ratio, as expected from simple conservation
of momentum. The data in Fig. 9.4.1 are unreliable for energies below
about 10 eV because at very low energies the use of sequential binary
collisions in the calculations is no longer valid.
The particles which are backscattered are predominantly neutral since
an incident ion normally picks up an electron from the solid. The average

Fig. 9.4.1 Particle and energy reflection
coefficients of ions backscattered from
solid surfaces as a function of reduced
energy, s, for 3 different ratios of the target
to incident mass The reduced energy is
defined as
(mi + m2)ZiZ2(Zp + Z2''^)V2
where E is the energy of the incident
particle. (Thomas, E W, Janev, R.K. and
Smith, J., Nuclear Instruments and
Methods in Physics Research B69, 427
A992))
Reduced energy
Fig. 9.4.2 Measured energy distnbution
of hydrogen atoms backscattered from
carbon, for different incident ion
energies, Eq The distnbutions are
normalized at their maximum intensity
(Aratari, R and Eckstein, W., 7 A^Mc/ear
Materials 910, 162^ (\9S9))
0 0.2 0.4 0.6 0.8 1.0
Relative energy EIEq
energy of the backscattered particles is determined by the ratio R^/Rp,
the mean energy being typically 30-50% of the incident energy. The
energy distribution has been experimentally measured down to about
0.1 keV and calculated down to even lower energies. Some results are
shown in Fig. 9.4.2. The distribution is continuous, typically having a
maximum, the position of which depends on both the energy and the
angle of incidence of the primary ion.

The atoms which come to rest within the solid reside either in
interstitial sites or in defects in the metal, such as vacancies. For hydrogen,
however, diffusion readily occurs at temperatures above 300 K in many
materials. Carbon, carbides, and oxides are notable exceptions. When
diffusion occurs, the behaviour of the hydrogen depends on the heat of
solution of hydrogen in the material. In the exothermic case there is an
effective potential barrier at the surface preventing hydrogen atoms being
released. The hydrogen thus diffuses into the solid, eventually becoming
distributed over the whole volume. In the endothermic case hydrogen
atoms diffuse to the surface and escape from it after recombination to
form molecules. Since the penetration range of the incident ions slow-
ng down in the solid is small compared with the thickness of material,
in most practical cases the concentration gradient, and hence the
diffusive flow, is largest towards the surface facing the plasma. The hydrogen
ions which have slowed down in the solid are usually released from the
surface as molecules, having thermal energies characteristic of the solid
surface.
The details of hydrogen diffusion in solids is complex. In both metals
and non-metals the diffusing atom can be trapped at lattice vacancies,
interstitials, or other imperfections with binding energies much larger
than the activation energy for diffusion. The concentration of hydrogen
in interstitial sites C(x, t) can be described by the following equations
dc
,, D-^ - festC(CTO - Ct) + hCt -
dt dx^
■S(x)
where D is the diffusion coefficient, Ct(x, t) is the concentration of
hydrogen in traps, Cto is the concentration of traps, fest is the rate coefficient for
entering traps, kt is the rate coefficient for thermal desorption from the
traps and S(x) is the range profile of the implanted ions. The concentration
Ct is determined by
dCt{x,t)
:festC(CTO-Ct)-fetCt
with the boundary condition
dx\
= krC{Of,
where kr is the surface recombination rate coefficient. The rate
coefficients, k, are all temperature dependent with characteristic activation
energies. There are considerable differences between the parameters for
different materials. For example in metals Ct ~ 0.01 to 0.05 whereas
in carbon Ct ~ 0.4. In carbon at room temperature D is negligible
whereas in some metals, for example nickel, diffusion is significant
on a timescale of 10 s. The surface recombination rate is very
sensitive to surface conditions and can change by orders ofmagnitude with the

9.5 Atomic and molecular processes 457
presence of a submonolayer of impurity. The coupled equations 9.4.1 and
9.4.2 require numerical solution. They have been successful in describing
experimental results in many cases both for metals and non-metals.
In steady state the ion flux to the solid is balanced by the outflow. This
outflow is determined by the diffusive flow towards the surface and the
molecular recombination rate at the surface. Depending on the
materials and operating temperature, either may be the rate limiting process.
In many practical cases a dynamic equilibrium is set up in which the
recycled particles entering the plasma consist of ~50% backscattered
atoms with energies < 5 Tg (taking into account the sheath potential
accelerating the incident ions and the energy reflection coefficient Re) and
50% of slow molecules with energies ~ 0.03 eV. With light element
wall materials the proportion of the particles backscattered as atoms is
lower, ~ 30%.
While the recycling flux density is highest at the limiter or divertor
target, recycling also occurs at the walls due to charge exchange
neutral fluxes. Because charge-exchange and ionization rate coefficients for
hydrogen are roughly equal in the temperature range of interest, the
integrated neutral recycling at the wall is of the same order as the integrated
ion flux to die limiter or divertor target. The distribution of neutral flux
can be calculated with Monte Carlo codes. Local measurements of the
energy distribution of neutral fluxes to the wall indicate mean energies in
the range 100-500 eV.
Atomic and molecular processes
In the processes of recycling and fuelling, many atomic and molecular
reactions occur in the boundary layer as the incoming hydrogen isotopes
meet the energetic ions and electrons of the plasma. Further reactions
occur when impurities created by sputtering and by other plasma-surface
interactions enter the plasma. In most cases the dominant atomic reactions
are excitation and ionization. These lead to emission of radiation and
cooling of the edge plasma. This is beneficial since it lowers the incident
ion energy and reduces the physical sputtering rate.
Considering first the recycling of hydrogen isotopes from the wall,
the important atomic reactions are excitation, ionization, and charge
exchange,
H + e ^- H* + e excitation
H + e ^- H"*" + 2e ionization
H+ + H ^ H + H+ charge exchange.

9.5 Atomic and molecular processes
Fig. 9.5.1 Rate coefficients for
hydrogen atoms and molecules for a
number of common reactions. The first
symbol refers to the test particle and the
second refers to the thermal species, the
rate coefficient being integrated over
the Maxwellian distribution of this species.
£h is the energy of the test particle
(R.K. Janev et al. Elementary processes in
hydrogen-helium plasmas, cross sections
Springer-Verlag, Berlin, 1987).
10-'^
10"'"*
Rate
coefficient ,n-i5
JQ-16
in-i7
I // \ / Ejj<10eV
/,/' 1 1 , / 1 \ 1
lO'' 10'
r(eV)
The main molecular reactions are
H2 + e ^ H + H + e
H2 + e ^ H+ + H + 2e
H2 + e ^ H+ + 2e
H^ + e ^ H + H
H^ + e ^ H+ + H+ + 2e
dissociation
dissociative ionization
molecular ionization
dissociative recombination
dissociative ionization.
The relative reaction rates for the different processes are functions
of plasma temperature and density. Some rate coefficients are shown in
Fig. 9.5.1. Although atomic and molecular processes are complex they
have been extensively studied. The cross-sections are well known and
in most cases there is good agreement between theory and experiment.
Thus good models of the boundary layer atonndc physics processes can
be made, provided the plasma physics can be sufficiently well described.
When atoms or molecules enter the plasma, the collision rate with
the plasma species is nnoicrv) where n is the plasma density, rio the
neutral density and (av) is the reaction rate averaged over the electron
velocity distribution. Considering a simple one-dimensional model with
the source at the wall, the flux of neutrals as a function of radial position
decreases due to ionization. The neutral flux F{r) at a given radius is
given by
F{r) = F(,
K'-f
n,{r){cfv)
dr
where F{a) is the initial flux and (on;} is determined by the local
electron temperature. The local ionization source function is dF(r)/dr. Thus
if the plasma density and temperature profiles are known, it is
possible to determine the penetration into the plasma of both the recycling
species and impurity species. However, ionization in the boundary
immediately modifies its density and temperature and more complex models

9.5 Atomic and molecular processes 459
usually have to be used to obtain a self-consistent solution. Charge
exchange is a further complication which is particularly important in
the case of hydrogen. Because the rate coefficient for charge-exchange
is greater than that for ionization, (see Fig. 9.5.1) the penetration of
neutral hydrogen is dominated by charge exchange. When the incoming
particle undergoes charge exchange an energetic plasma ion becomes a
fast neutral and subsequent charge exchange reactions between neutrals
and plasma ion leads to a random walk and diffusion to the centre of the
plasma. This can be analysed either by transport codes or by Monte Carlo
methods.
Ionization of impurities occurs in the same way as for hydrogen species
but charge exchange can be neglected in most cases. After the first
ionization event the impurity ion is confined by the magnetic field and it
can then become multiply ionized in a series of collisions with electrons.
The dominant charge state of the impurity ions at any position is
determined by the local electron temperature, the electron density and the
time for which the impurity is in the plasma. The ratio of the excitation
to ionization rate can be calculated for any given ionization state at a
given electron temperature. This ratio gives rise to the useful concept of
photon efficiency, the ratio of the number of photons emitted in a given
transition per ionization event. The inverse photon efficiency (number of
ionization events per photon emitted) is shown for a number of ions in
Fig. 9.5.2. Knowledge of the photon efficiency together with absolute
measurements of the radiation enables the influx of ions to be directly
calculated.
By summing over all transitions the average energy lost per ionization
event can be obtained. For hydrogen atoms this varies from 150eV for
Te = 2eV to 25-30 eV for T^ > 20 eV. At low T^ it is also
dependent on «£■ For impurities the situation is more complicated as there
are many possible charge states and excitation can occur in all of these
until the ion is fully stripped of electrons. For a carbon atom entering a
typical tokamak plasma the energy lost in producing a fully stripped
ion is in the range 1-10 keV per atom, depending on the electron
temperature.
As an impurity particle enters the plasma and is raised into successively
higher ionization states it is also heated by collisions with the background
plasma, principally with the plasma ions. The classical thermalization
time, given by eqn 2.14.10, is
Tth = 2.2 X 10'^ ^ \^ s Tb in KeV
where mi and me, Z\ and Zb are the masses and charge states of the
impurity and plasma ions and n^ and T^ are the density and temperature
of the background plasma. The characteristic time for ionization is
= (ne(fTW>ion)"

9.5 Atomic and molecular processes
Fig. 9.5.2 Ionization events per emitted
photon for some common Impurity lines
used for flux measurements, calculated as a
function of local electron temperature.
Data derived from the ADAS database at
an electron density of 1 x 10^^ m~^ for the
|iunty lines and at the three densities
indicated for deutenum atoms. (Summers,
HP, The ADAS users manual, Version 2 2
B000). httpV/adasphys.strath.ac uk/adas/)
I 10
i
^Hen
on
442 nm
cn65
-::r^-
8 nm /'flel 668 nm
-^''^ /Arn
/ 440nm
// /cm
/ Mol
/ 386nm^^_^^
''■''''^Crl425nm
- £>,A0"m-')
£>.CxlO"m-')
- £>,A0™m-')
100 1000
Fig. 9.5.3 Calculated temperature of
Cn, on and CIII impunty ions as a
function of background plasma
temperature G", = 7^, initial impunty ion
temperature = 0.)
 20 40 60 80~
Plasma temperature (eV)
The temperature which an ion reaches before being ionized to the next
charge state is determined by Tjon/tth, which is independent of density.
The calculated temperature of some typical impurity ion species as a
function of background plasma temperature is shown in Fig. 9.5.3. At

9.5 Atomic and molecular processes
Fig. 9.5.4 Mass spectrum of impunty
ions in the SOL of the DITE tokamak,
measured with a plasma ion mass
spectrometer. (Matthews, GF, etal
Nuclear Fusion 31, 1495 A991).)
-
H
C
(
1 ^t
e+3^ 1 "a II M
fj\
6 47 4 3.5 3
low temperatures the collision rate is high, the ionization rate is low and
the impurities are rapidly thermalized. For increased plasma temperature
the ionization rate increases and the thermalization rate decreases so that
ionization occurs before thermalization is complete. In equilibrium the
charge state distribution of the ions is determined by the local electron
temperature.
Impurity ions moving out of the plasma and arriving at the plasma
boundary are accelerated through the sheath potential and consequently
the energy of an ion arriving at a material surface is a strong function
of the ion charge state. Measured values of the distribution of charge
state are shown in Fig. 9.5.4. The charge state calculated as a function of
Te is shown for oxygen in Fig. 9.5.5 for coronal equilibrium conditions.
Fig. 9.5.5 The oxygen ionization st
distribution in coronal equilibrium.
(Carolan, P.G. and Piotrowicz, V A.,
Plasma Physics 25, 1065 A983).)
0.5
0.2
0.1
0.05
O.L
/'1+""^
j
1
l,,l
01
'M^i
I
' 'j 11
0.01
/^^
-^4+
U5+
\\ i
0.1
X'8+
/ vV"^"^
j^ \ ;^^^ 1
1 1
Temperature (keV)

Wall conditioning
The residence time can be quite short (< 1 ms) if the ions are ionized in
the scrape-off layer and stream back along field lines into the divertor or
limiter.
Wall conditioning
Under normal vacuum conditions a surface will be covered by a layer
of adsorbed gas coming from the surrounding atmosphere. The adsorbed
atoms have binding energies ranging from weakly bound physical
adsorption, ~0.3 eV, to strongly bound chemical absorption ~3 eV, The weakly
bound species can be removed thermally and at any given temperature
there will be a dynamic equilibrium between the arrival rate and the
desorption rate. The removal of a single monolayer of gas, with a
surface density of ~10'^ atoms m~^, from a circular boundary of 1 m minor
radius would, if taken up by the plasma, lead to a density increase of
~10'^ m~^. Although hydrogen can be absorbed on the surfaces,
impurity species such as carbon monoxide and water molecules are the typical
adsorbents, accounting for the carbon and oxygen frequently observed
as impurities in tokamak plasmas. Impurities can dominate the energy
balance by radiating most of the power put into the plasma. During the
start-up phase of a tokamak, when the walls are covered with adsorbed
gas, the various desorption processes can lead to levels of radiation from
oxygen and carbon which prevent the plasma being heated. Thus the
release of adsorbed gas is a serious impurity source.
Impurities can be desorbed by incident ions, neutrals, electrons, and
photons. The electron and photon processes are predominantly electronic
in nature and their yields are low, particularly in the case of photons. The
yield from electrons is typically two or three orders of magnitude lower
than for ions, ions and neutrals having similar yields. The desorption
process for ions and neutrals is by momentum transfer, similar to the process
for sputtering, (described in Section 9.7) and can have a cross-section,
a, as high as 10~'^ m^. Typical cross-sections, obtained experimentally
for adsorbed species desorbed by ions are shown in Fig. 9.6.1. A simple,
approximate expression for the yield of desorbed species, Y, is
Y = cFcJ exp(~Jat)
where J is the incident ion flux density and c is the surface concentration.
In practice there is a range of binding energies of the adsorbed species
and consequently a is not a constant.
Desorption can lead to impurity accumulation in the plasma or, in
the case of desorption of the plasma species, to lack of density control.
In order to minimize the desorption processes various procedures have

9.6 Wall conditioning
Fig. 9.6.1 Energy dependence of
experimental desorption cross sections:
(a) ^He"*" incident, carbon monoxide on
nickel; (b) ^He+ incident, hydrogen
on tungsten; (c) *He+ incident, hydrogen
on molybdenum, (d) H"*" incident,
deuterium on nickel (Taglauer, E., in
Nuclear Fusion Special Issue, ed. Langley,
R.A., I.A.E A., Vienna A984).)
0 500 1000 1500 2000
Energy (eV)
been adopted for reducing adsorption on the wall. These are frequent
referred to as wall conditioning. They include (i) baking the vacuum
vessel, typically to 200-350 °C, (ii) using a variety of plasma discharges
to remove the adsorbed gas from the wall, (iii) gettering, in which the wall
is covered with a clean metal film by evaporation, and (iv) covering the
wall with a low Z film such as carbon or boron, known as carbonization
and boronization. These processes are described below.
Discharge cleaning
Surfaces are cleaned by particle bombardment in discharges carried out
prior to the main tokamak discharge. The cleaning discharge can be
of various types, including glow discharges, pulsed discharges and
discharges excited by radiation at the electron cyclotron frequency. In each
case the aim is to optimize the removal of wall impurities by
energetic ions, neutrals, electrons, or photons. These processes are more
effective than simple thermal desorption because more energy is
transferred to the adsorbed species. The cleaning process can be further
enhanced by operating discharge cleaning with a hot vessel to minimize
re-adsorption.
Glow discharge cleaning is the most widely used technique because it
is effective and simple to carry out. The DC glow discharge is commonly
combined with RP radiation at 10-20 MHz. The RP radiation provides
additional ionization, allowing the glow discharge to be operated at lower

9.6 Wall conditioning
pressure, typically 10~ Pa, resulting in fewer collisions within the sheath
and hence higher incident ion energies.
The tokamak ohmic heating system can be used to obtain pulsed
discharges with no toroidal field, thus producing poor particle
confinement and more bombardment of the walls. Although useful in conjunction
with other discharge cleaning methods, these pulsed discharges tend to
have more localized bombardment than glow discharge cleaning.
Excitation of a continuous discharge using microwaves, at the electron cyclotron
resonance has also been shown to produce effective cleaning. The spatial
position of the cyclotron resonance can be moved by varying the toroidal
magnetic field strength.
Although many gases have been used for discharge cleaning, the
light ions hydrogen and helium have generally been used as this reduces
sputtering of the substrates, which can lead to thin films of sputtered
material being deposited on windows and insulators. When using
hydrogen, surface cleaning is enhanced by chemical action with the formation
of hydrocarbons, such as CH4 and C2H4, together with H2O and CO.
Since these species are volatile they can be pumped away. In systems
with mainly carbon walls, glow discharge cleaning in helium has been
found to release oxygen, usually by forming CO. Helium glow discharge
cleaning also desorbs implanted hydrogen isotopes in the wall, thus
reducing recycling. Helium atoms are not trapped in graphite at temperatures
above 300 K.
Thin metallic films
Evaporation of wires to produce thin metallic films has been widely
used for many years as a technique for improving the vacuum,
particularly in sealed-off vacuum tubes. This process is referred to as gettering.
Fresh layers of chemically active metals react with active gases such
as O2, C0,H2, and CO2 binding them tightly to the surface. Sequential
deposition results in the adsorbed gas being buried. Many different
metals have been used, but those with high chemical reactivity and relatively
high vapour pressures at modest temperatures, typically 1500-2000 °K,
are most convenient. Titanium and chromium have been most widely used
in tokamaks, but beryllium has also been used successfully. Beryllium is
attractive in being both a good getter and having a low atomic number,
but has the disadvantage of high toxicity.
In tokamaks gettering appears to work by reducing outgassing from
the substrate as well as by removing unwanted impurity species from the
gas phase. It is necessary to cover at least 30% of the area of the vacuum
vessel for a significant reduction in impurity level to be observed. A
disadvantage of gettering is that the adsorption process quickly saturates
and it is sometimes necessary to getter between consecutive discharges.
A further difficulty is that the films flake off when they reach thicknesses
of 10-100/^m. This results in impurities entering the plasma in a
random manner which can cause disruptions. Beryllium appears to be less

9.6 Wall conditioning 465
troublesome than high Z materials in this respect, presumably because it
results in lower radiation.
Non-metallic films
Low Z non-metallic films, such as carbon and boron, have been used
to coat the walls of tokamaks in order to minimize the release of high Z
impurities. The techniques are termed carbonization and boronization. To
carry out carbonization a gaseous carbon compound, typically methane,
is introduced into the vacuum vessel and dissociated in a glow discharge,
depositing a thin layer of amorphous carbon on the wall. The optimum
wall temperature is about 300 °C and at this temperature a hard, adherent
film is formed, typically containing 40% hydrogen. This technique can
result in an order of magnitude reduction in metal concentration in the
plasma but has the drawback of initially increasing the hydrogen in the
walls, making density control difficult. The recycling can be controlled
by following the carbonization with a glow discharge in helium. A further
problem is that the optimum thickness for good adhesion is ~1 /^m and
such a film has a limited life before local erosion necessitates renewal of
the layer.
Boronization is similar to carbonization. In one approach boranes such
as B2H4 and B2H6 are introduced into the vacuum vessel at 400 °C.
They thermally decompose and deposit a layer of boron on the wall.
Boron acts as a getter and thin boron films pump both oxygen and
hydrogen. Trimethyl boron, B(CH3K, has also been used to introduce a mixed
film of carbon and boron. If a lower vessel temperature is used the rate
of decomposition of the gaseous boron compound is decreased. It can
however be enhanced by using a glow discharge. The beneficial effects
of boronization continue even after the vessel has been exposed to
atmosphere and re-evacuated. This is attributed to the low affinity of boronized
surfaces for water vapour. A similar technique uses silane, SiH4, to
deposit a layer of silicon on the walls. Silicon is also effective as a
getter but it has a significantly higher atomic number and so the tolerable
impurity concentration is lower.
The advantage of carbonization and boronization for depositing thin
films, as opposed to evaporation, is that a more uniform coverage can
be achieved. Both boranes and silane have the practical disadvantage of
being both explosive and highly toxic.
Successful wall conditioning removes impurities and generally results
in access to a much wider range of operating conditions. In particular it
allows higher densities to be obtained without excessive radiation. Higher
densities in themselves tend to reduce the impurity concentration because,
for a given power input, an increase in density reduces edge
temperatures and hence sputtering yields. The thin film techniques are valuable
in present experiments, allowing machines to be conditioned relatively
quickly and reproducibly, but they are unlikely to be satisfactory under
reactor conditions because erosion and redeposition would reduce their
effectiveness.

9.7 Sputtering
Physical sputtering
Sputtering is the removal of atoms from the surface of a solid as a result of
impact by ions or atoms. It gives rise to impurities which cause power to
be radiated from the plasma and make ignition more difficult. It also leads
to erosion of surfaces at a rate which is expected to be a limiting factor
in tokamak reactor design. Sputtering can occur due to both physical and
chenndcal processes.
When an energetic ion or neutral atom is incident on a solid surface it
produces a collision cascade among the lattice atoms. Physical sputtering
takes place when this cascade results in a surface atom receiving sufficient
energy to exceed the surface binding energy. Thus sputter yields decrease
with increasing sublimation energy of the solid and increase with
increasing energy transferred from the incident ion to the lattice atom. For light
ions such as hydrogen and helium the sputter yields are small due to low
energy transfer, the energy being dissipated mainly in inelastic processes.
There is in general a threshold energy, Ej, of the incident ion below
which insufficient energy is transferred to the lattice atoms for sputtering
to occur. Its theoretical value is
ysp(i - Xsp)
where E^ is the sublimation energy of the target solid and
ysp = Am\m2/{m\ + ^2)^, where m\ and m2 are the masses of the
incident and target atoms respectively. The energy necessary to transfer
£5 to the target atom in a head-on collision is ^s/Xsp- The additional
fraction of A — /sp) takes account of the reflection process, which is
important for light ions.
Figure 9.7.1 gives some results for sputter yields obtained from Monte
Carlo code calculations. These are generally in good agreement with
experimental data except for carbon at low energy, where no threshold is
found experimentally, due to chemical effects. Above the energy
threshold the sputter yield Y first increases approximately linearly, reaches a
maximum and then decreases at high energies. The decrease in yield is
due to the collision cascade taking place deeper in the solid so that there
is a lower probability of atoms at the surface receiving sufficient energy
to be sputtered. It is found that the position of the maximum yield moves
to higher energy as the mass of the target atom increases. The
dominant effect in determining the absolute magnitude of the sputter yield in
different targets for the same incident ion is the surface binding energy.
There is a considerable spread in the measured values of sputter yields
for nominally the same system. This is due to uncontrolled factors such

9.7 Sputtering
Fi g. 9.7.1 Energy dependence of the
physical sputtering yield for beryllium,
carbon, and tungsten by deuterium and self
sputter ions, calculated using a Monte
Carlo code. (Eckstein, W., Sputtering data.
Report PP9/82 Max Planck Institut fur
Plasmaphysik Garching, 1993.)
Sputter
yield
(atoms/ion)
10"'
-D-Be/'
i /;
/ill
Be-Be
/ l''
/,,;,',,,
w
J/ - C-C
"^-c
1 /, II,
III
-W^
.'-:
D-W -
^
1 , ,"
as surface structure and impurity levels, which can effectively change the
binding energy of the surface atoms.
The experimental results can be summarized by plotting the
sputter yield against E/Ei. There is a general semi-empirical curve which
describes the sputter yield of all ions over a wide range. This has the form
Y{E) = QS„(E/ETF)g(E/ET)
9.7.1
where Q is the yield factor, depending only on the incident ion and
target atom combination, Sn{E/TTp) is the nuclear stopping cross section,
where ^tf is a characteristic Thomas-Fermi energy and g(E/Ej) is a
threshold function. Analytical forms are available for SniE/Ej^) and
g{E/Ej). A prediction of sputtering yields at normal incidence can be
obtained for any ion-solid combination from known values ofQ,Ej, and
^TF: using eqn 9.7.1.
The sputter yield increases as the angle of incidence, 6, increases from
the normal F =0). To first order this increase varies as cos~^ 6.
However for light ions incident on heavier substrates the yield SF) increases
faster than cos"' 6 and dS(^)/d^ increases with incident energy. This
behaviour can be explained qualitatively by the increased probability of
the incident ions being backscattered to the surface. Numerical codes
based on both transport theory and Monte Carlo calculations give good
agreement with laboratory experiments. At low energies, E < 300 eV,
the variation of yield with incident angle is negligible and this is the region
of most interest in many plasma surface interactions. In practice it is
difficult to calculate the distribution in angle of incidence of ions amving
at a limiter or divertor target. The situation is complicated by the effects
of the ion Larmor radius, the acceleration in the plasma sheath and the
surface roughness. The surface roughness also varies with time dunng

operation. Typically when comparing code results with tokamak
experiments it is found that the effective yield is about twice that predicted for
normal mcidence.
The angular distribution of atoms sputtered from randomly oriented
target atoms is given to a good approximation by a simple cos 6
distribution, though strong crystalline effects are observed in single crystal
targets, leading to preferential directions of emission. The energy
distribution of sputtered atoms has been quite extensively investigated.
Theoretically it has a most probable energy of 0.5£'s(~2 to 5 eV) with
an energy distribution varying as f"^ at high energies as illustrated in
Fig. 9.7.2. This result has been confirmed by experiments in tokamaks
as well as in laboratory experiments using monoenergetic ion beams.
Atoms sputtered by heavier ions have a higher mean energy due to the
larger momentum transfer.
Chemical sputtering
Chemical reactions between incident ions or neutrals and a solid surface
can also lead to erosion of surfaces. In fusion devices the most common
of such reactions, is that between hydrogen isotopes and carbon, for
example:
4H + C ^ CH4
Carbon is widely used as a limiter and divertor material because of its
refractory qualities and the fact that it does not melt. However it has
Fig. 9.7.2 Energy distnbution of carbon
atoms sputtered from the limiter of the
TEXTOR tokamak, n^ = 1.7 x lO^'m-^,
/p = 350 kA. A calculated distribution,
assutmng a surface binding energy of
9.3 eV, IS shown for companson. (Bogen,
P and Rusbueldt, D , Journal of Nuclear
Materials 179, 196-8 A992))
CI
(a.u.)
0.5
0
/f\
'/ \l Experiment
_ ll \\ Calculation
pf H '
3 \1
1 A
I K
L \
1 \
1 \
! ^^^^^
1 1 1 ^^~-^NjW<;^^;^^;,^j_.
10 40 90 160
Energy (eV)

9.7 Sputtering 469
chemical sputtering yields which are comparable and sometimes higher
than physical sputtering yields in terms of atoms removed per incident
ion or atom. The chemistry depends on hydrogen atoms, on or in the
surface, combining with one or more carbon atoms to form a hydrocarbon
molecule. Because the hydrocarbons have a low binding energy to the
surface they may be thermally released at temperatures as low as 300 K.
The chemical reaction rate depends on the surface temperature of the
solid as well as the energy of the incident ions. The dependence on ion
energy for a fixed surface temperature and on surface temperature for a
fixed ion energy are illustrated in Fig. 9.7.3. During ion bombardment,
methane is the primary hydrocarbon produced, but lesser amounts of
heavier hydrocarbons, such as C2H4, C3H6, can also be formed as shown
in Fig 9.7.3. Unlike physical sputtering there is no well defined threshold
energy below which the yield goes to zero and so at low plasma
temperatures chemical sputtering is frequently dominant in the presence of
carbon. Experiments in tokamaks with helium plasmas show that the yield
of carbon is lower than for hydrogen isotopes, indicating that chemical
sputtering is significant.
Energy dependence 500 K
o C,„,^, for H at
•QotalforDat
'^ CH4 yield for H atom
* CD4 yield for D atom
Fig. 9.7.3 Chemical erosion yield of
pyrolytic graphite by energetic hydrogen
and deutenum ions as a function of
(a) Incident ion energy for a fixed surface
temperature of 500 K, and (b) Surface
temperature for an incident ion energy of
25 eV. In (a) the Ctotal curves refer to the
total yield of CH4,C2H2,,
C2H4, C2H6, C3H6, and C3H8
hydrocarbons due to hydrogen impact and
equivalent deutenum yields. (Mech B V.
et al., Journal of Nuclear Material 255,
153 A998).)
Temperature dependen
Temperature (K)

The break-up reactions of the hydrocarbon molecules entering the
plasma is complicated and not fully documented. However it is known
that the carbon atom or ion released has a significantly lower energy
than the energy of the physically sputtered atoms, see Fig. 9.7.2. Thus
the chemically sputtered species will penetrate less far into the plasma
and consequently will have a shorter mean residence time. The prompt
redeposition of molecular fragments is not well documented, but may
significantly reduce the effective chemical sputtering yield.
Sputtering models
It is clear from the above discussion that sputtering processes can release
impurities from the wall or limiter by an incident ion, whether hydrogenic
or impurity. The energy of the incident ions is the sum of their thermal
energy and their flow energy including that due to acceleration through
the sheath potential. Since impurity ions are usually multiply-ionized, the
acceleration through the sheath potential can result in energies greater
than 100 eV The possibility arises of impurity self-sputtering and a
consequent runaway process. Since the physics of the physical sputtering
process is well understood it can be readily incorporated into numerical
models of plasma confinement. It is routinely included in most transport
codes.
In order to illustrate the important interactive effects which occur, a
simple global model will be described using physical sputtering. The
steady state impurity concentration can be deduced from the equation for
the balance of flow into and out of the plasma
where rim and rip are the impurity and plasma densities, tm and Tp are
their respective replacement (or global confinement) times, Ym and Yp
their sputtering coefficients, and ij is the probability of a sputtered atom
entering the confined region of the plasma.
Rearranging eqn 9.7.2
and it is seen that ifr]Ym> 1 no steady state solution is possible. This puts
an upper limit on the practical edge temperature for a steady state solution.
It IS also seen that if rjYm <^ 1, the impurity fraction is proportional to
the plasma ion sputtering coefficient Yp. A global model for sputtering
can be derived self-consistenfly using eqn 9.7.3 together with the energy
balance between the total input power. Pa, the radiated power, Pr, and

the power, Pc, transported to the limiter or divertor targets
Ph - Pr = Pc = ysre(a)«pV/Tp watts, 9.7.4
where T^ia) is the edge temperature, /sTeCa) is the energy transported
to the surface per ion/electron pair, as discussed in Section 9.2, and V is
the plasma volume. Using coronal equilibrium calculations of P^ and
assumed radial profiles of density and temperature it is possible to
calculate the edge temperature and hence the sputter yields. A solution for
eqn 9.7.4 as a function of density or heating power for assumed values
of T], Tm, and Tp can thus be obtained.
An illustrative calculation to show the marked difference between low
and high Z materials is shown in Fig. 9.7.4. High radiation and high Zgff
occur at low density for tungsten because the self sputter yield approaches
unity, leading to unacceptably high effective sputter yields. Only edge
Fig. 9.7.4 Companson of radiated power
and Zeff for a tokamak with beryllium and
tungsten limiters, modeled using the
effective sputter yield defined by eqn 9 7 3
and the energy balance eqn 9.7.4. Assumed
parameters- Pr/V = IMWm"^,
Tp = TE = 0.01 s, ?) = 0.2, with radiation
functions, R=4x 10"^* Wm^ for Be,
R = \x 10-32 Wm^ for w^ 2 = 3 for Be
and W at the limiter.

temperatures less than about 80 eV give steady state solutions. On the
other hand high density leads to edge temperatures less than the threshold
for sputtering, and the impurity influx due to sputtering approaches zero.
In the case of beryllium, the effective yield never exceeds unity (at least for
normal incidence) and so in principle steady state solutions are possible
with arbitrarily high edge temperature. As the density decreases and the
edge temperature increases above the value corresponding to the peak in
the sputter yield, both the radiation and Zgff decrease, all the power being
removed by particle convection. As the plasma density increases, causing
a decrease in temperature, the sputter yield rises until the ion energy
is below 200 eV (plasma temperature < 40 eV). Since the radiation is
proportional to both electron density and to sputter influx, the radiation
peaks at a much higher plasma density than for tungsten. Only when the
edge temperature reaches about 2 eV does the sputter yield go to zero.
The above model of sputtering is much simplified and numerical
calculations are necessary to obtain a more detailed understanding and to
make reliable estimates of the screening parameter rj and the ion charge
state. Nevertheless the simple model illustrates the qualitative importance
of the vanous parameters, the interplay between radiated and transported
power and the relative advantages of high and low atomic mass materials.
Choice of materials
The choice of plasma facing materials is a compromise between many
different criteria. These include impurity production rates, structural
strength, neutron activation, and thermal shock resistance. The increase
of radiation from an impurity atom with increasing nuclear charge makes
it desirable to minimize both Z and the sputter yield. A suggested figure
of merit, Mm, is
where /; is the maximum allowed impurity concentration in the p
The larger Mm is, the less power will be radiated.
Both the sputter yield and /i are functions of Ts{a). A plot of Mm is
shown as a function of edge temperature for various materials in Fig. 9.7.5.
It is seen that, for low plasma edge temperatures, high Z refractory metals
are best while at high edge temperatures only low Z materials are
practical. This conclusion is consistent with the sputter yield curves shown in
Fig. 9.7.1. The plasma edge temperature can be calculated with certain
simplifying assumptions as discussed in Section 9.3. It increases with
increasing power and decreases with increasing plasma density. A further
factor to be considered is the probability of an impurity entering the
confined plasma. Detailed analysis would also take into account impurity
transport in the plasma.

9.8 Arcing 473
Fig. 9.7.5 The figure of ment Mm,
(equation 9.7.5), as an estimate of the
degree of contamination of the plasma by
limiter or divertor target materials Mm is
calculated as a function of plasma ion
temperature for Be, C, Mo, and W An ion
charge Z of 3 is assumed. (From Laszlo, J.
and Eckstein, W., Journal of Nuclear
Materials IM, 22 (\99\))
: Be\ \c
.mI
Mo
W
10 100 1000
r,(eV)
Arcing
An arc can strike between two electrodes in vacuum if a sufficiently large
potential is applied between them. The essential feature of the arc is that
material is evaporated from the cathode and is ionized, allowing the flow
of current. Arc initiation often occurs at a sharp point or edge where
the electric field due to the applied potential is enhanced. The voltage
required to strike an arc is very dependent on the state of the surface but
once the arc has struck the voltage between the two electrodes is in the
range 10 to 20 volts and is dependent only on the electrode material. A
flow of current in the solid to a localized point in the surface causes Joule
heating, and electrons are produced at the surface by a combination of
field emission and thermionic emission The arc occurring as a result of
an externally applied potential is known as a power arc. The presence
of a plasma can produce a 'unipolar arc', for which the required applied
potential is produced by the plasma sheath, described in Section 9.2. Since
the sheath potential is ~ STg a local electron temperature of only 5-10 eV
is necessary to sustain an arc. When the arc is initiated, electrons from the
cathode spot arc accelerated away from the surface by the sheath potential.
The flow of current locally reduces the sheath potential and therefore
increases the flow of electrons in the tail of the Maxwellian distribution
across the sheath in the area surrounding the arc. The circulating current,
/, can be derived by summing the electron flow towards and away from
the soHd surface
(-f)l

where A is the electrode area, Vc is the critical potential to sustain an arc,
and Vs is the sheath potential. A minimum current, ~10 A, is required to
sustain an arc, determined by the balance between energy deposition from
the arc, joule heating, and thermal conduction. Equation 9.8.1 thus shows
that a minimum surface area is required to sustain the unipolar arc.
Arcs give rise to erosion at the cathode spots. The material is released
in the form of ions, neutral vapour, molten and solid drops. The ion current
is typically 7 to 10% of the total arc current. The ions are released with
typical energies of 50-100 eV and in charge states up to 4 or 5. The higher
charge states tend to occur for refractory high Z metals, such as Ti, Zr,
and Mo. It is not understood why the ion energies are significantly higher
than the arc voltage drop. Erosion due to vapour emission and droplets is
more probable for low melting point metals. The droplets range in size
from 2-6 ixm and are ejected at low angles, typically 10 to 20°, to the
surface They are thought to come from the molten rim of the arc crater.
At higher surface temperatures enhanced erosion due to ejection of large
droplets is observed.
The erosion of surfaces by arcing in a vacuum diode has been
measured for a wide range of materials and different conditions It is found
that the erosion is proportional to the total charge transmitted. From Table
9.8.1 it is seen that the erosion rate varies from 05 x 10~^kg/C for
molybdenum to 2.2 x 10~^ kg/C for zinc. It is commonly assumed that
because of the similarity of the cathode spot conditions the erosion rates
for bipolar and unipolar arcs are similar. Although this appears a
reasonable assumption, there is an absence of any reliable experimental data for
unipolar arcs.
The presence of a magnetic field causes a force to be exerted on
an arc column, although in the vacuum or unipolar arc the motion is.
Table 9.8.1 Erosion due to arcing.
Element
Cadmium
Zinc
Aluminium
Copper
Nickel
Silver
fron
Tungsten
Titanium
Chromium
Molybdenum
Carbon
Erosion rate
10-^kg/C
6.55
2 15
1.2
1.15
1.0
1.5
0.73
0.62
0.52
0.4
0 47
0.17

9.9 Limiters
475
Fig. 9.8 1 Schematic representation of
arc tracks observed on curved surfaces of a
cylindrical probe exposed in the tokamak
boundary. The direction of the arc depends
on the direction of the magnetic field
surprisingly, in the direction opposite to the j x B force. This retrograde
motion is seen on the limiters and walls of tokamaks. Two types of arc
are observed, called type I and type 11 arcs. Type I arcs are formed on
surfaces having some contamination while type II occur on clean surfaces.
The type I arc runs in the impurity vapour and causes comparatively little
damage to the surface. Arcs are less likely to be initiated on a clean
surface, but when they do form they result in deeper craters and more severe
erosion of the surface The occurrence of arcs removes contaminating
layers from a surface, leading to a gradual transition from type I to type 11
arcs and an increase in the required breakdown potential The arc current
in a unipolar arc is normal to the surface and, if the surface is curved, the
direction of the force changes as the arc moves across the surface. This
results in a characteristic pattern frequently seen in tokamaks, as
illustrated in Fig 9 8.1 On a surface normal to a magnetic field, since the
current and the magnetic field are in the same direction there is no net
force and the arc moves about in a random manner
Arcing is commonly observed in tokamaks, but normally occurs during
the current rise phase, when the plasma is unstable It is difficult to assess
the impurity level produced by arcing both because of the irregular nature
of the arcing initiation process and because of the problem of
measuring the current flow in the unipolar arc Fortunately, since arcing usually
takes place at the start of the discharge and the pulse lengths of
tokamak discharges have steadily increased, arcing has become relatively
less important as an impurity production mechanism
Limiters
A limiter is a solid surface which defines the edge of the plasma. Limiters
take vanous geometrical forms as illustrated in Fig. 9.9 1 The simplest
concept IS a circular hole in a diaphragm normal to the toroidal field,
the hole diameter being smaller than the diameter of the vacuum
chamber. This IS known as a poloidal limiter. Because magnetic field lines in
a tokamak form closed surfaces, even a local or point interaction will
in principle define a boundary. In either case there will be a decreasing
plasma density radially outside the limiting surface, due to parallel losses
in the scrape-off layer, as described in Section 9 3 In the case of a
complete poloidal limiter the connection length, L, will be approximately the
circumference of the torus. In R in practice such matching of the Um-
iter with the plasma boundary is not possible. In the case of the toroidal
limiter the connection length is ~ Itt Rq where q is the safety factor The
plasma scrape-off layer will thus be broader since, from Section 9 3, the
scrape-off layer decay length A.„ = {D^^L/c^)^/'^. For the localized, or

9.9 Limiters
Rg 9.9.1 Schematic representation of
Afferent types of lirmter.
rail limiter, depending on its size and the edge value of ^, the connection
length, and hence A.„, will be longer still
A limiter plays a number of roles in tokamak operation. It serves
pnmanly to protect the wall from the plasma when there are disruptions,
runaway electrons, or other instabilities. For this reason it is commonly
made of a refractory material, such as carbon, molybdenum or tungsten,
capable of withstanding high heat loads Secondly, the limiter localizes
the plasma-surface interaction. The high power and particle'density at
the hmiter surface causes rapid removal of adsorbed gas, oxide layers and
other easily desorbed impurities When only the clean substrate remains
it is possible to maintain plasmas with lower impurity levels Thirdly, the
limiter localizes the particle recycling. A higher neutral density and more
radiation is observed in the region near the limiter, than at other positions
around the torus
As the power level in tokamaks has increased, particularly with
additional heating, thermal loads on limiters have become large, resulting
in many cases in gross melting of the surface This has been controlled
to some extent by increasing the surface area in the toroidal direction
and by shaping the limiter so that the power density is more uniformly
distributed In practice it is difficult to calculate the decay length for the
power distnbution, since there is no satisfactory model for the transport
coefficients, Dx and xx-
Materials for limiters have to satisfy a number of criteria Firstly, they
must withstand thermal shock since high power deposition rates may
occur during disruptions Secondly, they must produce as low an
impurity flux as possible, implying low sputter yields and low arcing rates
Thirdly, the impurities produced should preferably have low atomic
number in order to reduce radiation losses from the plasma Finally, limiters
must have good thermal conductivity for heat transfer These are difficult
criteria to satisfy simultaneously. Of the low Z materials, only carbon and

9 10 Divertors 477
beryllium are suitable for high heat loads. High Z materials such as
tungsten and molybdenum have good thermal properties and low sputtering
yields, see Section 9.7. In particular they have a high energy threshold for
sputtering and for this reason they have been considered for reactor lim-
iter and divertor materials Nevertheless, because of their high Z, only
very low concentrations can be tolerated in the plasma. They can thus
only be used if low plasma edge temperatures can be maintained.
Generally tokamak plasmas have been of such short duration, (< 10 s),
that the thermal capacity of the limiter has been sufficient to
tolerate the total energy deposited. However longer pulses, (>60s), have
been achieved and for future machines, steady state operation has to be
considered The design of such systems is a major engineering exercise.
The extension of the limiter area naturally leads to the idea of a
toroidal limiter running around the circumference of the torus as shown in
Fig. 9 9 1(c). Such limiters have been operated successfully in a number
of tokamaks In addition to spreading the heat load, the toroidal
limiter minimizes toroidal asymmetries and simplifies the modelling of the
boundary compared to a localized limiter
The main disadvantage of the limiter is that impurities leaving its
surface as neutrals penetrate into the confined plasma and become ionized
there The use of a divertor is one way of overcoming this problem
Whether impurity shielding due to a divertor is sufficiently effective to
justify the extra complexity and expense of the divertor has still to be
resolved
Divertors
In the case of a limiter the last closed flux surface (LCFS) is defined by a
solid surface and consequently neutral impurity atoms released from the
surface can enter directly into the confined plasma, see Section 9.9. In
a divertor the LCFS is defined solely by the magnetic field and plasma
surface interactions are remote from the confined plasma as illustrated in
Fig 9 11 In the divertor configuration impurities released from the target
are ionized and may be swept back to the target by the plasma flow before
they can reach the LCFS and enter the confined plasma. The divertor also
reduces the impurity influx in two further ways, (a) by reducing the flux
of neutrals which can reach the main plasma and therefore reducing the
flux of charge-exchange neutrals to the walls of the main chamber and
(b) by ionizing impurities resulting from any residual wall interactions in
the scrape-off layer (SOL) where they then flow along the field lines into
the divertor.
There are several possible magnetic configurations for divertors, but
the most successful has been the toroidally symmetric or poloidal field

9 10 Divertors
divertor The required magnetic field is produced by toroidal conductors
which create a null in the poloidal field and a separation of open and
closed magnetic surfaces. These divertors have the advantage of
preserving the essential axisymmetry of the tokamak and can be combined
with D-shaped or elliptical cross-sections. It has been found
experimentally that use of this divertor configuration often results in a significant
improvement in the energy confinement time, the plasma being in a state
known as the H-mode (see Section 4 13).
One of the major concerns in fusion reactor design is that of controlling
the power reaching the solid surfaces. In an ignited plasma the power
entering the scrape-off layer will be determined by the alpha particle
fusion power, less any power radiated from the confined plasma This
power then flows in a layer whose width is determined by the cross-field
thermal diffusivity, xx, and the energy loss time which characterizes the
heat flux along the scrape-off parallel to the magnetic field. With present
estimates of xx the power e-folding length in the scrape-off layer, A.p,
is typically 10 mm. A reactor sized device with a total output of 3 GW
(thermal) would produce 600 MW of alpha power and have a toroidal
circumference of ~ 50 m. Allowing for the scrape-off layer feeding two
limbs of the divertor this gives a poloidal heat flux density in the scrape-
off layer of ~ 600 MWm"^, far beyond the power handing capability of
any solid material in steady state operation
Possible ways of reducing the power density are (i) placing the target
tiles at an oblique angle to the field lines, (ii) flux expansion of the field
lines as they approach the divertor target, (iii) magnetically sweeping the
stnke point over a width large compared to A.p, (iv) radiating power in tiie
divertor before it is carried by conduction to tiie target, and (v) transferring
the energy to neutral particles in the divertor These approaches, however,
have not yet led to a fully acceptable solution and the design of the divertor
remains one of the most difficult problems in the path of fusion power
development.
A further problem is the erosion of the divertor target surface Even
if the impurities produced by sputtering or other erosion processes are
prevented from entering the confined plasma, erosion of the target can
still be serious Changes in the target thickness, due both to erosion and
to deposition of the eroded material elsewhere, make design of cooling
systems very difficult
The objectives of divertor design are
(i) Minimizing the impurity content of the plasma by having the plasma
surface interactions remote from the confined plasma and designing
the divertor particle flow so that any impurities produced at the target
cannot enter the confined plasma
(ii) Removing the alpha particle power by heat transfer through a solid
surface to a fluid transfer medium which will allow it to be transferred
from the reactor and used to generate electrical power.
(iii) Removing the helium ash resulting from the fusion reactions so that
the reacting fuel is not seriously diluted

9.10 Divertors 479
Under most circumstances the impurity production rate is determined
primarily by physical sputtering, which is in turn determined by the flux
and energy of the ions arriving at solid surfaces. Achievement of a low
plasma temperature at the target is desirable because it reduces the
sputtering yield and hence both erosion of the target and the possibility of
contamination of the confined plasma A model is thus required which
shows how the divertor density and temperature scale with the
experimentally controllable parameters, such as central plasma density and
total input power
One-dimensional model of the scrape-off layer
The basic parameters of a simple divertor plasma can be represented by
a fluid model which takes into account momentum conservation,
electron heat conduction, and the boundary conditions on plasma flow at
the target In order to obtain a simple relationship between the
densities and temperatures at the LCFS and at the target it is assumed for the
present that there are no energy or momentum sources or sinks in the
scrape-off layer Specifically radiation is neglected, although in a more
realistic model it can play an important role The model uses a simplified
geometry, treating only the region between the X-point and the target,
as illustrated in Fig. 9 10 1 The energy flow comes across the separatrix
from the confined plasma.
Fig 9.10 1 Diagram of the geometry
used for the one-dimensional, 2 point flow
model of the scrape-off layer Figure (a)
shows the geometry m the poloidal
cross-section and figure (b) gives the
simphfied geometry with the horizontal
coordinate now along the magnetic field
.AJi
Core I Separatrix \
Pl^^"^^l Private flux zone
A Target
d plate

9 10 Divertors
Momentum conservation along the magnetic field requires
nr(l+ yM^) = constant 9 10.1
where M is the Mach number of the flow and y is the ratio of specific
heats It IS assumed in the following that y = 1. M is taken to be zero
on the LCFS and is assumed to be unity at the sheath edge in accordance
with sheath theory, described in Section 9 2. Thus eqn 9 10 1 gives
n^T^^IniTi 9 10 2
where n^ and Ta, n^ and T^ are the density and temperature of the plasma
at the LCFS and target plate respectively.
Taking heat transport along the SOL to be predominantly by
conduction,
dre
^^ = -^11 9 10 3
where z is the coordinate along the magnetic field line, ^n is the parallel
heat flux density and the parallel heat conduction coefficient k = aT^
with a ~ 2000 Wm"' s"^ eV"^/^ (see Section 2 23) If there is no net
particle flow across the LCFS into the scrape-off layer it is implicit that
there must be a source to balance the flow out across the sheath In
practice this is supphed by particle recycling at the target, as described
in Section 9 3 The ionization source function determines the profile of
the density along the field Because conduction is independent of density
the temperature equations can be solved without explicitly specifying this
source, other than saying that it must be close to the target, parallel heat
convection being neglected The effect of particle sources is discussed in
more detail later in this section
For constant q\\, eqn 9.10.3 can be integrated to give
T^f^ = T'^^ + ML 9 10 4
' 2a
where L is the connection length between the LCFS and the target Taking
Tg = Ti, the power density transmitted across the plasma sheath at the
target is given by
<?ll =/s^tTtCst 9.10 5
where y^ is the sheath power transmission factor and Cst(= {ITi/m.i)^/'^)
IS the sound speed at the target plate, as discussed in Section 9 2
Taking the parameters ^n and n^ to be known, eqns 9 10 2, 9.10 4, and
9 10.5 can be solved for T^, tit and T^ The equation for Tt is
7/2, v^ ^ ( gii y^'
' ^ 2a \nuys{2Tt/m,)^/y
where m^ is the ion mass Solutions for the three parameters are plotted in
Fig 9 10 2 At low density nt is proportional to n^ and at high density it

9.10 Divertors
Fig. 9.10.2 Upstream and target
temperatures, T^ and Tt, and the target
plasma density rit, as a function of
upstream density, «„, calculated for the
one-dimensional model described by
eqns 9.10 2, 9 10 4, and 9 10 5 Input
power flux q = lOOOMWm-^, L = 50n
ysh = 10 and ion mass, A = 2
(eV)
i-^--^4-__ ^ / ^
Sheath | /\
uimted 1 Conduction limited regime
regime | , x
IS proportional to nl- When there is a sufficiently large temperature drop
that rj^^ » Ti^^, lit and Ti have the solutions,
,^^/V.
H\
Tt = 3.1 X 10^^
w
L^Pyinl
where A is the ion mass in atomic mass units.
The high sensitivity of n^ and Ti to the input parameters implies
sensitivity to the details of the model. If for example the momentum balance
along the field line is not descnbed by eqn 9.10.2, it could have a marked
effect on rit and Tt. This could arise for example from ion-neutral
collisions or from viscosity. There is experimental evidence of such a departure
at high density when the plasma may detach from the target plate, as
discussed later.
When Tl''^^Tt''^, eqns 9.10.4 and 9.10.7 give the ratio of the
temperature at the target to the upstream value
1 9 X 10^2
A,:'
L^Pyinl
from which it should be noted that a large temperature ratio requires a
low power, a long connection length or high density.

9.10 Divertors
Radial power distribution in the scrape-off layer
The steady state power flow in the scrape-off layer is determined by the
requirement that the divergence of the heat flux be zero, that is
V.g = V-gj^-F-V .g|| =0 9.10.8
where g^ ^nd q n are the heat flux vectors perpendicular and parallel to the
magnetic field. A simple one-dimensional radial model for the scrape-off
layer can be obtained by writing V • gn = ^p/L, where ^p is the value
of ^11 at the target plate. The parallel energy loss time x\\ is obtained by
taking the ratio of the energy content of the SOL to the power loss at the
target
r„ = ^^. 9.10.9
Using eqn 9 10.9, eqn 9 10 8 can be written approximately
d^r ?>nT
where r is the coordinate perpendicular to the magnetic field and xx is
the thermal diffusivity The solution of eqn 9.10.10 is
r = Ts exp(-r Ap) 9.10 11
where Ts is the temperature at the separatnx, and the scrape-off thickness,
A.p IS given by
^P = (Xxt||/3)'/2. 9.10.12
From eqns 9.10.10 and 9.10.11, A.p can be written in terms of the value
of .jx at tiie separatnx, .jxs = -«sXxdr/dr, thus
Taking eqn 9.10.9 for ^p and substituting in eqn 9.10.12 for x\\, with A.p
given by eqn 9.10.13, gives
SettingTs = Tuand^n = ^p, Tg can be eliminated from eqns 9.10.13 and
9 10.14 using eqn 9.10.4 in its approximate form, T^ = (lq\\L/2a)^l'^,

9.10 Divertors
,„ = 5„,,„-..i!%^„
5/9
^5/9 14/9
^l|t = 20x10'^- ^Wm-2. 9 10.16
Equation 9.10 16 may now be used in eqns 9 10 6 and 9 10 7 to
calculate the values of T^ and tii in terms of the energy flux, ^xs, crossing
the separatrix, which in turn can be calculated from experimental
quantities. The values qu = 0.5 MWm"^, L = 150 m, xx = lm^s~'
and Hu = 1 X 10^° m-^ give A.p = 0.01m, and <?||t = VGWm^^. The
poloidal heat flux density is lower by the factor Bp/B^ but is still of the
order of hundreds of MWm~^. The high power density in the divertor,
resulting from the narrowness of the predicted power channels, is one of
the main problems in the development of fusion reactors. As discussed
later the power flux to a solid surface must not exceed ~ 5 MW m~^. Eqn
9.10.16 shows that it is advantageous to work at high density to minimize
the heat load. When flux expansion is included it is found that it is also
advantageous to have a long connection length.
Volume losses of power in the divertor
A possible approach to minimizing power deposition on the target plates
is to radiate the power so that it can be distnbuted over a surface area
large compared to the plasma interaction area at the target plate. Some
radiation occurs due to recycling of the plasma through excitation and
de-excitation of the atoms and molecules returning to the plasma after
being neutralized at the target plate However simple estimates show that
this IS unlikely to be sufficient to radiate a sigmficant fraction of the power,
even at high density operation. An alternative is to introduce an impurity
of medium to high atomic number to enhance the radiation. The impurity
radiation from a plasma can be written
-f..n.
Pr == / nmneR{Te)dV 9.10.17
where n^ is the impurity concentration and R{T) is the radiation
parameter, dependent on the impurity species and plasma
temperature, discussed in Section 4.21. Maximum values for R{Te) are about
lO"-^' Wm^ Thus considering average values of the quantities in eqn
9.10.17, a radiated power of 1 GW requires
nmn^V > lO'^ m.-^ 9.10.18
where V is the volume of the divertor radiating region. For V ~ lOm-^ and
rie ~ lO^^m"^, an impurity fraction ntii/«e ~ 10% is required. Such high

9 10 Divertors
concentrations may lead to impurities flowing into tiie confined plasma,
causing radiation from the centre and fuel dilution. It could also cause an
unacceptable increase in the target physical sputtering rate, since heavy
impurities have a higher yield and a lower energy threshold for
sputtering than hydrogen isotopes, due to the higher momentum transfer (see
Section 9.7)
Two other volume loss mechanisms which have been considered are
charge exchange neutral losses and ion-neutral collisions. However the
ratio of charge exchange to ionization rate coefficients indicates that the
plasma temperature must akeady be low (< 10 eV) to obtain a significant
power loss by charge exchange Radiation appears to be the only way to
obtain this low temperature. Moreover, charge exchange cools only the
ions Ion-neutral collisions can produce significant cooling if the neutral
density is raised sufficiently While such an effect has been demonstrated
in plasma simulators where there is independent control of density, it has
not yet been observed in a tokamak and it is unlikely fliat sufficiently
high neutral density can be achieved without losing control of the central
plasma density
More detailed consideration of energy loss by radiation shows that
tiiere is a limit to the fraction of the total energy which can be lost by this
mechanism, due to die competition with convection across the sheath. If
pressure balance is maintained, the losses due to radiation and to
conduction both depend linearly on density. Only at temperatures below < 5 eV
are the losses due to radiation significantly greater than those due to
conduction. There is also a temperature instability at low temperature which
may make it difficult to obtain stable radiating conditions. This behaviour
is sinndlar to that of MARFES, described in Section 7.16.
Another possible approach to distributing the power in the divertor is to
produce a 'detached divertor plasma'. Such a condition has been
demonstrated experimentally in most divertor tokamaks. The neutral density is
raised until, at a critical density, which depends linearly on the power
input, both the plasma density and temperature near the target fall. It is
found that pressure balance, as given by eqn 9.10.2, no longer holds,
probably due to friction of the plasma with neutral gas. In this respect
the situation differs from the conditions when a plasma detaches from a
limiter. Although divertor detachment behaviour is not fully understood,
it appears that the momentum and energy must be transferred from the
plasma to a neutral gas 'blanket' near the target, leading to a drop in
pressure along the field fines.
When the plasma detaches from the divertor target the distribution of
the radiation moves towards the confined plasma. Because the density
at the target falls, the conducted power convected across the sheath also
falls and the ratio of radiated power to convected power increases. Under
these conditions there is no longer any obvious limit to the fraction of
power which can be radiated, although the absolute amount still depends
on impurity concentration and temperature as described in eqn 9.10.17.
The increased radiation upstream leads to very low plasma temperatures
at the target plate and the power flux to the plate drops dramatically.

9.10 Divertors
485
Ion-electron recombination is observed spectroscopically. The detached
regime occurring at high densities can be contrasted with the sheath
limited regime at low densities and the conduction limited regime at
intermediate densities. It offers a possible solution to the power exhaust
although the drop in particle flux to the target means that the pumping of
helium ash from the fusion reactions will be made more difficult.
Flow in the divertor
During normal divertor operation, ions are neutralized at the target and
return into the plasma as backscattered neutrals or thermal molecules, as
described in Section 9.3. The plasma source arising from ionization of
these neutrals near the target enhances the flow back to the target. At high
densities, when the flow across the separatrix is small, ionization near the
target is the dominant particle source.
A simple picture of the one-dimensional particle flow is presented in
Fig. 9.10.3. The ion source due to recycling is localized near the target
plate and so the density peaks near the plate and the temperature falls. The
plasma flow velocity along the field is low up to the point where ionization
occurs, and then accelerates to reach M = 1 at the sheath edge, as shown
Fig. 9.10.3 Plots of plasma parameters
along the field in the scrape-off layer of a
divertor, based on the one-dimensional
model descnbed in the text, with Tg = T,
The target plate is at z = 0 and the last
closed flux surface at z = L (a) Assumed
plasma source function due to recycling at
the target plate, (b) Plasma temperature.
(c) Plasma density, (d) Mach number of
the plasma flow.
Distance from target, z

9.10 Divertors
schematically in Fig. 9.10.3d. The flow towards the target provides a
frictional drag on the impurities, accelerating them back towards the
target, provided they do not escape beyond the region where the plasma
is ionized. However, a complication is that there are temperature gradient
forces, described in Section 2.23, which can drive the impurities along
field lines towards the LCFS. Effective design of the divert or depends on
making the frictional force due to the plasma flow towards the divertor
target large enough to overcome the temperature gradient force. For a
given power input, a high recirculating flow at the target also reduces the
average ion temperature.
One of the objectives of divertor design is the removal of the helium
ash arising from fusion reactions. Direct pumping of helium from the
plasma edge is difficult because the helium neutral density is low and
consequently a very high pumping speed is required. However, by
transporting the plasma to the separate divertor chamber and transforming
from a low density to a high density, the pumping restrictions are
significantly eased. The total helium production rate is given by the ratio
of the power output of a reactor to the power released per fusion
reaction, s. Taking e = 17.6 MeV the helium production rate is 3.6 x 10^°
atoms/GW. The maximum helium concentration which can be tolerated
in the plasma without significant fuel dilution is around 10%. Thus
taking the confinement time to be the same for helium and deuterium the
total particle flow rate will be 3.6 x 10^' ions/GW. This constitutes the
minimum flow rate across the separatrix and hence the minimum particle
flux which must be pumped at the divertor to remove the helium. Such
a flow may have to be induced by particle fuelling of the central plasma
for example by neutral beams or by deuterium or tritium pellets.
Flow in the divertor becomes much more complicated when
two-dimensional effects are considered. The particle source distribution
at the target is determined by the ionization rate. The radial profile of
density cannot be described by a simple model because there are sources
in the scrape-off layer and the behaviour is strongly affected by the
geometry of the target plate in relation to the magnetic field structure. A
high local density or temperature results in a high ionization rate. Under
some conditions the ionization rate near the separatrix may locally exceed
the flow rate to the target, resulting in a reverse flow back towards the
LCFS, as shown in Fig. 9.10.4. Such an effect is frequently predicted
in two-dimensional fluid models, although experimental evidence for
it remains sparse. The reverse flow is expected to occur near the
separatrix where the electron density and temperature and hence ionization
rate are highest. If such a reverse flow occurred under normal operating
conditions, it could allow impurities to flow easily to the LCFS.
The complex behaviour of the particles contrasts with the relatively
simple power distribution. Because the power is generated near the centre
of the plasma and diffuses out to the LCFS, there is no significant power
source in the scrape-off layer and the power flux falls of radially with a
characteristic length A.p given by eqn9.10.15. Thus, in the absence of
radiation, the power distribution is rather robust, independent of the geometry.

9.10 Divertors
Fig. 9.10.4 Schematic diagram of
particle flows in the poloidal plane of the
outer scrape-off layer, near the target plate
A widely observed experimental result is a strong asymmetry in the
power flux to the inner and outer divertor target plates. The plasma at
the inner target generally has a lower electron temperature, radiates more
strongly and detaches at a significantly lower main plasma density than
the outer target plasma. This asymmetry can largely be accounted for
by a longer connection length from the outer midplane to the inner than
the outer divertor targets, the larger surface area on the low field side
of the plasma due to its larger major radius, and the flux compression
towards the outside of the plasma due to the Shafranov shift. The longer
connection length leads to the inner divertor often being in the
conduction regime when the outer divertor is still in the sheath limited regime
and results in higher density and higher radiation at die inner target.
The asymmetry also depends on the relative direction of the toroidal field
and the plasma current, and is most marked when the ion grad B drift
direction is towards die divertor plates. This is die preferred mode of
operation because it has a lower power threshold for H-modes. When
operating with the ion grad B drift pointing away from the target plates,
slightly more power generally goes to the inner plate but the
asymmetry is much less marked. The effect of the ion grad B drift is not fully
understood but plasma flow in the SOL is expected to be influenced by
edge toroidal rotation in the plasma direction, radial drift related to
parallel temperature gradients and thermoelectric currents due to temperature
differentials between inner and outer target plates. The complexity of
these effects has meant that diey are difficult to incorporate in existing
fluid codes. Reducing the asymmetry will be important in next
generation tokamaks as the high local heat flux leads to serious engineering
problems.
General design considerations
There are many complex problems to be considered when designing a
practical divertor and no definitive solutions are yet available. In this
section the most important factors are described. Bodi double null and
single null poloidal field geometries must be considered. Double null,
with an X-point at the top as well as the bottom, allows the wall interaction

9.10 Divertors
area to be doubled, but halves the connection length to the target. It
also allows a more triangularly shaped plasma to be obtained, which is
beneficial in obtaining high fi and high energy confinement. However it
increases the complexity of the poloidal field system and decreases the
volume of the confined plasma. Stabilizing the plasma so that power flow
is balanced between top and bottom is difficult. Both present tokamaks
and future tokamak designs favour single null configurations.
Divertor operation has been obtained with a number of different target
geometries, varying from flat plates to enclosed chambers. The flat plate
target has the advantages of simplicity, good diagnostic access and of
enabling the target plates to be designed on a simple rigid structure. The
argument in favour of enclosing the divertor is that it reduces the flow of
neutral species back to the main confinement chamber, where they may
undergo charge exchange reactions in the plasma and cause sputtering of
the wall. Having an enclosed divertor chamber allows a higher neutral
pressure to be maintained at the target plate for a given plasma density.
Extensive variations in the geometrical design of divertors have been
tested, for example in ASDEX-upgrade, JET, and Alcator C-Mod. While
more enclosed geometries do result in divertor detachment at up to ~20%
lower main plasma densities, the overall operation of the divertor and the
main plasma is surprisingly little affected by the divertor geometry. It
is still unclear whether neutral density in the main plasma chamber is
predominantly due to gas flowing back from the divertor or to plasma
interactions in the main chamber itself.
Because the target tiles are heated to high temperatures there is
significant thermal expansion. This is a particular problem because the heating is
non-uniform, due to the gradient of the power distribution in the scrape-off
layer. To minimize stress in the tiles they are normally small, ~20-30 mm
square. The angle of the tiles with respect to the field lines at the target
is made as small as possible in order to increase the effective area of
the target surface. Angles as low as 1° have been used. However, due to
the finite gap between the tiles, when the angle comes close to grazing a
fraction of the tile edge is exposed to the field lines at normal incidence.
This problem may be overcome by machining a chamfer on each tile
and displacing each one with respect to its neighbour, so that the edges
are shielded, as shown in Fig. 9.10.5. This has the disadvantages that
it works for only one field direction and it reduces the effective area
of the tiles. The optimum design depends on how well the tiles can be
Fig. 9.10.5 Diagram of target tiles,
showing adjacent tiles displaced to protect
the edges at gaps. The effective interaction
area is reduced depending on the accuracy
of the tile placement.
1
\ 2° Tile angle
2 mm—H
B
*\ Interaction
surface
t^ 30 mm J
Field line
Target tiles
angle
h'

9.11 Heat flux, evaporation, and heat transfer 489
aligned. Alignment is difficult due to thermal expansion, movement due to
magnetic and vacuum forces and the large area over which the alignment
is necessary.
A further factor to be considered in reactor designs is the erosion of
the surface and consequent redeposition of eroded material elsewhere.
The gross erosion can be estimated from the incident particle flux
density. Considering an upper limit to the energy density of ~20MW m"^,
determined by thermal cooling considerations, and a plasma
temperature at the target of 10 eV, the particle flux is ~1 x 10^'* ions m^^s"^
With a typical sputter yield of 10"^ atoms/ion this corresponds to a
gross erosion rate of ~3 metres/year. Such a net erosion rate would
be intolerable in the design of the target cooling system. Because the
sputter yield is roughly proportional to energy at low energies,
variations in the plasma temperature for a constant parallel power density
do not affect this estimate until the ion energy is less than the sputter
threshold, (see Section 9.7). In practice the net erosion is much less than
the gross figure, because eroded material is ionized in the plasma and
returns to the surface to be redeposited. However, the location of the
deposition depends critically on the transport of the impurities in the
plasma.
Experimental observation shows that erosion is greatest near the 'strike
point' on the outer target and deposition is largest on the inner target,
consistent with the lower plasma temperature there. In fact much of the
deposition occurs on cooler surfaces, adjacent to the divert or target but
away from the line of sight of the ions. This is now thought to be due to
the higher sticking coefficient of the hydrocarbons on the cooler surfaces.
There is some experimental evidence that net erosion occurs at the inner
wall of the main chamber resulting in transport of wall material onto the
inner target. The deposition areas play an important role in locking up
tritium within the vessel.
Heat fiux, evaporation, and heat transfer
The power which is produced in the plasma either by ohmic heating,
additional heating or by fusion reactions, must be lost to the solid
surfaces either by radiation or by transport in the plasma. Radiation tends to
result in a uniform deposition of the power. Transport, either by
conduction or convection, results in localized power deposition at the limiters
or in the divertor since the power transfer is predominantly along field
lines. It is common in high power tokamak systems that the power
transported to the divertor or limiter is close to the limits which solid materials
can withstand. The main factors determining the integrity of a solid are
firstly evaporation, leading to erosion of the surface and contamination of

9.11 Heat flux, evaporation, and heat transfer
the plasma and secondly thermal shock, leading to the loss of structural
strength of the component.
In pulsed systems {t < 5 s), where the heat pulse is short compared
with the heat diffusion time through the solid, the power to a surface is
initially balanced by heat conduction into the bulk. The surface temperature
rise AT due to a power fiux density P{t) is given by
AT =
1
(TtlCpC)
r Pit-r)
9.11.1
where k is the thermal conductivity, C the specific heat and p the density
of the solid, and these quantities have been assumed to be independent
of temperature. For constant P eqn 9.11.1 gives
AT = 2P
\tikpc}
1/2
The materials which can withstand the highest heat fluxes are graphite
and the refractory metals wifli high thermal conductivity such as tungsten
and molybdenum. The surface temperature must be such that evaporation
is negligible. The evaporation rate, R^, is given by
i?e = 1.7 X lO^^{AT)~^'^p atomsm-^s-i
where A is the atomic mass, T the surface temperature in degrees Kelvin
and p the vapour pressure in pascals. Vapour pressure data are
available for steady state conditions and results for candidate limiter and wall
materials are given in Fig. 9.11.1. However, such data may not be reliable
under pulsed conditions or where there are impurities on the surface.
Fig. 9.11.1 Vapour pressure of a range
of first wall materials as a function of
surface temperature. (Honig, R.E., and
Kramer, D.A , Vapour pressure data for the
solid and liquid elements. RCA Review 30,
285 A969).)
1
10-^
10"*
10-'
-
-
7a
t/ /
11 1
Fe^
//f
///
/■ /
/^Ni
1
1 1
1
-Ti /
'/ /
1 /
' /
1
\l
^/ y -"'^ /
// y^Uo
/
/
-
1 III
2000 4000
Temperature (K)

9.11 Heat flux, evaporation, and heat transfer 491
In steady state the maximum tolerable heat flux is determined by the
stress due to temperature gradients between the heated surface and the
coolant. Consequently, high thermal conductivity is important. In some
designs attempts have been made to combine a low sputter yield plasma-
facing surface with a high heat conduction substrate. In these cases
thermal stress at the brazed joint may be the limiting factor in the design.
The design of such components is complex, calling for finite element
analysis of the particular geometric structure. The upper limit to what
can presently be achieved in the best designs for steady state heat transfer
is 10 to 20MW m""^ and, for high rehability, values of 2 to 5 MW m~^
are more usual. Since the design of such components depends on the
basic properties of materials, these limits are unlikely to be significantly
improved.
One of the most important factors in designing limiter and divertor
surfaces is the power distribution. Since the power density falls
approximately exponentially with radius outside the last closed flux surface it
is possible, by varying the angle of the surface to tiie magnetic field
lines, to design the surface of the limiter or divertor so that the power
per unit area is uniform. On limiters it has been found that this principle
works down to angles of ~3° between the field line and the solid surface.
At more grazing angles cross-field transport appears to be enhanced,
maintaining approximately constant heat flux per unit area exposed. In
order to handle the high power densities expected, tiles have to be
positioned with an accuracy better than 0.5 mm over distances of order InR.
Gaps between tiles can give rise to field lines being normally incident on
surfaces causing unacceptably high heat fluxes as discussed in Section
9.10. Consideration has also to be given to the distribution of the
ionization of recycled species and to pumping, particularly in the case of
divertors.
Power can also be deposited on the walls during malfunctions, such
as the occurrence of disruptions or runaway electrons. Efforts have been
made to calculate the energy transported to the surface during disruptions
but it is difficult to assess due to the problem of estimating the area of the
wall likely to be involved. For a given power density the main problem is
estimating the effect of radiation due to the evaporated material from the
wall. This radiation reduces the direct power flux to the wall by
spreading it more uniformly over a wider area. A problem which may occur
during abnormal operation is the production of a thin melted layer at the
surface. The hydromagnetic stability of this layer when carrying induced
currents which cross the equilibrium magnetic field, is also a matter of
concern.
A further difficulty is the erosion of components. Even in the
absence of evaporation, erosion occurs due to sputtering. The
impurities injected into the plasma are ionized and travel along field lines to
be deposited in regions remote from the point of erosion. This leads to
areas of net erosion and net deposition. While not a problem in
current tokamaks this could be a major difficulty in designing machines
for steady-state operation. Quantitative calculations of the net erosion

9.12 The behaviour of tritium
depend critically on impurity transport coefficients which are not known
accurately.
The behaviour of tritium
Tritium is one of the fuels for fusion reactors. Because it does not occur
naturally it is proposed that neutrons from the fusion reactions are used
to breed tritium in a lithium containing blanket (see Section 1.8). Loss of
tritium into the walls of the reactor is an economic disadvantage as well as
being a potential radioactive hazard. Very large concentrations of gas exist
in the walls of tokamaks. This gas inventory occurs due to a number of
processes including both implantation of ions and charge exchange neutrals
and to co-deposition of tritium with the vessel material in the net redeposi-
tion regions mentioned above. Ions are implanted into surfaces in contact
with the plasma along field lines after acceleration by the sheath potential.
The implanted species slow down in the lattice and are distributed
according to the range distribution. In many metals hydrogen has a high diffusion
coefficient so that after thermalizing in the lattice the atoms diffuse under
the concentration gradient through the lattice both towards and away
from the surface as discussed in Section 9.4. The equilibrium distribution
depends on the boundary conditions at the surface. For metals in which
hydrogen isotopes are dissolved exothermically the surface produces a
potential barrier. Such metals as titanium, zirconium, and niobium are
probably not tolerable because little gas is released and the tritium
inventory builds up. In metals where hydrogen is dissolved endothermically
the rate of release may be determined by a surface recombination
coefficient since, energetically, hydrogen is normally released as molecules
rather than atoms. At temperatures above 1000 K dissociation can take
place so that atoms rather than molecules are released. The equilibrium
concentration of hydrogen isotopes in the wall thus depends on the wall
material, its temperature and the ratio of plasma pulse length to the time
between pulses.
The distribution of hydrogen in the metal in the steady state is shown
schematically in Fig. 9.12.1 for the case where diffusion rather than
surface recombination is the rate limiting process. In the idealized situation
where the tritium is initially uniformly distributed in the solid there is an
analytical solution to the diffusion equation which gives the release rate
as a function of time
--At
-1/2
In practice, with a non-uniform distribution the release rate is often
a power law of similar form but with the exponent in the range

Fig. 9.12.1 Steady state concentration
distribution of hiydrogen isotopes
Implanted in a solid.
9.12 The behaviour of tritium 493
Wall thickness
—0.5 to —1.0. This is consistent with the implanted tritium being near
the surface. By raising the temperature sufficiently the hydrogen can be
thermally desorbed from the solid. The high diffusivity of hydrogen
isotopes in many metals, while generally leading to low tritium inventory in
the vessel structure, is a disadvantage from the point of view of tritium
permeation. This can be overcome by using a double wall structure with
a pumped interspace.
Understanding the implantation of hydrogen in non-metallic materials
is a more difficult problem. The diffusivity of hydrogen isotopes in carbon
and many carbides is very low. As implantation progresses the
concentration profile increases in a way determined by the range distributions of
the incident species. At a given hydrogen concentration saturation occurs
locally. Similar behaviour occurs in metals at temperatures below 200 K.
The saturated region expands as different parts of the depth distribution
increase to the saturated level. For graphite, a commonly used limiter
or target material, the saturation level is about 0.44 H atoms per carbon
atom. The saturation level per unit area is determined by the energy of
the incident ions since the higher energy ions can penetrate further and
saturate a deeper layer.
Because graphite is porous, tritium can permeate into the bulk of the
material and become trapped at lattice defects. The production of defects
by continuous neutron bombardment may increase the tritium inventory
significantly above the values extrapolated from present operational
conditions. Where the tritium is implanted close to the surface it may be
possible to remove it either by heating to 900-1100 K or by erosion of
the surface layer by sputtering. Both methods involve difficulties and will
have implications for the duty cycle of a reactor.
Another mechanism which can lead to an increase of the tritium
inventory is co-deposition of tritium with wall or divertor plate material.

The preferential erosion in some areas of the target plate and the
main chamber wall, resulting in impurity transport in the plasma and
re-deposition elsewhere (Section 9.10), can result in the build up of
hydrogen isotopes within the vessel which cannot be easily removed. Unlike
in the implantation process, the tritium resulting from this co-deposition
does not tend to saturate but builds up linearly with time. The effect has
been particularly noticed in experiments which have used tritium and
where a careful inventory has been kept. In experimental measurements
the ratio of deuterium to carbon atoms in the deposited layers which
continue to be subjected to ion or neutral bombardment is typically 0.1-0.4.
In regions shadowed from these energetic fluxes deuterium to carbon
ratios in the range 0.5-1.0 have been observed. The layers build up in the
coolest areas of the machine as the hydrocarbons released have low
sticking coefficients on hot surfaces. After reaching a thickness of ~10/Am
the deposits tend to exfoliate, resulting in the collection of dust in the
vessel. The dust is radioactive due to the presence of the tritium and is
therefore hazardous. This mechanism has serious implications for future
machines operating in tritium and in particular for reactors. The tritium
inventory has to be strictly limited for both economic and safety reasons.
Bibliography
There have been several reviews of plasma surface
interactions. The most comprehensive are:
(A) Stangeby, PC. The plasma boundary of magnetic fusion
devices. Institute of Physics, Bristol B000).
(B) Stangeby, PC. and McCracken, G.M., Plasma boundary
phenomena in tokamaks. Nuclear Fusion 30,1225 A991).
(C) Atomic and plasma material interaction data for fusion.
Supplement to Nuclear Fusion, R.K. Janev (ed.), I.A.E.A.,
Vienna.
Vol. 1 Particle surface interaction data for fusion A991).
Vol. 2 Atomic and molecular processes in edge plasmas
A992).
Vol. 3 Atomic collision processes of helium, beryllium and
boron atoms and ions in fusion plasmas A992).
(D) Behrisch, R. and Post, D.E., (eds) Physics of plasma
wall Interactions in controlled fusion. Proceedings of a
NATO Advanced Study Institute, Plenum Press, New York
A986).
(E) Langley, R.A., Bohdansky, J., Eckstein, W.,
Mioduszewski, P, Roth, J., Taglauer, E., Thomas, E.W.,
Verbeek, H., and Wilson, K.L., Data compendium for
plasma surface interactions. Nuclear Fusion, Special
Issue, 9-117 A984).
(F) McCracken, G.M. and Stott, P.E., Plasma surface
interactions in tokamaks. Nuclear Fusion 19, 889 A979).
In addition there has been a series of biennial conferences
specifically on plasma surface interactions, which provide
a useful source of more detailed information. The
proceedings are published in the Journal of Nuclear Materials
under the title 'Plasma surface interactions in controlled
fusion devices'. Some recent conferences have been
Bournemouth, UK Vols 176-177 1990
Monterey CA, USA Vols 196-198 1992
Mito, Japan Vols 220-222 1995
St. Raphael, France Vols 241-243 1997
San Diego CA, USA Vols 266-269 1999
Rosenheim, Germany Vols 290-293 2001
Gifu, Japan Vols 313-316 2003
The plasma sheath
A very large literature is devoted to the plasma sheath.
However, the high magnetic field present in tokamaks changes
the behaviour of the sheath, and particularly the operation of
probes. A comprehensive review of the sheath and of probes
is given in
Stangeby, PC, in Plasma Diagnostics, Vol. 2, A989), edited
by Auciello, O. and Flamm, D.L., Academic Press NY.
The subject is also discussed in detail in reference A.

The scrape-off layer
This subject is discussed in many papers of the current
literature and in the conference proceedings mentioned above. It
is reviewed in references A and B.
Recycling
An account of the basic processes is given in reference F.
Data on backscattering are given in reference C. More recent
summaries of data are given in,
Thomas, E.W., Janev, R.K., and Smith, J., Nuclear
Instruments and Methods in Physics Research B69, 427
A992) and International Nuclear Data committee Report
INDC(NDS)-249 Particle reflection from surfaces—A
recommended data base, I.A.E.A., Vienna A991).
Tabata, T, Ito, R., Itakawa, Y, Itoh, N., and Morita, K.,
Data on the backscattering coefficients of ions from solids,
Report IPPJ-AM18, Nagoya University A981).
Bibliography 495
Behrisch, R., (ed) Sputtering by particle bombardment,
Springer-Verlag, Berlin, Vol. I A981), Vol. II A983),
Vol. ni( 1991).
Data have been collated in
Matsunami, N., Yamamura, Y, Itakawa, Y, et al. Energy
dependence of the yields of ion induced sputtering of
subatomic solids, Report IPPJ-AM-32, Nagoya University
A983).
Yamamura, Y, Takaguchi, T., and Tawara, H., Data
compilation of angular distribution of sputtered atoms. Report
NIFS-DATA-1, Nagoya University A990).
Eckstein, W., Sputtering data. Report IPP9/82, Max Planck
Institut fur Plasmaphysik Garching, A993).
Arcing
Mioduszewski, P., Unipolar arcing, Chapter 10 of refer-
Atomic and molecular processes
A comprehensive account of the physics is given by
Harrison, M.F.A., The plasma boundary region and the
role of atomic and molecular processes in Atomic and
molecular physics of controlled thermonuclear fusion (eds
Joachain, C.J. and Post, D.E.), Plenum Press, New York,
441 A983).
Much of the atomic data necessary is given in reference C
vols 2 and 3 and in
Janev, R.K., Langer, W.D., Evans, K. Jr, and Post, D.E.,
Elementary processes in hydrogen-helium plasma, cross
sections and reaction rate coefficients, Springer-Verlag,
Berlin, A987).
A comprehensive review of fundamental atomic data and
analytical techniques is available in
H. P Summers The ADAS users manual. Version 2.2. B000).
http://adas.phys. strath, ac. uk/adas/
Wall conditioning
Wall conditioning is discussed extensively in the conference
proceedings mentioned above. A comprehensive review is
given by
Winter, ]., J Nuclear Materials 176-7, 14 A990).
Sputtering
This subject has a wide literature. A very comprehensive
account is given in the series of volumes
Limiters
Cecchi, J.L., Cohen, S.A., Dylla, H.F., and Post, D.E., (eds)
Energy removal and particle control in fusion devices.
Proceedings of a symposium in Princeton, NJ, Journal
of Nuclear Materials 121 A984).
Divertors
A recent review of the divertor experiments has been
published by
Pitcher, C.S. and Stangeby, PC, Plasma physics and
controlled fusion 39, 779A997).
For earlier reviews see general references A and B.
Heat flux, evaporation, and heat transfer
Data on evaporation is given in Chapter 5 of reference C,
Langley, R.A., Evaporation.
More comprehensive data on vapour pressure of the elements
is given by
Honig, R.E. and Kramer, D. A., Vapour pressure data for the
solid and liquid elements, RCA Review 30, 285 A969).
Tritium inventory
A good survey of hydrogen permeability and solubility under
fusion conditions is given by
MoUer, W., in reference D and in the general references
above (C) vol. 1, and (E).

Diagnostics

10.1 Tokamak diagnostics
Tokamak diagnostics
Diagnostics for tokamak plasmas have generally been developed to study
particular topics in tokamak research Five major areas of investigation
have been
(i) Study of methods of setting up stable plasmas and the investigation
of mhd instabilities,
(ii) Determination of energy and particle containment times, and
transport coefficients,
(iii) Development of supplementary plasma heating methods,
(iv) Study and control of plasma impurities.
(v) Investigation of plasma fluctuations to determine their role in plasma
transport.
The diagnostics to be discussed in this chapter will now be related to each
of these areas of research.
Because a current carrying plasma may be in an unstable configuration,
the earliest pnority of tokamak research was to establish methods of
setting up and controlling discharges free from gross mhd or positional
instabilities. To achieve this aim, a set of basic electromagnetic
diagnostics was developed to measure the plasma current, position, shape,
and mhd properties Even when gross stability is achieved the plasma
can still exhibit mhd activity. This activity has been studied with coils at
the edge of the plasma which measure the magnetic field perturbations.
Internal mhd effects have also been extensively studied with X-ray diode
systems which measure the emission from the hot central regions of the
plasma. These measurements have been of particular value in studying
the sawtooth instability, and the disruptive instability which sometimes
terminates tokamak discharges. Although the methods of establishing
grossly stable tokamak plasmas are now well developed, there is a need
to extend the range of operation. There is also continuing interest in a
variety of mhd effects, with new phenomena still being discovered.
A subject of particular interest is the measurement of the energy
confinement time This may be carried out using a diamagnetic loop to
determine the energy content, W, and calculating the confinement time
from te = W/P, where P is the power input to the plasma. However, this
is not as reliable as obtaining the plasma energy directiy from
measurements of the density and temperature profiles. The electron density has
generally been obtained using microwave phase shift methods although
reflectometry is increasingly used, particularly in the outer regions of
the plasma. A major step forward was made when the electron
temperature was first deduced from Thomson scattering experiments in which
the spectrum of light scattered by the plasma electrons from a ruby laser
beam was measured. The measurements can also determine the electron

10.1 Tokamak diagnostics 499
density. In present tokamaks the electron temperature is often determined
from electron cyclotron emission measurements. The ion temperature is
often determined from the Doppler broadening of radiation produced
by the decay of levels that are populated following charge exchange with
neutral beams. In addition, Ti may be found from the emission of neutrals
following charge exchange, or from Doppler broadening of impurity lines
excited by plasma electrons. In deuterium or deuterium-tritium plasmas
the neutrons flux and its spectrum can also determine Tj.
In experiments using RF or neutral beam heating the particle
distribution functions are non-Maxwellian In order to understand the
heating mechanisms, the electron velocity distributions have been studied
using X-ray pulse height spectrometers and the ion distributions have
been measured with neutral particle analysers operating at high neutral
energies
The importance of impurities was realized early in the tokamak
programme when it was found that it was not possible to obtain a stable
tokamak discharge in an insufficiently clean vessel. Plasma impurities
radiate strongly and the resulting reduction of rg could prevent
ignition in a reactor, and substantial impurity content would also dilute the
fuel It was also recognized that the production of reproducible
discharges depended strongly on the control of impurities. These problems
led directly to a substantial development of spectroscopic diagnostics to
examine the production and behaviour of impurities. In present
experiments, spectroscopes measure radiation at all wavelengths from the
visible through to the X-ray region. Because impurity atoms originate
from the tokamak vessel walls, limiter and divertor tiles, a set of
diagnostics has been developed to study plasma-surface interactions and the basic
physics of impurity production. Langmuir probes are used to measure the
properties of the edge and divertor plasma.
The diagnosis of the plasma in the divertor region is of increasing
importance. In this region the temperature and density are generally much
lower than in the plasma centre but many of the standard techniques can
still be used, especially those exploiting spectroscopy.
Measurements of high frequency plasma fluctuations have been
undertaken chiefly to establish possible mechanisms to account for the
anomalous transport observed in tokamaks. The principal techniques
involve the use of heavy ion beam probes, the scattering of
electromagnetic radiation, and edge probes. Both magnetic and electrostatic
turbulence are regarded as possible causes of anomalous transport.
The evaluation of these effects requires measurements of the
fluctuations of density, temperature and field strength throughout the plasma
volume and, although considerable progress towards making the
necessary measurements has been made in recent years, further work is still
required.
A great variety of other diagnostics has been developed including
measurements using pellets of solid hydrogen, beams of neutral or
charged particles, and various methods of determining the internal fields
in the plasma leading to a determination of the ^-profile.

10.2 Magnetic measurements
There is always a continuing need for the development of new
techniques For example, in reacting D-T plasmas high energy a-particles
are produced. The study of the slowing down and containment of these
particles is of critical importance and the development of suitable
diagnostics is continuing. The large tokamak experiments lead to plasma
conditions in which very large fluxes of neutrons are produced Under
these circumstances radiation hardened diagnostics are required and their
development is receiving increasing attention.
An enormous challenge is posed by the design of robust, reliable, and
radiation hardened diagnostics for the next generation tokamaks such
as ITER. There are many difficulties of access to the plasma, and high
engineering standards will be essential
Magnetic measurements
Fig. 10.2.1 Schematic diagram of coil
for measunng the component of B along n
Many properties of a tokamak plasma can be determined using simple
loops or coils of wire. Basic measurements are the plasma current, loop
voltage, plasma position and shape, stored plasma energy, and current
distribution. Information is also obtained about instabilities.
The local magnetic field can be measured using a small coil as
illustrated in Fig. 10 2.1. The principle is to determine the flux linking
the coil from the induced voltage V
V{t') dt'
10.2.1
and to calculate the average value of the normal component of the
magnetic field B from the flux using
B n =
NA'
where A^ is the number of turns and A is their average area. All
components of the magnetic field may be measured using sets of orthogonal
coils.
The toroidal field outside the plasma is determined by the external field
coils and is usually measured by only a few detector coils. The strength
and direction of the field in the poloidal plane depends strongly on the
plasma behaviour and is of more interest Magnetic coils are placed on
a measuring surface, usually the vacuum vessel, to determine the local
field in the direction normal to and parallel to the measuring surface.
The pick-up coils measuring the field parallel to the surface are best
located inside the vessel to detect fast changes which otherwise are much
reduced in amplitude by the screening effect of the vessel Such magnetic
field changes are important in the study of instabilities.

10.2 Magnetic measurements
501
Magnetic coils can be accurately calibrated, for instance by
comparison with a standard coil of known area. The main source of error
in measurements of the poloidal field is the unwanted pick-up of a small
part of the strong toroidal field. This can be corrected for by making
measurements in the absence of plasma with only toroidal field coils
energized.
In addition to the coils determining B on the measuring surface there
are also Rogowski coils to determine current, and toroidal and poloidal
flux loops to determine the total enclosed flux and the loop voltage.
Plasma current
Ampere's law relates the integral of the magnetic field strength round a
closed loop to the total current enclosed by the loop:
where d/ is an element of length of the loop. The toroidal current is usually
determined using a continuous Rogowski coil as illustrated in Fig. 10.2.2.
The coil consists of a multiple turn coil of wire which, instead of fully
encircling the plasma, returns along the axis of the coil to avoid enclosing
any net flux parallel to the current.
If the individual turns are small compared with the total size of the
coil, then B varies only slightly across a turn and the flux measured per
unit length of coil is given by
d<D = nAB ■ d/.
Diamagnetic loop
Fig. 10.2.2 Schematic diagram o
magnetic di
Poloidal field coils

10.2 Magnetic measurements
where there are n turns per unit length, each of area A. The total flux
linking the Rogowski coil is then
Using eqns 10.2.1, 10.2.2, and 10.2.3 the enclosed current is obtamed
// V{t') dt'
nAfMQ
An alternative to a full Rogowski coil is to use a number of discrete
magnetic coils surrounding the plasma as shown in Fig. 10.2.2 and
approximate the integral 10.2.3 by a summation over the coils. The plasma
current can be feedback controlled by adjusting the toroidal loop voltage
induced by the primary coil to bring the measured current to the required
value.
Loop voltage
The simplest of all measurements is that of the toroidal loop voltage
which is determined by measuring the voltage round a toroidal loop of
wire parallel to the plasma. The loop voltage is useful in determining the
resistance and the Joule heating of the plasma although the interpretation
is not always simple.
The voltage is induced by flux changes due both to currents in the
primary circuit and the plasma current itself, and consequently internal
rearrangement of the plasma current or a change in its magnitude leads to
a toroidal voltage which varies across the plasma. Only when the plasma
current and the current density profile are constant in time is the toroidal
voltage uniform across the plasma and equal to the loop voltage measured
at the surface.
Plasma surface
The shape and position of the outermost closed magnetic surface of the
plasma can be determined from the toroidal loop voltage and poloidal
field measured at many points on the vacuum vessel. Since the loop
voltages can be integrated to yield flux measurements and the local value
of poloidal field gives the gradient in flux, it is possible to extrapolate
across a current-free region to find nearby surfaces that enclose constant
flux and consequently to identify the last closed flux surface. This requires
an extrapolation from the measured poloidal flux, ir, at the wall using
V^i/f = 0. This procedure relies on measurements being made relatively
close to the plasma surface, otherwise errors in extrapolation become
large.

10.2 Magnetic measurements 503
Plasma position and shape
In addition to giving the position of the plasma surface the magnetic
measurements can be used to give the position of the centre of the
current channel. One method is to evaluate moments of the current density
profile. In the same way that eqn 10.2.2 relates the integral of the current
density over the plasma cross-section to the integral of measurements at
the boundary, other moments of the current density are related to surface
quantities and consequently can be determined. The first current moment,
for instance, gives the position of the current centre. Re defined by
■■'jfw^^^
In the simplest case where the measuring surface is a flux surface. Re is
given by
rI = (b BpR^di,
I^qI J
where j^ is the toroidal current density and Bp is the poloidal field at the
surface. Higher moments give information on the shape of the current
channel. The second moment gives the elongation, the third moment the
triangularity.
Plasma energy and internal inductance
The plasma energy can be determined from magnetic measurements
using the force balance between the magnetic field and the kinetic
pressure. There are two methods, one using the force balance along the major
radius, the other the force balance along the minor radius.
The quantities which require to be measured to determine the energy
and internal inductance are the magnitude and direction of the magnetic
field at the measuring surface, and the diamagnetic flux. The diamagnetic
flux is the difference between the total toroidal flux with plasma and that
in the absence of plasma. This flux is measured with a loop enclosing the
plasma, encircling it poloidally, as illustrated in Fig. 10.2.2. The vacuum
flux is determined either by measuring the current flowing in the toroidal
field coils or, equivalently, the toroidal field outside the vacuum vessel.
The equilibrium equations are derived by taking components of
(V X B)y.B
= Vp
Mo
and integrating over the plasma volume. The resulting equations relate
volume integrals, such as plasma energy and diamagnetic flux, to surface
integrals of the field strength. The two main equations are written in

10.2 Magnetic measurements
a non-dimensional form for a static isotropic plasma as
3y6p + /i - M = 2Ei + 52) 10.2.4
10.2.5
where y6p is the poloidal beta, related to the plasma energy through
W = ^iioRo^pI^, and /; is the internal inductance. The diamagnetic
parameter fM is given approximately by
where Bq is the toroidal field on axis and A^ is the diamagnetic flux 5i
and 52 are integrals of the magnetic field over the surface which, when
evaluated on a flux surface, simplify to
^' ^ ull^Ro J
■ /«.^-
ull^R^
where r and R are the minor and major radius vectors and dS is an outward
facing surface element. Ri is a characteristic radius of the toroidal
configuration involving an mtegral over the plasma volume which is sometimes
approximated by the radius of the current centre discussed above. Rq
is the major radius of the centre of the vacuum vessel. S\ and Rj/Rq
are both close to unity, while 52 is related to the m = 1 component of the
poloidal field and increases from a small value at low values of pressure
and inductance to ~i?/a at high values.
Care is required when using eqns 10.2.4 and 10.2.5 because there is
an arbitrariness introduced in normalizing the equations. All items are
normalized to the square of an edge poloidal field, B^, which, in a non-
circular plasma in particular, may be defined in different ways. Here B^
has been chosen as
with A the plasma area. A common alternative is
with I the length of the poloidal perimeter. For a given plasma the latter
choice gives a higher y6p.

10.2 Magnetic measurements
Equations 10.2.4 and 10 2.5 can be rearranged to give
Equation 10.2 6 is routinely used to determine the plasma energy from
diamagnetic flux measurements. In a cylinder 5i = 1 and Rj/Rq = 1,
and eqn 10 2.6 reduces to
ySp = 1 + M
showing that if y6p = 1, /i = 0 and the diamagnetic flux is zero.
Equation 10.2.7 allows the determination of the sum y6p + /i/2 from
magnetic measurements made at the measuring surface. A further
relationship exists between y6p and /; which only gives additional information
in non-circular plasmas This relation allows the separation of y6p and k
in eqn 10.2.7 and consequently there are two independent values of y6p,
one from eqn 10 2 6, often called ySjia, and one from eqn 10.2.7, referred
to as ySnihd-
For a plasma with isotropic pressure ySdia = ^mhd but in a plasma with
anisotropic pressure the two are different because the major radius and
minor radius force balance are different The perpendicular and parallel
components of y6p, ySpx, and y6p||, are associated with the perpendicular
and parallel pressures and are related to the measured betas by
/^dia = /5pJ_
ySmhd = 2*^^pJ- +/^pll)- 10.2.8
In the presence of a large toroidal rotation velocity, eqn 10.2.8 is modified
to include the rotational energy.
Instability measurements
Several mhd instabilities occur in tokamaks and they can be detected and
studied by measuring their magnetic perturbations. Using coils these
perturbations can be detected at the plasma edge even when the ampUtude
of the instability is quite small. This is because the instabilities usually
rotate due to the plasma velocity and the diamagnetic velocity, leading
to timescales 10^-10^ times shorter than typical timescales for changes
in the equilibrium magnetic field. Since magnetic coils detect the time
derivative of B, instabiUties can be detected even when their magnetic
perturbations are only 10~^-10~^ of the equilibrium poloidal field.
Instabilities at still higher frequencies can be detected at correspondingly lower
amplitude.

10.2 Magnetic measurements
Magnetic perturbations sometimes become stationary in the laboratory
frame due to a process referred to as mode locking. The detection of
such stationary perturbations is more difficult and relies on
integrating the output of several coils combined in such a way as to eliminate
the equilibrium field, and only detect toroidal harmonic perturbations
such as n = 1 or 2. Detection of stationary instabilities is
difficult at low amplitude but this is usually not a problem because mode
locking usually occurs only when the instability has grown to a large
amplitude.
By making measurements at different poloidal and toroidal locations
the structure of magnetic perturbations can be determined as well as their
amplitude and frequency. It is important to recognize that the structure
may vary across the radius, for instance there may be an m = 1, n = 1
structure in the centre and an m = 3,n = 1 structure near the plasma edge.
The magnetic coils will then be dominated by the m = 3 perturbation as
the perturbation from the more distant m = \ component falls off with
distance.
Interesting examples of magnetic activity are observed during the
current rise phase. As the value of the safety factor at the edge falls,
perturbations with decreasing m values are observed. Figure 10.2.3 shows
an example from Alcator A. The poloidal structure of magnetic
perturbations is shown along with the toroidal loop voltage, showing minor
disruptions caused by the instabilities.
Important results on Alfven eigenmodes have recently been obtained
from magnetic coils systems with a frequency response up to 1 MHz.
Analysis of this data has depended on Fourier analysis of large volumes
of data.
Fig. 10.2 3 The evolution of the loop
voltage trace and observed structure of
magnetic perturbations dunng the current
nse in Alcator A (Granetz, R S. et al,
Nuclear Fusion 19, 1587 A979).)

10.3 Interferometry
10.3 Interferometry
The refractive index for an electromagnetic wave propagating in a
collisionless magnetized plasma with its electric vector parallel to the
magnetic field ('ordinary mode') is given by
M = [1 - (col/co^)].
At frequencies which are large compared with the plasma frequency, the
change in the phase of a beam of coherent radiation passing through a
plasma compared with that of a reference beam is proportional to the
electron density integrated along the beam probing the plasma
Acj, = [Xe^/{47VSom^c^)] I n.
d/,
10.3.1
where X is the wavelength of the radiation This phase difference can, for
example, be measured by a Mach-Zehnder interferometer arrangement
as shown in Fig. 10 3.1. A laser or microwave beam of radiation is divided
into two components One of these is shifted in frequency (using, say, a
rotating grating) The second component is subdivided further into a
reference beam and a number of probing beams. If the detector is nonlinear
in the wave amplitude, (for example if it is a 'square law' detector which
gives rise to a signal proportional to the incoming power) recombination
of a reference or probing beam with the frequency shifted radiation
produces a heat signal at the difference frequency Acoq. The variation of the
phase of the probing beat signals with respect to the reference beat signal
is given by eqn 10 3.1, from which the line integral of the density may
be deduced. The beat frequency is chosen to be sufficiently high to allow
a good time resolution in the phase measurement and sufficiently low
to be electronically tractable (typically lOkHz-lMHz for far infrared
systems).
The requirement that the interferometer should be sensitive to the
electron density and insensitive to mechanical vibrations favours long
Fig. 10.3.1 Schematic layout of a
Mach-Zehnder interferometer. The laser
beam is split at S and S' and recombined at
the detectors The phase differences (p^ and
(^p reflect the different path lengths
whereas /S.<p is caused by the refractive
effects of the plasma only.
Vp,~cos(Aft)gr+(j5p+A(j5)

10.3 Interferometry
wavelengths. The requirement that refraction of the beams by
transverse density gradients be minimized favours short wavelengths The
choice of the radiation source is determined as a compromise between
these competing requirements For the diagnostics of tokamak plasmas,
wavelengths between 10 and 2000/zm have been used. Several types of
square-law detector can be used at these wavelengths- room temperature
pyroelectric crystals that are simple and inexpensive; liquid helium-
cooled indium antimonide crystals that have high sensitivity, or Schottky
diodes that have good response at high frequencies. When possible, the
interferometer frame is built to stand independently of the tokamak to
avoid vibrations of the optics When this is not possible two
interferometers operating at different wavelengths but using the same optical path
may be used The phase shift due to the electron density is proportional to
the wavelength, X, while that due to vibrations is inversely proportional to
X, so that a measurement of the net phase shift at two wavelengths allows
the mechanical displacements and the electron density to be determined
separately. Figure 10.3 2 shows an example of such a 'two-colour' phase
measurement
Given a large number of sight lines viewing the plasma from several
different directions, it is possible to deduce the local electron density
from the line-integrated interferometric measurements by tomographic
inversion (see Section 10 8). However, access restrictions often give rise
to a limit of 5-10 vertical lines of sight. To obtain the local electron
density from such a small number of measurements, it is necessary to
assume that the surfaces of constant density are known Usually it is
Fig. 10.3.2 Typical data from a
2-wavelength interferometer on JET:
(a) phase shift versus time (X = 195 fim),
(b) phase shift versus time
(X = 118 8/im), (c) net Lne-integrated
electron density versus time
0
-20
Fnnges ^q
-60
12
Kd/ «
(lo'V^)
4
0
1 (a)A=195/m/—.
{h)X=U9fim I ^
"(c) f\
y \
/ \
~ / \^
/ 1
0 4 8 12 16 20 24
Time (s)

10.3 Interferometry
Fig. 10.3.3 Time evolution of the
density profile in a pellet fuelled discharge
in JET Each pellet produces a
discontinuous increase in plasma density
The first pellet is injected at 2 s and the
three subsequent ones lead to a i
density at about 3 5 s At later ti:
density profile broadens
assumed that they coincide with the tokamak flux surfaces, since these
are isobars and, due to the high parallel heat conductivity, isotherms. If
the iso-density surfaces are concentnc circles, the local density, ng{r),
is given analytically in terms of its line integral along the x-direction,
Ne{x), by the Abel transform
rieir) =
dNeix)
1
dx (x2-r2)l/2
dx.
For more complicated iso-density contours a numerical procedure
analogous to the Abel transform is performed. Contributions arising from
density on the outer surfaces are subtracted for chords probing
progressively further into the plasma to obtain the contributions of the inner
surfaces. Figure 10.3.3 shows the time evolution of the local electron
density obtained by Abel-inversion in a discharge fuelled by injection of
frozen deuterium pellets.
Polarimetry
Coherent radiation is charactenzed by its polarization as well as its phase.
For propagation parallel to a magnetic field in a plasma there is a
difference in the refractive indices of right and left circularly polarized
radiation, arising from the gyration of plasmas electrons, which in one
case is in the same direction as that of the polarization while in the other
it IS counter to it. It can be shown that
ap- (co ± (Wee)
A linearly polarized wave can be decomposed into right and left circularly
polarized components. The difference in the refractive indices of these

10.3 Interferometry
Fig. 10.3.4 Schematic layout of the
TEXTOR polanmeter (from
Interferometry and Faraday rotation
measurements on tokamaks, Soltwisch, H
International School of Plasma Physics,
Varenna, CEC, B
Wire gnd
components gives rise to a rotation of the polarization vector known as
the Faraday effect. The angle of rotation is given by
Sn^c'^soml
/.-
and can be used to measure the internal poloidal magnetic field of a
tokamak.
The wavelengths which are used for interferometric measurements
are also suitable for measuring the Faraday effect, although the rotation
angles tend to be rather small (~1°) except in large tokamaks where
the path length is long. Figure 10.3.4 shows a typical polanmeter. A
polarizing gnd, made of uniformly spaced tungsten wires, placed in
front of the interferometer detector reflects the component of the
probing beam an sing from the Faraday rotation into the polarimeter detector.
For small rotation angles, the ratio of the amplitudes of the signals at
the two detectors is proportional to the angle. Unlike the interferometer
measurement, this measurement makes use of the relative amplitude of
the signals. It therefore requires a calibration, which is performed by
rotating the polarization of the probing beam by a known angle using a
quartz half-wave plate and recording the signal amplitudes. Other
possible arrangements involving modulation of the polanzation angle only
require a phase measurement (analogous to the interferometric
measurement), thus obviating the necessity of calibration of the system. The
lack of efficient polarization modulators has meant that the polanzation
modulation technique has found few applications in tokamaks.
Faraday rotation measurements of the poloidal magnetic field
distribution have been made on several machines (for example see Fig. 10.3.5)
and this has led to a maj or reas ses sment of the theory of sawtooth
instabilities The original theory of Kadomtsev postulated that a sawtooth leads

Fig. 10.3.5 (a) Profile of electron
density across major radius (b) Measured
fluctuating part of n^ at different radii
(c) Deduced current density profile
(d) Safety factor profile The data was
taken for a sawtoothing discharge in
TEXTOR (Soltwisch, H etal, Plasma
Physics and Controlled Nuclear Fusion
Research (Kyoto) 1, 263, IAEA A987))
10.4 Reflectometry
(a)
n
A0'%
6
4
-')
2
r A
/ \
/ 1 2 3 4 5 6 7 8X9
to complete reconnection of the poloidal flux within the sawtoothing
region, raising the safety factor above 1 everywhere. In contrast,
several experiments beginning with TEXTOR concluded from polarimetric
measurements that the safety factor can remain well below unity (~0.7)
throughout the sawtooth penod (see Section 7.6).
Reflectometry
An alternative method for measuring the electron density is
reflectometry. In this method microwave radiation with frequency co is launched into
the plasma along the density gradient and reflected at the layer where the
electron density equals a critical value, Uc. A diagram of a reflectometer
system is shown in Fig. 10.4.1. Phase changes in the reflected radiation
are measured by mixing this radiation with a reference beam in a detector.
The relative positions of the different density layers in the electron
density profile are determined by making the measurement with a range of
different probing frequencies. Alternatively, movements of a single layer
are measured by holding the source frequency constant and measuring
the phase output of the reflectometer.
At microwave frequencies the radiation can propagate in two
independent modes: the ordinary mode and the extraordinary mode, and this gives
different possibilities for reflectometry. For propagation at nght angles to

10.4 Reflectometry
Fig. 10.4.1 Schematic diagram of a
microwave refiectometer Radiation at
angular frequency cu is reflected at the
cntical density layer and combined with a
reference beam Movements of the cntical
density layer, or changes in a>, give nse to
fringes in the reflectometer detector.
Path to plasma
—<— Source, ft)
Reference path
—y— Detector
the magnetic field, the ordinary mode is polarized with the electric vector
parallel to B and total reflection occurs at the cntical density when
is the plasma frequency. The extraordinary mode is polarized with the
electnc perpendicular to B and in this case, total reflection occurs when
(WU.L =
2 '
(Wee = eB/rrig is the electron cyclotron frequency, and (uu and col are
known as the upper and lower cut-off frequencies. The corresponding
critical densities may be found from the equations assuming that B is
known. Since the electron density and magnetic field are a function of
position, (Wpe, coxj, and (Wl depend on position. In pnnciple, the layers
corresponding to cope,co\}, and (Wl can all be used for reflectometry. In
practice, most measurements have been performed thus far using the copg
layer, with a few using the cov layer.
Full wave calculations show that the total phase delay of an ordinary
mode wave dunng propagation in the plasma and reflection at the cut-off
layer is
ii{R)AR-
where the integral is along the major radius, R, and
IS the refractive index for the ordinary mode. i?ant is the position of the
launch and receive antenna, and i?c is the position of the reflecting layer.

10.4 Reflectometry
Differentiation with respect to co and apphcation of the Abel integral
equation gives
Rcicol) --
c r^ d.
njo di
\(i) ((Wpg — or)
,2I/2
Hence, in order to determine the position of the reflecting layers, it is
necessary to measure d(/>/da) for the range of frequencies between 0
and (Wpe. In practice, measurements will not be possible down to zero
frequency and the missing data have to be provided from other sources,
for example by extrapolating measurements made with Langmuir probes.
Two approaches to implementing reflectometry have been developed.
In one, the frequency is swept over a broad range and d(j)/dco is measured
as a function of frequency. In the other, the output from an array of
independent sources with different probing frequencies is combined into
the same waveguide, and the frequency of each source is swept over a
narrow range to give d(j)/dco at each frequency. The dependence ofd(j)/dco
on frequency is constructed by interpolation. Each method has its own
strengths and weaknesses and areas of optimum application.
Figure 10.4.2 gives an example of measurements using a multiple
frequency, narrow band sweep system or JET. The system has twelve
frequencies probing densities in the range 4 x 10^^-8 x 10^^ m~^. It has
an effective time resolution of 5 ms and can measure several hundred
profiles in a plasma pulse.
Experiments have shown that the electron density is a rapidly
fluctuating quantity. Measurements of the characteristics of the fluctuations are
important because of their role in the transport of energy and particles.
Reflectometry has the potential to provide information on the density
fluctuations and a special technique, correlation reflectometry, is being
Fig. 10.4.2 Electron density profiles
measured with the multiple frequency,
narrow band sweep system on JET In the
flat regions no measurements were made
3.50 3.75 4.00
Major radius (m)

10.5 Measurement of electron temperature
developed specifically for this purpose. In this technique relatively small
sampling volumes are chosen at two or more different locations in the
plasma. Fluctuations in the electron density in the sample volumes give
rise to fluctuations in the measured reflected signals. By choosing the
sample volumes at different locations, and by analysing the measured
signals using correlation techniques, the size and movement of the
density perturbations can be determined. Preliminary measurements on a
number of tokamaks have shown that fine-scale density structures exist
in the plasma and that the size and movement of the structures depend on
plasma conditions.
Measurement of electron temperature
The electron temperature is measured routinely on most tokamak plasmas
by two independent methods: the scattenng of laser light from the
electrons (Thomson scattenng), and the measurement of the emission
due to the Larmor motion of the electrons around the magnetic field lines
(electron cyclotron emission).
Thomson scattering
In the case of Thomson scattering, the electron temperature is determined
from the degree of broadening of the spectrum of the scattered laser
radiation. The power scattered per unit solid angle in the frequency bandwidth
dco can be calculated from electromagnetic theory and is given by
Ps = Po^e sin^ en^LS{k, co) Aco,
where Pq is the total incident laser power, r^ = e^/Anequiqc^ =
2.82 X 10~^^ m IS the classical electron radius, 9 is the angle between
the incident and scattered rays, L is the interaction length, and S{k, co)
is the spectral density function, which depends on the Founer spectrum
of the fluctuations giving rise to the scattering and has to be calculated
for individual cases. In the spectral density function co is the difference
between the scattered and incident frequencies, and k is the magnitude of
the scattering vector k which is the difference between the incident and
scattered wave vectors. For a thermal plasma
S{k, CO) Acj = re(Xe) dXe -F Z
ri(x,)dx„
where Z is the ion atomic number, Xg = o/kvj^, Xj = cj/kvi^ and
a = {kXD)~^ is the scattenng parameter. F, the Salpeter function, is
strongly dependent on e,"^ In the scattered spectrum, the two terms in

10.5 Measurement of electron temperature 515
this expression produce a narrow peak with a width of order of magnitude
kvi^ superimposed on a broad peak with a width of order kvj^. When a
is small (short wavelengths) the spectrum is dominated by the broad peak
and so T^ can be determined. The dependence of Ps on tie allows its
determination by measunng the absolute level of the scattered power.
Neglecting relativistic effects when a < 1, the function S{k,ct)) is
simply related to the one-dimensional Maxwell velocity distribution of
the electrons along the direction of the scattering vector, k. This
approximation produces only small errors at temperatures below ~ 1 keV. At
temperatures of several keV relativistic effects have to be taken into
account and it is necessary to use the relativistic Maxwell distribution
when calculating the scattered radiation frequency spectrum. The
spectrum has a characteristic blue shift and departs from the Gaussian shape
associated with low temperature Maxwellian distributions, both effects
increasing with temperature.
The expression for the scattered power includes a factor r^
(8 X 10~^° m^) and so the scattering effect is very weak. Multimegawatt
pulsed lasers (ruby or neodymium) are therefore needed. Stray laser light
scattered in the apparatus and emission from the plasma are potential
causes of large spunous signals and so great care has to be taken in the
design of scattering systems to minimize these effects. Very efficient
dispersing instruments, such as a set of tilted interference filters, and
sensitive detectors, such as gated photomultipliers, are employed.
A multipulse Thomson scattering system is installed on the ASDEX
tokamak. Light from a high repetition rate Nd: YAG (neodymium: yttrium
aluminium gamate) 60 Hz laser with a 1064 nm wavelength passes
vertically through the plasma as shown in Fig. 10.5.1. Sixteen separate
three channel polychromators fitted with avalanche silicon photo-diodes
Fig. 10.5.1 High repetition laser
scattenng system on the ASDEX tokamak
Light from the Nd-YAG laser is scattered
by the plasma into one of the
polychrometer detecting systems
(Rohr, H , Steuer, K -H , Murmann, H ,
and Meisel, D Proc of High-Power Solid
State Lasers and Applications, Ed Ireland,
C L M , SPIE 1277, 154 A990).)
Reference signal
ifeNi]
Nd-YAG-Iaser |

10.5 Measurement of electron temperature
Fig. 10.5.2 Three-dimensional plots of
Te and «e, dunng an ASDEX discharge
with neutral injection heating applied from
1 3 to 1 6 s z IS the vertical position
coordinate (Rohr, H , Steuer, K -H ,
Murmann, H , and Meisel, D Proc of
High-Power Solid State Lasers and
Applications, Ed Ireland, C L M , SPIE
1277, 154A990))
(lo'V^)
spectrally analyse and detect the scattered radiation. Stray laser light is
rejected with dielectric mterference filters. The electron temperature and
electron density are measured at 16 spatial points along the vertical chord,
and the measurements are repeated every 17 ms during the duration of
the plasma pulse. Typical results are shown in Fig. 10.5.2.
Another method of measuring the T^ and n^ profiles by Thomson
scattering has been introduced. The LIDAR (Light Detection and
Ranging) time-of-flight principle is used to obtain the spatially resolved
information. The spectrum of the backscattered light, generated by a short
laser pulse as it traverses the plasma, is recorded as a function of time
by a fast detection and recording system. Analysis of the scattered
spectrum at each time point yields T^ and n^ in the usual way. The position
of the laser pulse within the plasma is known at each time point and so
the spatial dependences of T^ and Wg are obtained. The principle of the
technique is illustrated in Fig. 10.5.3.

10.5 Measurement of electron temperature
Fig. 10.5.3 (a) The pnncipie of LIDAR
IS shown The very short laser pulse
successively illuminates different parts of
the plasma at fi, fa, f3 (b) The dispersed
signals of the scattered radiation at three
different wavelengths as a function of time,
or, equivalently, major radius (c) Electron
density and temperature profiles deduced
from the scattered spectra at different
times The considerable nse in n^ and Tg
was a consequence of the 13 5 MW of
additional heating which was applied at 6 s
Signal in spec
^K
tral channels
^
Time
An operational LIDAR Thomson scattering system is installed on the
JET tokamak. The ruby laser has a pulse energy of 3 J, a pulse duration of
300 ps and repetition rate of 0.5 Hz. The laser and all sensitive components
of the detection system are located outside the concrete biological shield.
The laser beam and the collected scattered light are passed in and out
through a labynnth penetration in the torus hall ceiling. In the torus hall the
laser beam is directed towards the torus inner wall by a dielectric mirror
mounted outside the torus. The backscattered light is collected by a folded
sphencal mirror system through an array of six windows surrounding
the laser input window on the vessel. The light is spectrally resolved
with a spectrometer which utilizes a stack of edge interference filters
irradiated at slightly offset angles of incidence. The light is detected with
a gated microchannel plate photo-multipliers and the signals are recorded
with fast transient recorders with an 800 MHz bandwidth. The spatial
resolution is determined by the combination of the laser pulse length
with the detector response time and is ~10 cm. This is considerably less
than the 1.2 m minor radius of JET and so the T^ and n^ profiles are well
resolved. Typical results are shown in Fig. 10.5.4.

10.5 Measurement of electron temperature
J
10
T
rkeV)
X08 6s
/ \
rP \\74s
// \1,
// f=6.2s \\
/7 ^^"^\
^^=^^— p5.o^ Ir:r-^^^^
(b)
(lo^V-^)
/ J - \
Fig. 10.5.4 Typical
R(m)
of Te and «e at different times for a JET pias
Electron cyclotron emission
In contrast to Thomson scattenng, the measurement of electron cyclotron
emission (ECE) is a passive technique. The electrons of a
magnetically confined plasma gyrate around the field lines and as a consequence
emit electromagnetic radiation. This radiation occurs at discrete angular
frequencies co = ncoct, where n is the harmonic number. Under some
circumstances, the intensity of the emission is directly related to T^.
In order to calculate the observed emission it is first necessary to
calculate the emission per unit volume, j„ {co), and then to take into account the
transport of the radiation as it propagates through the plasma including,
in particular, the effect of re-absorption.
One method of calculating j„ {co) begins with the equation of motion
of an electron moving under the influence of the Lorentz force in a static
magnetic field. Classical electrodynamics is then used to compute the
coefficient of spontaneous emission for a single particle, r]n{co). An
integration over the electron velocity distnbution then gives jnico)-
The calculation is extremely complicated in the general case. A wide
range of electron energies and densities can be involved The emission is
broadened by collisions, particle motions, and relativistic changes in the
electron mass, and it can be affected by the dielectric nature of the plasma.
The electron velocity distribution need not necessarily be Maxwellian and
the plasma will not generally be in complete thermodynamic equilibnum.
In present tokamak plasmas the electron temperatures are usually
< 10 keV. The plasmas are usually observed at angles close to
perpendicular to the confining magnetic field. The electron densities are < 10^° m~^
so that the single particle emissivity is generally applicable. Under these
conditions, and assuming a Maxwellian electron velocity distribution, the

10.5 Measurement of electron temperature
emission is given by
2 c (n — 1)! \2msC^ J
X {I + cos^ 9)8{CO - ncOcs)F,{n, 9), 10.5.1
where Wpe is the electron plasma frequency, 9 is the angle between the
direction of emission and the confining magnetic field, and Ib{co) is the
black-body radiation intensity. Fi{n,9) is a complicated function of n
and 9. The index i signifies that the function is different for the ordinary
and the extraordinary modes.
Some charactensties of ECE arc immediately obvious from eqn 10.5.1.
The strength of the emission depends on 9 and, as stated above, it has a
line spectrum. The relative intensities of the harmonics are independent
of the electron density but are a strong function of the electron
temperature. The emission is predominantly in the extraordinary mode (polarized
emission) and the two modes have different angular dependences.
Transport and re-absorption of the radiation need to be taken into
account using a model of the radiating medium. Usually, the classical
model of a radiating plasma is employed. This shows that the radiation
transport is governed by the equation
^^Ts [^1 " ^^"^^ ~ oc{(o)I{co), 10.5.2
where I{co) is the radiation intensity, a{co) is the absorption
coefficient, and /i is the refractive index. In a plasma in local thermodynamic
equilibrium Kirchhoff's law gives a simple relationship between j{a))
dXiAaico)
4^ = ^bM. 10.5.3
^,^a{co)
For a homogeneous slab of plasma of thickness L eqn 10.5.2 can then be
integrated using 10.5.3 to give
I{a)) = h{a))[\ -
r{co) = — a{co)ds
is the optical depth. When r <g: 1 the emitted radiation suffers negligible
re-absorption and the plasma is said to be optically thin. When r > 1
substantial re-absorption occurs and I{co) = /b((w). Under this condition
the radiation intensity is simply related to the plasma temperature and
this forms the basis of the emission as a means of measuring T^.
Tokamak plasmas have a spatially dependent magnetic field and this
leads to the possibility of obtaining spatially resolved information from

10.5 Measurement of electron temperature
a measurement of ECE. The main component of the magnetic field is the
toroidal field, 5^. This field varies inversely with the major radius R and
is constant along a vertical chord, that is
where Bq and Rq are the values of B^ and R at the centre of the plasma.
This spatially dependent magnetic field has a substantial effect on the
character of the ECE. It means that for observation at right angles to
the magnetic field and along R, there is a simple relationship between
the frequency of the emitted radiation and the location of the point of
where n is the harmonic number. For tokamak plasmas, some of the
emission lines are optically thick, some optically thin and some are
intermediate. Because of the magnitude of the magnetic fields employed,
ECE occurs at long wavelengths (typically millimetres) and at these
wavelengths the Rayleigh-Jeans law applies. The intensity in an optically thick
harmonic is therefore
and so a measurement of the intensity of the emission in an optically
thick harmonic gives T^iR). The optically thin harmonics give other
diagnostic possibilities, for example the determination of the electron
density profile ne{R).
In practice several effects can reduce the usefulness of the
measurements: (i) the variation of the magnetic field across the plasma can be
so large that two or more harmonics are resonant at the same frequency
from different spatial locations (harmonic overlap), (ii) the current in
the plasma generates a magnetic field which can be 10% or more of the
toroidal field, (iii) finite density effects can prevent the radiation from
propagating, and (iv) refraction can give uncertainty in the direction of
view. The consequences of these effects can be quite substantial and have
to be taken into account in any application of this diagnostic.
The magnetic fields used in present tokamaks are usually in the range
2T < 5 < 8T and so the electron cyclotron emission occurs in the
frequency range 60 GHz < f < 600 GHz E mm > A > 0.5 mm). Four
different instruments for measuring the emission have been developed:
microwave heterodyne radiometers, Fourier transform spectrometers,
Fabry-Perot interferometers, and diffraction grating spectrometers.
These instruments have different characteristics. For example, the
microwave heterodyne radiometers are very sensitive, have a high
spectral resolving power and fast time-response, but current technology limits
the application to frequencies below about 150 GHz. On the other hand.

10.5 Measurement of electron temperature
521
Fourier transform spectrometers are well suited to measuring the whole
spectrum of the emission at moderate time and frequency resolution.
Present ECE systems usually incorporate more than one type of
instrument and view the plasma along several different sightlines. The radiation
is transmitted to the measurement instruments using either waveguides
with dimensions much longer than the wavelength or with beams having
a Gaussian shaped intensity pattern (quasi-optical beams).
An example of a modem system is that installed on JET. Radiation from
the plasma is collected by antennas mounted in the vacuum vessel and
transmitted to the torus hall with long (~40 m) oversized waveguide runs.
There are ten different sightlines in the poloidal cross-section. The system
incorporates all four types of measuring instrument and is calibrated by
mounting large area calibration sources in the vacuum vessel.
Measurements of ECE are used routinely in the determination and
assessment of plasma performance, and in studies of a wide range of
plasma physics phenomena. The capability to measure T^ continuously
in time with a time resolution < 10/iS, and localized in space with a
spatial resolution of a few cm, makes measurements of ECE a powerful
technique for the study of a range of phenomena including mhd
oscillations, sawtooth activity, and ELMs. One important application is the
measurement of the speed of outward propagation of the heat pulse
following a sawtooth collapse from which the electron thermal conductivity
is determined. Some measurements which illustrate the capability of the
technique are shown in Fig. 10.5.5.
A comparison of the Thomson scattering and ECE measurements
allows a check on the measurements. On some tokamaks, such
comparisons are made automatically and routinely. An example is given in
Fig. 10.5.6.
Fig. 10.5.5 ECE measurement of
electron temperature in JET as a function
of time and radius. Mhd oscillations
associated with a sawtooth crash give rise
to variations of T^ which are clearly visible
towards the plasma centre (i? ~ 3.1 m).
(keV)

10.6 Ion temperature and the ion distribution function
8
4
0
-
I
J V
A
P
/
/' LIDAR
i\ ECE
\
1
Major radius (m)
Fig. 10.5.6 Comparison of T^
determined by ECE and LIDAR
measurements Good agreement is found
for both (a) the profiles for a particular
discharge and (b) the averaged central
temperature for a wide range of different
discharges. The contour shows the region
within which 90% of the measurements lie.
2.5 5.0 7.5 10.0
r^(keV), LIDAR
Ion temperature and the ion distribution function
The ion temperature, Tj, and the ion distribution function are important
plasma quantities. Often Tj 7^ Tg because the ion-electron equilibration

10.6 Ion temperature and the ion distribution function 523
time is comparable with or longer than the ion energy confinement
time. Ion distribution ftinctions in additionally heated discharges
generally depart from a Maxwellian distribution. In small and medium
size tokamaks, neutral particle detectors have been used to measure both
the thermal and non-thermal parts of the ion distribution function, but
in the larger tokamaks these measurements become much less useful
because neutrals produced at the plasma centre are absorbed before
reaching the plasma periphery. In D and DT plasmas, the ion temperature and
some features of the distribution functions are also determined from
neutron and gamma-ray measurements. In tokamaks with neutral beams, Ti is
now generally determined from the Doppler broadening of line radiation
observed in charge exchange spectroscopy.
Neutral particle production
The ion temperature in a hydrogen plasma can be measured by
analysing the energy distribution of charge-exchanged fast neutrals
escaping from the plasma. The method depends on the existence in the plasma
of a low density of neutral atoms. A brief outline will be given of their
origin and transport within the plasma. The neutrals arise from atoms or
molecules released by the walls of the vessel. Recombination of electrons
and ions within the plasma can also form neutrals but this mechanism is
of less importance except at very high plasma densities and at the centre
of large plasmas.
At the plasma edge, many processes can contribute to the production of
neutral hydrogen atoms. One process leading to neutral atom production
is dissociation by electrons of hydrogen molecules released from the wall
H^ + e ^ H° + H° + e,
where the neutral atoms formed will have an energy of at least a few eV.
Some of these neutrals will immediately escape from the plasma, but
others will undergo further charge-exchange reactions with plasma ions,
in each case producing a new neutral atom. These secondary neutrals will
either escape from the plasma or undergo a further charge exchange
reaction, with the process continuing until the secondary neutral becomes
ionized or escapes. At low neutral energies, charge exchange is much
more probable than ionization, thus allowing several generations of
neutrals. By this means a low density of hydrogen atoms can penetrate to the
centre of the tokamak plasma. Monte Carlo calculations are used to model
the radial distribution of the neutral density, no, which is typically many
orders of magnitude less at the plasma centre compared with the edge.
The neutral density gives rise to a flux of neutral energetic plasma
particles escaping from the plasma. The source function for the escaping
flux is
,(«i)/
Sivi) = n.riQ fiivi) / CToilui - vo\ /o(i;o)d-^uo,

524 10.6 Ion temperature and the ion distribution function
Fig. 10.6.1 Charge-exchange
cross-section ctqi and croi Vi for H" -(- H"*".
.^-\
Ob
-
/oi
><:"
Uj
^^-—
"^•^^
\
\
\
-\ \
\ \
\ -
j; miUi'(eV)
lO"* 10^
where ctqi is the charge-exchange cross-section and fi and /o are the
velocity distribution functions of the ions and neutrals. 5 can be written
in terms of the averaged charge exchange rate as
S{vi) =nino{aoiVi)fi{vi).
10.6.1
As can be seen from Fig. 10.6.1, neither ctqi nor ctqi | Uj — uq I vary rapidly
with neutral velocity over the range of interest in typical tokamaks and
S is consequently approximately proportional to /[(vi). Analysis of the
source function, S, gives the ion distribution function and in particular
allows the determination of Tu as discussed below.
Tifrom neutral particle analysis
For a Maxwellian plasma the source function for the distribution of the
escaping flux is, from eqn 10.6.1,
1/2
SiEo)=nQni{aQiVi)
^1/2t3/2
where Eq is the energy of the neutrals. A measurement of the intensity of
S{Eq) as a function of energy will therefore determine T\ andno assuming
a knowledge of n;. In practice, the integral of ^(Eo) along the line of sight
of the detection system will be measured.
If the flux of escaping particles is to give a correct value of T\ it is
important that the mean free path of the neutrals is much greater than the

Fig. 10.6.2 Schematic diagram of
neutral particle analyser with E parallel tc
B (Corti, S. p. 477, Diagnostics for
contemporary fusion experiments (Eds
Stott, P.E., etal.), Editrice Compositori,
Bologna A991))
10.6 Ion temperature and the ion distribution function
Carbon foil
Magnet pole piece
H° trajectory
plasma minor radius, a. That is
1
> a.
niCToi
This condition is most likely to be satisfied at higher energies because
CToi decreases with energy.
Typical detection systems for measuring the neutral flux will contain
a gas stripping cell or thin carbon foil to ionize the incident neutrals
and a combination of electrostatic and magnetic fields to determine the
particle's energy and momentum, andhence its mass. In some systems the
neutrals are electrostatically analysed and then their velocity is measured
using the time of flight for the ions to pass from the carbon foil to the
detector. The efficiency of these systems depends on their geometry and
the efficiency of their stripping cells and detectors. It is usual to measure
this efficiency with a neutral beam of known intensity.
The instrument shown in Fig. 10.6.2 is designed for measuring high
energy neutrals produced in neutral injection heating experiments. The
neutral particles are ionized by a carbon foil and then deflected by
magnetic and electric fields, both perpendicular to the plane of the figure, with
detection in an array of channeltron electron multipliers.
Neutral particle detectors usually view the plasma along a nearly radial
line of sight and thus provide line-of-sight average values of T\ and hq. In
some experiments this limitation has been overcome by using a neutral
diagnostic beam perpendicular to the line-of-sight to enhance the neutral
density at a chosen point along the line-of-sight of the analyser. This then
provides a spatially localized measurement of T\. In other experiments,
arrays of analysers are used to make direct measurements of the profile
of neutral particle emission and local values of Tj and hq are obtained by
an inversion procedure.

10.6 Ion temperature and the ion distribution function
Fig. 10.6.3 Measured neutral hydrogen
flux as a function of energy in an
expenment with RF heating. (Bhatnagar,
V.P. et al.. Nuclear Fusion, 33, 83 A993).)
Typical results from JET are shown in Fig. 10.6.3 for an experiment
in which ICRH heating power of 6.5 MW was applied to the plasma.
Before application of the ICRH the gradient of the energy spectrum gave
Ti = 3.0 keV. With heating, the distribution function develops a high
energy tail which is characterized by an effective temperature of 48 keV.
The solid line gives a calculated hydrogen flux from a model of the ICRH
heating process, showing reasonable agreement with the experiment.
T{ from neutron emission
In plasmas containing D, T, or He^, nuclear reactions will occur if the ion
temperature is sufficiently high. The most important reactions, several of
which produce neutrons, are listed below
D + D ^ TA.01 MeV) + pC.02MeV)
or He^ @.82 MeV) + nB.45 MeV)
D + T ^ He^C.56MeV) + nA4.03MeV)
D + He^ ^ He^C.71 MeV) + p( 14.64MeV)
T + T^He4 + 2nA1.3MeV)
T + He^ ^ He^ + p + nA2.1 MeV)
or He^D.8 MeV) + D(9.5 MeV).

10.6 Ion temperature and the ion distribution function 527
Figure 1.3.3 shows some of these reaction rates which are all strongly
dependent on the particle energy. For ions species 1 and 2 described by
Maxwellian distribution functions the reaction rate per unit volume is
given by
R = 47v8nnin2 / /(/xu^A Ti)v^a{v) dv = ynin2{(rv), 10.6.2
where a is the nuclear reaction cross-section, / is the Maxwellian
distribution function, /j, is the reduced mass /j, = mim2/{m\ + mi), and
5i2 is 1/2 when species 1 and 2 are the same and otherwise 1. Because the
averaged reaction rate (ov) has a strong dependence upon T; an
experimental evaluation of R by measuring the number of neutrons produced
allows Ti to be determined provided ni and 112 are known.
In the integrand of eqn 10.6.2, / falls rapidly with increasing v while
a increases with v. The integral therefore has appreciable contributions
only from a range of values of v in the tail of the distribution function.
Most of the neutron producing reactions will occur at the most effective
energy for fusion reactions given by
Et = 6.3(ZiZ2A^rj2)^/^ keV, T, in keV,
where A^ is the reduced atomic mass of the ions and Zi and Z2 their
atomic numbers. Generally Ei > T^ and this can lead to serious problems
in the interpretation of neutral yield measurements if there is any
distortion of the distribution function away from a Maxwellian, particularly at
low T,.
Some caution is required in the interpretation of the measurements on
neutrons as they can also be produced by non-thermonuclear reactions
between high energy injected or accelerated ions and the plasma ions. In
plasmas containing low Z ions, for example beryllium, nuclear reactions
between these and ions accelerated by RF heating to MeV energies can
also produce a substantial number of neutrons. A typical reaction is
Be^ + D ^ b1° + n.
In some discharges large currents of runaway electrons are generated
which produce a copious number of neutrons when they interact with the
vessel walls. These neutrons are produced in a two stage process: the
energetic electrons produce high energy y-radiation by bremsstrahlung
interactions in the vessel walls and the neutrons are then produced
following (y,n) reactions with the surrounding materials.
The energy distribution of the thermonuclear neutrons is
where E is the neutron energy and E is the mean energy of the neutrons.
The distribution function consists of a single sharp peak broadened by an

10.6 Ion temperature and the ion distribution function
Fig. 10.6.4 Pulse height spectram as a
function of neutron energy taken with a
'«' neutron spectrometer (Jarvis, O.N
-J ai. Review of Scientific Instruments 57,
1717A986).)
Measured spectrum
2.0 2.2 2.4 2.6 2.8 3.0
Neutron energy (MeV)
amount which depends on Ti with a 1 /e half-width of
T £. \ 1/2
m„TiE \
A£ =
m^ +mrj
where m^ and rrir are the masses of the neutron and other reacting particle.
For the D-D reaction with Tj = 10 keV the 1 /e full width is 314 keV. The
measurement of this width is experimentally quite difficult and detector
systems with very high resolving power are required. Both time of flight
systems and He^ recoil neutron spectrometers have been employed. In
Fig. 10.6.4 an energy spectrum is shown taken during a series of ohmically
heated discharges in JET with a He^ spectrometer having a resolution of
44 keV. An ion temperature of 2.2 keV was deduced from an analysis of
the width of the peak.
A wide variety of detectors can be used for measuring neutron yields.
On large tokamaks U^^^ and U^^^ fusion chambers embedded into
hydrogenous moderating material are suitable for the very high neutron
fluxes encountered. Good time resolution is obtained with solid state
detectors even though these have a low efficiency. In order to interpret
the yield measurements, substantial corrections to the data are required
to allow for the effects of absorption and scattering from the
transformer core, the field coils and other mechanical structures. Alternatively
the detectors can be calibrated by placing a neutron emitting source at
different toroidal positions within the torus and measuring the count rate
in the detectors.
Use is also made of activation techniques which deduce the integrated
neutron yield from measurements of the total radioactivity induced in

10.6 Ion temperature and the ion distribution function 529
one discharge via reactions induced by the neutrons. Reactions
leading to nuclei with appropriate decay times must be selected and typical
examples are
In^^^ + n ^ In^^^(isomeric state) + n, T1/2 = 4.5 hours
Ni^^ + n ^ Co^8 + p, Ti/2 = 71days.
The yield of the decay of the 0.333 MeV isomeric state or of the yg-decay
of the Co^^ then determines the incident neutron fluxes. Interpretation
of these results requires neutron transport calculations to establish the
relationship between the total yield and the local neutron flux. Results
of a neutron yield measurement are shown in Fig. 10.6.5. The data was
taken during a JET experiment in which tritium was introduced into the
deuterium plasma by one of the neutral injection systems. The yield of
14 MeV neutrons was determined with a silicon solid state detector and
the results show good agreement with the results of a plasma transport
model which included reactions induced directly by the beam ions as well
as the thermonuclear reactions.
In some experiments collimated neutron detectors have been used to
determine emissivity profiles. Because of the long mean free path of
neutrons in matter the collimators have very considerable dimensions
and weight.
Fig. 10.6.5 Measured total 14 MeV
neutron rate in a D-T plasma with neutral
beam heating. The full power was turned
on at 12 s and off at 14 s. (JET team.
Nuclear Fusion 32, 187 A992).)

10.6 Ion temperature and the ion distribution function
Ti from charge exchange spectroscopy
Many interesting diagnostic opportunities are provided by the injection
into a tokamak plasma of neutral beams, usually hydrogen or deuterium,
with particle energies of tens to hundreds of kiloelectronvolt (keV). As
these penetrate the plasma, radiation is produced as a result of excitation of
the beam, and also following charge exchange reactions between the beam
neutrals and plasma ions. If this radiation is observed at an angle to the
beam, localized measurements of plasma parameters can be made. These
measurements have been particularly exploited with observations in the
visible region of the spectrum because of the simplicity and versatility of
the instrumentation at these wavelengths.
In a typical experimental set up, as illustrated in Fig. 10.6.6, a neutral
beam is injected across the lines of sight of the optical system of the
viewing spectrometer. The collected light is often removed from the immediate
vicinity of the tokamak by optical fibres to spectrometers outside the
radiation wall. This has advantages of easy access to the
experimental equipment. The spectrometers are generally equipped with charged
coupled devices to record the dispersed spectra.
The determination of the plasma ion temperature depends on the
emission of radiation following a charge exchange reaction. A typical reaction
Neutral beam injector
Fig. 10.6.6 Schematic diagram showing
the geometry of the injected neutral beam,
the plasma, the viewing optics and the
spectrometer
To storage
computers

Fig. 10.6.7 Spectrum near the
deuterium B aimer-alpha line dunng beam
injection. T, is found from the broadened
feature at about 656 nm The features at
shorter wavelengths are Doppler shifted
from the beam. (Wolf, R etal, Nuclear
Fusion 33, 1835A993))
Photon flux
A0"ph/
(st nm nP' s)
10.7 Radiation from plasmas
DQ,-Spectrum
Beam emission
38 keV/amu
19 keV/amu
13 keV/amu
CT £>q-CX
71^ 1 jf emission/
Edge
emission
/
H^
1 A A 'pedestal'y \
AiiliilihiiiLil^^r^^
651 652 653 654 655 656
Wavelength (nm)
of interest is
D°(injected) + X'+(plasma) -^ D+(injected) + X^'"^'+(plasma),
where the plasma ion X was in charge state s+ before the exchange.
After the reaction, the electron received by the plasma ion may be in
a state with a high principal quantum number and will decay with the
emission of visible radiation. The plasma ion X^^"^)"^ may also radiate
following subsequent excitation by plasma particles. A typical spectrum
following charge exchange between the deuterium beam and deuterium
ions is given in Fig. 10.6.7. It shows an unshifted Balmer-alpha line that
has contributions both from the charge exchange reaction and from cold
edge neutrals. The spectrum also shows features corresponding to
excitation of the incident beam, but these are Doppler shifted well away from
the thermal features. The ion temperature can be extracted from
function fitting to the Doppler broadened line at about 656 nm after taking
into account the narrow contribution to this feature from the edge
neutrals. This determination of Tj has become the main diagnostic for ion
temperature profiles in many tokamak experiments.
Radiation from plasmas
Tokamak plasmas nearly always contain significant concentrations of
impurity ions in addition to hydrogen and helium ions. The impurities

10.7 Radiation from plasmas
originate from the torus wall, the limiter, or from the dump-plates of
an X-point or divertor configuration. Typical impurities are beryllium,
carbon and oxygen with low Z, and iron and nickel with high Z. This
distinction in Z is made because at the plasma centre the low Z ions are
fully ionized whereas the high Z ions are usually not quite fully ionized
even in very high temperature tokamak plasmas. Towards the plasma edge
all the ions are in low states of ionization. The interest in impurities arises
from their role in the overall plasma energy balance, since a significant
fraction of the input energy is often lost through radiation processes. The
impurities also dilute the hydrogen plasma. The study of the radiation
from these ions can often also produce valuable information both about
the atomic physics of the ions and about processes within the plasma.
An outline will be given of the factors which contribute to the ionization
balance in the plasma and the mechanisms leading to the production of
both line and continuous radiation.
Ionization states
The ions and electrons in a tokamak plasma are not in a thermal
equilibrium with a balance between a radiation field and the particle energies.
The plasma is transparent to the radiation and, at the densities which
generally prevail in tokamaks, the ionization balance is similar to that
encountered in the solar corona where a balance is established between
ionization and recombination processes. Ionization from state Z — 1 to
Z can take place by direct electron impact, and the ions can recombine
by radiative processes. Dielectronic recombination is also an important
process for complex ions and occurs in two stages. First, an electron is
captured into an excited state together with simultaneous excitation of
the ion. Secondly, this configuration can then either lose the electron
by autoionization or be stabilized by the emission of a photon which
then makes it energetically impossible for an electron to escape and this
completes the recombination processes.
As all processes are proportional to the electron density, the
equilibrium distribution among the ionization states is independent of rie and,
for a steady state the impurity charge state densities are given by
where a^ and 5^-1 are the recombination and ionization rates respectively.
Typical values of these rates are shown in Fig. 10.7.1 for hydrogen and the
hydrogenic states of beryllium and oxygen. The S and a values may be
used to determine the relative concentrations, f^, of different ionization
states as a function of electron temperature. Graphs of fziT^) for oxygen
are shown in Fig. 10.7.2. A tokamak plasma can have strong gradients
of Te in its outer regions and the impurity density of a particular charge
state, n^, therefore changes rapidly with minor radius leading to a series
of concentric shells each with a different predominant ionization state.

10.7 Radiation from plasmas
Fig. 10.7.1 The ionization (S, full line)
and recombination (a, dotted line)
coefficients are shown for hydrogen and
the hydrogenic states of beryllium and
oxygen. The dot-dash line joins the points
at which S = a.
r
r
r
T
H/
\,
^^^ H"" /
"""-
Be>
>^
Qy^"^
'"-^
rg(keV)
Fig. 10.7.2 The relative CI
of the different ionization stages, /j, i
shown as a function of electron
temperature.
Each shell appears where Tg is approximately one-third of the ionization
energy.
This simplified situation is modified if the effects of ion diffusion are
included. The ionization balance in cylindrical geometry is then governed

10.7 Radiation from plasmas
by the equation
9«z 1 9 . ^
dt r dr
where the radial ion fluxes, F^, are driven by both diffusion and
convection.
T, = -D-^-n,v,
dr
where the second term on the right describes an inward pinch
characterized by velocity, v. It is found from experiment that the diffusion
coefficients are anomalously large and that typically i; is between 1 and
10 m s~^ for all ions. The largest modifications to the radial distribution
of the ionization states caused by diffusion and convection are in the outer
regions of the plasma.
Production of radiation
Many processes contribute to the production of radiation in a plasma and
if it is magnetized, synchrotron radiation is also emitted as discussed
briefly in Section 10.5. Line radiation arises from excitation by electron
impact followed by the radiative decay of the excited state and also from
de-excitation following radiative or dielectronic recombination of plasma
electrons with ions. Line radiation can represent a major source of energy
loss from the plasma and offers an important method of identification of
the impurities from the characteristic wavelengths of the radiation.
Continuum radiation arises from electron-ion collisions, which
produce bremsstrahlung, and also from recombination. The
recombination radiation spectrum is continuous above a threshold energy
corresponding to the binding energy of the captured electron.
Measurements of the continuous radiation spectrum are chiefly used to
determine the plasma electron temperature and effective charge Zgff =
Y^n^Z^ lY^n^Z with the summation running over all charge states of all
ion species.
The line excitation rate averaged over a Maxwellian distribution of
electrons for a transition in an ion from state m to state n requiring energy
Enm (eV) is given by
X,„ = 5 X \^-'^fnm8nm ^-^^-^Vi-EnmlT^) m^ S'^,
£„^,reinkeV,
where f„m is the oscillation strength and gnm is the averaged Gaunt factor.
Radiative excitation of dipole transitions from the ground state produces
the most intense radiation seen from plasmas.

10.7 Radiation from plasmas 535
Radiative recombination occurs when an ion with charge Z combines
with an electron to produce a lower ionization state (Z - 1) with the
excess energy of the electron radiated by quanta which will have a
continuous energy spectrum. The ion with charge (Z - 1) will often be left
in an excited state and this can decay by the emission of one or more
quanta with discrete energy. Dielectronic recombination processes are
also important.
The calculation of the impurity-ion recombination radiation is
complicated as a detailed knowledge of the atomic structure of the impurity
ions is required. These calculations have often been carried out using a
very much simplified hydrogenic model for the impurity ions.
Recombination with an ion with § vacancies in its lowest n-shell will give rise to
a continuous spectrum
-^ = 3 X lQ-''z'n,nJ^^Fi^,n, T,) m"^ s"! keV"!,
d£„ SvV?;
= nenzZ^g{bPbF{^,n,Te) £v,reinkeV,
where A^ is the number of quanta of radiation of energy E^ and Pb =
3 X 10~2^ exp(-£v/re)/£vV% m^ s"^ keV~^. The temperature
averaged Gaunt factor, gfb, is of order of unity and the function F depends
upon the atomic structure of the ion and the electron temperature. The
temperature dependence of F is such that at very high temperatures radiative
recombination becomes unimportant compared with bremsstrahlung.
Continuum radiation can also be produced by electron-ion collisions
where the incident electron with energy E^ loses part of its energy by the
emission of an electromagnetic quantum via the bremsstrahlung radiation
process. The energy spectrum of this process is continuous up to E^ and
for collisions between electrons and ions with charge Z in a Maxwellian
plasma is given by
JL=n^nzgj^Pb m-^s-^keV-^ E^TeinkeV,
where the averaged Gaunt factor, g^, is of order of magnitude unity.
Total radiated power
The total radiated power from a low density plasma may be found
by adding and integrating the radiation from the various processes
above. Because all the processes involved depend on the product 11^11^
it is possible to write the total radiated power for a single impurity
species as
Pr = Tn^nJiZ, Te) = n^m T ^ (Z, T^) = n^niR{T^),
where m — ^n^ and the summations run over all the ionization stages.
These have relative concentrations of n^/n/ which are dependent only

10.7 Radiation from plasmas
Fig. 10.7.3 The total radiated power
function, R, is shown as a function of
temperature for various elements.
(Wm^)
on Tg. Extensive tabulations of Pr are available for various impurity ions.
In Fig. 10.7.3 data is given for a number of low Z and high Z impurities
and it can be seen that the high Z impurities are much more efficient
radiators for a given impurity level than the low Z impurities. It is because
of this that especial efforts are made to exclude high Z ions from tokamak
plasmas.
Measurements of radiation
Because there is an electron temperature gradient in a tokamak, from
edge values of a few eV to central values of keV, both line and
continuum radiation are emitted over a wide spectral range. At the plasma
edge, visible radiation is emitted, and at the plasma centre mainly UV and
X-rays. There is a correlation between the plasma temperature, the
radiation wavelength and the position of origin of the radiation, and this allows
the designation of three principle regions of the plasma. This distinction
is useful as the wide spread of wavelengths leads to the requirement of
very different instruments to make an experimental investigation of the
emitted radiation.
(a) Edge region and visible spectroscopy Here Tg is small, atoms are
neutral or in states of low ionization, and the radiation is emitted
mainly in line radiation which can be observed with visible light
spectrometers or monochromators. In the visible region it is easy

10.7 Radiation from plasmas 537
to make measurements as a wide range of instruments is available,
often using ruled gratings as dispersing elements and solid state or
photomultiplier tubes as detectors. In addition, pinhole cameras have
been used with interference filters to isolate lines of particular interest.
The aim of much of this work is to determine impurity influxes and,
in particular, the particle confinement time from the Hq, line intensity.
High resolution measurements can be used to measure the isotopic
content of the plasma, and its impurity content is often determined
from the intensity of the visible continuum radiation. Because visible
lines are emitted primarily from ions with low ionization these lines
are often used to monitor impurity changes in the plasma edge and
the interactions between the plasma edge and the Hmiters and divertor
plates.
Examples of visible spectroscopic measurements will be given
for the determination of the particle confinement time and the plasma
effective charge. The various parameters which can be found from
charge-exchange measurements will also be discussed,
(i) The hydrogen particle confinement time can be found from
the Ua line intensity and a knowledge of excitation and
ionization rates. This measurement is standard on all tokamaks.
Equation 10.7.1 can be integrated and, assuming that the
recombination rate is much less than the ionization rate at the plasma
edge, the flux of hydrogen ions at the plasma radius, a, is
given by
aF = I Songnor dr.
Jo
The line of sight integrated intensity of the Hq, line is
/„ = /" non^XB dr,
where X is the excitation rate and B is the branching ratio for
the de-excitation. The neutral density is appreciable only at the
plasma edge and the ratio Sq/XB is only weakly dependent on
temperature and electron density. Both integrals above are then
proportional to Jq SQU^nor dr and this allows the approximate
evaluation of their ratio. The particle confinement time, tp, is
then given by
tp XB
where A^e is the total number of electrons, and R and a are the
major and minor radius of the plasma,
(ii) Bremsstrahlung radiation is emitted in the visible region due to
electron-ion collisions. Its intensity at wavelength >,(» hc/T^)

10.7 Radiation from plasmas
Fig. 10.7.4 Visible spectram from the
JIPP T-IIU tokamak which shows the
region of the spectram, well clear of
prominent lines, which is used to
determine Zefi. [Ida, K., etai. Nuclear
Fusion 30, 665 A990).]
5100 5150 5200 5250 5300
Wavelength (A)
is given by
dX
= 3 X 10"
Te in keV,
where g is the temperature averaged Gaunt factor and X is in
nm. Line of sight integrals of this intensity must be measured
over the full plasma cross-section for a determination of the
Zeff profile. In addition, the plasma temperature and density
must also be known. One difficulty of the method is to find
a region of the visible spectrum unaffected by impurity line
radiation. Figure 10.7.4 shows the spectral region used on the
JIPP T-nU tokamak which is selected with a 20 A interference
filter at 5235 A.
(iii) Line emission occurs in the visible region following charge
exchange reactions between plasma ions or highly ionized
impurity ions, and diagnostic or heating beams with energies of
20-200 keV as described in Section 10.6. A typical reaction
used for charge exchange recombination spectroscopy is
H°(fast) + 0^+(plasma) ^ H+ -F 0^+(excited state).
The cross-sections for these reactions are very large but are
often obtained from calculations as the necessary measurements
have not been made. The 0^+ ions are formed in states with high
principal quantum number which radiate in the visible region
when they decay. If the line of sight of the viewing optics is
orthogonal to the beam then a spatially resolved measurement is

10.7 Radiation from plasmas 539
obtained. The ion temperature and plasma rotation velocity can
be found from the Doppler broadening and shift of the observed
lines. The intensity of the light also determines the impurity
density if the attenuation of the beam within the plasma can be
accurately calculated.
(b) Intermediate region Here the temperature is higher, tens to
hundreds of eV, and the radiation is emitted in the UV to soft X-ray
region typically from nearly fully ionized hydrogen or helium ions,
and partially ionized higher atomic number atoms. Low Z impurities
such as carbon or oxygen may be partly or fully ionized, depending
on the temperature.
At the longer wavelengths, materials such as quartz are still
transparent to the radiation and instruments similar to those for the
visible region can be used. At shorter wavelengths the radiation is
strongly absorbed by air. It is necessary therefore to use vacuum paths
for the radiation, reflecting gratings for dispersion, and windowless
photomultipliers, scintillators or channel plates as detectors.
The purpose of these measurements is generally to determine the
plasma impurity composition and to assess the effects of impurity
transport by studying departures of the distribution of the different
impurity ionization states from a coronal equilibrium. As all the
measurements are line-of-sight integrals, it is generally necessary to make
spatial scans of the spectra over the plasma cross-section and invert
the data.
A typical spectrum from JT60 (Fig. 10.7.5) shows a multitude
of lines, mainly from carbon and oxygen impurities, from which
impurity concentrations were found.
(c) Plasma centre Here, all atoms except those with very high Z are
fully ionized and the radiation is predominantly at X-ray wavelengths.
High resolution crystal spectrometers relying on Bragg reflection are
used to determine concentrations from line intensities. The Doppler
broadening and shifting of these lines are used to determine ion
temperatures and plasma rotation velocities.
The continuous radiation spectrum is also measured in the X-ray
region where there are contributions both from bremsstrahlung and
recombination radiation. The energy spectrum is given by
dA^ T 111
-— =nll;Pb m-^ s-i keV-\ £„ T^ in keV,
d£i,
where f is the X-ray anomaly factor which is dependent on the
impurity concentration of the plasma. This factor approximately represents
the enhancement of the emission above that for a pure hydrogen
plasma. X-ray measurements of this spectrum are generally made
with a Si(Li) or Ge crystal cooled to liquid nitrogen temperature. The
detector measures the energy of individual quanta with 100%
detection efficiency. A typical energy spectrum taken on JT60 (Fig. 10.7.6)
shows the continuous spectrum at high energies and prominent K
lines at lower energy from almost fully stripped titanium and nickel.

10.7 Radiation from plasmas
Fig. 10.7.5 UV spectram in the 5-500 A
region taken on JT60 with a multichannel
spectrometer during a discharge with
19 MW of beam heating. (Kubo, H., et al.
Nuclear Fusion 29, 571 A989).)
Signal
(V)
*j
3^ ? £„
1 i
>
T =4
>
h X
Mi r. X
iiPli 5«
r 1
1
§
pf
r. >^
> >
o o
1
400 600
Channel number
Fig. 10.7.6 X-ray pulse height spectrum
for an ohmically heated discharge in JT60.
(Kubo, H., et al. Nuclear Fusion 29, 571
A989).)
Energy (keV)
The absolute magnitude of the spectrum determines f, and Tg can be
found from the gradient of the line free part of the spectrum. The K
line intensity can be used to identify and measure the concentration
of the impurity ions.

10.8 Total radiation measurements
10.8 Total radiation measurements
Bolometry
A measurement of the total radiation emitted from the plasma is important
for evaluation of the energy balance. These measurements have been
made with a wide variety of different sensors including thermistors,
thermopiles, pyroelectric detectors and thin film bolometers. The sensors are
often arranged in one or more pinhole camera configurations with a
complete view of the plasma cross-section as shown in Fig. 10.8.1. As the
observed signals are integrals over a line-of-sight, the total radiated power
from the plasma may be found by integrating over the viewing angle of
a single camera. If the spatially resolved radiated power is required, the
observed data must be Abel or otherwise inverted. An example is given
in Fig. 10.8.2. This shows a pronounced poloidal asymmetry near the
plasma inner edge due to the presence of a marfe. It is also possible
for the radiated power to have toroidal asymmetries due to preferential
interaction with limiters and this complicates the interpretation of the
measurements. The detectors usually have a slow time response and are
also sensitive to neutral particle fluxes.
Fig. 10.8.1 Bolometer camera with
20 channels on the TFTR tokamak.
(Schivell, J. Review of Scientific
Instruments 58, 12A987).)
^Channel number
Limiter
Bolometer
camera
2.5 3.0
Major radius (m)

10.8 Total radiation measurements
Fig. 10.8.2 Spatially resolved radiated
power showing a marfe at the plasma edge
(Schivell, J Review of Scientific
Instruments SS, 12A987))
Soft X-rays
Soft X-rays are usually detected by silicon diodes which, in contrast to the
bolometers, have an extremely fast time response, typically a fraction of a
microsecond, and measure the integrated X-ray power above a threshold
energy determined by a thin metallic foil, usually beryllium, placed in
front of the detectors. The detectors receive most of their power from
the hot dense plasma core and have proved invaluable in the study of
mhd phenomena and impurity transport effects. Pinhole cameras with
more than 100 sensors have been used, often viewing the plasma from
orthogonal directions as shown in Fig. 10.8.3. The main advantage of this
diagnostic is its excellent spatial and temporal resolution. Many detailed
studies of tokamak plasmas have been made particularly of the sawtooth
instability, major and minor disruptions, mhd modes, high-y6 mhd effects,
impurity transport, the snake and pellet injection.
The signals from individual channels often show pronounced mhd
effects. These include the sawtooth oscillation which appears at the
plasma centre, and mhd oscillations associated with the magnetic
surfaces with q = m/n. The mode number may be found by
comparing the phases of signals viewing different parts of the plasma.
Figure 10.8.4 shows a sawtooth collapse following strong m = \
oscillations.

10.8 Total radiation measurements
Detectors
I Vertical camera
- Pinhole
Fig. 10.8.3 Soft X-ray pinhole cameras
on JET. (Edwards, A W ef a/ Review of
Scientific Instruments 57, 2142 A986))
1.7
1.3
Central channel
20 ms
^^,^ Sawtooth
Fig. 10.8.4 Signals from individual
detectors of the JET soft X-ray cameras
showing a sawtooth in the upper figure and
pronounced mhd activity in the lower
figures which are on an expanded
timescale On the rapid timescale the
sawtooth precursor activity can be clearly
seen both at the plasma centre and at the
inversion radius

10.8 Total radiation measurements
Tomography
The observed soft X-ray signals are integrals along a line of sight.
The intensity is
I = Q f £{x)a{E^)dxdE^,
Fig. 10.8.5 Geometry of detectors for
tomographic inversion The relationship is
shown between the plasma coordinates
(r, 9) and the detector's coordinates,
(P,<t>).
where Q. is the solid angle factor of the detector, e{x) the plasma emis-
sivity, Ex the X-ray energy and aC^j) the transmission coefficient of the
X-ray filter. The geometry and the coordinates are shown in Fig. 10.8.5.
For many purposes the spatially resolved emissivity, G(r, 0), is required
and this can be obtained by a tomographic inversion of the raw data.
Many different techniques have been used for this purpose. One of the
most useful procedures is that proposed by Cormack which is based on an
expansion in Zemicke polynomials, Rmt, to describe the inverted data:
G{re) = ^(A^^sinm0-|-A^^cosm0)i?m£(r).
tm
The Zemicke polynomials are given by
^ slim +1 - syxe - sy.
The observed line of sight data can be described by
FiP^X) = ^Wmesmmx + A"^^ cosmx)Sme{p)
withSmeip) = 2 sin[(m-I-2£-1-1) COS"'p]/('w+2^+1) and X the
detector angle. The tomography problem can then be solved by determining
the coefficients A^'^ from a fit to the experimental data. The maximum
values of £ and m which can be used in the summations depend on the
experimental assembly, with i determined by the radial resolution of the
X-ray detectors and m, the poloidal mode number, from the maximum
number of independent views of a particular surface of constant p. The
two cameras shown in Fig. 10.8.3 provide essentially four independent
views, because for a given value of p there are detectors with four
different values of (j). This determines a maximum of 4 coefficients A^'^
which are typically Aqo, A^,'^, A^^. Higher m-number modes cannot
generally be determined but will appear from the tomographic analysis to be
combinations of lower m-modes.

10.8 Total radiation measurements
Fig. 10.8.6 Tomographic
reconstructions of the soft X-ray
in a sawtooth crash in JET.
Central hot spot moves rapidly
(f=126/is)
Stable final state
(f=1930/is)
Tomography has been used extensively to study the fast phase of the
sawtooth collapse and throw light on possible sawtooth crash collapse
mechanisms. Reconstructed images of soft X-ray emission before, during
and after a sawtooth collapse are shown in Fig. 10.8.6. Sequences of
reconstructions similar to those shown in the figure have been put onto
video cassettes to provide movies. Similar displays of long pulse
discharges have also been made using real time data processing techniques
to carry out the tomography.
The restriction to low m-numbers can be avoided either by introducing
more views of the plasma or, in some cases, by making use of plasma
rotation, effectively producing additional views of the plasma as it moves
in front of the detectors. By this means the emissivity of complicated
high m-number or localized features may be reconstructed. An example
of this is the strongly localized radiation from the so-called snake, shown
in Fig. 10.8.7.

10.9 Langmuir probes
Fig. 10.8.7 Tomographic i
of the snake which is a small region of
enhanced plasma density in JET produced
on the g = 1 magnetic surface following
injection of a solid D2 pellet
10.9 Langmuir probes
In its simplest form the Langmuir probe consists of a single electrode
which can be inserted into the plasma. A voltage is applied to the probe
with respect to the vessel and the current is measured. From the current-
voltage (I-V) characteristic of such a probe the electron temperature Tg
and density n^ can be deduced. In large tokamaks the use of Langmuir
probes is limited to the plasma edge because of the large power fluxes in
the interior.
The interpretation of Langmuir probes is based on the theory of the
electrostatic sheath (see Section 9.2) which is established at the surface
of the probe element. Combination of eqns 9.2.8 and 9.2.9 leads to an
expression for the current to a probe / which is biased to voltage V
I = Gi + 7e)A - A(] - exp(e(V - VO/T,))A,
10.9.1
where j^ and j^ are the electron and ion current densities and A is the
projected surface area of the probe. In the limit where the probe
dimensions are large compared to the ion and electron gyro-radii and the Debye
length, A = f B ■ dS/B. V{ is the floating potential discussed below.
When the probe is biased sufficiently negatively all electrons are repelled
and all that remains is the ion current. This current is independent of
voltage and is called the ion saturation current. Saturation of the ion current
occurs because all the bias potential appears across the thin sheath and
the ion flux is simply determined by the flux of ions crossing the sheath
edge at the ion sound speed.
The floating potential V{ is the potential at which the probe would
float if it were electrically isolated. If an external potential is applied to

10.9 Langmuir probes
547
the probe then V{ is determined by the applied potential at which the
net current is zero. As the probe voltage is swept positive with respect
to V{, it is seen from eqn 10.9.1 that the electron current rises
exponentially. However, eqn 10.9.1 is only applicable when the probe potential
lies below the plasma potential. When the probe potential equals the
plasma potential there is no sheath electric field and the electrons flow
to the probe surface with a thermal velocity distribution. This point in
the characteristic is called electron saturation, and the electron
saturation current is given by I^s = ^noeCeA, where Ce is the electron thermal
speed. In non-magnetized plasmas, langmuir probe characteristics often
follow this ideal picture with electron to ion saturation current ratios in
hydrogen plasmas around 50:1, as expected from the ratio of electron
thermal speed to ion sound speed.
Figure 10.9.1 shows an I-V characteristic obtained from a single
Langmuir probe in the TIO tokamak. The data is fitted up to the point
where the roll over into electron saturation occurs using eqn 10.9.1. In
this case the electron to ion saturation current ratio is 6.5 but ratios as low
as 1:1 are sometimes observed. As yet there is no adequate theory for this
behaviour and for this reason it is usually advisable to ignore data from
the net electron collecting side of the characteristic. The consequence of
this is that usually only the tail of the electron distribution, comprising
around 5% of the total, is measured.
Assuming equal ion and electron temperatures, the electron density at
the sheath edge may be derived from eqn 9.2.8 to give
\2Tj
showing low electron tc
current ratio as compared with the value
predicated by eqn 10.9.1.
As •
*M Jjcmm^^
r'^'^"'
-60 -40
L_
-20
2
^
-2
-4
-6
-8
^pr
1 1 L_
L 20 40 60
--A T^=5 eV
- \
-

10.9 Langmuir probes
Probe assemblies
The two main ways that probes of various types can be introduced into a
tokamak are illustrated in Fig. 10.9.2:
1. Arrays of fixed probes can be built into limiters and divertor targets
with the purpose of characterizing the plasma contacting the material
surfaces. Since such probes do not modify the sheath akeady existing
at the limiter or divertor targets, it is normal to quote the density at the
sheath edge, given by eqn 10.9.2.
2. Probes can be mounted on drives which can map out a profile of the
edge plasma on a pulse by pulse basis (slow drive) or during a pulse (fast
reciprocating drive). Fast drives are essential in large tokamaks where
prolonged exposure of the Langmuir probe head leads to vaporization.
Probes of this type act as sinks for plasma ions and so locally perturb
the plasma. This density perturbation occurs over a distance called the
collection length Lcoi which is determined by the rate at which the parallel
flow of ions to the probe can be supplied by cross-field diffusion
Lcoi
where d is the projected probe width, Cg the ion sound speed and D^
the diffusion coefficient perpendicular to the magnetic field. Provided
that Lcoi is less than the distance along B to the next material object
the unperturbed density can be obtained by multiplying the density at the
sheath edge, given by eqn 10.9.2, by ~2. This factor allows for the drop
in density which occurs when the ions are accelerated up to the ion sound
speed at the edge of the sheath created by the probe.
Fig. 10.9.2 Fixed probe arrays and fast
reciprocating probe in the divertor region
of C-mod tokamak

10.9 Langmuir probes 549
Single probes
When current is drawn from a plasma through a probe tip an equal current
of opposite sign must be returned to the plasma through a second
electrode. In the case of single Langmuir probes in tokamaks, the torus is
often taken as the reference electrode. The main requirement is for a
surface area sufficiently large that a negligible potential change across the
reference electrode sheath is needed for the return current to flow. This
requires that the surface carrying the return current does not reach the ion-
saturation limit before the probe reaches electron saturation In a uniform
hydrogenic plasma the reference electrode would need an area which is
larger than the probe area by a factor in excess of the ideal electron to
ion saturation current ratio, which is typically ~50:1 Despite the large
surface area within a tokamak, currents flow much more readily along
the magnetic field than across it and so the area of surface from which the
return current flows may actually be very restricted. This restriction of
the current channel has been put forward as a possible explanation for the
low electron to ion saturation current ratios which have been observed in
many tokamaks and can be seen in the example of Fig. 10 9.1.
Double probes
Double Langmuir probes consist of a pair of probe tips locate close enough
together that they can be considered to be exposed to the same plasma
conditions. A swept isolated power supply drives current in one tip and
out the other so that Ii + I2 ~ 0. Defining /i and I2 with eqn 10.9.1
and the power supply voltage as Vg = Vi - V2, the following equation is
obtained for an asymmetric double probe characteristic
^ j.AiJl - exvJeVjn))
^ l + {Ai/A2)exp{eVjny
If the areas are equal, that is Ai = A2 then
h =7iAitanh(n/2re)
The only advantage that a double probe would appear to have over a
single probe is that the return path for the current can be less ambiguous
In practice however, no real benefits have been demonstrated which would
justify the added complexity and loss of information about the electron
collecting side of the characteristic.
Triple probes
Triple Langmuir probes consists of three probe tips each of which must
be exposed to the same plasma parameters. One tip provides the floating
potential whilst the other two are differentially biased with a constant
potential as an isolated pair such that one tip draws an ion saturation
current j^A 1 and the other a net electron current -71A1. This arrangement

550 10.9 Langmuir probes
Fig. 10.9.3 Schematic illustrating the
principle of the triple Langmuir probe
The circuit diagram is shown together witl
the positions of the three probes on the
nV) curve
Ion Saturanon
IS shown in Fig. 10.9.3. The potential of the electron collecting side of
the circuit V2 adjusts itself such that the electron side draws an equal
but opposite current to the ion side. Applying eqn 10.9.1 to tips 1 and 2
and using the continuity equation I^ + I2 = 0, the following equation is
obtained
A-
,e(V,-V,)/re)^^_^(l_ge(V,-
Vf)/re
)A2--
10.9.3
In the limit where the supply voltage is large e| Vi - Vf | » Tg, eqn 10.9.3
gives a simple expression for the electron temperature,
T^ = {V2-Vf)/ln(l + -
The advantage of the triple probe method is high time resolution since
V2, Vf, and 7i can be measured simultaneously. This contrasts with swept
probes where the current and voltage may need to be recorded at up to 100
time points to define a single characteristic from which averaged
parameters may be extracted. Figure 10.9.4 shows an example of high time
resolution divertor triple probe measurements from an ELMy discharge
in JET. Triple probe data is however unreliable under conditions where
the ion and electron saturation currents are comparable, or the plasma
parameters vary across the three tips.

10.10 Measurements of fluctuations
Fig. 10.9.4 Divertor tnple probe data
from an ELMy discharge in JET
A0*^Acm"^)
lLLJ^
.j.jJIaAa'
lLL>
I 20ms '
10.10
Measurements of fluctuations
The expenmentally determined energy and particle transport coefficients
in a tokamak greatly exceed those calculated fi-om collision theory. It is
generally accepted that plasma turbulence is responsible for this anomaly
and a considerable experimental effort has been made to try to understand
the mechanisms operating, to distinguish between different theoretical
models, and to try to show that the experimentally determined turbulence
does indeed account for the observed transport.
Electrostatic fluctuations affect both particle transport and heat
conduction. The particle flux may be written as
where B is the magnetic field, Ej_ and hj are the fluctuating parts of the
electric field and the particle density respectively. The triangular brackets
denote averaging. The heat flux is also affected and the turbulence gives

10.10 Measurements of fluctuations
rise to a term
<ij --
where 7) is the temperature fluctuation.
Magnetic fluctuations mainly affect the heat flux which is increased
by a contribution
<l)"^'
where k depends on plasma parameters and b^ is the fluctuating
component of the radial magnetic field. The index a is 1 or 2 depending on the
collisionality of the plasma and whether the plasma is in the quasi-linear
or strong turbulence regime.
In order to properly evaluate the importance of fluctuations,
measurements h, fj and Ee are required together with their correlations.
Measurements of b^ are also necessary To determine all of these is
clearly a daunting task and the expenmental investigations have so far
been of a more limited extent The most comprehensive measurements
have been made at the plasma edge where the fluctuations are at their
greatest. Much of this work has been done using magnetic and Langmuir
probes. Towards the plasma centre this technique will not work as the
probes perturb the plasma too greatly and would be melted by high
heat fluxes. At the centre more limited data is available from scattering
experiments and heavy ion beam probes. The few measurements of
the temperature fluctuations show that they are small. Density
fluctuations can also be investigated using reflectometry. The information
about fer is also very limited with data coming only from fairly
indirect sources such as the containment properties of runaway electrons
In the paragraphs below some typical fluctuation measurements will be
described
Heavy ion beam probe
This diagnostic was onginally developed to determine the electric
potential within a plasma The basic pnnciples of its operation may be seen in
Fig 10 10 1 An incident beam of singly charged ions is accelerated to
energy E and allowed to enter the plasma perpendicular to the toroidal
field The ions move on an orbit with Larmor radius Pi, until at point
I in the interaction zone they become further ionized due to collisions
with plasma electrons and then move onto an orbit with smaller radius,
Pi/2, and become separated from the pnmary beam It is clear that for this
diagnostic to work Pi must be comparable with the tokamak minor radius.
This is achieved by using a singly charged probe beam, often thallium,
with high Z and with energies typically in the 100s of keV to MeV range

10.10 Measurements of fluctuations
Fig. 10.10.1 Schematic diagram of a
thallium heavy ion beam probe The
accelerated ions are selected in energy by
the bending magnet and then enter the
plasma where they charge exchange and
move on a new trajectory, entering the
electronstatic energy analyser and detector
(+\ ^ij, magnet
Torus
cross-section
The diagnostic has not yet been applied to the largest tokamaks, mainly
because of the very high energies required.
If the potential difference between the point / and the exterior of the
plasma is (p then the doubly charged ions emerge with energy E + e(j)
and a measurement of this energy, with an electrostatic energy analyser,
determines (j) and its fluctuations. The difficulty of the measurement arises
from the fact that e4> < e(j) <^ E.
Other quantities may also be measured with this diagnostic. For
example, the intensity of the secondary beam will be proportional to
the plasma electron density in the interaction volume, and, more
interestingly. Its fluctuations will reflect the density fluctuations, hg. The effective
interaction volume will be determined by the incident beam divergence
and the solid angle of the detection system
In addition, the beams will be deflected out of the plane perpendicular
to 50 by the poloidal magnetic field A measurement of this deflection
can determine information about the components of B perpendicular to
50 and their fluctuations
In Fig. 10.10 2 an example is shown of the radial profiles of the relative
density (he/rig) and potential fluctuations {e4>/Tg) measured on the TEXT
tokamak using a heavy ion beam probe technique
Scattering measurements of «e
A beam of electromagnetic radiation traversing a plasma will scatter from
individual charged particles and it will also scatter from plasma waves and
fluctuations due to collective effects An incident beam with frequency

10.10 Measurements of fluctuations
Fig. 10.10.2 Radial profiles showing the
fluctuation levels of ne/rig and e0/Te in
the TEXT tokamak in the outer regions of
the plasma (Forster, J FRC Report 301
University of Texas, Austin A987).)
»e(j)/T^
°njn^
-
-
I\ ° 1
i
f 1
„ I
T
J i
r
i
Minor radius (cm)
coQ and wave number ko will collectively scatter from fluctuations with
{co, k) to give a scattered beam with co^, k^ where energy and momentum
conservation give the relations
cOs = coq ± CO, ks = ko ± k
If the probing beam is chosen so that |A:o| ^ l^sl then
k^ = 4klsm^i9J2),
where 9s is the angle of the scattenng. Collective scattenng occurs when
the electromagnetic beam interacts with the plasma on a scale length
greater than the Debye length, Aq That is when
1 ,
For reasonable scattenng angles this relation implies the use of millimetre
or submillimetre wavelengths. The scattered power is given by
--Porln,Vaj
S{k,a))Aco/2n,
where Pq is the incident power, V is the scattenng volume, vq the
classical electron radius and Q. is the solid angle. S{k, co) contains the

Fig. 10.10.3 Multichannel far infrared
scattering apparatus used on the TEXT
tokamak. (Park, H., Brower, D L, Peebles,
W.A , Luhmann, Jr, N C etal. Review of
Scientific Instruments 56, 1055 A985))
10.10 Measurements of fluctuations
-Mirror
Probe
beam
Fig. 10.10.4 Scattered frequency
spectra for different values of Ic The
spectra peak at gradually increasing values
of a) as /: increases (Ritz, Ch P., Brower,
D.L , Rhodes,TL , Bengtson, RD , etal.
Nuclear Fusion 27, 1125 A987).)

10.11 Determination of the ^-profile
A:g(cm ')
Fig. 10.10.5 Sk(9,a)) spectramat
r = 0.26 m in TEXT from scattering
experiments (crosses which represent
FWHM) and from Langmuir probe
measurements (contours). (Wootton, A.J ,
Austin, M E., Bengtson, R.D , Boedo, J.A.,
et al. FRCR#310, University of Texas,
Austin A988).)
information about the plasma fluctuation spectrum and is the quantity
which needs experimental determination.
In a typical experimental arrangement such as that employed on the
TEXT experiment (Fig. 10.10.3), a probe beam enters the plasma after
reflection in mirrors mounted in a stainless-steel tower. Part of the probe
beam is separated to provide six equal power local oscillator beams which
are then mixed in the detectors with the six scattered beams to produce
an intermediate frequency signal at the difference frequency which
corresponds to the frequency of the density fluctuations. The arrangements
of the mirrors allows the measurements to be made over most of the
plasma cross-section. Heterodyne detection may also be used and allows
the determination of the direction of k. The system needs to be
calibrated. The scattered radiation is used to determine the spectrum S, which
is shown in Fig 10 10.4 for various values for k. At the plasma edge the
fluctuations are also measured by Langmuir probes, and a comparison
with the scattenng results is shown in Fig. 10.10.5.
Determination of the ^-profile
A knowledge of the ^-profile in a tokamak is fundamental for the
understanding of the mhd properties of the plasma. Near the plasma edge,
q may be determined with accuracy from magnetic measurements, but this
becomes increasingly inaccurate as extrapolations are made towards the
plasma centre Several methods of determining q (r) have been developed
The Faraday rotation method has akeady been discussed in Section 10 3
An early determination of q{r) was made using a ruby laser
scattenng techmque An incident beam with wave vector ko was allowed
to scatter from the plasma electrons to produce a scattered wave k^,
with the detector geometry arranged such that k = k^ — ko was very
nearly perpendicular to the magnetic field, B. The spectrum of the
scattered radiation has the usual Doppler broadening of approximately | A: | t/pe
due to the thermal motion of the electrons, but it is strongly
modulated in intensity when k B is very small because of the oscillatory
motion of the electrons around the magnetic field hues. These
modulations are separated in frequency by Wce However, this effect cannot be
observed in a tokamak directly from the scattered spectrum because,
as coce <S |A:|t/re. the modulations are very closely spaced and each
separated peak in the scattered spectrum has a very small number of
photons This difficulty was overcome by using forward scattenng together

10.11 Determination of the ^-profile
557
with detection optics which incorporated a Fabry-Perot interferometer
which matched the electron cyclotron frequency Results from this
technique showed a.q{r) profile descending below unity at the plasma centre.
Although this method is based on very sound physical principles, it has
been little used due to considerable practical difficulties encountered in
Its execution.
The best established method of measunng the pitch angle of the
magnetic field exploits the motional linear Stark effect. The expenmental
arrangement is similar to that described at the end of Section 10.6. and,
again, spatial resolution is obtained from the intersection of the beam
and viewing optics. Atoms in an injected neutral beam of deuterium or
hydrogen are excited by the plasma particles and emit B aimer-alpha
radiation. In their rest frame the atoms expenence a Lorentz electric field
E]^ = V X B. For injected deuterium neutrals of ~100keV, this field
splits spectral lines into n and o components more strongly than the
Zeeman effect which can be ignored. The beam emission can be easily
distinguished from plasma emission by its Doppler shift although the
measurements are complicated by the presence in the beam half of and
third energy components.
The determination of the direction of the magnetic field comes from
the polarisation properties of the spectrum. Viewed transversely to the
electric field, the n components are linearly polarised parallel to £l,
and the a components are linearly polarised perpendicular to £l- The
direction of the magnetic field is determined from the direction of the
linearly polarised a components.
In a typical experimental arrangement on the PBX-M experiment the
viewing optics intersect the 40-80 keV diagnostic beam injector. A radial
profile of the magnetic field pitch angle is obtained by rotation of the
Fig. 10.11.1 Profile of g dunng neutral
beam expenments in TFTR. The
remarkably hollow profile is clearly
demonstrated. (Levington, FM et al
Physical Review Letters 75,4417 A995))

beam direction. In other experiments spatial resolution is obtained by
viewing the beam at different positions. A lens focuses the light through
a polarimeter and interference filter that transmits the o components only.
The polarimeter is based on a photo-elastic modulator and accuracies of
0.1-0.2 degrees are obtained. Some further knowledge of the plasma
flux surfaces is needed to determine the ^-profile and the measurements
are also slightly sensitive to the radial electric field which can also be
determined.
Measurements with this technique were originally used to study the
central ^-profile in sawtoothing discharges. More recently the
measurements have become of much greater importance for setting up and
understanding high performance discharges with reversed magnetic shear.
A ^-profile determined by this technique is shown in Fig. 10.11.1.
Bibliography
Tokamak diagnostics
There is an extensive literature on tokamak diagnostics.
The general principles of operation of a wide range of
diagnostics are discussed by
Hutchinson, I.H. Principles of plasma diagnostics.
Cambndge University Press A987).
A good review of the diagnostics installed on the large
tokamaks is by
Orlinskij, D.V., and Magyar, G. Plasma diagnostics on large
tokamaks. Nuclear Fusion 28, 611 A988).
Valuable information on the development and 'state of the
art' of diagnostics has been published in the proceedings of
the International School of Plasma Physics 'Piero Caldirola'
held at Varenna, Italy The seventh of these is devoted to the
new diagnostic challenges ansing from the ITER project
Stott, PE., Gonm, G., Prandom, P, and Sindoni, E.
(eds). Diagnostics for experimental thermonuclear fusion
reactors 2. Plenum Press, New York and London
A998).
Many recent developments may be found in
Barnes, C.W. and Snider, R. Proceedings of the 13th
topical conference on high-temperature plasma diagnostics.
Review of Scientific Instruments 72 285 B001). The
proceedings of earUer conferences in this series, held
biannually, also provide valuable material.
Zakharov, L.E. and Shafranov, V D. Equilibnum of a toroidal
plasma with non-circular cross-section. Soviet Physics—
Technical Physics 18, 151 A973).
Lao, L.L., St. John, H., Stambaugh, R.D., and Pfeiffer, W
Separation of ySp and /j in tokamaks of non-circular cross
section. A^Mc/ear Fm5Jo« 25, 1421 A985).
A more general overview of magnetic diagnostics is given by
Wooton, A.J. m Diagnostics for contemporary fusion
experiments, Stott, PE., Akulina, D.K., Gorini, G., and
Sindoni, E. (eds). Editrice Compositori, Bologna A991).
Interferometry
This IS one of the most essential of diagnostics and has been
used since the beginning of tokamak research. Useful further
information may be found in
Jahoda, F.C. and Sawyer, G.A. Optical refractivity of
plasmas. In Methods of experimental physics. Vol. 9B, Plasma
physics (eds Gnem, H.R. and Lovberg, R.H) Chapter 11.
Academic Press, New York A971).
Veron, D. High sensitivity HCN laser interferometer for
plasma electron density measurements Optics Commu-
10,95A974).
Magnetic measurements
The denvation of equiUbrium quantities from magnetic
measurements is discussed by
Shafranov, VD , Determination of the parameters yS; and /;
in a tokamak for arbitrary shape of plasma pinch cross
secuon Plasma Physics 13, 757 A971)
Reflectometry
An overview of reflectometry measurements may be found in
Manzo, M.E. Reflectometry in fusion devices. Plasma
Physics and Controlled Fm5jo« 35, B141 A993)

Bibhography
559
The first reflectometry measurements of density fluctuations
are reported in
TFR Group, Local density fluctuations measurements by
microwave reflectometry on TFR. Plasma Physics and
Controlled Fusion 27, 1299 A984).
Measurements of electron temperature
Measurements of T^ using laser light scattering are
discussed by
Evans, D.E. and Katzenstein, J Laser light scattenng in
laboratory plasmas Reports on Progress in Physics, 32, 207
A969).
Peacock, N J., Robinson, D.C., Forrest, M J., Wilcock, PD.,
and Sannikov, V.V Measurements of the electron
temperature by Thomson scattenng in tokamak T3. Nature 244,
488A969).
Sheffield, J Plasma scattering of electronic radiation
Academic Press, New York A975)
The physics of electron cyclotron emission is discussed by
Bekefi, G Radiation processes in plasmas. Wiley, New York
A966).
Bomatici, M., Cano, R, De Barbieri, O , and Engelmann,
F. Electron cyclotron emission and absorption in fusion
plasmas Nuclear Fusion 23, 1153A983)
ECE methods to determine Te may be found in
Engelmann, F and Curatolo, M Cyclotron radiation from a
rarefied inhomogeneous magnetoplasma. Nuclear Fusion
13,497A973)
Costley, A.E., Hastie, R J , Paul, J WM., and Chamberlain,
J Electron cyclotron emission from a tokamak plasma,
expenment and computation Physical Review Letters 33,
758 A974).
Costley, AE. Electron cyclotron emission from
magnetically confined plasmas I—Diagnostic potential, II—
Instrumentation and measurement In Diagnostics for
fusion reactor conditions (eds Stott, PE , Akulina, D K,
Leotta, G.G , Smdom, E , and Wharton, C ) Vol 1, 129
EUR 8351-lEN, CEC, Brussels A982)
Neutral particle analysis
The transport of neutrals within a plasma is discussed in
detail in
Hughes, M.H , and Post, D E A Monte Carlo algonthm for
calculating neutral gas transport in cylindncal plasmas.
Journal of Computational Physics 28, 43 A978).
Ti from neutron emission
Calculations of charged particle reaction rates and neutron
spectra are given by
Brysk, H Fusion neutron energies and spectra Plasma
Physics 15, 611 A973).
Radiation emission from plasmas
An excellent and up-to-date overview of plasma
spectroscopy is given by
Greim, H.R. Principles of plasma spectroscopy. Cambridge
University Press, UK A997)
The physics of the different sources of radiation is
discussed by
Tucker, WM. Radiation processes in astrophysics. MIT
Press, Cambndge, Mass A975).
Bremsstrahlung emission from a Maxwellian plasma is
discussed by
Karzas, W.J , and Latter, R. Electron radiative transitions in
a Coulomb field AstrophysicalJoumalSupplSeT.6, 167
A961)
Several useful articles explaining the general pnnciples of
plasma spectroscopy may be found in
Bamett, C.F. and Hamson, M.F A. (eds) Applied atomic
collision physics, yol 2, Plasmas Academic Press, New York
A984).
Calculations of the power loss from a plasma in coronal
equilibrium are given by
Post, DE, Jensen, RV, Tarter, C B., Grasberger, WH.,
and Lokke, WA Steady-state radiative cooling rates for
low-density, high temperature plasmas Atomic Data and
Nuclear Data Tables 20, 397 A977).
Particle influx measurements
The determination of hydrogen influxes from line intensities
IS discussed by
Johnson, L C, and Hinnov, E. Ionization,
recombination, and population of excited levels in hydrogen
plasmas. Journal of Quantitative Spectroscopy and Radiative
Transfer 13, 333 A973)
Impunty influx determination is discussed in
Behringer, K, Summers, HP, Denne, B., Forrest, M, and
Stamp, M Spectroscopic determination of impurity influx
from localised surfaces Plasma Physics and Controlled
Fusion 31, 2059 A9S9)
Impurities
The general pnnciples of impunty determination in tokamaks
are explained in the review article
Isler, R C. Impurities in tokamaks Nuclear Fusion 24, 1599
A984)
A useful review specializing on the X-ray region is
de Michelis, C , and Mattioli, M Soft X-ray spectroscopic
diagnostics of laboratory plasmas. Nuclear Fusion 21,677
A981)

560
Bibhography
Tomography
The theory and practice of tomography as applied to tokamak
plasmas are reviewed by
Granetz, R S , and Smeulders, P X-ray tomography on JET,
Nuclear Fusion 28, 457 A988)
Langmuir probes
A thorough review of the application of Langmuir probes in
tokamaks is provided by
Stangeby, PC , Plasma diagnostics Volume 2, Surface
analysis and interactions. Edited by O Auciello, D L Flamm,
Academic Press (Boston, 1989) p 157
More recent developments in the theory and application
of Langmuir probes, along with a review of advanced
electrical probes such as retarding field analysers and
mass-spectrometers, are described in
Matthews, G P., Plasma Physics and Controlled Fusion 36,
1595 A994)
Fluctuations
Much useful information about turbulence and transport
may be found in
Gresillon, D and Dubois, MA (eds) Turbulence and
anomalous transport in magnetized plasmas (Proc of
the international workshop on small scale turbulence
and anomalous transport, 1986, Cargese) Editions de
physique, Les Ulis, France
An extremely useful review article is
Liewer, P C Measurements of nucroturbulence in tokamaks
and comparison with theones of turbulence and anomalous
transport Nuclear Fusion 25, 543 A985)
An early paper on the heavy ion beam probe is
Jobes, F C , Hickok, R L A direct measurement of plasma
space potential. A^Mc/earFuiJOw 10, 195 A970)
^-profile
The determination of ^(r) by laser scattenng is descnbed in
Forrest, M.J , Carolan, PG , and Peacock, N J Measurement
of magnetic fields in a tokamak using laser light scattenng.
A^arure 271, 718 A978)
The determination of ^(r) using the motional Stark effect is
descnbed by
Levington, F M et al Magnetic field pitch-angle
measurements in the PBX-M tokamak using the motional Stark
effect Physical Review Letters 63, 2060 A989)
A useful review in this area is
Soltwisch, H Current density measurements in tokamak
devices Plasma Physics and Controlled Fusion 34, 1669
A992)

Tokamak
experiments

11.1 Tokamak experiments
11.1 Tokamak experiments
The earliest expenments aimed at confining a high temperature plasma
were earned out in the United Kingdom The idea of avoiding electrodes
by using a toroidal vessel, and of using a transformer action to induce a
toroidal current led, to a senes of so-called pinch expenments with
currents of several kiloamps However, it was found that the resulting plasmas
were grossly unstable It was subsequently realized that the addition of
a toroidal magnetic field would improve stability and this concept was
implemented in a number of expenments such as Zeta However, in
modem terminology, the value of q was less than one Consequently strong
instabilities still occurred, although not on the gross scale of the earlier
expenments
The development of tokamaks in the Soviet Union followed from
theoretical ideas of Tamm and Sakharov. The conceptual development
was the opposite of that in the United Kingdom The initial
conception was of a toroidal confining magnetic field The realization that
this would not allow an equilibnum led to the suggestion that the
problem would be solved by passing a toroidal current through the
plasma.
Calculations by Shafranov and Kruskal indicated that improved
stability was associated with having ^ > 1. This is the essential
difference between tokamaks and pinches, and the appreciation of this
fact IS central to the comparative success of the tokamak concept. It
should however be remarked that had the range of instabilities now
known to beset tokamaks been discovered by theoreticians before the
expenmental programme was undertaken, there might have been some
hesitation
The initial tokamak expenments were spoiled by impurities resulting
from interaction of the plasma with the vessel The plasmas were much
improved by the use of a conducting shell to reduce the major radius
shift of the plasma, and the use of limiters to control the plasma-surface
interaction.
These early developments were crucial In a sequence of
experiments carried out under the leadership of Artsimovitch, the
impurity problem was largely overcome and the work culminated in the
achievement of plasmas with temperatures approaching 1 keV. Since
the temperatures were derived from indirect measurements, there were
uncertainties These were removed when experimentalists from the
United Kingdom confirmed the electron temperatures using Thomson
scattering
This was a turning point in both fusion and tokamak research.
The conviction that the tokamak offered the best way forward rapidly
spread around the world. Since then there has been an increasing

11.2 T-3
563
concentration on tokamak research which has led to a large scale
world-wide programme.
The improvement in confinement has mainly been due to increased
size with the best energy confinement time in each device being given
approximately by re = ^r^ where rp is the average poloidal radius.
However, these best confinement times have only been possible through
the introduction of various control techniques and methods of
cleaning and conditioning the vacuum vessel. Other developments were the
use of continuous gas feed, the injection of solid deuterium pellets,
and the use of low atomic number matenals, such as carbon, for the
limiter.
Methods of heating the plasma have been developed to raise the
temperature from its ohmic heating values of ~1 keV and, using a neutral
beam injection and ion cyclotron heating, progressively higher
temperatures have been reached. It is now possible to obtain ion temperatures in
excess of the 10-20 keV required for a reactor.
The following sections of this chapter descnbe the contributions made
by small and medium sized tokamaks. The next chapter gives an account
of the results obtained from the four large tokamaks which have brought
plasma parameters close to those needed in a reactor.
T-3—Kurchatov Institute, Moscow, USSR
Tokamak-3 was the largest of a senes of such devices, built at the
Kurchatov Institute in the 1960s, which established the tokamak as the
leading contender for a thermonuclear confinement system. Its main
features were an iron transformer core, a vacuum system with a bakeable
stainless-steel wall, a limiting aperture made of refractory metal, and a
thick copper shell.
T-3 and similar devices were first used to explore the conditions
necessary to obtain stable operation without excessive interaction with the
vacuum vessel walls. A high degree of cleanliness of the vacuum wall
was required This was achieved by baking and conditioning by repetitive
'training discharges', now referred to as discharge cleaning. In addition
the theory and practice of controlling the plasma equilibrium, using the
copper shell plus applied vertical fields, allowed the discharge to be
accurately centred in the limiter aperture; thus minimizing impurity release by
plasma-wall interaction The performance of the discharge was
monitored by measuring its electrical resistance, an approximate indication of
the mean temperature.
In the best discharges, this so-called conductivity temperature reached
values of ~100eV. However, gradually improving diagnostic
techniques demonstrated that this was a considerable underestimate of the

Fig. 11.2.1 A companson of the ion
temperatures measured in vanous
tokamaks with theory. This assumes that
the ions are heated by collisions with much
hotter electrons and lose energy by thermal
conduction, calculated from the
neoclassical theory of Galeev and Sagdeev.
Line 1 is for flat profiles of plasma current
and temperature and line 2 for parabolic
profiles. The best fit to the expenmental
points, shown by the dashed line and by
the formula on the abscissa, is called
Artsimovich's scaling law. (Artsimovich,
L.A Nuclear Fusion 12, 215 A972).)
temperatures achieved. Among these techniques, pioneered of T-3 and
other devices at the Kurchatov, were the measurement of plasma dia-
magnetism, giving the total energy content of the discharge, the analysis
of energetic neutrals produced by charge-exchange reactions, the
detection of neutrons from thermonuclear reactions, and the measurement of
electron temperatures by Thomson scattering of laser light. These
measurements all showed that the tokamak was capable of confining plasma
at temperatures of order 1 keV and stimulated the world-wide expansion
of tokamak research from 1970 to the present.
The variation of the ion temperature as a function of the plasma
density, current, toroidal field, and ion mass could be explained by
a balance between collisional energy transfer from the electrons and
ion conduction losses calculated using the newly developed
neoclassical theory (Artsimovich scaling. Fig. 11.2.1). The electron losses,
however, were anomalously high; a problem which is incompletely
understood today. They were shown to decrease with increasing
density, poloidal field, and minor radius (Mimov scaling). Studies of particle
confinement were also made by the then novel technique of
measuring the plasma response to a puff of gas introduced at the discharge
boundary.
ST—Princeton Plasma Physics Laboratory, USA
After encouraging results on the T-3 tokamak the model-C stellarator
was converted to a tokamak. It featured a rather high aspect-ratio of
approximately 10.

Fig. 11 3.1 Sawtooth oscillations in the
soft X-ray emission from the ST tokamak
measured across various chords with
coUimated detectors. The emission is a
sensitive function of the maximum electron
temperature on each chord The rapid
collapse of the central chord signal and the
increase at larger radii indicates a sudden
outflow of energy On some traces growing
precursor oscillations can be seen The
instability is associated with a fall of the
safety factor below unity in the centre of
the plasma column, (von Goeler, S. et al
Physical Review Letters 2>2>, 1201 A974).)
Initial experiments concentrated on confirming the high values of
central electron temperature measured on T-3 using Thomson scattenng
of ruby laser light. The temperature profiles on ST were
considerably narrower than those on T-3. This is now understood in terms of
stronger edge cooling by radiation from impunties with low atomic
number, such as oxygen, in the relatively less well conditioned vacuum
vessel. The value of Zgff, the measured plasma resistance
enhancement over the Spitzer value for a pure hydrogen plasma, was ~5 in
some discharges. Detailed spectroscopic studies of impurity content
showed that this could be explained by the presence of highly stripped
impurity ions, approximately in coronal equilibrium with the
electrons.
Studies of the disruptive instability showed that it was preceded by
the growth of an mhd mode rotating in the direction of electron diamag-
netic drift and that it could be provoked by a puff of impurity gas, such
A flattening of the electron temperature profile was observed and, on
the assumption 7 ~ Tg , this appeared to correspond with a reduction
of the central value of q to unity. The nature of the instability responsible

for this effect was revealed when measurements were made in the soft
X-ray region of the radiated spectrum {hv ~ 1 — lOkeV). An internal
'disruption' or 'sawtooth' relaxation was observed which caused a rapid
flattening of the temperature in the central region in a time of ~10/is,
repeating at intervals of about 1 ms (Fig. 11.3.1). The precursors to this
disruption were also observed to have a poloidal mode number of unity,
confirming the correspondence with the ^ = 1 surface.
The first direct measurements of the local potential of the plasma
were made on ST using a high energy thallium ion beam. The escaping
ions which had been ionized from Th+ to Th^"^ suffered a measurable
change in energy which could be related to the local space potential, where
the incoming and outgoing orbits crossed. The intensity of the escaping
beam could also be used to measure a local value of the electron density.
This diagnostic showed the discharge centre to be several hundred volts
negative with respect to the walls.
JFT-2—Japanese Atomic Energy Research
Institute, Tokyo, Japan
The design of Jaeri Fusion Torus 2 was based on the scalings for ion
temperature and confinement time obtained on the T-3 and TM-3 toka-
maks at the Kurchatov Institute. Thus the aspect-ratio was low in order to
maximize the plasma radius and the plasma current Great attention was
given to removing impurities from the vacuum vessel by baking and
discharge conditioning. These efforts were rewarded by exceptionally good
values of the energy confinement time, up to 15 ms, and low effective ion
charge and plasma resistance.
The importance of the plasma boundary conditions was recognized
and experiments to measure and to change the plasma-limiter interaction
were devised. An attempt was made to detach the limiters from the plasma
by rapidly withdrawing them. However, it proved difficult to move the
limiters faster than the plasma boundary expanded by diffusion, and the
results were inconclusive.
Measurements were made using Langmuir probes in the scrape-off
layer which is the relatively thin shell of plasma on magnetic surfaces
which intersect the limiter. The radial decay lengths of the plasma density
and temperature in this region provide information on heat and particle
transport perpendicular and parallel to the magnetic field. The
diffusion coefficient was shown to be comparable with the so-called Bohm
value (Db = T{eV)/l6B). This result has since been confirmed on
several other devices with poloidal limiters. The probe measurements
also allowed estimates to be made of the particle fluxes to the limiters
and hence the particle confinement times independently of the usual
spectroscopic methods.

11.5 Alcator A, Alcator C, and Alcator C-Mod
Alcator A, Alcator C, and Alcator
C-Mod—Massachusetts Institute of Technology,
Cambridge, USA
Fie A0^°m')
Fig. 11.5.1 Companson of the observed
confinement time with neoclassical theory
for an ohmically heated discharge in
Alcator. (Gondhalekar, A et al
Proceedings of 7th IA E.A. International
Conference, Innsbruck, 1978, Vol 1, 199
IA E. A, Vienna A979))
The Alcator series of tokamaks features very high values of the toroidal
field, exploiting the technology of high field magnets developed at MIT.
This allows impressive values of the plasma pressure to be obtained at
relatively low y6, even without additional heating.
In Alcator-A, with 5^ up to 10 T and R = 0.54 m, the plasma current
density (proportional to B,f,/R at constant q), was an order of magnitude
larger than in conventional tokamaks. Since it is found experimentally that
the plasma density which can be achieved is proportional to the current
density, discharges with a wide range of densities up to 10^^ m"^ could
be produced. The energy containment time was found to increase almost
linearly with the plasma density over more than a factor of ten, a scaling
which is now called Alcator scaling (Fig. 11.5.1).
At the highest densities classical electron-ion equipartition is strong
enough to equalize the electron and ion temperatures and the major energy
loss from the centre is due to neoclassical ion heat conduction rather
than electron conduction. The discharge becomes almost impermeable
to neutrals so that the rate of ionization at the centre due to gas feed
at the boundary is very small. In spite of this, centrally peaked density
profiles were found, implying substantial inward convection of plasma
comparable to, or larger than, the neoclassical pinch effect.
At low density, where the electron drift velocity is an appreciable
fraction of the thermal velocity, the discharge behaviour changed. The
electron distribution function was found to be strongly distorted and
anomalous electron-ion coupling was observed. This regime is called
'slideaway' to distinguish it from a 'runaway' discharge in which the
plasma current may be carried by a small number of very energetic
electrons.
In the somewhat larger Alcator-C tokamak the toroidal field was even
higher, up to 12 T At first it was found that the energy confinement time
did not continue to increase with density, but 'saturated' at relatively low
values. This effect was observed on other devices and was ascnbed to
neoclassical ion losses, which increase with density. Sometimes these
had to be multiplied by a factor of several times to fit the results, and
later results indicated that ion transport is also anomalous with a thermal
conduction coefficient similar in magnitude to that for electrons.
Experiments using injection of solid deuterium pellets which can
penetrate to the discharge centre showed that more peaked density profiles
can be recovered by using this technique. In these discharges the energy
confinement time was improved and values of nre ~ 10^° m~^ s were
achieved.

11.5 Alcator A, Alcator C, and Alcator C-Mod
Alcator C-mod
Alcator C-Mod was first operated in 1993. It is a compact high-field
tokamak with a closed divertor and capabilities for strong plasma
shaping. Research is centred on the following areas. A) Transport studies on
C-Mod provide tests of theoretically based interpretations and
empirical scalings at unique plasma parameters. B) Divertor studies with
high-scrape-off layer power density and high divertor plasma density.
C) Ion-cyclotron radio frequency power is used for the investigation
of wave absorption, parasitic losses, and mode conversion processes.
D) Mhd studies focusing on disruption effects and mitigation.
C-Mod has a major radius of 0.68 m and a minor radius of 0.22 m.
The toroidal field ranges from 2.6 to 8.0T and plasma current from 0.4
to 1.5 MA. The high current density allows operation at high plasma
density, and line averaged densities of 1.2 x 10^^ m~^ have been reached
The auxiliary heating method is ICRF, employing hydrogen minority in
deuterium plasmas at 5^ = 5.3 T as the pnncipal scenario. Up to 5 MW of
RF power have been coupled to the plasma. The first wall is fabricated with
molybdenum tiles and is designed to take the very high power loadings
which occur in this expenment. H-modes are easily obtained with both
ohmic and RF heating, and over a wide range of plasma conditions.
A new H-mode has been discovered and studied. Called EDA for
Enhanced D-Alpha H-mode it combines good energy confinement with
moderate particle transport, avoiding impurity concentration. There are
no large ELMs, the H-mode edge gradients apparently being relaxed
by a continuous mode localized in the pedestal region. Ion
temperature profiles show 'self-similarity' in both L-mode and H-mode, T/gradT
being approximately constant, consistent with transport models featuring
a sharp increase in turbulence when the temperature gradient length drops
below a cntical value. The formation of internal transport barners has
been observed under a variety of conditions. Their formation produces
strongly peaked density profiles, with a minimum in the density scale-
length occurring near r/a = 0.5, and significantly reduced transport in
the core region.
In divertor operation three regimes of transport along the magnetic
field have been identified—sheath limited, conduction limited with the
formation of temperature gradients along the field lines, and the detached
divertor plasma with pressure drop along the field. In moderate and
low-density discharges the scrape-off layer exhibits a two-layer
structure with a steep profile near the separatrix and a flat profile further out.
Figure 11.5.2 gives typical temperature and pressure profiles across the
flux surfaces measured simultaneously at the outer divertor target plate
and a position upstream of the outer divertor. As the plasma density is
increased the electron temperature gradients along the field lines increase,
being highest near the separatnx. At high plasma density the electron
temperature at the divertor target can be reduced to a few eV. Under those
conditions ion-neutral collisions remove momentum lowenng the
electron pressure at the target plate. This 'detached' plasma region develops
first near the divertor strike-point location and significantly reduces the

Fig. 11.5.2 Showing the change in
electron temperature and pressure profiles
with increased plasma density. The profiles
are measured across the flux surfaces near
the separatnx both upstream and at the
divertor
10 15 0 5 10 15
Distance beyond separatnx (mm)
peak heat flux onto the divertor target. The cross-field transport in the
outer zone occurs largely through intermittent bursts. Radially correlated
structures extending to the outer wall are seen in the video images of the
plasma turbulence. As a result of the rapid cross-field particle transport
in this zone, operation is predominantly in the 'main chamber recycling
regime' where particle fluxes to main chamber surfaces are large
compared to the particle flow along field lines to the divertor. At densities
approaching the density limit the zone of bursty cross-field transport is
found to extend inside the closed surfaces, indicating a possible role in
determining the density limit.
Virtually all disruptions in Alcator C-Mod are either caused by, or
result in, fast vertical displacement of the plasma, eventually terminating
in contact with internal hardware at the top or bottom of the vacuum vessel.
Spatially resolved measurements of the halo currents reveal sigmficant
toroidal asymmetry, usually an n = 1 component superimposed on an
n —0 background with comparable amplitudes.
TFR—Commission d'Energie Atomique,
Fontenay-aux-Roses, France
The first embodiment of the tokamak at Fontenay-aux-Roses, TFR-400
was built along the classical lines developed at the Kurchatov Institute.
It was of a similar size to T-4 but with a toroidal magnetic field of 6.0 T

This allowed plasma currents up to 400 kA to be used, making it for some
time the most powerful tokamak in the world.
Initial expenments at relatively low density produced large fluxes
of runaway electrons. Measurements of the radioactivity induced in the
limiter by photonuclear processes showed that electrons with energies up
to 17 MeV must have been confined.
Plasma heating by up to 1 MW of neutral beam injection at a small
angle to the major radius was used. This is an efficient method of heating,
provided the plasma density and current are high enough to prevent shine-
through of the injected beam and losses of fast ions on banana orbits. Ion
temperatures up to 1.8 keV were achieved and studies of the ion energy
balance indicated thermal conduction coefficients several times higher
than the neoclassical values.
A major modification to the experiment, renamed T F R-600, involved
the removal of the copper shell and the installation of a larger, high
resistance vacuum vessel made of inconel. Plasma equilibrium was maintained
by a fast feed-back system for the vertical field. The use of discharge
cleaning in addition to baking of the vacuum vessel, which had been the
main method of conditioning on TFR-400, resulted in cleaner, higher
density plasma.
An intensive programme was undertaken to develop ion cyclotron
resonance (ICRH) as a heating method for tokamak plasmas. The
relatively large space between the limiters and the vacuum vessel allowed
antennas of increasing sophistication to be installed. However, there
appear to be some residual problems with impurity generation due to
heating of the plasma near the antenna-plasma interface, where coupling
of electromagnetic energy into plasma waves takes place.
ICRH has a tendency to produce ions with high perpendicular velocity,
trapped in mirrors produced by individual toroidal field coils which then
escape by dnfting vertically. These were detected on TFR using specially
designed Faraday cups. Similar effects are produced by resonance with
impurity ions, which in pnnciple provides a method for selective impunty
transport, albeit at the expense of considerable power.
DUE—Culham Laboratory, Abingdon, UK
DITE stands for Divertor Injection Tokamak Experiment, which
describes its main features. It was a medium-sized device equipped with
a unique 'bundle divertor' and with plasma heating by tangential neutral
beam injection.
The divertor action was produced by two small coils designed to make a
localized loop in the toroidal field near the outside edge of the discharge
Only a part of the toroidal flux was diverted by this means, forming a

11.7 DUE
571
Fig. 11.7.1 Showing the reduction in
them = 2 component of the magnetic field
fluctuations in DITE on the apphcation of
feedback control The bursts of increased
signal during the stabilized period are
coincident with sawteeth.
tube of field lines which is referred to as the diverted flux bundle. The
rotational transform produced by the plasma current connects the diverted
flux bundle to an annular region around the central part of the discharge,
which is relatively unaffected by the short-range divertor field.
Observations of plasma and energy exhaust through the divertor, and
of a reduction in contamination of the discharge by metallic impurities
from the wall were made, demonstrating the main divertor functions for
this configuration.
Studies of confinement and neutral beam injection in non-diverted
discharges were also made. For much of this work the torus was gettered
with evaporated titanium to reduce contamination by low atomic number
impurities such as oxygen. This allowed higher current (q^ ~ 2) and
higher densities to be achieved, especially when combined with neutral
beam injection.
The maximum density could not be extended indefinitely by increasing
the power input to the discharge and could be represented by the formula
Mqa < 20m-2r-i, where M = ihs/lO^'^)R/B^ is the Murakami
parameter. This formula implies a linear increase of the number of particles
per unit length of the discharge with plasma current, independent of the
toroidal field.
Tangential neutral beam injection gives rise to a circulating current of
fast ions which can be used to aid or oppose the plasma current. This
effect, predicted by Ohkawa, was demonstrated on DITE using ~1 MW
of 25 keV hydrogen beams injected into target plasmas of deutenum and
helium.
Magnetic feedback was used to explore the stabilization of disruptions,
and experiments demonstrated a substantial reduction of the saturated
level of m = 2 tearing mode as shown in Fig. 11.7.1. The feedback
loop used 32 pick-up coils and fed stabilizing currents to eight saddle
coils placed inside the vacuum vessel. This system also allowed the
investigation of other features of mhd stability by the imposition of
controlled magnetic perturbations

11.8 PLT—Princeton Plasma Physics Laboratory, USA
Following the successful operation of smaller tokamaks in the early
1970s, a second generation of larger devices was built of which the first
were the T-10 tokamak and the Princeton Large Torus. The approximately
two-fold increase in linear dimensions increased the energy confinement
time from a maximum of ~25 ms to ~ 100 ms, the scaling expected from
diffusive loss processes. The plasma current was also increased to more
than 0.5 MA.
The plasma temperature achieved by ohmic heating alone was not
substantially higher than that obtained in smaller tokamaks. However,
the relatively good access to the torus allowed more than 2MW of
tangential neutral beam heating to be applied. When the plasma density and
impurity content were held down by 'gettering' the torus with titanium,
the additional heating raised the ion temperature to record values of 7 keV.
The corresponding value of the ion collisionality parameter, the number
of collisions during a trapped ion orbit, is comparable to that required for
a reactor.
The momentum input due to neutral beam injection caused plasma
rotation in the toroidal direction at velocities of typically 10^ ms ~ ^
Measurements of the Doppler shift of spectral lines due to various impunties
give the radial profile of the toroidal velocity and hence the damping due
to viscosity. The momentum damping time was measured to be ~20 ms at
the centre of the discharge. As with particle and energy confinement, this
is much shorter than can be explained by classical collisional processes.
Plasma heating at the lower hybrid frequency was also tried. Here,
the heating is less efficient. However, using LH waves propagating in the
toroidal direction, it was possible to sustain plasma currents of ~300 kA
for several seconds, demonstrating the principle of a DC tokamak. The
current was earned by electrons of several times 100 keV energy, whose
velocity matched that of the wave. The process by which thermal electrons
achieved these energies was then not understood.
T-10—Kurchatov Institute, Moscow, USSR
Tokamak-10 is of conventional design with a modest aspect-ratio. The
main programme of work has been a study of transport processes, with
the emphasis on ohmically heated discharges.

11.10 ISX
573
The particle transport has been extensively studied by a variety of
techniques, following work on the earlier T-3 and T-4 tokamaks. A multi-
chord microwave interferometer was used to study the transient response
to a change in the particle source term produced by suddenly increasing,
decreasing, or modulating the gas feed to the discharge. Analysis of this
response allows the variation of the mean fluid velocity with radius to be
found. It can be modelled by a combination of diffusion and inward
convection. Similar results have been obtained for the transport of impurity
ions. In this case small quantities of gaseous or solid impurities which
do not occur naturally were injected into the discharge. Their subsequent
transport was studied by spectroscopic methods.
Using powerful gyrotron oscillators, up to 1 MW of power has been
applied at the electron cyclotron resonance frequency. The central
electron temperature mcreases from 1.4 to 4keV, while the change in ion
temperature is consistent with electron-ion energy transfer by Coulomb
collisions. The slight decrease in global energy confinement can be
explained by an electron thermal conductivity which is proportional
toy?;.
The localized heating which can be applied at the electron cyclotron
resonance frequency allows appreciable modification of the electron
temperature profile. This in turn leads to a redistribution of the plasma
current and to changes in the mhd stability of the discharge. For example,
by applying localized heating near or just outside the magnetic surfaces
where q = I and q = 2, the sawtooth oscillation and the m = 2, n = 1
tearing mode instabilities are suppressed. Since the latter mode is almost
always observed as a precursor to a major disruption, the most dangerous
form of tokamak instability, this result offers the potential for its control.
More recent work has focussed on the use of electron cyclotron wave
current drive for modifying the current profile and also driving a
substantial fraction of the plasma current non-inductively. It is less efficient
than using lower hybrid waves but has much greater potential for
application to reactor-scale devices. The programme on T-10 contributed very
significantly to the development of powerful gyrotron sources for fusion
application.
ISX—Oak Ridge National Laboratory, USA
The Impunty Study Experiment was built as a successor to the successful
ORMAK (Oak Ridge Tokamak).
Studies of the energy confinement time as a function of density
provided the first clear demonstration of a saturation or decrease of global
confinement at high density, which was attributed to the increasing
importance of neoclassical ion conduction losses.

11.11 FT and FT Upgrade
The second assembly, ISX-B, allowed discharge cross-sections of
vertically elongated form and was equipped with tangential neutral beam
injection at a power level up to 2.5 MW, and later with electron cyclotron
resonance heating. In addition to impurity transport, ion and electron
heating, and energy and momentum confinement were studied.
The large power to volume ratio allowed record values of toroidal y6 of
~2.5% to be achieved early in the programme. However, it was soon
realized that a 'soft' y6 limit occurs which can be expressed as a degradation of
the confinement time as the power input increases This effect is ascribed
to pressure-dnven mhd instabilities and is correlated with increased
fluctuations of the magnetic field measured at the discharge boundary.
The decrease in confinement time observed with neutral beam
heating IS not due to toroidal rotation This is clear from observations with
co-injection plus counter-injection in which the toroidal rotation is small
but the degradation of confinement is still present.
FT and FT Upgrade—Centro Ricerche Energia,
ENEA, Frascati, Italy
The Frascati Tokamak, FT, was designed for operation at toroidal fields
of up to 10 T In this respect it was similar to the Alcator tokamaks at MIT,
though somewhat larger. As a consequence of the high field the ohmic
power density was relatively high, allowing operation at high plasma
density.
The dependence of the plasma parameters on density in ohmically
heated discharges has been a subject of particular study. The constancy
of the loop voltage suggested a scaling for the electron energy confinement
of the form given by Coppi and Mazzucato. Comparison with the smaller
Alcator-A tokamak shows that the confinement time increases with at least
the square of the linear dimensions and confirms that, at high density,
the losses from the discharge centre can be entirely accounted for by
neoclassical ion conduction.
At low density, the central electron temperature was increased by about
700 eV using lower hybrid wave heating at 2.45 GHz. The electron heating
efficiency dropped sharply as the density was increased and the RF power
was absorbed by hydrogen ions
FT upgrade
The very good confinement obtained in relatively small, high field
tokamaks led to the construction of Frascati Tokamak Upgrade with
a minor radius of 0.3 m and a major radius of 0.93 m. The machine
operates up to the design parameters of 8 T toroidal magnetic field and

11.11 FT and FT Upgrade 575
Fig. 11.11.1 Five pellets injected at 100 ms invervals raise the central electron
density to 6 x 10^° m~^, while the electron temperature penodically recovers with ai
increasing neutron yield (Fngione, D etal Nuclear Fusion 41, 1613B001))
1 6 MA plasma current, and at high density A high-speed multiple
pellet injection system which injects up to eight pellets at 1 3kms'"^ has
allowed the achievement of a quasi-steady state lasting a few energy
confinement times and improved confinement properties with re ^ 100 ms,
which IS 1 7 times r"^^^"^^^ These discharges have peaked density
profiles with a central electron density up to 8 x 10^° m~^, equal ion and
electron temperatures of 1 5 keV, and Zgff down to 1 3 An example is
shown in Fig 11.11.1 Transport analysis shows that in the post-pellet
phase the core electron thermal diffusivity is substantially reduced, with
Xe < 0.1 m^s~^andthetransport,whichisdominatedbytheionchannel,
drops to neoclassical levels The resulting values of the fusion product,
nxETu are around 10^°m~^keVs.
Various RF heating schemes are installed and applied at magnetic
fields between 5 and 8 T The 8 GHz lower hybnd system with a pulse
length of 1 s and power up to 3 MW has been used for current drive and
plasma heating in vanous conditions including relatively high density,
high field plasmas with n = 1 2 x 10^° m~^ at a toroidal field of 7 9 T
The density dependence of the efficiency is in agreement with theory
At 5 T, stabilization of tearing modes has been obtained using 140 GHz
ECRH with powers up to 1 6 MW with a subsequent improvement of
the energy confinement Electron temperatures up to 14keV have been
obtained at a density 5 x lO^^m"^ using ECRH dunng the current ramp
Ion Bernstein wave injection at 433 MHz has produced a reduction of the
electron thermal conductivity in the region inside the absorption radius
possibly due to the formation of an internal transport bamer

11.13 ASDEX
Synergy studies have been performed with simultaneous injection
of lower hybnd and ICRH waves well above the electron cyclotron
resonance with a toroidal field of 7 2 T. Evidence has been obtained of
ECRH wave absorption by the electron tails produced by the lower hybnd
waves.
Doublet-Ill—General Atomic Company,
San Diego, USA
The name of this expenment refers to the proposed shape of the plasma
cross-section which originally was designed to take the form of two pear
shaped lobes joined by a narrow waist This had a large penpheral length
which allowed a very small effective aspect-ratio The advantages are a
high current capability with a modest toroidal field and hence operation
at high yg
The flexibility of the poloidal field allowed the ellipticity and
triangularity of the discharge cross-section to be varied over wide ranges,
the main interest being in the effects of these changes on the stability and
confinement properties It also allowed several divertor-like
configurations to be produced with a poloidal field null-point near the waist in the
vacuum vessel. These proved surpnsingly effective in preventing
recycled neutrals and impurities from entenng the main discharge, in spite
of the relatively large aperture of the vacuum vessel at the waist This is
explained by the large thickness of plasma in the region of poloidal flux
stagnation which provides an effective bamer to recycling impunties
The installation of up to 7 MW of additional heating by neutral beam
injection allowed the effects of ellipticity and triangularity on the
maximum y6 to be explored In general good agreement with the ideal theory of
kink and ballooning modes was found The maximum y6-value obtained
was 4 5%, in the range required for an economic fusion reactor
Approximately 1 MW of electron cyclotron resonance heating was
also used The same reduction in confinement time was obtained as with
neutral beam injection at the same power level, strongly suggesting that
this is a property of the discharge rather than the method of heating.
ASDEX—Max-Planck Institut fur Plasmaphysik,
Garching, Germany
The Axial Symmetric Divertor Expenment, ASDEX, was operated from
1980 to 1990 The divertor field was produced by multiple coils, parallel
to the plasma current, positioned at the top and bottom of the discharge

11.13 ASDEX 577
This gives nse to a separatnx which limits the plasma and avoids the
direct plasma contact with matenal surfaces Both double-null and single-
null operation was possible, the cross-section inside the separatnx being
nearly circular
The heating was by NBI, ICRH, and LH The NBI power was up to
4.5 MW, the ICRH supplied 3 MW to the plasma and the lower hybnd
system provided initially 1.5 MV at 1 3 GHz and later 2 MW at 2 45 GHz
In very clean plasmas the ohmic energy confinement time saturated
at densities greater than 3 x 10^^ m~^, but this saturation could be
overcome in so-called IOC (Improved Ohmic Confinement) discharges which
had low-Z impunty radiation from the plasma edge with associated
peaked density profiles The level of saturated ohmic confinement in
clean plasmas was dependent on the isotope mass, deutenum having
better confinement than hydrogen
Auxiliary heating led to the expected degradation of confinement but
in 1982 a regime of improved, or H-mode, confinement was discovered
This was first observed in a single-null discharge with the ion grad-B
dnft toward the X-point and a heating power of 3 MW The improvement
in confinement was a factor of two above the previous, L-mode, results.
Figure 11 13 1 shows the response of the electron temperature to the
application of NBI for an H-mode as compared with an L-mode. The
H-mode was subsequently obtained using ICRH
The H-mode was subject to a power of 1 MW with a single-null and
1 8 MW with a double-null. The threshold was typically increased by
a factor of two when the ion grad-5 dnft was directed away from the
X-point in the single-null configuration, or when the H-mode was
operated in hydrogen rather than deutenum plasmas Additionally the H-mode
required an electron density above around 2-3 x 10^^ m"^ It was found
that the H-mode is associated with an edge transport barrier inside the
separatnx, leading to steep gradients in density and temperature. The
density fluctuations were strongly reduced in this region A new
instability appeared in the H-mode and was termed the ELM (Edge Localized
Mode) The H-mode is further discussed in Section 4 13 and ELMs in
Section? 17 The H-mode has become a central feature of fusion research
and IS now reproduced on a regular basis in other tokamaks
Fig. 11.13.1 Time dependence of
central electron temperature for L and H
discharges The neutral injection heating
phase IS indicated by the hatched time
interval (Wagner, F ,etal Physical
Review Letters 49, 1408 A982).)

11.13 ASDEX
Stationary non-inductive currents up to 480 kA were dnven using
lower hybnd waves, the efficiency agreeing well with theory The current
profile depends upon the wavenumber spectrum {n\\ = k\\c/co) and is
different from the ohmic current profile It was possible therefore to modify
the current profile and in particular to flatten it in the central region This
led to ^0 > 1 with a consequent stabilization of sawtooth oscillations and
a strong central electron heating with Te up to 8 keV
The disruption density limit was highest for values of ^cyi below 2 and
could be further increased by NBI heating and pellet injection Clear
evidence was found that the density limit occurs at radiation power
levels below the input power
With the closed divertor configuration, reliable and flexible plasma
operation with good confinement and low impunty levels was
possible When, for a time, bypasses for neutral gas from the divertor to
the main chamber were introduced, it was found that access to the
H-mode was severely restricted and the quality of the H-mode was
reduced
The power loading to the divertor plates had an imbalance between
the outer and inner separatnces. Under L-confinement the asymmetry
ratio was typically 3 or 4 to 1, but when the grad-5 dnft was away from
the X-point the ratio fell to 2 1, and with counter injection to nearly
1 1 From 20% to 65% of the power entenng the scrape-off-layer, Psol,
could be dissipated in the divertor through the volume-loss processes of
radiation and charge-exchange, the larger values being associated with
higher density and lower isotope mass.
In the latter phase of ASDEX, when systematic investigations of the
divertor plasma were earned out using a reciprocating Langmuir probe,
the width of the power-carrying layer in the divertor, an important
parameter in determining the power flux at the target plate, was found to
scale as T^^^q^^ with a range of l^cm, Ted being the peak electron
temperature in the divertor For moderate q^ and conditions far from the
density limit the width was typically 1 cm
At the density limit the values of Tgd were in the vicinity of 5-7 eV
The edge density limit could be raised with heating power, roughly
as P^J, such that at maximum heating the peak density in the
divertor, tied, could be dnven to near 1 x 10^° m~^ before a disruption
occuned.
For ohmic and L-confinement plasmas, Wed was related to the mid-
plane separatnx density ties as n^d ~ nlJ, whereas Ted ~ n~^^ ^ P^J' Since
the line density of the divertor plasma never sigmficantly exceeded
2 X 10^^ m"^, neutrals could penetrate this plasma, thereby limiting
access to the high recycling regime to plasmas with strong additional
heating Thus, Wed was generally only marginally in excess of Wes-
The scrape-off layer/divertor-parameters appear to be
consistent with classical heat transport along the magnetic field The
perpendicular transport was anomalous with typical coefficients
D ~ 0 5-1 Om^s~^ and Xi ^ D ^ XeP D is close to Bohm diffusion

11.14 TEXT 579
in magnitude, but there is no convincing evidence that transport is indeed
Bohm-like
ASDEX upgrade
ASDEX Upgrade is the successor to the 'closed' divertor ASDEX
experiment and was designed to develop a reactor-compatible open diver-
tor configuration The device is similar in size to ASDEX but has
an elongated plasma and a larger current and toroidal magnetic field.
Operation started in 1991. A full descnption is given in Section 12.6.
TEXT—University of Texas, Austin, USA
The pnncipal aim of the TEXT experiment was to advance the
understanding of turbulence and transport through diagnostic
development and the companson of expenment with theory.
Comparison of the particle flux, determined from measurements of Hq,
emission and the calculated flux expected from the turbulence measured
with Langmuir probes, indicated that most, if not all, of the particle flux
at the edge was driven by electrostatic turbulence. A large part of the total
heat flux was carried by the resulting convective heat flow but generally
the heat flux is less well accounted for by electrostatic perturbations.
In the main plasma the fluctuations were found to decrease toward the
plasma centre.
In an examination of the role of the radial electric field in determining
the fluctuation level and hence confinement it was found that in the edge
plasma the turbulent transport mechanisms are reduced due to the shear
in the naturally occurring E x B velocity.
The diffusion coefficient of runaway electrons was estimated by
modifying the plasma equilibrium either with a simple shift of the plasma or
by applying magnetic perturbations to ergodize the outer region. The
response of the hard X-ray signal was interpreted using a diffusive model
and gave a diffusion coefficient ~1 m^ s"^. A study was made of the
modifications to transport resulting from the application of perturbing
magnetic fields. A detailed comparison was made, both with numerical
calculations using test particles, and with analytic models of transport in
stochastic fields.
An investigation of the growth and saturation of m = 2 tearing modes
showed general agreement with Rutherford's model for the nonlinear
growth of the magnetic island. Strong tearing mode instability was
found to be associated with the absence of sawtooth oscillations and

11.15 TEXTOR
this appeared to be due to the dependence of tearing mode stability
on^(O).
11.15 TEXTOR—Forschungszentrum, JiJIich, Germany
TEXTOR has been used for research into the deposition of low Z
materials on to plasma facing surfaces, and this work has been
influential in the move to the use of such materials m other tokamaks. The
initial expenments introduced carbonization, a technique in which
carbon is deposited over the entire inner wall by means of a flow of methane
(CH4 or CD4) into a radio-frequency assisted, DC glow discharge. This
procedure led to a significant improvement in performance, with an
increase of 50% in the density limit. The impurity release from the
walls during discharges was greatly reduced, with reduction factors of
5-8 for oxygen and 10-20 for metals. In further experiments boroniza-
tion and siliconization were used, leading to lower oxygen and carbon
contamination.
The careful measurement of the ^-profile on TEXTOR using Faraday
rotation had a crucial impact on the analysis of sawtooth oscillations.
Theoretical models predicted that after a sawtooth collapse the central value
of q would be close to one. The experimental measurement showed that
^0 remained well below one throughout the sawtooth cycle as described
in Section 7.6.
A concept introduced and studied experimentally on TEXTOR is
that of the pump limiter. Such a limiter presents a wedge shape to
the scrape-off layer, the near face of the wedge leading to a pump.
This allows improved control of the density and the study of the
exhaust of injected helium and gaseous impurities. The combined
helium transport in the plasma core, in the boundary layer and in
the pump limiter led to an overall dwell-time of helium of about ten
energy confinement times a value just short enough to satisfy reactor
requirements.
The problem of avoiding excessive heat loads at the leading edge
of the pump limiter has been overcome by generating a cold radiative
plasma boundary employing injected neon as radiating impurity. With a
well controlled neon level, up to 90% of the total power has been
radiated from the plasma boundary in stable and quasi-stationary discharges
without degradation of energy confinement or helium exhaust efficiency.
These radiatively cooled discharges led to the discovery of the Radiative
Improved confinement mode (Rl-mode). Figure 11.5.1 gives an example
with a confinement quality of the ELM-free H-mode at a density near the
Greenwald limit. This mode can be obtained at poloidal y6 up to 1.5 and

11.16 Tore Supra
Fig. 11.15.1 Temporal evolution of
H-mode enhancement factor H93 and Ime
averaged electron density he m a long
pulse Rl-mode discharge in TEXTOR
Up = 350 kA, B0 = 2 25 T, q^ = 3.8,
Prad/Ptot = 70%)
!
- /
:
-
160te
Greenwald density limit
III!
H93
n,ilO^°m-')
1 1
„*-H
-
1
2 3 4 5 6 7
Time (s)
at edge q values down to 2.8. The radiated power fraction is typically in
the range of 70-90% without signs of detrimental accumulation of the
applied impurities in the core. Benefiting from the exhaust option due
to the pump limiter, the Rl-mode becomes stationary over the discharge
duration of up to 10 seconds.
An expenment introduced into TEXTOR is the dynamic ergodic diver-
tor which combines the conventional ergodic divertor with the rotation
of the underlying perturbation field. The resulting increase of the
electron density and the decrease of the electron temperature at the plasma
boundary in conjunction with enhanced radial transport lead to improved
radiation efficiency of impunties and better impurity screening. The
rotation of the perturbation field was introduced because of the excessive heat
load at the 'footprints' on the divertor plate. This increased the 'wetted'
area by more than an order of magnitude.
11.16 To""® Supra—CEA Cadarache, France
Tore Supra was built to investigate physics and technology issues related
to steady-state plasmas. Its main features are (i) superconducting field
coils cooled by superfluid helium at 1.8 K, (ii) actively cooled plasma
facing components made of graphite and later of carbon fibre composite
reinforced graphite elements, brazed on a metallic substrate cooled by a
pressurized water loop, (iii) long pulse lower hybrid current drive (8 MW
generator power), and ICRH A2 M W generator power). Particle inj ection
involves a continuous pellet injector and supersonic gas injection. This
machine was originally equipped with an ergodic divertor and a set of
discrete limiters. These have now been replaced by a toroidal pump limiter
with ability to deal with a high power density, raising the power handling
capability to more than 20 MW in steady state.

11.16 Tore Supra
The actively cooled plasma facing components which allow the
extraction of heat in steady-state conditions have been successfully tested with
the development of power density handling in the 10-15 MW m~^ range.
Investigations have also been carried out to examine plasma-wall heat
transfer both by plasma convection to limiters and by radiation. In the
latter domain, promising results were obtained with the ergodic diver-
tor which produces stable radiative layers at the expense of a modest
core pollution. Additional beneficial effects are the particle
screening in the ergodic field, and a higher radiation efficiency of impurity
ions at the plasma edge. In addition to heat exhaust, particle exhaust
schemes have been examined in limiter and divertor configurations. In
all cases a significant particle exhaust E-10% of the recycling flux) was
obtained.
Lower hybrid waves C.7 GHz) have been used to drive current and to
modify the current profile. Discharges lasting 120 s were produced with a
0.8 MA current at a central electron density of 2 x 10^^ m"^ using 2.5 MW
of lower hybnd waves. Results for the longest such plasma are shown in
Fig. 11.16.1. The plasma was fully non-inductive for the first 180 s, when
a drop in the Lower Hybrid power necessitated the reapplication of 0.1 V
per turn. The behaviour of the fast electrons has been investigated, and it
was found that their radial transport was slow compared to the collisional
relaxation time.
The fast wave D8 MHz) has been successfully coupled to the electrons
and the results were found to be in good agreement with theory. Strong
central electron heating was observed and also a driven current (80 kA)
when an appropriate phasing was applied. Scenarios have been tested in
which up to 70% of the plasma current was bootstrap current.
The plasma stability and confinement can be enhanced using the
various systems designed to control the plasma and its profiles. In many cases,
current drive experiments increase the magnetic shear at the edge. This
results in an improvement of the plasma confinement. Similarly shear
Fig. 11.16.1 Tore-Supra discharge with
a duration of 4 nun 25 s in which 0 75 GJ
was exhausted from the plasma Time
evolution of (a) plasma current, loop
voltage, and LHCD power (b) central line
integrated density, electron temperature at
normalized radius 0.3 and the Mimov coil
(MA) Q4
^loop 0.2
(V)
". 2
1
0
i
r
fu«--
I
Tt
^
'
WrflWf
/p
^^^=^:yT~lZr^' J
^LHCD 1
• yr \ 1 .
Mirnov signal ^^^^jggJ
^LHCD
2 (MW)

11.17 COMPASS
583
cancellation or reversal close to the axis leads to improved plasma core
performance.
The ergodic divertor stabilized the mhd activity around the ^ = 2
surface, probably by expelling the current from the exterior. In addition
a transport barrier (temperature pedestal), was observed between the
ergodic zone and the plasma core. Whilst this was accompanied by a
decrease of the turbulence, it is thought more likely that the barrier was
caused by the inward drift associated with the strong radial gradient of
the ergodic fields.
COMPASS—UKAEA Culham Science Centre,
Abingdon, UK
COMPASS (COMPact ASSembly) started operation in 1989, and in
1992 there was a major upgrade when the circular vacuum vessel
(COMPASS-C) was replaced by a D-shaped continuous inconel vessel
(COMPASS-D). The programme has focused on addressing key issues for
Next Step tokamaks, in particular the onset and control of performance
limiting instabilities such as neoclassical tearing modes, the impact of
error fields, disruption effects such as halo current generation and the
characteristics of H-mode plasmas with strong electron heating.
COMPASS-D is equipped with 2MW, 60 GHz electron-cyclotron
heating and current drive together with 0.6 MW, 1.3 GHz lower hybrid
current drive. The magnetic field system allows a range of plasma
configurations to be established, including those foreseen in a burning
plasma. It is also equipped with a saddle coil set which can be used
to apply a wide range of helical resonant magnetic perturbations to the
plasma.
Upon application of such resonant magnetic perturbations, it is
observed that there is a sharp threshold amplitude above which large
stationary magnetic islands are induced. This is consistent with a model
in which a rotating plasma resists the penetration of the externally applied
perturbation until the plasma velocity in the vicinity of the resonant
surface is sufficiently reduced. This model allows the prediction of the effects
of error fields in future large tokamaks and predicts a very low threshold
for penetration in ITER.
Resonant magnetic perturbations have also been used to provide
measurable and controllable 'seed islands' for neoclassical tearing mode
growth in high beta electron-cyclotron heated plasmas. In this way the
critical seed island size can be directly measured leading to increased
understanding onset criteria. Furthermore, current profile control by
lower hybrid current drive has been successfully used to fully stabilize
neoclassical tearing modes, allowing higher beta. An example is shown
in Fig. 11.17.1.

Fig. 11.17.1 Stabilization of an m = 2,
n = 1 neoclassical teanng mode by lower
hybnd current dnve in COMPASS-D the
traces show the mode activity as indicated
by the fluctuating poloidal magnetic field,
Doloidal beta, and lower hybrid power
Warrick, CD et al Physical Review
Letters 85, 574 B000))
H-mode access and confinement has been studied with and without
electron-cyclotron heating which heat electrons, does not inject
significant momentum, and does not contribute to fuelling. In these
respects ECH has many similanties with alpha particle heating in a
burning plasma. A comprehensive set of edge pedestal diagnostics has allowed
a study of the evolution of key pedestal parameters, including plasma
rotation and radial electric field, with a time resolution of 0.1-2 ms, and spatial
resolution of 2-5 mm, giving information on the dynamics of the H-mode
transition and the factors governing the power threshold. In particular, it
has been demonstrated that the H-mode transition is not preceded by
development of a large radial electric field, E^, but rather that changes in
E^ occur simultaneously with the development of the edge pedestal.
11.18
RTP—FOM Institute of Plasmaphysics,
Rijnhuizen, The Netherlands
The FOM Institute for plasma physics 'Rijnhuizen' operated the tokamak
RTP (Rijnhuizen Tokamak Project) from 1989 to 1998. The main
parameters of this device were major radius 0.72 m, minor radius 0.16 m,
circular cross-section with a boronized vessel, a toroidal field on axis up to
2.4 T and a toroidal plasma current up to 120 kA. The research programme

Fig. 11.18.1 Profiles of the electron
temperature of electron-cyclotron heated
plasmas, measured with high resolution
Thomson scattenng. p is the normalized
radius. The arrows indicate the power
deposition radius for each profile
focused on anomalous transport phenomena, and in particular electron
heat transport.
The special conditions of the RTF tokamak allowed experiments on
pure electron transport to be earned out. Fower was supplied by electron-
cyclotron resonance heating, with 500 kW at 110 GHz. Because of the
modest machine size this electron heating exceeded the ohmic input by a
factor 4 with off-axis heating and 7 with on-axis heating. The electron-
ion energy transfer was negligible and consequently the energy balance
essentially involved only the electrons
The heating pulse duration was typically 50 energy confinement times
and 10 global current diffusion times, so that real steady-state conditions
could be reached Furthermore, the tokamak was large enough to allow
good localization of the ECRH power to within 10% of the minor radius
The high resolution electron diagnostics included a Thomson
scattenng system, giving full profiles of Wg and T^ with 3 mm spatial
resolution Figure 11 18.1 shows measured T^ profiles obtained for
different settings of the ECRH deposition radius As expected, the
profiles outside the deposition radii coincide. For deposition far from
the axis the steady-state temperature profiles become distinctly hollow.
The hollowness could not be explained by heat losses from the plasma
centre
A stnkmg observation is that the Tg profiles obtained by varying
the ECRH deposition radius do not change smoothly Figure 11.18.2
shows the central Tg as a function of the deposition radius, which
for this expenment was vaned with 1 mm steps This shows that the
plasma makes sharp transitions between one type of profile and the

11.19 START, MAST and NSTX
Fig. 11 18.2 A shot-to-shot scan of the
ECH deposition radius revealed step-wise
changes of the electron temperature
profile Five main levels and two sub-levels
of TeCO) were identified The mangles are
the data points and the line is drawn to
guide the eye
02 03
next. An analysis of measured Te profiles on either side of a
transition clearly shows that a transition corresponds to the loss of a narrow
region with a steep Te gradient, with its implied electron transport
barrier. These transitions, and hence the barriers, could be associated—
through the appearance of mhd modes—to rational q values, q =
3' 2
It is noteworthy that the transitions occur for a change
of the deposition radius that is much smaller than the actual width
of the deposition pattern indicating that the transitions correspond to
bifurcations of the equilibrium. The transitions are also sharp in time.
When the deposition was moved dynamically a distinct hysteresis was
found
START and MAST—UKAEA Culham Science
Centre, Abingdon, UK and NSTX—Princeton
Plasma Physics Laboratory, USA
Tokamaks usually have an aspect-ratio, i? /a, of 3 to 4. The purpose of the
Small Tight Aspect Ratio Tokamak, START, was to explore the possible
advantages of a much smaller aspect-ratio. The device had i? = 0.2 m

11.19 START, MAST and NSTX
Fig. 11.19.1 Photograph of a plasma in
START The full width is about 1 m and
the plasma current is 100 kA Coils at the
top and bottom produce a magnetic
separatnx and the pairs of bnght nngs
show the intersection of the separatnx with
the coil cases
and a = 0.15 m with a resulting aspect-ratio, R/a, of 1.3. The scaling of
plasma current in a tokamak is / ~ {aB(j,/q)/{R/a) and it is seen that
any advantages of high current are more readily obtained with a small
aspect-ratio. However, such tokamaks have little space for the toroidal
field coil. An alternative view of the scaling is that for a given q and
plasma current a smaller toroidal field is required and this reduces the
space required for the toroidal field coil
Figure 11 19.1 shows a photograph of a plasma taken in visible
light. The plasmas have cofinement which is better than predicted by
the neo-Alcator scaling, and is comparable to that predicted by L-mode
scaling laws
The discharges were found to be free from termination by disruptions
although a large internal magnetic reconnection was frequently observed.
The plasmas could have an elongation of ~ 2 with active feedback control.
START achieved record beta values of around 40% before ceasing
operation in 1998. It was then followed by the scaled-up spherical
tokamaks, the National Spherical Torus Experiment, NSTX in 1999 and the
Mega-Amp Spherical Tokamak, MAST in 2000. These experiments are
comparable in plasma current and cross-section to conventional tokamaks
such as DIIID and ASDEX Upgrade. The key parameters of START,
MAST, and NSTX are compared in Table 11.19.1.
MAST and NSTX possess a number of complementary features, as
seen in Fig. 11.19.2. For example, the close fitting wall in NSTX helps to
stabilize mhd instabilities whereas MAST has a large plasma-wall
separation and internal poloidal field coils, giving operating flexibility. In
both devices the primary heating is provided by high power neutral beam

11.19 START, MAST and NSTX
Table 11.19.1 Companson of key parameters of START,
MAST, and NSTX
Major radius (m)
Aspect ratio
Elongation
Plasma current (MA)
Toroidal field (T)
Auxiliary heating
Pnbi (MW), Prf (MW)
Pulse length (s)
START
0.32
>1.2
<3
0.31
0.31
1,0.2
<0.06
MAST
0.85
>1.3
2.5
2
0.52
5,1.4
5
NSTX
0.85
>1.25
2.5
1.5
06
>5,6
5
NSTX
injection, but whereas in NSTX this is supplemented by high harmonic
ion-cyclotron heating, in MAST electron Bernstein wave heating is
installed.
Initial results from MAST and NSTX have confirmed and further
extended the results from START with normalized beta values which
approach theoretical limits being achieved. H-modes are readily obtained
and the energy confinement times are comparable with those predicted
on the basis of scaling derived from conventional tokamaks.
Furthermore, many features of conventional tokamak operation, for example.

11.20 TCV 589
transport barriers, edge localized modes, and neoclassical tearing modes,
are also observed in MAST and NSTX, allowing tests of physics models
under extreme conditions. As a result, these devices also provide insight
into plasma behaviour in conventional tokamaks and help to improve
predictions of plasma performance in future devices such as ITER.
TCV—Centre de Recherches en Physique des
Plasmas, Ecole Polytechnique Federale de
Lausanne, Switzerland
Fig. 11.20.1 Examples of plasma
configurations created on TCV,
demonstratmg the extreme shaping
capabihty of the device, including
elongations up to 2 8 (left)
Tokamak a Configuration Variable, which has a major radius 0.89 m and a
minor radius 0.25 m, began operation in 1992. The scientific programme
is devoted to the creation and control of shaped plasmas, particularly
of highly elongated plasmas, and to investigating their confinement and
mhd properties. The device has a nearly rectangular vacuum vessel with
a height-to-width ratio of 2.9, surrounded by 16 shaping coils. A wide
variety of shaped limited and divertor plasmas have been produced with
elongations up to 2.8. Examples of the shapes obtained are shown in
Fig. 11.20.1. Much of the range of shapes obtained cannot be
investigated in any other tokamak. Plasma heating, current drive, and profile
control are provided by X-mode electron-cyclotron heating and
current drive. This is produced by six gyrotrons operating at 82.7 GHz,
each delivering 0.5 MW of second harmonic X-mode RF power using
poloidally and toroidally steerable launching mirrors. For heating above
the second harmonic cut-off density a further set of three gyrotrons at
118 GHz for third harmonic heating is available, each delivering 0.5 MW
of power.

11.21 Tokamak parameters
Experience gained on TCV contributes to the optimization of the
tokamak as a reactor concept. One of the main attractions of
operating at high elongation stems from the possibility of raising the plasma
current, since /p oc A + ic^)/2, for a fixed value of the edge safety
factor. Normalized currents, Ip/aBj of up to 3.6Mam""^ T~^ have been
obtained at the highest elongations. High plasma current contributes to
an increased beta limit and improves confinement, as expected from
confinement scaling laws. A direct improvement of confinement with
elongation has also been found. Research on TCV has contributed to
establishing ECCD as a current drive method, by demonstrating for the
first time fully current driven, steady state discharges, with currents up to
210kA.
Tokamak parameters
Plasma*
(MA)
Additional heaUng (MW)
NBI ICRH
01
4.5 3
10 6
0 01 0 16
0 04
7
20 4 4
2tt
10
20
LHRH
01
2
06
10
01
0 15
20
ECRH
05
02
04
2
1-2
2
1
01
02
Device name
Alcator-C
Alcator C MOD
ASDEX
ASDEX Upgrade
ATC
Cleo
COMPASS
Doublet-m
DIHD
DITE
DIVA
FT
FT Upgrade
HT-6B
HT6M
HT7**»
Alcator A
Alcator C
Alcator C MOD
ASDEX
ASDEX upgrade
ATC
Cleo
COMPASS
Doublet-m
DIIID
DITE
DIVA
FT
FT Upgrade
HT-6B
HT-6M
HT7***
ISX-A
ISXB
JET
JFr-2
JIPP-T2
JT60
JT60U
LT-1
1973
1979
1993
1980
1991
1972
1972
1989
1980
1986
1975
1974
1975
1990
1983
1985
1993
1977
1978
1983
1972
1976
1985
1991
1968
0 54
0.64
0 67
154
165
0 88-0 35
0 90
0 56
145
167
1 17
0 60
0 83
0 93
0 45
0 65
1.22
0 92
0 93
30
0 90
091
30
34
04
0 10
0 17
0.22
0 40
0 50
0 17-0 11
0 18
021
0 45
0 67
0 26
0 10
0 20
0 30
0 12
02
03
0 26
0 27
125
0 25
0 17
0 95
11
0 10
10 0
12 0
90
30
39
2 0-5 0
20
21
26
21
27
20
10 0
80
0 75
15
30
18
18
35
18
30
45
42
10
0.31
0 90
0 64t(l 1)
0 52
1 Ot(l 4)
0 11-0 28
0 12
0 28t
061t
0 26
0.06
0 80
13
0.04
0 15
04
0 22
0 24t
3 0tG)
0 23
0 16
23
2 5tE)
0 04
20 2 5 7 5
JIPP-T2
JT60
JT60U

Continued
Device Year Major
name radius
(m)
Minor
(m)
Toroidal
field
(T)
Plasma*
(MA)
Divertor
Transformer
core type
Additional heating (MW) Device
NBl ICRH LHRH ECRH
Macrotor
MAST
Microtor
NSTX
Ormak
PDX
Petula
PLT
Pulsator
RTP**
ST
START
TEXT
TEXTOR
1977
2000
1976
1999
1971
1979
1974
1975
1973
1989
1970
1991
1981
1983
0.90
0.85
0.30
0 85
0 80
1.40
0 72
130
0 70
0 72
1.09
0 32
100
175
LT-4
Macrotor
MAST
Microtor
NSTX
Ormak
PDX
START
TEXT
TEXTOR
T-11
T-12
TCV
TFR-400
TFR-600
TFTR
TM-3
TNT-A
TO-1
Tore Supra
Tosca
Tuman II
Tumanin
Versator
1975
1972
1992
1973
1978
1982
1963
1976
1972
1988
1974
1971
1978
1978
07
0 36
0 89
0 98
0 98
24
04
04
06
2 37
03
04
0 55
04
Iron 0 7
Iron 15
Air 40 11
Iron 17 12 8
01
rrent achieved in brackets
ttlon-Bemstein waves
06
02
01
TFR-400
TFR-600
TFTR
TM3
TNT-A
TO-1
Tore Supri
Tuman II
Tuman III
Versator
*Value forg = 3 circular discharge A = i5a^B^/3R)) and higher ci
**Formerly Petula ***Formerly T7 fNon-circular cross-section
Bibliography
Most expenmental groups report their latest work at the
biennial international conferences organized by the IA E A
Conference proceedings are published by the IAEA,
Vienna under the title Plasma physics and controlled
nuclear fusion research The venues and dates of these
conferences are as follows
1st Salzburg 1961 5th Tokyo 1974
2nd Culham 1965 6th Berchtesgaden 1976
3rd Novosibirsk 1968 7th Innsbruck 1978
4th Madison 1971 8th Brussels 1980

32 Bibliography
9th Baltimore 1982
11th Kyoto 1986
12th Nice 1988
13th Washington 1990
14th Wurzburg 1992
15th Seville 1994
10th London 1984
16th Montreal 1996
17th Yokohama 1998
18th Sorrento 2000
19th Lyon 2002
The European Physical Society also has regular
meetings with international representation The proceedings
are usually published by the host orgamzation under the
title Controlled fusion and plasma physics These were
held as follows
1st Munich 1966 11th Aachen 1983
2nd Stockhohn 1967 12th Budapest 1985
3rd Utrecht
4th Rome
5th Grenoble
6th Moscow
7th Lausanne
8th Prague
9th Oxford
10th Moscow
1969 13th Schliersee 1986
1970 14th Madnd 1987
1972 15th Dubrovnick 1988
1973 16th Venice 1989
1975 17th Amsterdam 1990
1977 18th Berlin 1991
1979 19th Innsbruck 1992
1981 20th Lisbon 1993
21st Montpellier 1994 26th Maastncht 1999
22nd Bournemouth 1995 27th Budapest 2000
23rd Kiev 1996 28th Madeira 2001
24th Berchtesgaden 1997 29th Montreux 2002
25th Prague 1998 30th St Petersburg 2003
Since 1989 invited papers from the annual meeting of the
Plasma Physics Division of the Amencan Physical
Society have been collected and puMished in a special issue of
the journals Physics of Fluids B A989-1992) andPhysics
of Plasmas A993-1995) The relevant conferences are as
follows,
31st Anaheim
32nd Cincinnati
33rd Tampa
34th Seattle
35th St Louis
36th Minneapolis
37th Louisville
38th Denver
989 39th Pittsburgh 1997
990 40th New Orleans 1998
991 41st Seattle 1999
992 42nd Quebec 2000
993 43rd Long Beach 2001
994 44th Orlando 2002
995 45th Albuquerque 2003
996

Large Tokamaks

12.1 Large Tokamaks
12.1 Large Tokamaks
The generation of large tokamaks which came into operation in the 1980s
and 1990s has achieved substantial improvements in almost all aspects of
performance. This group of devices, consisting of the Tokamak Fusion
Test Reactor at Pnnceton, the Joint European Torus at CuUiam, JT-60
in Naka, DIII-D in San Diego, and ASDEX Upgrade in Garching, has
been supported by wide-ranging studies at the small and moderate sized
tokamaks discussed in Chapter 11 The extensive co-operation between
laboratones in many countnes which has been a feature of this penod
reflects the enlarged international dimension which fusion research has
acquired. Comparative studies of plasma behaviour and performance,
involving both the large devices and many of the smaller tokamaks, have
made a fundamental contnbution to the development of the physics basis
for the design of the International Thermonuclear Expenmental Reactor
discussed in Chapter 13 Considerable progress has been made, including
the achievement of values of the fusion tnple product within an order of
magnitude of that required for ignition, and the production of more than
10 MW of fusion power in expenments utilizing a deutenum-tntium fuel
mixture.
As tokamak plasmas approach the regime in which significant levels
of thermonuclear power can be produced, the fusion power quotient, Qdd
or 2dt, is a useful measure of fusion performance For deutenum
plasmas, 2dd can be simply defined as the ratio of the fusion power to the
applied heating power. It is often converted to an equivalent Qdt, based
on calculations of the predicted fusion reactivity in a 50'50 mixture of
deuterium and tntium under the same plasma conditions, as descnbed
in Section 13.1 Two cntical values are then identified, Qdj = 1,
corresponding to effective breakeven, and 2dt -> oo, corresponding to
Ignition
The improvement in fusion performance in the large expenmental
devices is due mainly to their increased size and power capability Major
and minor radii have doubled relative to the previous generation of
devices, leading to an order of magnitude increase in plasma volume
and a commensurate improvement in energy confinement Plasma
current and heating power have nsen similarly, with JET attaining 7 MA in
limiter operation and the three largest tokamaks, JET, JT-60 Upgrade, and
TFTR, ultimately acquinng an installed heating capacity of ~50 MW. An
important aspect of the high current capability of JET and TFTR, both of
which were designed for D-T expenments, is that a large fraction of the
a-particles produced by fusion reactions should be confined, permitting
studies of a-particle behaviour in thermonuclear plasmas
A steady improvement in wall conditioning techniques has also made
a major contnbution to improved performance The vacuum vessel walls

12.1 Large Tokamaks 595
have been coated with thin, usually <100nm, films of carbon, boron,
beryllium, lithium, or silicon. These coatings, to varying degrees,
prevent sputtenng of high-Z metals, reduce hydrogen recycling, and getter
oxygen. Maintaining low levels of hydrogen recycling has proved to be
an essential ingredient for obtaining plasmas with the highest fusion
performance, although there is no satisfactory explanation of why this
should be so. More generally, the appreciation that the control of particle
fluxes, including those of impurities, is a key step on the route to the
construction of a reactor has stimulated extensive studies on this issue.
The divertor has emerged as the most favoured solution to this problem
and the programmes of the large tokamaks have focused increasingly on
experimental investigations of this approach. This is illustrated by the fact
that only two of the five devices discussed here were originally conceived
as divertor tokamaks, but ultimately four operated almost exclusively as
divertor expenments.
The ability to perform detailed quantitative comparisons between
expenmental measurements and the predictions of theory has been a
notable feature of recent tokamak research, as more sophisticated
diagnostic techniques have been applied. Increases in plasma parameters and
size, technological advances, and an enormous expansion in computing
power have all been exploited to improve plasma measurements.
Diagnostics of neutrons and energetic particles have probably benefited most
from the advance towards the thermonuclear regime, and the study of
these facets of plasma behaviour has been an important aspect of the large
experiments, studies of energetic particle confinement, their interactions
with the thermal plasma and their influence on mhd stability have been
conducted using energetic ions produced by auxiliary heating systems
and a-particles produced in D-T experiments Advances in diagnostics
for analysis of the current profile and of internal electric fields have also
had a profound impact on the understanding of plasma behaviour.
Improvements in fusion relevant technology, such as heating and
current dnve systems, fuelling and pumping systems, power handling
surfaces and control techniques, have also made substantial contributions
to progress on the large devices. Many subsystems of the large tokamaks
have developed from their experimental origins to the stage where their
operation can be regarded as routine, if not yet at the level of
reliability required for reactor applications This is illustrated by the auxiliary
heating and current dnve systems. For example, neutral beam systems
based on positive ion source and accelerator technology have operated
at injected power levels of 40 MW, while negative ion based systems,
which are expected to provide the technology required for reactors, have
operated at power levels of several megawatts. Ion cyclotron resonance
heating of over 20 MW has been coupled into tokamak plasmas, and the
associated impurity generation problems have been overcome. In
addition, electron cyclotron resonance heating systems capable of producing
megawatts of heating power are available. Finally, current dnve using
lower hybnd waves has reached the 3 MA level

12.1 Large Tokamaks
Due to these developments, there has been a substantial expansion in
the accessible operating space. Although tokamaks with a material limiter
are still, in the main, restricted to operation in the L-mode confinement
regime, the discovery in TFTR of the 'supershot' regime of enhanced
confinement has opened an important new area of fusion research. Quasi-
steady-state regimes with energy confinement quality greater than that
predicted by L-mode scalings, such as the radiation improved mode
discovered in TEXTOR, have also extended the operational space of limiter
devices. The H-mode regime is readily attainable in plasmas with an
internal magnetic separatrix, provided that the vessel conditioning and input
power level are adequate. Moreover, the level of confinement
enhancement has progressed to the point where plasma regimes have been found
in which confinement can increase by up to a factor of 4 relative to that
in the L-mode. H-modes have also been achieved in magnetic
configurations limited by the vessel wall on the high field side and in ohmically
heated plasmas. Combinations of regimes in which, for example, the
highly peaked profiles typical of supershots are added to the edge transport
barrier of the H-mode have been exploited to improve fusion performance.
As a result of the intense efforts expended to develop plasmas with
confinement enhanced beyond the L-mode level, as defined either by
the Goldston or ITER89-P scalings, a wide range of plasma regimes is
recognized and studied. In this chapter, the distinction between L-mode
and H-mode will refer to the conditions at the plasma edge, rather than
to the level of confinement enhancement. The term 'H-mode' will be
applied to plasmas which exhibit certain edge characteristics. These often
include the formation of steep gradients in edge density and temperature,
which have been linked in many experiments to a change in the radial
electric field gradient at the edge, but the simplest, and virtually universal,
indication is a fall in the Hq, emission from hydrogenic recycling.
Confinement studies have concentrated increasingly on the
optimization of plasma profiles, particularly the current profile, with the aim of
obtaining enhanced confinement while at the same time improving plasma
mhd stability properties. Energy confinement has been enhanced both by
increasing the internal inductance, l^, at fixed current and by establishing
current profiles with negative shear in the plasma centre. Although such
improvements are transient in the absence of active current profile control
techniques, these results suggest an alternative concept for a reactor in
which operation at relatively low current is compensated by exploiting
current profile control to optimize energy confinement, mhd stability, and
hence fusion performance. The advantages of such an approach, often
referred to as the 'advanced tokamak scenario', include lower
disruption forces at reduced current and a lower current dnve requirement for
steady-state operation. This latter follows both from the absolute level
of current and the increased fraction taken up by the bootstrap current.
Many challenges remain, however, among them the need to demonstrate
the requisite steady-state control of the current profile and to show that
particle transport and divertor requirements are compatible with such
regimes.

12.2 TFTR—Princeton Plasma Physics Laboratory, USA
Fig. 12.2.1 Layout of the TFTR
expenment
Plasmas were initially obtained in the Tokamak Fusion Test Reactor late
in 1982, making it the first of the large tokamaks to come into operation,
and the expenmental programme was completed in Apnl 1997, following
a highly successful series of experiments in D-T plasmas. This device, of
circular poloidal cross-section (Fig. 12.2.1), with R/a = 2.4/0.8, used
carbon limiters on both the low and high field side of the plasma and was
capable of high magnetic field, 6 T, and plasma current, 3 MA. It had a
substantial additional heating capability, with NBI power of up to 40 MW
at injection energies of up to 120keV, and an installed ICRF generator
power of 16MW. The principal aim of the experiment was the
investigation of plasma heating and confinement, including a-particle effects,
in regimes close to breakeven conditions. Much of the experimental
programme concentrated on studying plasma behaviour and optimizing
fusion performance in deuterium plasmas, but experiments with 50:50
mixtures of deuterium and tritium began in 1993.
Vacuum vessel heating
and cooling system
Poloidal field/torojdal field bus
Innci ".upporl >.triiLtui(.
To'.u'-viit.uiini
piimpmc station
r r ^
roro.Jal tield uiils
Ohmic heating coils
Vacuum vessel
Ncutr..!
beamline
Equilibrium field coils

Many experiments have demonstrated that plasma confinement and,
ultimately, fusion performance depend sensitively on the level of
recycling of hydrogen isotopes. Therefore, although the usual techniques of
vessel baking, glow discharge cleaning, pulse discharge cleaning, and
disruptive discharge cleaning were used in preparation of the vacuum vessel
for plasma operation, the TFTR group emphasized the conditioning, or
degassing, of the torus walls as a means of attaining plasma regimes with
the highest performance. Experiments showed that conditioning of the
vessel wall on the inner, high magnetic field, side of the plasma was
particularly important. This was achieved by means of extensive series of
low density discharges, often in helium, which reduced the recycling
factor from its usual value close to unity, to ~0.5. The limiter degassing was
believed to be due to bombardment of the limiter by energetic helium and
carbon ions. Boronization and the injection of lithium pellets were also
applied to improve conditioning. Lithium pellet conditioning involved the
injection, both before and after the NBI heating phase, of several pellets,
each containing sufficient atoms, ~4 x 10^°, to cover the limiter
surface with a monolayer of lithium. This evolved into a major conditioning
technique as it reduced the carbon and deuterium influxes, led to lower
edge densities, and was associated with increased energy confinement in
supershots.
Ohmic plasmas
Initial operation in ohmic plasmas showed that the plasma impurity
content increased as the ratio of the average current density to the average
electron density, j/ii.At electron densities below 5 x 10^^ m~^, the global
energy confinement time increased as nqaR^a, reaching a maximum
value of 0.44 s in gas-fuelled plasmas. As found in many gas-fuelling
experiments, the confinement time saturated at higher densities, though in
pellet-fuelled discharges an energy confinement time of 0.5 s was attained
at densities above 10^° m~^. Adiabatic compression, achieved by driving
the plasma ring towards the high magnetic field side of the torus through
a rapid, ~20ms, increase in the vertical field, was successfully
demonstrated in ohmic plasmas. Both the plasma density and ion temperature
increased in accordance with theoretical expectations, but the electron
temperature rise was lower than expected, indicating an enhancement of
electron transport during the compression.
The improved confinement in ohmic plasmas associated with the
increase in plasma dimensions has produced ohmic temperatures of
several keV in the largest tokamaks. In this parameter range the electrons
and ions are in the banana regime over a large fraction of the plasma
cross-section. Trapped particle effects are expected to manifest
themselves, therefore, for example in the resistivity, which should increase
above the classical Spitzer formulation. This was confirmed for TFTR
ohmic plasmas, where the resistivity agreed closely with the neoclassical
formulation. More precisely, the ratio of the single turn voltage at the

12.2 TFTR 599
plasma surface calculated using neoclassical resistivity to that measured
was 1.01 ± 0.06, while the ratio obtained using the classical form was
lower by a factor of ~2. In addition, the evolution of the ^ = 1
surface, derived from measurements of the sawtooth inversion radius, was
in agreement with that deduced from the neoclassical resistivity in many
cases where calculations based on classical resistivity predicted that q
should be everywhere above unity.
High power heating experiments
Neutral beam injection is the main form of additional heating in large
tokamaks, and the majority of the experiments in TFTR were dedicated
to understanding plasma behaviour in the presence of intense beam
heating. When the plasma was limited on the outer limiter, or when the
inner wall limiter exhibited high recycling, plasmas were invariably in
the L-mode. A systematic study of the variation of global energy
confinement with plasma size and aspect ratio revealed the surprising result that
the energy confinement was almost independent of minor radius, varying
as a", with —0.22 < a < 0.06. This weak dependence contrasted with
the a^ scaling expected for diffusive heat transport. Moreover, analysis
of local transport in these plasmas showed that the single fluid thermal
diffusivity was better described as a function of r/R than as a function
of r/a, suggesting that toroidicity played a significant role in local heat
transport.
The attainment of high fusion yields was pursued predominantly in
the supershot regime, which was formed by high power neutral beam
injection into a low density, n < 1.5 x 10^^ m~^, target plasma limited
on the inner wall. As noted previously, careful conditioning of the carbon
inner wall was a prerequisite for this regime, since control of both
carbon and deuterium recycling was crucial. Further reductions in recycling
were obtained in experiments in which the inner wall was conditioned by
injection of lithium pellets before neutral beam injection. These yielded
a 5-10% improvement in fusion reaction rate and achieved the highest
D-D reaction rates in TFTR, 10^^ s~^ with 33 MW of injected power. For
many years, a broadening of the plasma profiles at higher plasma currents,
possibly due to sawtooth activity and the increase of the ohmic target
density with current, restricted the supershot regime to currents below 2 MA.
However, the improved wall conditioning following lithium pellet
injection allowed supershots to be established at currents close to 3 MA. A
requirement for near-balanced NBI, in which the power injected parallel
to the plasma current approximately balanced that injected anti-parallel
to the current, was an additional constraint on the accessibility of the
regime. The advantage of balanced injection arose in part from classical
effects, in that the large rotation velocity driven by unbalanced
injection degraded the NBI heating efficiency due to the reduction of relative
velocities between plasma particles and injected particles.

Fig. 12.2.2 Measured profiles of
(a) electron density, (b) ion temperature,
and (c) electron temperature for a
supershot (solid curve, open points) and a
helium target plasma with L-mode
confinement (dashed curve, solid points)
Both discharges have
/p = 1 4MA, l\iBi = 22MW, and
B = 4 8 T [Zamstorff, M C. et al Plasma
Physics and Controlled Nuclear Fusion
Research 1988 (Proc 12th Int. Conf., Nice,
1988) Vol 1, 183 I.A.E A , Vienna A989)]
Strong central beam fuelling and improved confinement in supershot
plasmas produced high central electron densities, n@) up to 10^° m~^,
and very peaked density profiles (Fig. 12.2.2), with n@)/(n) generally
in the range 2-3. The peaking correlated well with the improvement in
confinement (Fig. 12.2.3), and the confinement enhancement relative to
L-mode scaling reached factors of ~3 at density profile peaking factors
of ~3. Global energy confinement did not degrade with heating power
and exhibited little variation with plasma current, in contrast to L-mode
behaviour. The ion temperature profile was also very peaked and central
values reached 35 ke V, while the electron temperature profile was broader,
with peak values of only 12keV. Saturation of the electron temperature
at values well below those of the ion temperature was explained by the
fact that both direct NBI heating of the electrons and equipartition power
transfer from the ions fall as the electron temperature rises. Such hot ion
modes, with Z > Te, have been widely exploited in modem tokamak
research to maximize fusion performance. Enhanced energy confinement
and centrally peaked profiles are optimal for high fusion yield, and the
fusion triple product in deuterium supershots was up to a factor of 20
greater than in equivalent L-mode plasmas. Values of the triple product
up to ni@)ri@)rE ~ 3 x 10^°keVsm~^ were obtained, corresponding
to Qm ~ 0.3.
The principal reduction in local transport in supershots relative to
L-mode plasmas occurred m the ion channel, as might be expected
from the very substantial differences m ion temperature between the two
regimes. So fundamental was the change in ion thermal diffusivity that,
m the core of supershots, the diffusivity fell with mcreasmg ion
temperature, in contrast to L-mode plasmas, in which a systematic increase in
diffusivity with the local value of Tj was usual (Fig. 12.2.4). Electron
thermal diffusivity was also reduced, but only by a factor of ~2. A notable
aspect of the supershot regime is that a transition to a limiter H-mode was
sometimes observed. In deuterium plasmas, these H-modes were always
Fig. 12.2.3 Enhancement of energy
confinement time, te, over the prediction
of Goldston L-mode scaling, r^, as a
function of density profile peaking,
n{0)/(n), for a vanety of supershots with
R=2 45m,a=0Sm,B =
4.8-5.1 T, and /p = 0 8-1 8 MA
[Meade, D.M etal Plasma Physics and
Controlled Nuclear Fusion Research 1990
(Proc 13th Int Conf, Washington, 1990)
Vol 1,9 IAEA, Vienna A991)]

Fig. 12.2.4 Companson of the total ion
thermal diffusivity, Xy^ir = a/3), which
includes ion conduction and convection,
versus ion temperature, r,(r = a/3), for
L-mode plasmas and supershots
pvieade, D.M etal Plasma Physics and
Controlled Nuclear Fusion Research 1990
(Proc 13th Int Conf., Washington, 1990)
Vol 1, 9 I A E.A , Vienna A991)]
ELMy and so maintained quasi-steady-state conditions for periods of
~1.5s. Energy confinement changed little from that of the supershot,
with a confinement enhancement of ~2.5 relative to the L-mode level.
Enhanced confinement regimes are often transient and, at the highest
powers, supershot performance declmed after 1-2 s of heating. In some
cases the degradation was linked to a decay of the density profile. In
others the growth of mhd activity, usually due to pressure dnven modes,
was responsible. Another type of performance degradation was caused
by localized overheating of the power-handling surfaces which generated
a catastrophic influx of impunties, the carbon bloom, so-called because
the light emitted from the overheated region caused a 'bloom' on the
infrared camera image of the plasma-wall interaction region. Although
the sublimation temperature for graphite is 2700 °C, the bloom was often
observed at limiter surface temperatures in the range 1700-2400 °C. The
phenomenon of radiation enhanced sublimation, in which sputtered ions
return to the surface and cause further sputtering, leading to runaway
impurity production, has been advanced in explanation of this.
The carbon bloom was first reported as a limiting mechanism in TFTR
supershots and changes were made to the inner wall limiter to improve
its power-handling capability. Deviations from toroidal symmetry of the
graphite tiles which formed the limiting surface caused high spots which
preferentially intercepted the power flux in the scrape-off layer. The
power-handling of the limiter was then constrained by localized
heating of these spots, rather than by the toroidally averaged power flux in
the SOL. To increase the power-handling capability of the inner wall, the
tile alignment was improved, so that deviations from toroidal symmetry
were only ±0.5 mm. In addition, graphite tiles were replaced by carbon
fibre composite tiles, which have a higher thermal conductivity and
better thermal shock resistance. These measures virtually eliminated carbon
blooms, even at power levels of 35 MW for 1 s.
Following these changes, supershots were more commonly limited
by the growth of mhd activity which caused a gradual deterioration in

fusion performance. The mhd modes had low poloidal and toroidal mode
numbers, m/n, and were identified as non-linear neoclassical pressure-
gradient-driven tearing modes. Usually a hierarchy of mhd activity was
observed. Modes with m = 3/n = 2 had the most severe effect, degrading
neutron yield by up to 30% and stored plasma energy by up to 15%, while
m = 4/n = 3,m = 5/n = 4 modes, andm = 1/n = 1 fishbone
instabilities had less impact on plasma performance. This activity occurred in the
vicinity of a boundary formed by the conditions y^N = 10^y6/(//a5) <
2.4 and eySp < 0.7 (Fig. 12.2.5). In a small percentage of pulses, ~10%,
neutron emission decayed only after the NBI heating, which lasted ~1 s,
was switched off, and a small fraction of discharges was terminated by
major disruptions with rapidly growing precursors lasting ~5 ms.
A significant feature of supershot plasmas was that while /3n was
limited to 2.4, the peaked pressure profiles imply a substantially better
fusion performance. In plasma regimes of interest in reactors, the fusion
reactivity varies approximately as (niTi)^, and the relevant figure of merit
i^^l = 10«y67(//a5), where y6* = (p2)i/2/E2/2/^p)and(p2)
represents the volume average of the square of the plasma pressure. Values of
yg^ = 3.9 were attained in supershots.
The normal supershot stability boundary was exceeded in a regime
which was characterized as 'high-ySp' (Fig. 12.2.5), and was achieved by
ramping the plasma current down rapidly, by as much as 50%, prior to
NBI heating. This produced an increase in the plasma internal inductance.
Fig. 12.2.5 Operational diagram for two
high performance regimes in TFTR,
supershots and high-/3p plasmas,
illustrating the accessible range of s/3p as a
function of g*, the cylindrical safety factor
[Mauel, ME etal Plasma Physics and
Controlled Nuclear Fusion Research 1992
(Proc 14th Int Conf, Wurzburg, 1992)
Vol 1, 205 IAEA, Vienna A993)].
D Gdd > 0-5 X 10"
El Gdi) > 1.0 X 10'
■ Gdd > 1-25 x 10"
0^

12.2 TFTR
603
which was accompanied by a considerable enhancement of energy
confinement, the confinement time rising to ~3.7r™^^^'^. The plasma
stability also improved transiently, allowing y^N to rise to ~3.6 and e^p
to reach ~1.5. However, as ii decayed, stability was eventually lost,
via either a disruption or a collapse in y6 associated with intense mhd
activity.
Further improvements in plasma confinement were observed in
plasmas in which the central shear, s ^ {r/q){dq/dr), was reversed. In these
plasmas, established by injecting neutral beams during the current ramp-
up, a transition to a regime of enhanced plasma confinement and improved
mhd stability was observed at high input power, Pnbi ~ 20 MW. During
the reversed shear phase, the ^-profile typically had q {a) ~ 6, ^mm ~ 2,
and q @) ~ 3-4, and the pressure profile often became significantly more
peaked than in supershots, p{0)/{p) reaching 8, compared with values
of ~5 for supershots. Both thermal and particle transport were reduced
throughout the reversed shear region (Fig. 12.2.6), the electron particle
diffusivity falling by a factor of ~ 40 to the level predicted by neoclassical
theory, and the ion thermal diffusivity falling by approximately 2 orders of
magnitude to values well below the conventional neoclassical prediction
which was thought to be the minimum achievable level of transport. More
recent calculations of neoclassical transport include the effect of ion orbit
dimensions which are comparable with the pressure scale lengths and
appear to have resolved this discrepancy, as illustrated in Fig. 12.2.6. This
'enhanced reversed shear' regime was sustained transiently and many of
the best discharges, which reached y^N ~ 1.7 and y6^ ~ 3.5, suffered a
major disruption due to an n = 1 mode.
Similar results were obtained simultaneously in DIII-D experiments,
and these observations confirmed analysis of PEP H-modes in JET which
Fig. 12.2.6 Radial profile of the ion
thermal diffusivity, /,, in a reversed shear
discharge before and after the transition to
the enhanced reversed shear regime The
conventional neoclassical prediction for /,
IS also shown, together with a more recent
refinement of the neoclassical prediction
which includes orbit dimensions
comparable with the pressure scale length
'R S region' refers to the region in which
the magnetic shear is reversed [from
Levinton, F M etal Physical Review
Letters 75, 4417 A995) and Lin, Z et al
Physical Review Letters 78, 456 A997)]
Minor Radius (r/a)

indicated that reduced transport in the plasma core was associated with a
central region of reversed shear. Together, these results laid the basis for
extensive experimental and theoretical investigations of 'internal
transport barriers' in both tokamak and stellarator plasmas. Such studies have
provided much insight into local transport processes in toroidal
plasmas and have identified a potential route to steady-state operation of a
tokamak reactor. Several mechanisms can contribute to the reduction of
transport in the plasma core in such plasmas: central shear reversal can
stabilize certain small-scale instabilities contributing to transport, and the
large Shafranov shift of the central magnetic flux surfaces due to the high
central pressure can also contribute, but suppression of turbulence by
sheared plasma flows arising from a gradient in the radial electric field
in the region of the internal transport barrier has been suggested as the
dominant process. The importance of this effect was illustrated by
experiments in which varying proportions of co- and counter-NBI were used to
influence the duration of the enhanced confinement phase, emphasizing
the role of externally applied torque in modifying the plasma toroidal
velocity and hence the radial electric field. The essential physics
associated with this mechanism for turbulence suppression is discussed in
Section 12.5 in relation to the H-mode transition.
At the pressures which obtain in plasmas with high fusion
performance, pressure gradients play a significant role in determining the plasma
behaviour. The most obvious effect is the observation in many toka-
maks of a global limit to y6. In addition, a substantial bootstrap current
is expected. Experimental evidence for the bootstrap mechanism was
unconvincing until the advent of the current generation of large toka-
maks with improved diagnostics. Although NBI produced a significant
fraction of the total current in TFTR, even in cases of balanced
injection, the behaviour of the surface loop voltage in high power discharges
Fig. 12.2.7 The time vi
surface loop voltage, V"sur, determined
expenmentally from magnetic
measurements, shown by the soLd line,
and calculated under vanous assumptions
(a) ohnuc current only, (b) ^fBI-d^ven and
ohmic currents, and (c) bootstrap,
^fBI-d^ven, and ohimc currents
[Zamstorff, M C etal Physical Review
Letters 60, 1306A988)]
0.5
j i|-<—Expenment
1 a
|\ _/\.---
- I--
c
!//
i /
?! /
'J/
%

could only be explained by invoking the bootstrap current (Fig. 12.2.7).
Moreover, the broadening of the current profile produced by the
bootstrap current, which, like the trapped particle population, is maximal at
some distance from the plasma centre, provided a ready explanation of
the transient negative phase of the loop voltage. In the supershot regime
up to 70% of the plasma current was driven by the bootstrap mechanism.
Mhd studies
Considerable advances in the diagnostic capabilities of the large tokamaks
stimulated much more detailed quantitative and qualitative analyses of
plasma behaviour than had hitherto been possible. In the mhd area,
studies of sawtooth oscillations and disruptions were revolutionized by the
availability of multichannel electron cyclotron emission (ECE) and soft
X-ray detectors coupled to sophisticated computer-based reconstruction
techniques. For example, in TFTR, reconstructions of sawtooth collapses
using multichannel radially resolved ECE data yielded images which
are consistent with the Kadomtsev full reconnection model.
Nevertheless, analysis of the ^-profile using the motional Stark effect confirmed
observations made on other tokamaks that the central value of q remains
well below unity throughout the sawtooth cycle. Motional Stark effect
measurements of the ^-profile were incorporated into a stability analysis
of sawtoothing and sawtooth-free plasmas in TFTR. This study found
good agreement between the occurrence of sawteeth and a stability
criterion, based on {rdq/dr)q^\, predicted by a two-fluid colHsionless
m = \ reconnection model of the sawtooth instability which includes
stabilization of the m = \ mode due to diamagnetic effects.
Similar techniques were applied to the study of the pre-disruptive
plasma. The causes of disruptions in TFTR were broadly similar to those
in other large tokamaks, as outlined in Section 7.8, though the role of
ideal instabilities was perhaps of greater operational importance due to
the emphasis on experiments at high-y6p. In major disruptions at high
density or low q{a), an m = 1 deformation of the plasma core
developed in the last millisecond before the current quench which, in ECE
reconstructions of the electron temperature profile, appeared consistent
with the penetration of a cold plasma bubble into the core (Fig. 12.2.8).
However, the relationship between this rapidly growing m = 1 mode,
with y ~ 5 X 10^ s"^ and the more slowly growing m = 2/n = 1
mode identified in most other tokamaks as the precursor to the majority
of disruptions remained unresolved.
Disruptions at high-y6 were initiated by a toroidally and poloidally
localized ballooning mode, with n ~ 10-15, whichappearedtobedestab-
ilized through local modifications of the magnetic shear and pressure
gradient by an internal n = 1 kink (Fig. 12.2.9). The growth of this mode
generated a rapid, ~ 100 /iS, collapse of the central electron temperature,
and the current quench followed within a few tens of milliseconds. Further
evidence of pressure profile effects was provided by the observation of

Fig. 12.2.8 (i) Vertical profiles of chord
integrated soft X-ray emissivity showing
the downward penetration, at this toroidal
location, of an m = 1 deformation of the
plasma core (u) Profiles of electron
temperature, denved from ECE
measurements in the honzontal midplane,
showing the m = 1 deformation appearing
as a 'cold bubble' Profiles are taken at
50/is intervals dunng the last 500/is
before the thermal quench
[Frednckson, ED et al Nuclear Fusion
33, 141 A993)]
Tangency radius (m)
z.u
1.5
>
^ 1.0
E-."
0.5
: A1)
_
—
-
—
^
^ Limiter
T:^--\d
/ X '\e 7N
/' ^f '■• / ~'V
\ ^ '' /V
\g ^ •, ;' ' \V
\ ^ '. / / 4
\ \ - / , /f
^\^\^^'^y^^f:jA
I , , , , ^ , , ,
' ' d
-^
-
~
_
k\ 1
V w
V. '^ ~
\,'\\\ ~
1^^^
Major radius (m)
medium-n ballooning modes, with 4 < n < 10, in high-y6p plasmas. For
example, in discharges with ygp > 2 a toroidally and poloidally localized
mode, which has been modelled as a fragment of an m = 7/n = 6 helical
structure, was associated with a collapse in central electron temperature
As in the high-y6 disruptions, the unusually high toroidal mode numbers,
the strong outwardly asymmetric amplitude distribution, and the short
growth time of the mode, ~20 /iS, provided evidence for the ballooning
character of this activity.
Coherent mhd activity potentially represents one of the major
anomalous loss mechanisms for energetic fusion products. Two principal types
of activity have emerged as possible causes for concern: low m/n mhd
activity including sawtooth oscillations, fishbone instabilities and
disruptions; and high frequency Alfven eigenmodes. D-D reactions produce
tritons and protons with MeV energies, and these particles have orbits
and spatial profiles, and experience drag forces, similar to those of
3.5 MeV a-particles. Their behaviour is expected, therefore, to provide

Fig. 12.2.9 Contours of electron
temperature in the 180/is preceding a
disruption at high-/3, showing n = 1 kink
and ballooning mode precursor oscillations
[from McGuire, K M etal Physics of
Plasmas 2, 2116A995)]
Ballooning mode
bursts -__
kv^-Kv^^V^
information on the confinement of a-particles in D-T plasmas.
Measurements of triton bumup, in which the triton reacts with a background
deuterium ion producing a 14.1 MeV neutron, is an especially important
diagnostic technique. In TFTR it was found that the observed 14.1 MeV
neutron production was about a factor of two below that expected, even
allowing for fuel dilution by impurities and for the long slowing-down
time of the tntons. This discrepancy, which was greater in plasmas with
longer triton slowing-down times, could be explained by a diffusion rate
for fast particles of ~0.1 m^ s^ ^ although this appeared to be inconsistent
with other expenmental evidence on fast particle confinement.
The possibility that prompt tnton losses were anomalously high, or that
triton diffusion was anomalously fast, was excluded by direct
measurements of losses of energetic tritons from the plasma edge. These showed
that, in the absence of large amplitude coherent mhd activity, prompt
losses were consistent with those expected from first orbit losses.
Furthermore, the emission rates of 2.4 MeV neutrons and charge exchange
neutrals during the decay phase of a short NBI pulse confirmed that the
background diffusivity of energetic particles was less than 0.1 m^ s~^

Sawtooth crash
1.4 MA, 12MWNBI
re@)
(keV)
Escaping
Triton
Flux
(rel.)
K^x/vv\;\/i
Ufr1uWvfV,V'
p%^w^K.J y^^^^yJW[•^^.^^«A~^^vw'A|^Alv>|/
mWMl^\M
Low-OT Mode
1.4MA,23MWNBI
fig. 12.2.10 Expenmental evidence of
1 MeV triton losses correlated with mhd
activity (a) a sawtooth collapse, (b) an
mhd mode with m = 2/n = 1 [from
Strachan, J D etal Plasma Physics and
Controlled Nuclear Fusion Research 1988
(Proc 12th Int. Conf., Nice, 1988) Vol 1,
257 IAEA, Vienna A989)]
In contrast, cases with mhd activity did exhibit clear evidence of enhanced
fast particle losses (Fig. 12.2.10). In such plasmas the prompt loss rate
was ~5-10 times the expected first orbit loss rate, and was of a level
which might give rise for concern in a reactor.
Toroidal Alfven eigenmodes (TAE modes), which were described in
Section 7.15, have been identified as a potential cause of anomalous
a-particle losses which would reduce the efficiency of a-particle heating
and threaten damage to the first wall of a reactor. Densities of
energetic particles with velocities high enough to satisfy the TAE resonance
condition are usually too low for mode excitation at normal tokamak
operating parameters. However, the resonance condition can be satisfied
for the energetic ions produced by NBI if the toroidal magnetic field is
reduced to ~1 T. Under such conditions, bursts of magnetic fluctuations
with frequencies in the region of 100 kHz were observed in experiments
with up to 14 MW of balanced NBI using 100 keV injection energy. The
bursts had dominant toroidal mode numbers n = 2 and n = 3, and the
mode frequency varied with toroidal field and plasma density in the
manner expected for TAE modes, co ~ V\/2qRQ. Their detrimental impact
on the fast particle population was illustrated by global neutron
measurements which showed a decrease of ~7% associated with the growth
of the fluctuation on the magnetic signals. Expenmental evidence was
also obtained that the energetic trapped protons created by ICRF
heating could excite TAE modes, leading to losses of up to 10% of the fast
protons.
Transport and confinement
Extensive experiments were carried out to elucidate the processes
involved in determining transport in both supershot and L-mode regimes.

These investigations involved analysis of steady-state transport
parameters and the use of perturbation techniques. One of the most striking results
came from a series of L-mode discharges in which the plasma current was
ramped to study how energy confinement is influenced by the current and
the current profile. At a given power, the linear relationship between the
L-mode energy confinement time and the plasma current is consistently
reproducible in tokamaks. It might be expected, therefore, that the plasma
energy would respond immediately to a change in the current. However,
when the plasma current was ramped up or down, the change in stored
energy was significantly delayed relative to the time of the current ramp.
The plasma energy changed on a timescale closer to that characteristic of
resistive diffusion, rather than the, considerably shorter, energy
confinement time. While a good correlation was found between the enhancement
of the energy confinement and the plasma inductance, producing a
scaling of the form tE/rf^^ ~ 0-4 + ^i/2 (Fig. 12.2.11), a quantitative
analysis of the time evolution of energy confinement in these experiments
suggested that ii was not the fundamental parameter describing the
influence of the current profile. Nevertheless, this correlation between more
peaked current profiles and improved confinement has been reproduced
in other tokamaks.
As discussed in Section 4.14, two general forms of the anomalous
thermal diffusivity have been explicitly identified, denoted as gyro-Bohm and
Bohm. The crucial experimental test to distinguish between the two relies
on how the diffusivity, or more precisely the thermal power flow through
a magnetic surface, varies with the normalized Larmor radius, p* = pja.
With care, a sequence of discharges can be established in which only p*
varies, primarily through the variation of the toroidal field, while other
relevant dimensionless parameters are maintained nearly constant. The
results of such an experiment clearly supported the conclusion that local
transport in the L-mode regime is governed by Bohm, as opposed to
gyro-Bohm, transport (Fig. 12.2.12).
Fig. 12.2.11 Results of current ramp
expenments showing the ratio of the
measured energy confinement time, rg,
obtained from the diamagnetic loop, to the
Goldston L-mode scaling prediction, r^,
plotted against the internal inductance, €,
[Zamstorff, M C ef al. Plasma Physics
and Controlled Nuclear Fusion Research
1992 (Proc 14th Int Conf., Wurzburg,
1992) Vol 1, 111 I A.E A., Vienna A993)].
D Ramp-down
X Steady-state
A Ramp-up
Internal inductance L

Fig. 12.2.12 The thermal power flow,
Q{r), through a given flux surface
'ormalized to the power flow predicted by
the Bohm scahng in (a), and by the
gyro-Bohm scaling in (b), for a senes of
discharges in which the normalized
Larraor radius was varied by changing the
toroidal field. The smaller scatter in (a) is
taken as evidence that L-mode transport is
better descnbed by Bohm than by
gyro-Bohm scaling [Scott, S.D. et al
Plasma Physics and Controlled Nuclear
Fusion Research 1992 (Proc 14th Int
Conf., Wurzburg, 1992) Vol 3, 427
I.A.E A, Vienna A993)]
Further insight into local transport processes was denved from per-
turbative analyses of heat and particle transport, the former making use
of the heat pulse due to the sawtooth collapse and the latter exploiting
gas puffs from the plasma edge. Use of the sawtooth heat pulse to probe
thermal transport was first attempted at the ORMAK tokamak, where
good agreement was obtained between the measured thermal diffusivity
and that resulting from the conventional power balance calculation. In
TFTR the thermal diffusivity deduced from sawtooth heat pulse
propagation using soft X-ray and electron cyclotron emission measurements was
up to an order of magnitude greater than that calculated from a steady-
state power balance for ohmic and L-mode plasmas. Although it was
initially concluded that the heat pulse perturbation propagates diffusively,
subsequent investigations found that the sawtooth collapse contributed a
'ballistic', or non-diffusive, component to the thermal transport
following the collapse, at least within rmx < r < l.Srnux, where rmx is the
radius within which flux reconnection occurs in the Kadomtsev model of
sawtooth oscillations. This calls into question the simple interpretation
of the heat pulse propagation in terms of a thermal diffusivity.
The temperature dependence of local transport coefficients was
investigated in perturbative studies of electron particle transport in L-mode

helium plasmas heated by NBI. Small quantities of helium gas were
puffed into a series of plasmas in which the NBI power was varied at
constant plasma density. A significant aspect of this experiment was the use
of a generalized form of the particle transport equations to account for
variations in the particle diffusivity and pinch terms associated with changes
in the perturbed density gradient. Analysis was restricted to the region
0.43 < r ja < 0.75 to eliminate uncertainties due to sawtooth activity in
the plasma centre and due to the particle source term at the plasma edge.
The resultant form of the particle transport coefficients, analogous to the
particle diffusion coefficient and the pinch velocity, scaled strongly with
local electron temperature, varying as T^, with 1.5 < a < 2.5. Power
balance analysis yielded similar scalings for the ion and electron thermal
diffusivities. This form of temperature dependence was taken as strong
evidence that L-mode transport is governed by electrostatic drift-type
microinstabilities.
The factors influencing transport in supershots were tested in
experiments in which the density profile was transiently broadened, either by
a helium gas puff, or by pellet injection. The motivation for such tests
was the suggestion that supershot plasma profiles lie near the marginal
stability limit for ion temperature gradient driven turbulence, for which
the parameter r/i(= d In Tj/d In n^ plays a determining role. A
broadening of the density profile, leading to an increase in r/i, would be expected
to generate an increase in the turbulence level and a broadening of the
ion temperature profile, to return the plasma to marginal stability. In fact,
the ion temperature gradient scale length, TJVTi, decreased, although
r/i was well beyond the theoretically predicted stability limit, calling the
original conjecture into question. It seems likely that an understanding of
the reduced level of transport in supershots will rely on a self-consistent
treatment of the neoclassical radial electric field shear associated with the
pressure gradient and flow shear in the plasma and its influence on the
stability of ion temperature gradient turbulence, as discussed in Section 12.5
in relation to the improved confinement of H-mode plasmas.
Developments in diagnostics of plasma turbulence, particularly in the
areas of beam emission spectroscopy and microwave reflectometry, have
allowed more precise comparisons between the underlying plasma
turbulence and the measured plasma heat fluxes than was previously possible.
It was shown that the relative level of density fluctuations at long
wavelengths, k\_ < 2cm^^ in the core of L-mode plasmas was inversely
correlated with re. In addition, a random walk estimate of the local
diffusivity, based on beam emission spectroscopy measurements of
fluctuation correlation length and correlation time, was in rough agreement
with power balance calculations of thermal diffusivity. However, the
characteristics of turbulence in the plasma edge, r/a > 0.6, differed
strongly from those at smaller radii and did not correlate with global
energy confinement. This transition between core and edge turbulence
was observed at all levels of NBI power and was maintained into the super-
shot regime, though the transition region moved outwards with increasing
central temperature, reaching r/a ~ 0.9 in supershots.

One of the key parameters in fusion research, the rate at which therm-
alized a-particles are convected out of the plasma, can be determined by
measuring the particle diffusivity of helium. This has become possible
due to experimental and theoretical advances in the analysis of charge
exchange spectra of helium. Helium transport was studied in the L-mode
and supershot regimes using edge gas puffs and charge exchange
measurements of helium profiles. While an inward pinch caused peaking of
the helium density profile in supershots, the transport of helium was
sufficiently fast in both regimes to be compatible with sustained ignition
in a reactor.
Experiments with deuterium-tritium mixtures
In late 1993 TFTR became the first tokamak to produce plasmas with
a 50:50 mixture of deuterium and tritium. An extended series of
experiments was performed to optimize fusion power production and to address
important physics issues, such as the control of isotopic concentration,
the isotopic dependence of confinement, a-particle heating, and the
existence of collective a-particle effects. The programme also dealt with
technological issues such as tritium handling, neutral beam injection of
tritium, demonstration of ICRF heating scenarios, and tritium retention
in the first wall.
To maximize fusion power and to access regimes of relevance to an
ignited plasma, D-T studies concentrated on the supershot regime. The
use of a D-T fuel mixture naturally leads to a factor of ~ 100 increase in
fusion power as compared to deuterium plasmas, but the D-T phase was
also accompanied by developments in supershot plasmas. Some of these
arose from advances in conditioning techniques, such as lithium pellet
injection, and others were benefits deriving from the use of tritium. In
particular, energy and particle confinement in supershots improved with
increasing atomic mass. Thus, the ratio of D-T to D-D fusion power at
constant plasma energy was 115 ± 15, while the ratio at constant NBI
power was 135 ±7. Asaresult, a maximum fusion power of 10.7 MW was
achieved in a 2.7 MA/5.5 T supershot with 39.5 MW of mixed deuterium
and tritium NBI. This pulse, which is illustrated in Fig. 12.2.13, had an
instantaneous Qdj of 0.27, neglecting a-particle heating, and reached a
normalized y6 of 1.8. Central fusion power densities in D-T supershots
reached 2.8MWm~^, which is comparable to that expected in a reactor,
while the maximum fusion yield was 7.6 MJ.
In experiments at moderate power, the combination of better
conditioning and higher confinement allowed a gain of almost a factor of 3 in fusion
triple product relative to the best deuterium plasmas. In a discharge heated
by 17 MW of pure tritium NBI, nhyd@)ri@)r* = 8.7 x lO^^keV sm"^
was attained, with TiiO) = 44keV,ne@) = 8.5 x lO^'^m'^ and
tg = 0.33 s, where nhyd(O) is the total density of all hydrogen isotopes in
the plasma centre and tg is the ratio of total stored energy to total input
power, the time rate of change of the stored energy being neglected.

Fig. 12.2.13 Overview of the supershot
with the highest D-T fusion power
production, showing the central ion and
electron temperatures, 7,0, Teo, the central
and volume averaged electron densities,
n@),(n}, the stored plasma energy, Wd,a,
the fusion power output, and the neutral
beam heating power [Princeton Plasma
Physics Laboratory].
Density
A0'5m-3)
NB
Power
(MW)
(MJ)
Oj
Fusion 101
Power
(MW)
■""^Minor disruption\
& Mhd Activity
Processes limiting fusion performance in D-T supershots were very
similar to those observed in deuterium plasmas. At the highest power,
the performance was limited by mhd stability, rather than confinement or
heating power, and in particular by minor or major disruptions associated
with the high values of y^N- At lower power levels, a range of mhd activity
with low poloidal and toroidal mode numbers degraded confinement by
up to 30%, as in deuterium supershots, though at currents above 2 MA
their influence was usually weaker, causing a degradation of perhaps 5%.
Further limitations arose from hydrogen, as opposed to deuterium and
tritium, recycling from the limiter. In some cases this amounted to 20%
of the recycling flux and diluted the plasma fuel mixture.
While the behaviour of D-T discharges was, in many respects,
indistinguishable from that of deuterium plasmas, the global confinement and
local transport were substantially modified in supershots with a
significant tritium content. In D-T supershots both ion and electron temperatures
increased with respect to equivalent deuterium cases, leading to increases
of up to 22% in the stored plasma energy in D-T plasmas. Approximately
70% of the gain in stored energy was due to the thermal plasma, and both
the thermal and total energy confinement times increased approximately
as A°-^, where A is the volume average isotopic mass of the hydrogenic
ions in the region r/a < 0.5. Local transport coefficients in the core
region, r/a ~ 1/3, scaled even more strongly with isotopic mass. At
fixed injection power, the effective ion thermal diffusivity, which is
proportional to the ratio of the total ion heat flux to the ion temperature
gradient, scaled as A'-^-^"^^-^, while the electron diffusion coefficient
varied as A~^-'^'^^--^. D-T limiter H-modes exhibited similar improvements
and the energy confinement times reached ~4r™^^^ ^. In L-mode
plasmas, isotopic effects were weaker, but both the thermal and total energy

Fig. 12.2.14 Evolution of the tritium
density profile inferred from neutron
emissivity profiles following a tritium gas
puff at 3.5 s [from Efthimion, P. C. et al.
Physical Review Letters 75, 85 A995)].
confinement times scaled at least as strongly as the A" dependence of
the ITER89-P scaling.
The large fusion cross-section for D-T reactions allows the resultant
14.1 MeV neutrons to be used as a sensitive diagnostic of the spatial
profile of tritium within the plasma. The evolution of the tritium profile
following a tritium gas puff can be deduced from the neutron emission
profile, and the tritium transport coefficients can then be calculated. This
technique was applied to supershots with tritium concentrations as low
as 1% of that of deuterium. Fig. 12.2.14, showing the inferred evolution
of the tritium profile following a tritium gas puff, illustrates how the
initially hollow tritium profile becomes peaked on a timescale of ~ 100 ms.
The local tritium particle diffusivity and convective velocity derived from
these measurements are very similar, both in magnitude and radial
profile, to He transport coefficients obtained under similar conditions. The
tritium diffusivity, Dj, rises from ~0.6m^ s~^ in the plasma centre to
~2.5 m^ s~^ at r/a ~ 0.9, while the inward convective velocity is close
to zero, and consistent with neoclassical values, for r/a < 0.65, but
exceeds the neoclassical prediction at larger radii.
Several important issues concerning the behaviour of energetic
a-particles were investigated. The energy distribution formed as the
a-particles slow from their 3.5 MeV birth energy was measured by several
methods. Active charge exchange spectroscopy allowed measurements in
the region up to 0.7 MeV. In addition, analysis of neutral helium lost from
the plasma following the injection of a lithium or boron pellet, which
provided a double charge exchange source, was used for a-particle energies
above 0.7 MeV. During the a-thermalization phase, after the tritium NBI
was switched off, the observed energy distribution followed that expected

Fig. 12.2.15 a-particle loss fraction
captured by a lost a particle detector
located at the bottom of the vacuum vessel,
that is in the direction of the ion VB drift.
The first orbit loss falls with increasing
plasma current in the manner predicted by
model calculations. Note that the
calculations are normalized to the
experimental results at 0.5 MA
[Hawryluk, R.J. et al. Plasma Physics and
Controlled Nuclear Fusion Research 1994
(Proc. 15th Int. Conf., Seville, 1994) Vol 1,
11.1.A.E.A., Vienna A995)].
/
Normal i/eil
liibl-oihil
loss moilcl
Plasma current (MA)
on the basis of collisional slowing-down and transport processes. In
plasmas with monotonic shear profiles, the rate at which a-particles were lost
directly from the plasma was, in part, consistent with this. First orbit loss
measured by a detector situated 90° below the plasma midplane fell by an
order of magnitude as the plasma current increased from 0.5 to 2.5 MA
(Fig. 12.2.15), in agreement with model calculations, and at 2 MA the
total first orbit losses were only 3%. However, losses to detectors closer
to the midplane were higher than expected, and it was suggested that
the discrepancy involved additional loss mechanisms such as toroidal
field ripple. Prompt losses of a-particles in plasmas with reversed central
shear were up to a factor of 2 greater than in equivalent discharges with
monotonic shear. Code calculations showed that for some plasma
conditions the higher value of ^@) could cause all a-particles bom on trapped
orbits to be lost, either because they were on unconfined orbits, or due to
stochastic ripple diffusion.
In D-T plasmas the loss of a-particles due to coherent mhd activity
was, for the most part, similar to the fusion product loss rate from
deuterium plasmas, and affected only a small fraction of the total a-particle
population. At major disruptions, however, up to 20% of the energy stored
in the a-particles was lost in ~2 ms during the thermal quench phase, with
the loss predominantly downwards, that is in the ion V5 drift direction.
Such localized energy losses will require specific measures to protect
the first wall of a reactor. Loss rates comparable with first orbit losses
were also observed in discharges with ICRF heating. It was proposed
that a-particles on marginally passing orbits could resonate with the RF
waves and gain perpendicular energy, a process which transferred them
to loss orbits.
TAB modes pose yet another threat to a-particle confinement, but
little evidence for TAE excitation by a-particles was found in initial
D-T experiments. For these conditions, code predictions indicated that

Landau damping, particularly by thermal and beam ions, exceeded the
destabilizing contribution of the a-particles. To explore the conditions
for a-particle excitation of TAE modes, a plasma discharge scenario was
developed with weak central magnetic shear and ^@) > 1, following the
predictions of theoretical calculations that the threshold for a-driven TAE
modes should be sensitive to the ^-profile. In these discharges the high
power heating phase was terminated before the high confinement phase,
resulting in a rapid decay of the thermal and beam ion pressure, while
the a-particle pressure decayed on the longer a-slowing-down timescale.
Under these optimized conditions, it was possible to observe a-driven
TAE modes with low toroidal mode numbers, in the range n = 1-6,
even at low central a-particle pressure, y6a@) ~ 10~ (Fig. 12.2.16).
Due to the low amplitude of the excited TAE modes, no anomalous
a-particle losses were detected. On the other hand, a small enhancement,
by approximately a factor of 2, of the rate of a-particle losses above
the first orbit losses was observed in the presence of kinetic ballooning
modes, which are destabilized by steep pressure gradients in the thermal
plasma.
Overall, the confinement of a-particles in high current, mhd quiescent
discharges with monotonic shear profiles, where first orbit losses were
small, confirmed earlier measurements of energetic particle confinement
based on neutral beam injected ions and fusion products in deuterium
Fig. 12.2.16 Observations of toroidal
Alfven eigenmodes excited by a-particles
in the NBI afterglow phase of a TFTR D-T
plasma with weak central magnetic shear
and ^@) ~ 1.1: (a) normalized plasma
beta, /3n, and a-particle pressure, /3„,
together with the NBI heating waveform,
(b) amplitude of the magnetic field
fluctuations, Btae, for TAE modes having
toroidal mode numbers n = 2,3,4
(c) frequency of n = 2,3,4 modes. The
increase in mode frequency correlates with
the decrease in central density following
the termination of NBI heating
[NaziMan, R. et aL Fusion Energy 1996
(Proc. 16th Int. Conf., Montreal, 1996)
Vol 1, 281.1.A.E.A., Vienna A997)].

617
plasmas: the radial diffusion coefficient for a-particles was up to an order
of magnitude smaller than that of thermal ions.
The TFTR D-T programme afforded the first opportunity in
magnetic fusion research to investigate the effectiveness of plasma heating by
a-particles, which is an indispensable component of a D-T fusion reactor.
During the high power heating phase of supershots, heating of electrons
by a-particles added only ~ 1 MW to a total electron heating of ~ 10 MW
from beam heating and ion-electron equipartition. Although this
contribution to electron heating was difficult to detect directly, steady-state
power balance calculations concluded that ~50% of the 2 keV rise in
electron temperature in D-T relative to deuterium plasmas was explained by
a-particle heating. A more direct determination was made in the decay
phase following NBI switch-off by injecting a lithium or boron pellet,
which raised the density and caused a fall in electron temperature. The
subsequent rate of reheat of the electrons was found to be ~85% higher in
D-T than in deuterium plasmas, in agreement with transport code
analysis which included a-particle heating. Finally, a detailed analysis of the
scaling of electron temperature with plasma parameters in deuterium,
tritium and D-T experiments revealed that, when the database of electron
temperatures was corrected for the change in temperature associated with
the isotopic dependence of energy confinement in supershots, the residual
change in electron temperature was consistent with the predicted level of
a-particle heating of electrons.
JET—Joint European Torus, Abingdon, UK
JET was constructed and operated between 1978 and 1999 as a joint
undertaking by 16 European states under the auspices of EURATOM.
Since 2000, the scientific and technical programme has been conducted
under the European Fusion Development Agreement (EFDA) and the
device has been operated on behalf of EFDA by the United Kingdom
Atomic Energy Authority. The principal aims of the experiment are the
investigation of heating and confinement in reactor relevant plasma
conditions, the investigation of plasma-wall interactions and the study of
a-particle production, confinement, and consequent plasma heating.
The JET tokamak (Fig. 12.3.1), in which the first plasma was produced
in June 1983, has a D-shaped poloidal cross-section to minimize stresses
in the toroidal field coils. Its original aspect ratio was R/a = 2.96/1.2,
though the minor radius was subsequently reduced to ~ 1 m following the
installation of the pumped divertor. The device operates with magnetic
fields of up to 3.8 T and has reached plasma currents of 7 MA in limiter
experiments. It is unusual among large tokamaks in that it has an iron

Transformer
limb
Mechanical
structure
Inner poloidal field coils
(primary winding)
Fig. 12.3.1 Layout of the initial
configuration of the JET experiment
transformer core, which improves the efficiency of the primary circuit
and reduces stray fields.
JET was originally envisaged as an elongated limiter tokamak, but was
subsequently adapted for magnetic separatrix experiments and was
eventually transformed, following a major upgrade in the period 1992-1993, to
a pumped divertor configuration. This modification involved a substantial
remodelling of the interior of the vacuum vessel (Fig. 12.3.2a) in order
to facilitate investigations of the problems of heat exhaust and
impurity control. The new arrangement incorporates internal divertor coils to
generate a wide range of plasma equilibna and divertor geometnes. In
addition, a cryopump, with an in situ pumping capacity of ~200 m^ s~'
for deutenum, permits the study of fuelling and impurity control
strategies. The target arrangement has a power-handling surface designed to
avoid overheating of tile edges and a capability for sweeping the divertor

619
Fig. 12.3.2 (a) Poloidal c
the JET pumped divertor configuration
showing the divertor coils, the target plates
for the Mark IIA configuration and the
cryopump. (b) The three pnncipal pumped
divertor configurations studied, in
chronological order: Mark I, Mark IIA,
Mark IIGB (Gas Box). From 2002 on,
expenments were conducted without the
central septum dividing the inner and outer
divertor legs in the Mark HOB. The
original X point configuration,
subsequently referred to as the 'Mark 0', is
also shown for companson.
Strike points at 4 Hz, which allows long pulse, high power heating studies.
Both carbon fibre and beryllium divertor targets have been used, though
the latter for only a limited period, and the divertor geometry has been
progressively modified to improve the power and particle control
capabilities (Fig. 12.3.2b). Plasma performance has been studied in the pumped
divertor configuration at currents of up to 6 MA.
The JET heating systems have been designed for high power, long
pulse operation. The ICRF system has an installed generator
capacity of 32 MW for 20 s and can be tuned in the ranges 23-39 MHz and
41-57 MHz so as to permit heating over a range of magnetic fields and
minority resonance positions. The antennas can be operated as a phased
array for current drive studies. NBI provides the second major source of
heating, with a total capability of ~20 MW for 10 s at injection energies
of up to 140keV with deuterium and up to 160 keV with tritium. The
main approach to current drive is the lower hybrid system, operating at
3.7 GHz, which has a generator capacity of 12MW for 20 s.

Limiter experiments
Experiments have been performed using either the outer limiters or the
inner wall as limiting surfaces. The former originally consisted of eight
discrete graphite poloidal limiters, but these were later replaced by two
toroidal belt limiters approximately 1 m above and below the equatorial
plane of the vessel. The inner wall limiter consisted of a continuous region
of carbon tiles extending 1 m above and below the equatorial plane.
Initially all power-handling surfaces were fabricated from graphite or carbon
fibre, but solid beryllium has been used for limiter and/or divertor targets
in several experimental campaigns from 1989 onwards. The principal
techniques for conditioning of the vessel and plasma-facing surfaces
have been baking to 350 °C and glow discharge cleaning in deuterium
and helium. Carbonization has also been used, but from 1989 onwards
beryllium gettering has been preferred since it has proved to be a highly
efficient conditioning method.
Initial experiments characterizing the confinement and impunty
content of ohmic discharges showed that the variation of te and Zgff with
plasma parameters was very similar to that in TFTR. As a result of the
larger dimensions of JET and the increased current capability, the
maximum energy confinement time in ohmic plasmas reached values of ~1 s.
Analysis of plasma loop voltage and equilibrium evolution led to the
conclusion that, as in TFTR, the resistivity is described by the neoclassical,
rather than Spitzer, formulation.
It is well known that elongated plasmas are vertically unstable, as
discussed in Section 7.12, and a feedback controlled stabilization circuit is
used to maintain the plasma vertical position. Nevertheless, at the limits of
stabilization and following sudden changes in equilibrium, such as occur
at a disruption, control of the vertical position is often lost. A particularly
severe case was encountered during the first year of operation. At 2.7 MA
and an elongation of 1.7, a force of several hundred tonnes was
transmitted to the vacuum vessel, which weighs ~ 100 tonnes, causing a vessel
displacement of ~1 cm. Subsequent analysis indicated that a
substantial poloidal current flowing through the plasma and the vacuum vessel
was required to maintain force balance. The existence of these 'halo
currents', discussed in Section 7.12, which are driven by the voltage induced
as the plasma crosses the magnetic field in the course of the instability,
has been demonstrated by direct measurement of the resultant fields and
of the currents flowing in interior vessel components. Experiments have
also shown that the distribution of halo currents and forces may not be
toroidally symmetric and this is believed to be associated with the growth
of a non-axisymmetnc mhd instability during the vertical motion. The
large vertical and radial forces to which the vacuum vessel and in-vessel
structures were subjected led to improvements in the arrangements for
supporting the vacuum vessel and a more cautious approach to operation
at the limits of vertical stability control.
LHCD and ICRF heating have been used to reduce the plasma
resistivity, both by raising the electron temperature and by accelerating electrons
to high energy, thereby extending the duration of the current flat-top. For

Fig. 12.3.3 Thermal stored energy
plotted against loss power for plasmas at
7 MA Data taken at 5 and 6 MA m the
same senes of pulses are also shown [The
JET Team (presented by P J Lomas)
Plasma Physics and Controlled Nuclear
Fusion Research 1992 (Proc 14th Int
Conf, Wurzburg, 1992) Vol 1, 181
IAEA,ViennaA993)]
example, by exploiting LHCD during the current ramp-up, a flat-top
duration of 8.5 s was attained at a plasma current of 7 MA. In addition,
at 2MA the plasma pulse was sustained for 60s, which allowed the
plasma behaviour to be investigated on timescales commensurate with
those for resistive diffusion and plasma-wall interactions to reach steady-
state. The most significant observation was that particle pumping by the
plasma walls saturated after ~30 s and thereafter the plasma density rose,
emphasizing the need for active means of particle control in long pulse
experiments.
Confinement data in limiter plasmas cover the range from 1 to 7 MA,
with q{a) in the range 2 to 15 and with total input powers of up to
35 MW using NBI, ICRF, and LHCD. The maximum energy in a 7 MA
plasma was 12 MJ, corresponding to an energy confinement time of 0.4 s.
Energy confinement of 7 MA discharges at the highest powers was
consistent with L-mode scalings, but with considerable scatter in the data.
This was particularly noticeable at moderate powers (Fig. 12.3.3), where
data in the range 5-7 MA showed no significant variation with
current. A rise in the plasma density with increasing current, leading to
a broadening of the NBI power deposition profile, was suggested as an
important factor in this behaviour. Sawtooth oscillations were also
proposed as an element in the confinement degradation, since the sawtooth
mixing-radius increases with decreasing q{a). In consequence, 7 MA
plasmas produced fusion triple products of ~1 x 10^° keV sm~^, but the
best triple product in limiter plasmas was obtained in 3 MA discharges,
which exhibited more peaked plasma profiles and yielded a value of
ni@)ri@)TE ~ 2 X lO^OkeVsm-^
Pulsed AC operation of the tokamak has been suggested as a
possible alternative to the requirement that a fusion reactor should operate

Fig. 12.3.4 Parameters of a full AC
plasma cycle at 2 MA [from Tubbing,
B.J D. et al. Nuclear Fusion 32, 967
A992)]
(keV)
(MW) 0.5
0)
Radiated power
as a steady-state device. This mode of operation was first demonstrated
on the STOR-IM tokamak at a plasma current of 4kA and was
further investigated in JET in 2MA discharges (Fig. 12.3.4). The aim of
these experiments was to demonstrate that two plasma discharges with
equal and opposite plasma currents could be produced with essentially
zero delay between the termination of the first and initiation of the
second. A major concern was that the termination of the first plasma would
adversely affect the breakdown conditions for the second. However, it was
found that the second breakdown could be achieved for delays of between
50 ms and 6 s following the termination of the forward cycle, even after
disruptions at several 100 kA. No significant differences in plasma
parameters, including impurities and radiated power, were observed between
the two cycles and the overall gas consumption was the same as in a long,
uninterrupted tokamak pulse.
Magnetic separatnx experiments
Although JET was conceived as a limiter tokamak, it was recognized
that its shaping capability permitted operation with a magnetic separatnx
within a limited current range. Such plasmas, also known as X-point
plasmas, were widely exploited before the installation of the pumped divertor,
principally for investigation of H-mode and high performance plasmas,
but also for initial studies of divertor physics. Both single null and double
null X-point configurations were studied. In ELM-free H-modes global

12.3 JET 623
energy confinement is typically twice as high as that in equivalent L-mode
plasmas, but degrades with power as in the L-mode. For plasma currents
ranging up to 4 MA in the original JET configuration, energy
confinement mcreased linearly with current at fixed power, consistent with the
empirical scaling expressions, but between 4 and 5 MA, the confinement
time varied little.
In contrast to plasmas in other tokamaks, H-modes in the original JET
configuration were generally ELM-free and the improvement in particle
confinement caused a rise in the plasma density, leading to a mono-
tonic increase in radiation. This eventually terminated the H-mode after a
period of 3-5 s when the radiated power equalled the input power. ELMy
H-modes were produced by puffing gas throughout the H-mode, leading
to the establishment of a steady-state regime lasting up to 18 s, which was
limited in duration by stresses in the shaping field windings rather than
plasma physics constraints. A gradual rise in the density towards the end
of these plasmas emphasized yet again the need for active pumping to
control particle influxes. Energy confinement in these plasmas was in the
range 1.4-1.8t™^^^'^, with the best confinement in discharges which
were free of large amplitude n = 1 mhd activity.
Mhd and operational limits
Major disruptions, which are the principal limitation to the operating
space accessible to JET plasmas, have several main causes: current rise
instabilities, q{a) reaching 2, error field modes, density limits,
neoclassical tearing modes and, especially in plasmas with internal transport
barriers, ideal kink instabilities. To this list must be added the vertical
instability, which involves rather different physics, but has equally
serious consequences. Large amplitude ELMs, such as those observed at the
termination of the high fusion performance phase of hot ion H-modes,
which are discussed later, emerged as a particularly troublesome source
of vertical instabilities during pumped divertor operation. Disruptions in
JET follow a well defined sequence of events, and the general behaviour
has been described in Sections 7.8 to 7.10. Many of the disruptions can
be understood by following the plasma trajectory in the l^-qia) diagram
in which various, empirical, stability boundaries are plotted (Fig. 12.3.5).
The vertical legs of the triangular-shaped lower boundary occur at integer
values of q(a)and correspond to the growthofmodeswithm/n = q{a)/\,
which can be destabilized if the current ramp rate is too great. Modes
growing at q{a) = 3,4 are particularly dangerous as these can cause
disruptions. Experiments have shown that plasmas invariably disrupt at
q{a) = 2, indicating the existence of a hard barrier. The upper stability
boundary represents plasmas in which the current channel has contracted
to within q = 2. This is usually the situation in plasmas at the density
limit after the radiated power fraction reaches unity.
In JET the L-mode density limit is associated with the radiated power
reaching 100% of the input power, due to over-fuelling, to impurities

Fig. 12.3.5 Diagram of loci in the
li-q(a) plane at which an « = 1 locked
mode first occurred in disruptive plasma
under a vanety of circumstances. The
vertical legs of the lower stability
boundary occur at integer values oiq(a]
[Snipes, J.A. et al Nuclear Fusion 28,
1085A988)]
-
Density limit disruptions^—^
^^^
A y1 /^
/ 1/ "
BCink and double tearing region
Y \ \ \ \
• Density limit
□ Sawtooth collapse
o Pellet injection
^ q=2 limit
'■ Current rise
__- Empirical stability
boundary
1 1
entering the plasma, or to a loss of auxiliary heating power. In
experiments with carbon plasma-facing materials, before beryllium gettering
was applied routinely the limit did not increase significantly with
additional heating. The density limit parameter, \Q~^'^hRq{a)IB, rose from
12 to 20m~^T~^ with little evidence of a systematic improvement with
power. Increased impurity generation with additional heating was thought
to be responsible for the robust nature of the limit. The introduction
of beryllium as a limiter material produced very different behaviour,
with density limit parameters in the range 30^0 m~^T~^ densities 50%
in excess of the Greenwald density, nowClO^^m"^) = I{MA)/na^,
and MARFEs playing an important role at the limit. Moreover, the
plasma density was often observed to fall in response to the formation
of a MARFE. In limiter configurations, therefore, the frequency of
disruptions was very much reduced. In addition, a clear correlation was
found between the limiting density at the plasma edge, Wedge. and the
total input power, P, with Wedge oc P°^. This observation is in
agreement with theoretical expectations for a limit determined by impurity
radiation.
Small deviations from axisymmetry in the externally applied
magnetic field give rise to non-rotating m = 2/n = 1 modes which cause
disruptions, as discussed in Section 7.11. In JET, field errors, which arise
principally from the structure of the poloidal field coils, have been
calculated to be ~1 G at the ^ =2 surface. However, the resulting m = 2 mode
grows to saturation levels of ~10 G. The mode grows at low plasma
density and sets a lower density limit for plasma operation, which increases
as q{a) falls below 4. Experiments have been conducted, by varying
the number of active turns in the vertical field coils, to investigate how
variation of the magnitude of the field error influences the threshold
density. As expected, raising the field error by a factor of ~2.5 significantly
increases the density range over which the mode grows. In contrast, with
the installation of the pumped divertor coils, the total n = I component

12.3 JET 625
of the error field has fallen, allowing an expansion of the operating space
at low density. Since such modes grow from a stationary field error,
spinning of the plasma by NBI is often used to suppress their growth and
permit operation below the threshold density. It has also been possible
to exploit the internal saddle coils, installed at the time of the pumped
divertor upgrade, both to investigate the dependence of the critical error
field for instability growth on plasma parameters and to partially correct
the n = 1 component of the error field.
The forces applied to the vacuum vessel during disruptions are
outlined in Section 7.9. These are a source of great concern, and there has
been considerable incentive to avoid regions of operating space in which
disruptions occur, or else to minimize the impact of disruptions when
they are unavoidable. In JET, the growth of a locked m = 2/n = 1
precursor to a radial disruption has allowed the implementation of a
disruption amelioration system. This is triggered when the amplitude of the
m = 2/n = 1 mode exceeds a threshold value and it is intended
primarily to reduce disruption forces. Since the elongation determines the
seventy of the force associated with the vertical instability which often
accompanies disruptions, and since the resultant force scales quadrati-
cally with the plasma current, the main action of the system is to reduce
the plasma elongation and current. In this way the force applied to the
vacuum vessel has been reduced by up to an order of magnitude.
Sawtooth oscillations have been studied at some length using two-
dimensional reconstructions of soft X-ray emission and local electron
temperature measurements from electron cyclotron emission. These have
revealed that the sawtooth collapse has two main phases. The first consists
of a rapidly growing m = n = \ displacement of the plasma core, and
the second is a rapid redistribution of energy, leading to a flattening of
the central temperature profile on a timescale of 100 /iS (Fig. 12.3.6). The
initial m = \ instability apparently takes different forms, in some cases
appearing as a classic m = \ island, indicative of reconnection, in others
resembling a convective cell, as illustrated in the figure. In all cases, the
onset of the mode is too rapid to be explained by conventional theories of
resistive reconnection and, although theoretical analyses of collisionless
reconnection have brought calculated and measured values of the collapse
time into closer agreement, the rapid growth of the m = 1 instability at
the sawtooth collapse remains problematic. It is clear, moreover, that the
transport of energy which leads to the flattening of the temperature profile
occurs without a full magnetic reconnection, implying that some
additional rapid transport mechanism is required. The theoretical implications
of the JET observations relating to the sawtooth collapse are discussed in
detail in Section 7.6.
Other questions concerning the m = 1 instability are raised by pellet
injection experiments which have revealed that a very localized density
perturbation, the 'snake', can persist for several seconds following
ablation of the pellet (Fig. 12.3.7). It has m = n = 1 symmetry, is located at
the ^ = 1 surface, and can undergo a substantial shift in minor radius,
Ar/r ~ 30%, in the course of a sawtooth penod. The inference that

~ —U^ , Central
p^ channel
1
100 us \ I
A(f=0,P^=4 2)
B(f=100,P =4.2)
C(f=130,Pjj,=4.2)
7 I
D(f=310,P^=3.0) E(f =2540, P^=2.4) F(f =5040, P =2.6)
Major radius (m)
Fig. 12.3.6 Contour plots of X-ray emissivity during a sawtooth collapse with time sLces shown in microseconds (/xs). Core
displacement is seen in frames A and B, and poloidal spreading in frame C. The peak emissivity falls significantly between frames C
and D, corresponding to rapid core cooling. Frames E and F show a residual asymmetry several milliseconds after the collapse. The
time intervals associated with the contour plots are in microseconds and the maximum power density, P^, is in kilowatts per cubic
metre [Campbell, D.J et al Plasma Physics and Controlled Nuclear Fusion Research 1986 (Pmc llthint Conf., Kyoto, 1986) Vol 1,
433.1.A.E.A, Vienna A987)].
Pellet
ablation
Fig. 12.3.7 Three dimensional contour
plot of soft X-ray emission, as viewed
from a camera situated above the plasma,
showing the snake-like perturbation of the
emission following the injection of a
deuterium pellet. The plasma centre is at
i? = 0 [from Weller, A. et al Physical
Review Letters 59, 2303 A987)]
the ^ = 1 surface undergoes a similar displacement would appear to
imply that the central ^-profile is flat, with ^@) within a few per cent
of unity, in contradiction of polarimetric measurements, which show
that q @) is typically ~0.7 in sawtoothing discharges and remains well

Fig. 12.3.8 (a) Central electron
temperature, 7^@), and ICRF heating
power, Prf, illustrating stabilization of
sawtooth oscillations by central ICRF
heating, (b) Evolution of the central safety
factor, qo, as determined by polanmetric
measurements (solid line) and resistive
diffusion calculations (dashed line) [from
Campbell, D.J. et al Plasma Physics and
Controlled Nuclear Fusion Research 1988
(Proc. 12th Int Conf., Nice, 1988) Vol 1,
377.1A E.A., Vienna A989)]
(keV)
1.1
1.0
0.9
0.8
^0 \
i?.Iku
1 1
(b)
1 1
below unity throughout the sawtooth collapse. Unfortunately, the two
measurements cannot be made simultaneously. The persistence of the
perturbation through many sawtooth collapses confirms, however, that
the region inside q = I cannot be fully reconnected during the collapse.
A final problem is raised by the persistence of the snake for times much
longer than its collisional confinement time.
Concern over sawtooth modulation of the central fusion reactivity of
the plasma has stimulated studies of methods for stabilizing the sawtooth
instability. Modification of the current profile to maintain ^ @) > 1, for
example, by lower hybrid current drive, appears to be the most reliable
technique. However, sawtooth oscillations have been stabilized by a
variety of other methods, some of which provide insight into novel aspects
of the physics. For example, in plasmas with central heating and
significant fast particle populations, sawtooth oscillations can be stabilized for
periods of several seconds (Fig. 12.3.8). Although the phenomenon can
be obtained in neutral beam heated plasmas, the appropriate conditions
are particularly straightforward to achieve using ICRP minority heating
with a central resonance. The ICRP can accelerate minority ions to
energies of ~ 1 MeV and a fast ion population with substantial total energy
can develop. Detailed experimental results, including the reduction in the
efficiency of the stabilization as the minority resonance is moved off-axis,
are consistent with a theory which proposes that the fast ion population is
responsible for the stabilization, essentially as a result of the conservation
of the third adiabatic invariant of the energetic ions, defined in Section 2.7.
Further understanding of factors influencing the stability of sawtooth
oscillations has emerged from experiments on the feasibility of ICRP fast
wave current drive using minority ions. As discussed in Section 3.13,

this is expected to drive anti-parallel currents on either side of the ICRP
resonance position, causing changes in the local current gradient. By
varying the relative phasing of the current straps in the ICRP antenna so
as to either reduce the current gradient at ^ = 1, using phase (p = -|-90°,
or to increase it, using (j) = —90°, a significant change in sawtooth
behaviour occurs (see Fig. 3.14.3). In the former case large amplitude
sawtooth activity with extended periods is observed, while in the latter
case small, rapid sawtooth activity results. These observations support
theoretical predictions that the current gradient at ^ = 1 influences the
stability of the m = 1 mode responsible for sawtooth oscillations.
The phenomenon of sawtooth stabilization and the ability of minority
ion current drive to control the sawtooth period have been exploited to
provide insight into the relationship between sawtooth activity and the
limitation on y6 set by neoclassical tearing modes. Although y6 values of
~6% and fi^ values of ~3.8 have been achieved in JET, these modes are
often observed to degrade plasma confinement at ^Sn values significantly
below the ideal stability limit, as is the case in many tokamak
experiments. It has been shown that in plasmas with long periods of sawtooth
stabilization, typically longer than 600 ms, the terminating collapse
triggers the growth of the modes at y^N values as low as 0.5-1. When localized
minority current drive is used to shorten the sawtooth period, as described
above, the attainable ^^ can be increased by a factor of 2 or more. The
growth of neoclassical tearing modes generally requires a seed island of a
critical size, which is generated by other forms of mhd such as sawteeth,
and it has been proposed that collapse terminating a long sawtooth-free
period causes a larger magnetic perturbation, thereby producing a larger
seed island for a given value of fi^. This approach to controlling the value
of y^N at which neoclassical tearing modes occur may provide an
important method of influencing the y6-limit in reactor-scale plasmas, where
a-particles are predicted to stabilize sawteeth for tens of seconds.
TAP modes have been investigated in considerable detail, principally
by a novel application of internal saddle coils which were originally
envisaged as a means for stabilizing the m = 2/n = 1 mode responsible for
major disruptions, in the manner first explored on the DITE tokamak
and discussed in Section 11.7. These were adapted for the excitation of
small amplitude {8B/B ~ 10~^ in the plasma core), high frequency
B0-500kHz) perturbations with \n\ = 1,2, and used as an active probe
of the frequency and damping rate of Alfven eigenmodes in the plasma
by means of a resonance detection circuit which analysed signals from
magnetic pick-up coils at the plasma edge. Figure 12.3.9(a) illustrates the
variation in frequency of a TAP mode analysed in this way as the toroidal
field was swept in time. This technique has allowed the net damping rate
of Alfven eigenmodes to be investigated over a wide range of plasma
conditions in ohmic and additionally heated plasmas and led, in
particular, to the first unambiguous measurement of ellipticity-induced Alfven
eigenmodes (EAP). In high temperature plasmas, kinetic effects such as
the finite ion Larmor radius can cause the Alfven continuum in the
vicinity of each TAP mode to split into a series of closely spaced kinetic TAP

Fig. 12.3.9 (a) A comparison of the
measured eigenmode frequency, /obs, as
detected by the active magnetic
perturbation technique, with the calculated
TAE frequency at the g = 3/2 surface,
/tae> dunng a toroidal magnetic field
sweep [from Fasoli, A et al. Physical
Review Letters 75, 645 A995)].
(b) Frequency spectrum of (i) magnetic
and (ii) density perturbations during
additional heating, illustrating the fine
splitting of the TAE spectrum associated
with the occurrence of kinetic TAEs [from
Fasoli, A. et al. Physical Review Letters
76, 1067A996)]
200 220
modes. The first observations of such behaviour were also obtained using
this technique (Fig. 12.3.9(b)).
Transport and confinement studies
The exploitation of heat and density pulses generated by sawtooth
collapses to probe the local transport properties of the region outside ^ = 1
was a particular feature of early JET experiments. As in TFTR, the values
of transport coefficients denved by this method were larger than those
deduced from power balance calculations. In the case of the thermal
diffusivity, the heat pulse value, Xe^, was typically a factor of 1^ greater
than Xe , the value calculated from the steady-state power balance. This
stimulated the development of a description of Xe ^ which identified this
quantity with an incremental diffusivity, Xe""^' which determines heat
transport m response to a perturbation of the temperature profile.
Several perturbation techniques have been applied to the investigation
of the particle diffusion coefficient, D. The most complete calculation
used measurements of temperature and density profile perturbations to
include the possibility of direct coupling between heat and particle
transport. Deduced values of Xe ^ and D were in agreement with independent
analyses of the individual perturbations. However, the coupled analysis
suggested that an additional particle pinch driven by VTe, or a diffusion
coefficient which is a decreasing function of VTe, was required to explain
the response of the density to the temperature perturbation.

A model of the H-mode transition in which a sudden change in
transport at the very edge of the plasma, within ~1 cm of the separatrix, is
followed by a gradual improvement in transport at smaller minor radii has
become generally accepted as a result of extensive experimental
observations, particularly in ASDEX and DIII-D. Nevertheless, measurements
of electron and ion temperature profile evolution in JET have shown that
confinement changes very rapidly over a broad region at the H-mode
transition. This effect is particularly pronounced in high performance
plasmas, characterized as hot ion H-modes, in which high power injection
into a low recycling target plasma permits the temperature change at the
L-H transition to be observed clearly. The observed behaviour cannot be
explained by a simple model which assumes a change in temperature at the
plasma edge followed by heat pulse propagation towards the core. Instead,
a rapid reduction in transport over the outer half of the minor radius is
required, suggesting that the underlying turbulence responsible for L-
mode transport has a radial scale length of order the plasma minor radius.
The response of the heat flux to positive and negative temperature
gradients was studied by comparing the conducted heat fluxes in cases
where the heating profiles were peaked either on or away from the plasma
centre. ICRP was used to compare discharges in which the heating profile
was peaked at r = 0 and rja = 0.5. This experiment showed that the
heat flux was close to zero when nVTg was small, implying a negligible
heat pinch. In addition, the heat flux rose roughly parabolically with
—nVTe, suggesting that x was simply proportional to IVTel, although a
dependence on T", with a ~ 2.5, could not be excluded.
Fundamental information on the nature of thermal transport and how
it scales to next generation experiments can be obtained from dimension-
less scaling experiments in which many key non-dimensional plasma
parameters are fixed while p*{=Pi/a) is varied. In a series of ICRF
heated L-mode discharges in which both plasma current and toroidal
magnetic field were varied so as to keep q, collisionality, and beta
constant, the total conducted heat flux was compared with that expected on
the basis of Bohm and gyro-Bohm scalings. As in TFTR, better
agreement was obtained with Bohm scaling. Similar experiments performed
in NBI heated H-mode plasmas showed that the effective thermal dif-
fusivity exhibited a clear gyro-Bohm dependence, and this conclusion
has been confirmed for H-mode plasmas in other tokamaks and in
comparisons between tokamaks. Further such experiments performed during
the DTEl deuterium-tritium studies, discussed later, confirmed the gyro-
Bohm nature of the confinement scaling and yielded favourable fusion
performance extrapolations to ITER.
Following the installation of the pumped divertor, it was found that
H-modes, previously ELM-free, exhibit regular giant ELMs, which have
enabled steady-state H-modes of up to 20 s duration to be established.
In addition, ELMy H-modes were demonstrated at 6 MA with stored
energies of 13MJ, at that time the highest plasma energy achieved in
any tokamak (Fig. 12.3.10). Detailed investigations have revealed that
the level of recycling influences ELM behaviour, but that the magnetic

Fig. 12.3.10 Parameters of a JET 6 MA
H-mode showing the plasma current, /p,
the safety factor at the 95% flux surface,
595, the plasma diamagnetic energy, Wd,a,
the Da emission, the neutral beam power,
/^, and the radiated power, Prad.
6
(MA) 5
4,
3
2.5
2
15
10
(MJ)
(a.u.)
^jZhMM^J^^::^^^
12 14
Time (s)
shear at the plasma edge is probably more fundamental. Long ELM-
free H-modes can be obtained in equilibria with higher edge shear, which
more closely resemble plasmas typical of the previous configuration. Mhd
analysis suggests that the onset of ELMs occurs close to the ballooning
limit at the plasma edge and that this limit can be raised by increasing the
edge shear.
Investigation of the H-mode power threshold scaling in hydrogen,
deuterium, and tritium plasmas confirmed that the inverse dependence of the
power required for H-mode access on the ion atomic mass, previously
observed in comparisons of hydrogen and deuterium plasmas, extended
to tritium plasmas and, crucially, to D-T mixtures (Fig. 12.3.11). Global
confinement analysis was also performed in plasmas with various
hydrogen isotope mixtures and it was deduced that the thermal confinement time
was approximately independent of mass, scahng as A^^^^'^-^. However,
separation of the stored energy into contributions associated with the
H-mode pedestal and the plasma core showed that while the former
exhibited a strong mass dependence, scaling as A°-^, the latter varied
as yi~°-^^'^°-^ which was consistent with the A~°-^ dependence expected
from a gyro-Bohm scaling of local transport in the core.
The range of densities at which H-mode level performance can be
maintained was significantly extended by exploiting increased plasma
triangularity. Experiments at plasma triangularities of up to 8x = 0.46,

Fig. 12.3.11 Scaling analysis of the
power crossing the separatrix, Psep. at the
L-H-mode transition, as defined by total
input power, F^, corrected for radiation
losses, P^, and the time derivative of the
stored energy, dW/dt. The abscissa
represents a standard H-mode power
threshold scaling corrected by a best fit
calculation of the experimental
dependence of Psep on the effective
atomic ion mass, Aeff [from Righi, E. et al.
Nuclear Fusion 39, 309 A999)].
Pa, (scaUng)=0.97 n^' " Bt"" R^'** A^ff' '^ (MW)
where 5x is the triangularity at the separatrix, demonstrated that the
deterioration in H-mode confinement normally observed as the Greenwald
density is approached can be delayed to higher densities and that
plasmas with confinement close to that expected on the basis of the standard
scaling can be obtained at densities in the vicinity of the Greenwald
value. In addition, systematic studies of the variation of plasma
confinement with plasma elongation showed that the thermal energy confinement
time increases significantly with elongation, varying approximately as
K^ "^^'^, where kx is the separatrix elongation. The strong dependence
of H-mode confinement on plasma shaping provides important guidance
to the design of future experiments such as ITER.
Substantial changes in the confinement properties of thermal and fast
particles were observed in toroidal field ripple experiments in which 16
rather than 32 coils were utilized. This increased the central toroidal field
ripple from <10~^ to 10"-', and the edge ripple from ~1% to ~10%.
In neutral beam heated L-mode plasmas, the diamagnetic energy fell by
~30% and the plasma toroidal rotation was entirely suppressed to within
measurement errors. Both effects were considerably greater than
theoretically predicted, since estimated losses of neutral beam injected fast
ions which were either bom in, or scattered into, the ripple well loss cone
amounted to only 10%. Analysis of the confinement of fast particles, both
energetic protons produced by ICRF second harmonic minority heating
and tritons resulting from D-D fusion reactions, found that stochastic
diffusion losses were well modelled by existing theory. The increased ripple
also had a very deleterious impact on H-mode confinement. In
experiments with 16 toroidal field coils, ELM activity persisted at power levels
of up to 12MW, while in equivalent plasmas with 32 coils, ELM-free

Fig. 12.3.12 Comparison of NBI
H-modes with 16 coils (high toroidal field
ripple—solid traces) and 32 coils (low
toroidal field ripple—dashed traces).
Shown are NBI power, Pt^i, Da emission
signals for 16 and 32 coil cases, volume
averaged density, («), and stored energy
from diamagnetic measurements, Wdia
[The JET Team (presented by
B.J.D. Tubbing) Plasma Physics and
Controlled Nuclear Fusion Research 1992
(Proc. 14th Int. Conf., Wurzburg, 1992)
Vol 1, 429.1.A.E.A., Vienna A993)].
(MW) 5
(lo'V^) 2
>iiJLjkiH
D„ C2 Coils)
... .M^'"<
H-modes were estabhshed at ~3 MW (Fig. 12.3.12). Energy
confinement in the former case was substantially less than in the latter and was
barely improved over L-mode confinement.
Divertor studies and plasma-surface interactions
Much experience on the relative merits of graphite and beryllium as
power-handling and plasma-facing materials has been acquired. In the
original JET configuration, both the materials and the design of the
limiters and X-point targets were varied to investigate the optimum
combination for power handling and impurity control. Beryllium was
first introduced into JET as a getter material, with layers of ~100A
being applied by overnight evaporation. Previously, Zgff in plasmas
using carbon limiters reached values of 2-3 after conditioning by
prolonged operation andHe glow discharge cleaning (Fig. 12.3.13), with the
principal impurities being carbon, oxygen, and nickel. Beryllium getter-
ing led to a reduction in Zgff to ~1.5. This resulted from a temporary
reduction of the plasma carbon content and a long-lived reduction of the
oxygen concentration, which fell by more than an order of magnitude and
became almost negligible. The lower oxygen level was beneficial both
in decreasing the radiative losses from the plasma and in reducing the
sputtering of carbon and nickel. An enduring benefit of beryllium
evaporation was that recovery from disruptions was more rapid and specific
disruption recovery pulses were rarely required.
The use of beryllium metal as either a limiter or divertor target material
led both to a sustained reduction in the level of carbon and in Zgff

Fig. 12.3.13 Zeft as a function of
density for ohmic discharges using either
graphite or beryllium limiters [from The
JET Team (presented by K.J. Dietz)
Plasma Physics and Controlled Fusion 32,
837 A990)].
n Graphite
A Beryllium
/ 5
Line average density (lo'^m"-')
(Fig. 12.3.13), and to a substantial increase in the density limit. Further
improvements in plasma purity were observed when the nickel Faraday
screens of the ICRF antennas were replaced with beryllium screens. This
eliminated nickel as a significant contaminant in ICRF experiments and
greatly improved the quality of ICRF H-modes. Particle control also
benefited from the efficient pumping of hydrogenic species by beryllium.
Recycling from graphite surfaces could be reduced by plasma
conditioning in helium, but this was effective for only a few pulses. With beryllium
evaporation, equally good pumping rates could be obtained which lasted
for a day's operation. The use of beryllium metal greatly increased this
effect, so that recycling, as determined from the global particle
confinement time, r* decreased by a factor of several and the particle pump-out
time fell to 1-2 s. Note that r* = rp/(l-7?.), where tp is the plasma
particle confinement time in the absence of recycling and 71 is the recycling
coefficient. Overall, the use of beryllium had a major impact on plasma
operation, allowing ready access to a wider range of plasma regimes, at
both the highest and lowest densities, than previously attainable.
Whereas graphite and carbon fibre surfaces sublime at temperatures
in the range 1500-2700 °C, a phenomenon often manifested in the form
of a carbon bloom in experiments at the highest heating power,
beryllium melts at the rather low temperature of 1270 °C. It is essential to
avoid melting in order to minimize impurity influxes and to avoid surface
damage. Since surface melting of beryllium and sublimation of carbon
are exacerbated by high power fluxes on tile edges exposed by
mechanical misalignments, considerable efforts have been expended, both in the
original JET configuration and in the several pumped divertor
configurations, to improve the alignment of power-handling surfaces to shield
tile edges from direct exposure to plasma. By this means, by
exploiting the possibility of sweeping the plasma strike points radially in the
pumped divertor and by optimizing the exhaust of power via impurity

12.3 JET 635
radiation, as discussed below, it was possible to establish plasmas into
which ~ 150 MJ of energy were injected without overheating of the power
handling surfaces.
Detailed measurements of power deposition at the divertor target strike
points in lower density L- and H-mode plasmas revealed asymmetries in
the power distribution which were affected by the direction of the toroidal
magnetic field. This is believed to be related to the change in direction
of the ion V5 drift relative to the divertor target. When the ion V5
drift was towards the target, the peak power on the outer strike zone
was approximately double that on the inner strike zone, while reversal of
the toroidal field resulted in an almost symmetric distribution of power.
This variation was exploited in high performance plasmas to increase
the duration of the additional heating phase which preceded the carbon
bloom.
Retention of hydrogen isotopes in first wall materials was highlighted
as a key issue for the routine operation of fusion reactors by
measurements in TFTR and JET which showed that a non-negligible fraction of
the tritium mtroduced into the torus in the course of D-T experiments
remained even after the extensive application of 'clean-up' techniques,
such as hydrogen and deuterium operation, and exposure to air In JET
D-T experiments approximately 40% of the tritium introduced was
initially retained, although clean-up procedures ultimately reduced this level
to ~ 10% D g out of 35 g). A significant fraction of the remaining tritium
was effectively trapped in 'codeposited' layers of carbon and hydrogen
isotopes which form preferentially in cool (~40°C) areas of the inner
divertor. Strong plasma flows observed in the scrape-off layer are believed
to contribute to the in/out asymmetry in codeposited layer formation. The
layers, first observed during deuterium experiments, can contain up to 0.8
atoms of deuterium per carbon atom and can form in regions remote from
plasma contact, creating difficulties for conventional wall-conditioning
techniques. Establishing methods for avoidance of their formation, or
for the subsequent removal of tritium, or the replacement of carbon by
alternative materials, is a key issue for the development of future tokamaks
designed to operate routinely in D-T.
The pumped divertor (Fig. 12.3.2) has been extensively exploited
to address many reactor relevant issues in the areas of power
handling, particle exhaust, and impurity control. The gradual modification
of the geometry towards a more 'closed' configuration, illustrated in
Fig. 12.3.2(b), has been a particular feature of the programme which
has permitted detailed studies of the relationship between divertor
geometry and divertor plasma behaviour. In L-mode plasmas, fully detached
steady-state operation, lasting ~5 s, has been sustained using deuterium
puffing. The radiated power fraction was ~70% and the peak heat flux at
the divertor target fell by an order of magnitude. Langmuir probe
measurements of the electron pressure in the scrape-off layer near the plasma
midplane and at the divertor target have confirmed that a substantial
pressure drop, of more than a factor of 10, develops along the scrape-off
layer as the plasma detaches (Fig. 12.3.14). This fall in divertor pressure

(a) High recycling (b) 'Rollover'
> = 3.7 X 10'V <n> = 5.7 x 10"r
Distance mapped to midplane (cm)
Fig. 12.3.14 Profiles of electron
temperature, Te, and electron pressure,
ritTt, as a function of distance from the
plasma separatnx mapped to the plasma
midplane. Three timeslices are shown
during an L-mode density ramp: (a) the
'high recycling' attached phase, (b) the
'rollover' as detachment is initiated close
to the separatrix; (c) the detached phase. In
each case a comparison is made between
Langmuir probe measurements made in
the SOL close to the plasma midplane and
Langmuir probe measurements at the outer
divertor target, illustrating the significant
fall in temperature at the divertor
associated with detachment, together with
the substantial pressure drop which
develops along the SOL from the midplane
to the target [from Loarte, A. et al. Nuclear
Fm«o« 38, 331A998)].
is accompanied by a substantial increase in divertor radiation and by a
displacement of the peak radiation away from the divertor target towards
the X-point.
Studies of the influence of divertor geometry on divertor plasma
behaviour have confirmed that increased closure provides some of the
expected benefits. For example, detachment is achieved more readily
in more closed divertor configurations, though with the result that the
L-mode density limit can occur more abruptly. In plasmas using vertical,
rather than horizontal, targets, detachment is initiated in the vicinity of
the separatrix, as expected from analysis of the distribution of recycling
neutrals in the two cases. In addition, with increasing closure, the
divertor neutral pressure increases, leading to more efficient particle exhaust.
This is reflected in the efficient helium exhaust achieved in ELMy H-mode
plasmas: using the 'argon frosting' technique discussed in Section 12.5,
values of, tj^g/te ~ 8 have been obtained, where rj^g is the residence
time for helium in the plasma chamber. Increased divertor closure was
also found to reduce the plasma impurity content in L-mode plasmas when
the influence of surface temperature on the chemical sputtering of carbon
was properly corrected. However, there was no evidence of a significant
difference in H-mode plasmas, possibly as a result of the additional
contribution to main chamber impurity production associated with ELMs.
A specific effect of geometry was identified in the Mark IIGB divertor,
where the presence of a septum separating the inner and outer strike points
(Fig. 12.3.2(b)) allowed the use of differential gas fuelling to produce
more symmetric detachment behaviour than previously observed.
In ELMy H-modes it is possible to achieve detachment between ELMs,
but H-mode confinement cannot be maintained at the high deuterium flow
rates required to establish full detachment, and an alternative scenario has

been explored. Based on results from the TEXTOR and ASDEX Upgrade
tokamaks, a mixture of deuterium and impurity gases has been used to
raise the level of radiation in higher confinement plasmas. Nitrogen has
proved to be the most suitable impurity for JET and long, ~5 s,
'radiative divertor' plasmas with total input powers of 27 MW and radiated
power fractions of greater than 70% have been produced. In such
plasmas the conducted power is further reduced by neutral particle losses,
which can reduce the fraction of input power conducted to the target to
~10%, and lead to the development of detachment in the divertor.
Confinement in these discharges is reduced relative to that of normal ELMy
H-modes, the best examples reaching 1.5, rather than 1.9, times r™^^^''^.
Analysis of the /O*-dependence of the global confinement also suggests
a Bohm-like, rather than a gyro-Bohm-like, scaling, although a possible
influence of collisionality cannot be excluded. More seriously, nitrogen
penetrates the main plasma and, at the highest powers, Zgff ~ 3 is
typical, which is an unacceptably high value for a reactor. It is necessary,
therefore, to develop techniques for retaining impurities in the divertor
plasma.
Current drive and profile control experiments
The principal current drive techniques which have been explored are
lower hybrid waves at 3.7 GHz and bootstrap current drive. Emphasis has
been given to optimizing synergistic effects between LHCD and ICRF
waves. Detailed studies were carried out in combined LHCD and ICRF
experiments, in which currents of up to 1.5 MA were sustained with zero
loop voltage. High energy bremsstrahlung spectra from such discharges
showed that the fast electrons responsible for the current drive had a
parallel temperature of 800 keV, far above that produced in full current
drive experiments with LHCD only. Direct damping of the ICRF waves
on fast electrons generated by LHCD, either by transit time magnetic
pumping or mode conversion, was proposed as a possible mechanism
for the acceleration of electrons to such high energies. Current drive
efficiencies rose linearly with n{Te)/{5 + Zgff), reaching values of ;7cd =
0.22 X lO^^Am-^W-i, where ;7cd = Rnlcv/Ptot and Ptot = ^H +
AcRF- Increases in the coupled LHCD power subsequently allowed full
current drive at plasma currents of 3 MA.
JET ELM-free H-mode plasmas normally have a bootstrap current
fraction of up to ~30%. In a series of ICRF heated discharges at
1 MA/2.8 T, ELM-free H-modes with y6p values of up to 2 were produced
in which the calculated bootstrap current reached values of 700 ± 150 kA.
Although the duration of the ELM-free phase was only 2-3 s and the
current profile did not reach steady-state, the broadening of the
current profile under the influence of the bootstrap current was sufficient
to stabilize sawtooth oscillations. A significant aspect of these plasmas
was their high thermal confinement, ranging up to l.lr^^'^^'^, where
^IET/Dm-D(^) = 0.106/(MA)i-03i?(m)i-48p(MW)-0-^6. This regime

Fig. 12.3.15 Profiles of (a) safety factor,
(b) current density, (c) electron density,
and (d) electron pressure for a PEP
H-mode plasma. The experimental points
in (a) are deduced from the radial
localization of mhd activity, while the
curve is derived from a reconstruction of
the magnetic equilibrium The shaded area
in (b) represents the limits on the
experimental uncertainties in the
calculated bootstrap current contribution to
the total current density [Hugon, M. et al.
Nuclear Fusion 32, 33 A992)].
3
1 2
0
2.0
7(MA/m2) jQ
0.5
6
n.dO'V^) 4
2
0
1.2
Pe(lo'Pa)*^"^
0.4
n
\ (a)
- ^\^^^,,.^,^^^^^/
(b)
-^—"S^x^y^x
/^ _—-^ \^p^ x^ \
/^A ^""^
^^ V
-1^—^ \—\
/ N (d)
/ \
"__^, V ^
has parallels with experimental observations from high-y6p plasmas in
other large tokamaks, but was the first case of a bootstrap dominated
plasma without a strong central particle source.
Profile control via fuelling, heating, and current drive has become
an important tool for the control of plasma confinement. For example, in
addition to the standard L- and H-mode discharges, plasmas with reduced
central transport have been observed in both regimes. This phenomenon
was first identified in a scenario which was referred to as 'pellet enhanced
plasma', or PEP. The regime developed following deep pellet injection
during the early phase of a discharge, before the onset of sawtooth activity.
Rapid central heating created a plasma in which a raised central q value
was effectively frozen and a very peaked pressure profile with a steep
gradient at rja ~ 0.4 was produced (Fig. 12.3.15). Transport in such
discharges was distinguished from that in normal L- and H-modes by a
significant reduction in the central thermal diffusivity, with Xi
approximately 1-3 times the neoclassical value. It was suggested that this
transient change in the core transport was associated with an inversion of
the central magnetic shear, which was observed via polarimetric
measurements of the ^-profile and from observations of the radial distribution of
mhd modes. This inversion was consistent with the high bootstrap current
density in the vicinity of the steep pressure gradient shown in the figure.
The PEP regime is recognized as the first indication that plasmas with
flat or inverted central shear can exhibit reduced transport in the central

12.3 JET
639
region, although later analysis in TFTR and DIII-D showed that
additional factors, such as the development of radial electric field shear, appear
implicated. Wide ranging studies of the properties of plasmas having low
or reversed central shear and internal transport barriers have been
undertaken in all major tokamaks. In JET, successor regimes to PEP scenarios
were initially developed by using rapid heating during the current rise, as
in TFTR and DIII-D, but latterly LHCD has been used to provide reliable
access to a greater range of ^-profiles in the plasma core. Plasmas with
reduced ion and electron thermal transport and reduced particle transport
in the central 'optimized shear' region can then be analysed
systematically. These experiments have confirmed the fundamental properties of
ITB regimes reported from other devices, including the suppression of
turbulence associated with the reduced transport at the onset of the
transport barrier and the accumulation of high-Z impurities in the plasma core,
though the JET results have also highlighted the fact that the formation
of an internal transport barrier is often associated with the presence of a
low order rational ^-surface at the foot of the barrier. As in other
tokamaks, these studies often deal with 'double barrier' plasmas, in which
the internal transport barrier is combined with the H-mode edge transport
barrier to optimize confinement and stability properties: a specific goal
of the JET experiments has been the exploitation of the improved core
confinement to optimize fusion performance, as discussed later.
In the course of experiments to establish target current profiles having
reversed central shear, it was observed that, under some circumstances,
the central current density could fall to zero in the plasma centre
(Fig. 12.3.16). This 'current hole' occurred in plasmas in which off-axis
LHCD was applied to assist the formation of a negative shear region
during the current ramp. Motional Stark effect measurements of the poloidal
field pitch angle showed that it fell to zero over the central region of the
plasma and the reconstructed current profile was found to be zero, within
Fig. 12.3.16 Radial profiles of: (a)
plasma current density, J, reconstructed
from MSE measurements, (b) the resultmg
safety factor, q. The data illustrate the
formation of a region of zero current
density in the centre of a discharge in
which off-axis LHCD was used during the
current ramp to establish a central region
of reversed shear [from Hawkes, N.C.
etal. Physical Review Letters 87, 115001
B001)].

measurement errors, over a region with a radius of up to 20 cm. The
current hole is explained in terms of the response of the parallel electric field
to the strong off-axis current drive produced by the LHCD, which causes
a reversal of the electric field in the plasma core. Since the phenomenon
persists for several seconds, due to the long current diffusion time in the
hot central region, this could, in principle, lead to a reversal of the
central current density. However, no reversal has been observed and it has
been proposed that the growth of m = 1/n = 0 resistive mhd modes in
the region of zero poloidal field could cause a redistribution of current,
preventing a reversed current region developing.
Enhancements in current drive capability, particularly through
improved coupling of the LH system, together with improvements in
systems for active feedback control of plasma parameters, have allowed
the optimized shear scenario to be developed towards the ultimate goal of
establishing steady-state tokamak operation. Identification of a reliable
means of controlling the formation and location of internal transport
barriers has also made a significant contribution. On the basis of theories of
microturbulence, a local dimensionless Larmor radius, pr* = Ps/Lj,
where ps = Cs/coa is the Larmor radius at the sound speed and
Lj = T/{AT/AR) is the temperature gradient scale length, with Cj
the sound speed and Wci the ion cyclotron frequency, has been defined.
An experimental criterion, pre* > 1-4 x 10""^, has subsequently been
established as a reliable measure for the existence of a transport barrier in
the (electron) temperature profile in JET, and it has been experimentally
verified that it is possible to control the location of an internal transport
barrier in real-time by acting on the auxiliary heating systems. In
experiments where LHCD is also used in a preprogrammed mode to delay the
relaxation of the reversed shear profile, with ICRF feedback control of
the transport barrier temperature gradient and NBI feedback control of
the neutron yield, it has been possible to maintain a quasi-stationary ITB
scenario for periods of up to 11 s, a significant fraction of the global
current diffusion timescale and a duration limited by hardware constraints.
Fully non-inductive current drive has been sustained for several seconds
in such discharges, with significant contributions from bootstrap, lower
hybrid, and neutral beam currents.
High performance plasmas and deuterium-tritium experiments
Before the introduction of tritium into tokamak plasmas, the highest
fusion power output was obtained not from D-D reactions, but from
D—He^ reactions. In deuterium plasmas with a small, ~5%,
concentration of He^ minority, ICRF can accelerate minority ions to energies in the
MeV range, greatly enhancing the cross-section for the D—He^ reaction
above that of a thermal plasma. Although the products of this reaction
are charged particles, the fusion power can be determined by
measurements of y-ray emission from the very weak D(He^, y)Li^ branch of the
reaction. In L-mode experiments in which up to 15 MW of ICRF power

Fig. 12.3.17 The time development of
the central electron and ion temperatures,
Te and f,, the volume averaged electron
density, {n}, the line-averaged Zeff, the
plasma diamagnetic energy, Wdia, the D„
emission, the total neutron rate, the NBI
power, flviB, and the radiated power, Prad,
for the deuterium pulse with the highest
fusion triple product [The JET Team
Nuclear Fusion 32, 187 A992)].
(keV) 10
was coupled to the plasma, a peak fusion power of 140 kW was reached,
corresponding to a reaction rate of 4.8 x 10^^ s~^. It is unlikely that this
reaction can be exploited for net power production in the near term, but the
experiment provided an important test of many aspects of RF absorption
and fast particle confinement.
JET high performance plasmas may be classified into two separate
regimes, broadly characterized as hot ion H-mode and optimized shear.
Hot ion H-modes are established by using high power NBI in low density
target plasmas, with (n) < 2 x 10^^ m~^. A well-conditioned torus is
essential and this is usually produced by overnight beryllium
evaporation. These H-modes can exhibit thermal confinement times up to twice
those calculated from the JET/DIII-D scaling and have attained fusion
triple product values of ~9 x 10^° keV sm~^, corresponding to Qdt ^ 1
in a plasma with an optimum mixture of deuterium and tritium. The
principal characteristics of the hot ion H-mode (Fig. 12.3.17) include
the development of centrally peaked ion and electron temperatures, with
ri@) ~ 20-30keV and TeCO) ~ 10-15 keV. While the density profile
is more peaked than in normal JET H-modes, it is not as peaked as in
TFTR supershots. As noted previously, confinement improves suddenly
over the outer half of the plasma at the H-mode transition. Following this,
the ion thermal conductivity falls across the entire plasma cross-section,
a condition which persists for 1-2 s. This regime resembles the VH-mode
of DIII-D, which is described in Section 12.5.
The physics underlying the termination of the high performance phase
of the hot ion H-mode is not fully understood, but the several key features
are recognized. Initial hot ion H-mode experiments were limited by the

occurrence of a carbon bloom, sometimes linked to mhd events, as in
TFTR supershots. The resultant influx of impurities, coupled with the
rise in core transport, prevented any recovery in plasma performance and
confused the analysis of the core behaviour. Following the development
of improved power handling surfaces, in particular the installation of
the pumped divertor, the behaviour became more complex. It was then
recognized that the termination is usually triggered by mhd events such
as an ELM, a sawtooth collapse plus an ELM, or the growth of an 'outer
mode', which is typically an n = 1 external kink mode. However, the link
between this mhd activity and the subsequent reduction in confinement,
which can also be accompanied by a rise in the plasma impurity content
and which leads to a substantial fall in neutron emission, remains unclear.
By injecting high power neutral beams into a low density optimized
shear plasma, (n) ~2 x lO^^m"^, a strong ion transport barrier can
be formed and many of the characteristics of the hot ion H-mode can
be reproduced, with central ion temperatures reaching values as high
as 40keV and central electron temperatures of up to 15keV. These
discharges generally evolve through an initial L-mode to an H-mode phase,
which improves the plasma stability by reducing the peaking of the
pressure profile and allows higher values of y^N to be achieved. Values of the
fusion triple product of up to 11 x 10^° keV sm~^ have been attained by
this approach. As with all high performance regimes, the high
confinement decays on a timescale of 1-2 s, often due to mhd activity, the most
virulent form being a global n = 1 pressure driven kink having a growth
time as short as 200 /iS, which typically causes a disruption.
The projection that the best H-mode plasmas could achieve effective
breakeven, as defined in Section 12.1, in a 50:50 D-T mixture prompted
a short series of experiments in late 1991 in which tritium concentrations
of up to 11% were used. This preliminary tritium experiment, or PTE,
which involved the introduction of significant amounts of tritium into a
tokamak for the first time, was intended to test the accuracy of
extrapolations from D-D to D-T fusion yield, to produce in excess of 1 MW
of D-T fusion power and to demonstrate the safe and reliable operation
of tritium handling systems. Tritium was introduced into the discharges
using two neutral beam sources capable of injecting tritium at 78 keV,
providing a total of 1.5 MW of injected power. In addition, the sources
could be adapted for trace injection studies with 1% tritium in deuterium.
The target discharge used for the PTE was a typical hot ion H-mode, a
3 MA/2.8 T single null X-point plasma, with the ion V5 drift away from
the divertor target to exploit the superior power-handling capability of this
arrangement. A series of trace experiments was carried out to establish
a suitable discharge and to investigate tritium diffusion, but, in order to
limit activation of the torus, only two high power pulses were performed.
These two discharges, at 15 MW of NBI power and a tritium
concentration of 11%, achieved very similar fusion yields, with a peak 14MeV
neutron production rate of 6 x 10^^ s""^ corresponding to a peak power
of 1.7 MW and a fusion triple product of 3.8 x 10^° keV sm"l A total
fusion energy of 2 MJ was released in each pulse. The plasmas resembled

12.3 JET 643
deuterium hot ion H-modes, and there was no evidence that the tritium
or a-particle populations affected their behaviour.
A more extensive and ambitious series of D-T experiments, referred
to as DTEl, was performed in the Mark HA divertor configuration in
1997 with the aims of exploring plasma characteristics over a range of
D-T mixtures, extending fusion power production at optimized D: T
ratios, that is close to 50: 50, studying the influence of a-particles on
plasma behaviour, investigating plasma-wall interaction issues in D-T,
including in-vessel tritium retention, and demonstrating the technology
of tritium injection, extraction, and processing. Nevertheless, to allow
subsequent modifications of the device, the total neutron yield was limited
to 2.5 X 10^° neutrons.
The highest fusion power of 16.1 MW was obtained in a 4 MA/3.6T
hot ion H-mode plasma heated by 22.3 MW of mixed deuterium and
tritium NBI and 3.1 MW of H-minority ICRF heating. This pulse reached
an instantaneous Qdj of 0.62, without allowance for plasma
transients or the power losses due to beam shine-through, with 60% of the
fusion power produced by the thermal plasma, the remainder arising
from beam-plasma reactions. The plasma achieved nD+T@)ri@)rE =
8.7 X 10^°keVsm~^ and a total stored energy of 17 MJ, the highest of
any experiment to date. As illustrated in Fig. 2.3.18, the high fusion
performance phase lasted for ~1.5 s, the duration being limited by similar
phenomena to those discussed previously. In optimized shear
experiments, although a higher value of no+T @O1@) re = 11 x 10^° keV sm~^
was attained in a 3.2 MA/3.45 T plasma, the maximum fusion power
produced was 8.2 MW, with the high performance phase again lasting ~ 1.5 s
(Fig. 12.3.18). The lower fusion power reflects the lack of optimization
of this regime in D-T mixtures: the detailed time evolution of the current
profile and the time at which an L to H transition occurs is found to have a
significant influence on the performance of such plasmas, and the limited
neutron budget available during the DTEl experiments did not allow this
scenario to be re-optimized to accommodate the influence of the different
isotopic mixture in D-T plasmas.
Exploration of fusion performance and plasma behaviour under quasi-
steady-state conditions was performed in a series of ELMy H-mode
experiments. As discussed previously, comparative studies in hydrogen
and in D-T mixtures, ranging from 100% deuterium to 90% tritium,
allowed the influence of isotopic mass on the H-mode threshold and
energy confinement to be addressed. Additional information on local
transport processes came from tritium puffing experiments, similar
to those performed in TFTR, which showed that in ELMy H-modes
the tritium particle diffusivity appeared to follow a gyro-Bohm
scaling. Experimental uncertainties prevented an unambiguous distinction
between Bohm and gyro-Bohm scaling in L-mode plasmas.
High fusion power was demonstrated in a 3.8 MA/3.8 T ELMy
H-mode with an input power of 23 MW in which ~4 MW of fusion power
was produced for 4s (Fig. 12.3.18), with goT = 0.18 for 3.5 s. This
pulse, in which approximately 30% of the fusion power was of thermal

Fig. 12.3.18 Companson of the
maximum fusion power achieved in
various plasma scenarios during the major
D-T experimental campaigns performed to
date. The 1991 JET expenments (PTE)
used only 11 % tritium while the remaining
experiments employed approximately
50:50 D-T mixtures. The JET ELMy
H-mode plasma produced the highest
fusion energy of any pulse [Keilhacker, M.
et al. Plasma Physics and Controlled
Fm«ot 41,61A999)].
A JET
/ jA997)
/ I
/ j ELM-free
/ I H-mode
' \y Optimised
/ , /[ shear mode
k \
If \ JET
/ M , A A997)
■v_.,^.....Y/.-----A..-J\jA--v------ •••—'^
// \\ ELMy \
//
\
origin, yielded the largest integrated fusion energy of 22 MJ. A somewhat
higher goj of 0.22 was achieved in a similar 3.8 MA/3.8 T plasma using
a 9:91 D-T mixture and only 6 MW of ICRF D-minority heating to
produce 1.5 MW of fusion power for several seconds. Acceleration of the
deuterium minority tail to average energies of 120keV implied that the
majority of the fusion reactions in this scenario were of non-thermal
origin. Nevertheless, both of these plasmas were distinguished from the hot
ion H-mode and optimized shear experiments by having durations limited
only by constraints based on the permitted neutron production, rather than
plasma instabilities, and by having T{{G) ^ re@)(~7-8keV), which is
a regime of more relevance to fusion reactors. Additional ICRF heating
scenarios which are also considered relevant to ITER and which were
successfully demonstrated included second harmonic tritium heating and
ion heating via ICRF coupling to a He^ minority at the 5-10% level. In
the latter case ri@) = 13keV and TeCO) = 12keV were sustained for
several seconds with ~8 MW of ICRF heating.
As in the TFTR D-T experiments, the investigation of a-particle
effects was a key aspect of the JET studies. No evidence was found for
Alfven eigenmodes excited by a-particles in any of the standard plasma
regimes analysed. This was in agreement with analysis using numerical
codes, which identified a variety of stabilization mechanisms contributing
to the suppression of AE modes and concluded that the a-particle
pressure in the JET experiments was insufficient to overcome the damping
processes. Clear evidence of electron heating by a-particles was obtained
from a series of hot ion H-modes in which the tritium concentration was
varied between 0 and 92%, involving careful control of the gas, neutral
beam injection, and recycling fuelling of the plasma. While the thermal

12.4 JT-60/JT-60U
Fig. 12.3.19 Central electron
temperature, 7^@), as a function of
a-particle power, Pa, in a series of D-T
hot ion H-modes in which the tritium
concentration was varied between 0 and
92%, as indicated by the figures in
brackets. The bars indicate the shortfall in
NBI power relative to the nominal value of
10.6MW and the open diamonds indicate
the results of two pure deuterium pulses in
which ICRF minority heating was used to
simulate the effect of a-particle heating
[The JET Team (presented by P.R.
Thomas) Fusion Energy 1998 (Proc. 17th
Int. Conf., Yokohama, 1998) Vol 1, 265.
I.A.E.A., Vienna A999)].
Te@)
(keV)
■ D-T Pulse
OICRH
-
F0%)
< 0
G5%)r--H 1 E0%)
/\
■
(92%)
@%)
1 1
energy confinement time was found to depend only weakly on the iso-
topic mixture, a clear maximum in both the stored (thermal and total)
plasma energy and central electron temperature was observed at a tritium
concentration of 50-60% (Fig. 12.3.19), where the fusion power was
maximized. A regression fit to the experimental dataset yielded a change
of Are(O) = 1.3 ± 0.23keV in response to the increase in a-particle
heating power of 1.3 MW. Moreover, comparison of the observed
increment in the rate of increase of energy density during the highest fusion
power pulse with the expected rate of electron heating due to a-particles
supported the conclusion that a-particles were confined and slowed down
classically.
JT-60/JT-60U—Japan Atomic Energy Research
Institute, Naka, Japan
JT-60, in which the first plasma was obtained in April 1985, differed from
other large devices in having a triplet of internal coils which formed an
enclosed divertor chamber situated on the large major radius side of the
plasma. In its original form, 3.2 MA was achieved in limiter discharges,
and the maximum toroidal field was 4.8 T. The vacuum vessel was
fabricated from inconel and the plasma-facing components consisted initially
of molybdenum coated with 20 /zm of titanium carbide. Later the
molybdenum was replaced by graphite tiles to reduce metallic influxes. The

12.4 JT-60/JT-60U
Fig. 12.4.1 Comparison of the final
layout of the JT-60 tokamak (left hand
side) with the JT-60U (Upgrade) geometry.
Note the original triplet of divertor coils at
the large major radius side of JT-60 [from
JT-60 Team (presented by M. Nagami)
Plasma Physics and Controlled Nuclear
Fusion Research 1990 (Proc. 13th Int.
Conf., Washington, 1990) Vol 1, 53
I.A.E.A., Vienna A991)].
tokamak was equipped with a high power, long pulse heating
capability consisting of 22MW of hydrogen neutral beam injection, 15 MW of
lower hybrid current drive operating in the range 1.74—2.23 GHz, and
6MW of ion cyclotron radiofrequency power in the frequency range
110-130 MHz. Each system had a design pulse length of 10 s.
It was found that this configuration did not allow H-mode operation,
and the poloidal circuit was modified in early 1988 to permit the formation
of an X-point in the bottom of the vacuum vessel, as shown on the left-
hand side of Fig. 12.4.1. This constituted an interim step in a much more
extensive modification of the tokamak, which began in late 1989. The
vacuum vessel was replaced, eliminating the original divertor, and the
poloidal circuit was extensively upgraded within the existing toroidal
field coil set. Fig. 12.4.1 compares the final JT-60 configuration with
the upgraded JT-60U geometry, and Fig. 12.4.2 shows an overview of
the JT-60U device, which began operation in March 1991. As discussed
later, a pumped 'W-shaped' divertor was installed in 1997 to enhance the
capability for power and particle control studies.
JT-60U has a substantially larger plasma volume than JT-60 and has
produced single null X-point plasmas with currents of up to 5 MA. In
addition, it is capable of deuterium operation, whereas the previous device
was limited to hydrogen and helium plasmas. The first wall is completely
lined with graphite, with carbon fibre tiles in the divertor region. While
the basic neutral beam geometry is unchanged from JT-60, several neutral
beam lines were re-oriented to provide more tangential injection, and the
use of deuterium raised the installed neutral beam injection power to
40 MW at 120 keV injection energy. Following the assignment of three
neutral beam ports to pumping for the W-shaped divertor, the power from
the positive ion based system was reduced to 28 MW, but in 1996 the
neutral beam capability was significantly upgraded with the installation
of the first operational negative ion based NBI (N-NBI) system. This is

12.4 JT-60/JT-60U
Mechanical support structure
Fig 12.4.2 Layout of the JT-60U expenment
designed to provide 10 MW of power at 500 keV for 10 s, though this
level of performance has not yet been achieved. Improvements have also
been made to the lower hybnd and ion cyclotron RF systems, but the
power delivered to the plasma is similar to that in JT-60. The most recent
upgrade to the auxiliary heating involves the installation of four gyrotron
sources for electron cyclotron resonance heating and current dnve This
system can provide up to 3 MW of power at 110 GHz for several seconds.
Heating and confinement in JT-60
The heating capability of JT-60 allowed a variety of confinement regimes
to be investigated. With certain exceptions discussed below, energy
confinement was generally found to be close to L-mode, although an offset
linear dependence on power gave a better descnption of the relationship
between stored energy and power than the conventional L-mode P^l'^

12.4 JT-60/JT-60U
Fig. 12.4.3 Overview of a limiter
H-mode induced by LHCD Shown are the
LH power, Put, the diamagnetic
measurement of the plasma stored energy,
Wdia, and the Ha emission [from Tsuji, S.
et al. Physical Review Letters 64, 1023
A990)]
variation No significant differences in energy confinement were found
between the three configurations studied, that is limiter, outer X-point and
lower X-point, though the volume of lower X-point plasmas was
approximately 40% smaller than that of the other two configurations. At neutral
beam powers above 18 MW, short H-mode penods, as indicated by a fall in
the edge Ha signal, occurred in both outer and lower X-point plasmas, but
their duration did not exceed 200 ms and the confinement was only 10%
better than L-mode scaling. In lower X-point plasmas enhanced
confinement appeared at injected powers above 15 MW. This regime was
characterized by an increase in recycling in the divertor, associated with the
formation of a radiating divertor, and led to an improvement of up to 30%
in energy confinement relative to equivalent L-mode X-point discharges.
The clearest demonstration of H-mode behaviour was obtained in
limiter plasmas using lower hybnd current dnve (Fig. 12.4.3). This
scenario was optimized at input powers above 1.2 MW when two RF
frequencies were applied simultaneously. A minimum threshold density
of n ~ 2 X 10^^ m~^ was also required ELM-free H-modes of up to
3.3 s duration were produced, with an energy confinement enhancement
of ~30% relative to equivalent L-mode plasmas, due primarily to the
density nse following the L to H transition This regime exhibited
features common to H-modes in X-point plasmas in other tokamaks, mainly
a fall in Ha light, a fall in edge density fluctuations, and an improvement
in particle confinement. Surpnsingly, H-modes could not be established
in X-point plasmas using this technique. It was proposed that the limiter
H-mode might have been tnggered by an electric field gradient resulting
from losses of fast electrons.
Conventional H-modes proved elusive in JT-60, but enhanced
confinement was achieved in neutral beam heating experiments at high-y6p in
which a centrally peaked hot ion plasma was produced. In these lower null
X-point plasmas, helium conditioning was exploited to permit operation
at low target density, n ~ 0.5 x 10^^ m~^. High power neutral beam
injection, at the 20 MW level, was used to form centrally peaked profiles in
plasmas at currents of up to 1.2 MA. Optimum performance was found in
the region of 0.7 MA, where ^cyi ~ 10, sawteeth were absent, and very

12.4 JT-60/JT-60U 649
peaked ion temperature profiles, Ti{0)/{Ti) ~ 3.5, and electron density
profiles, n{0)/{n) ~ 2.5, were formed. Such discharges attained y6p ~ 3
and £y6p ~ 0.7, and energy confinement times were up to 60% above
those predicted by Goldston L-mode scaling. Improved confinement was
also observed in the course of pellet injection into neutral beam heated
limiter plasmas, where increases of 40% in energy confinement time over
equivalent gas-fuelled discharges were obtained. A sequence of pellets
was injected into plasmas at up to 3 MA to form very peaked density
profiles, n@)/{n) ~ 3, with central densities of up to 2 7 x 10^° m'^
and central plasma pressures of up to 2 x 10^ Pa
Divertor studies
In JT-60 expenments with the outer divertor chamber, low levels of
oxygen contamination were observed. This allowed operation with low values
of Zeff, ~l-2, and of bulk plasma radiation, which was ~10% of the
input power, even at heating powers in the region of 20 MW.
Nevertheless, molybdenum influxes degraded plasma performance, in spite of TiC
coatings on the molybdenum divertor targets and limiter surfaces This
necessitated a change to graphite divertor targets and first wall
components. In addition, the difficulty of achieving H-mode confinement with the
outer divertor prompted the development of a more conventional
configuration with an open divertor at the bottom of the main plasma chamber
In plasmas using this arrangement Zeff was usually greater than 4, with
carbon and oxygen as the dominant impurities and bulk plasma radiation
accounting for at least 20% of the input power.
Two specific observations made in JT-60 have particular relevance to
divertor physics Firstly, it was noted that during neutral beam heating
experiments at powers above 15 MW, a highly radiating region developed
in the divertor with n^, div ~ 1 x 10^° m'^ and re,div ~ 20 eV. This was
termed 'remote radiative cooling'. Simultaneously, bulk plasma energy
confinement improved by up to 30% relative to standard L-modes The
second observation relates to helium exhaust measurements made using
a 30keV helium beam In experiments with 10 MW of neutral beam
injection, the neutral pressures of hydrogen and helium in the divertor
region rose as n^ Moreover, the enrichment factor for helium, defined
as ^7 = (pHe/2pH2)div/('JHe/'Je)ph where 'div' refers to pressure
measurements in the divertor and 'pi' to density measurements in the plasma,
increased with density, reaching 0 5 at the highest densities. Although the
plasma conditions for these experiments differed from those expected in
a power plant plasma, these results suggested that helium ash can be
removed efficiently from the divertor in a fusion reactor.
In JT-60U, the care taken in the alignment of the divertor target tiles
to avoid exposure of tile edges has provided the experiment with a target
capable of accepting high heat loads Total energies of up to 200 MJ have
been deposited into the plasma with no evidence of tile overheating. In
addition to boronization, which is used to reduce recycling, individual

12.4 JT-60/JT-60U
Fig 12.4.4 Vanation of (a) radiated
power fraction from the divertor,
Prad,div//'net, and (b) confinement
enhancement factor relative to ITER89-P
scakng, rE/riTER89P, as a function of the
total recycling flux in the divertor, O^.
Open circles represent discharges without
gas puffing, while solid circles and open
tnangles correspond to discharges with gas
puffing [Asakura, N et al Plasma Physics
and Controlled Nuclear Fusion Research
1994 (Ptoc 15th Int Conf, Seville, 1994)
Vol 1,515 IAEA., Vienna A995)]
rows of carbon fibre tiles coated with up to 300 /zm of B4C have been
mstalled to investigate the effect of such treatment on plasma
performance. Most significantly, this reduced oxygen concentrations to < 1 % in
high power heating expenments.
The feasibility of combining radiative cooling in the divertor with
enhanced confinement plasmas has also been addressed. In ELMy
H-modes the deuterium fuelling rate required to achieve a substantial
radiated power fraction produces an order of magnitude increase in divertor
recycling compared to standard, low radiation, ELMy H-modes.
Furthermore, as the divertor recycling flux rises, the confinement enhancement
factor decreases, until the plasma exhibits L-mode confinement when the
divertor radiated power fraction is '^50% of the input power (Fig. 12.4.4).
This confirms the conclusion drawn from experiments in several tokamaks
that it is difficult to maintain confinement much above L-mode levels in
the presence of strong deuterium recycling fluxes.
Power and particle control capabilities were further enhanced in 1997
with the installation of the W-shaped divertor (Fig. 12.4.5). This semi-
closed configuration allows operation up to 3 MA/4 T and has an installed
pumping speed for deuterium of 16m^s~^ via inboard and outboard
pumping slots which feed three cryopumping ports previously used by
the neutral beam system. Initial experiments with the new configuration
showed that the plasma impurity content could be reduced to values of
Zeff ~ 2 when the plasma was established with the inboard separatrix
~2 cm from the pumping slot and gas puffing in the main chamber was
employed. In addition, the improved closure reduced the backflow of
neutrals to the main chamber, so that the main chamber recycling flux

12.4 JT-60/JT-60U
Fig. 12.4.5 Poloidal cross-section of the
lower part of the JT-60U torus showing the
main elements of the W-shaped divertor
An outboard pumping slot was
subsequently added to the divertor dome
[Ishida, S et al Fusion Energy 1998
(Proc. 17th Int Conf., Yokohama, 1998)
Vol 1,1 IAEA,ViennaA999)]
.^ imping p( ^
'^*=%^,^^ ITryopumps
^=5j/A000m'/s/port)
could typically be reduced by a factor of 2-3 relative to that in
equivalent conditions in the earlier, open, configuration. It was suggested that
these improvements have been responsible for the measured reduction
of ~30% in the H-mode power threshold relative to plasmas in the
original configuration. However, as in several other experiments, the reduced
main chamber recycling was found to have no impact on the confinement
quality of ELMy H-modes.
Studies of techniques for the efficient dissipation of exhaust power
while maintaining high confinement have been continued in the new
configuration. As in other medium to large tokamaks, impurity seeding with
various noble gases has yielded the most promising results. The range
of densities over which good confinement can be maintained in ELMy
H-mode plasmas has been extended by combined deuterium and argon
puffing. In high triangularity plasmas, 8x = 0.5, radiated power fractions
of ~80% have been achieved while maintaining te ~ tg ^ at
densities of 65% of the Greenwald value. In these discharges, the pulsed heat
load on the divertor due to ELMs was also considerably reduced.
However, the Zeff rose to values of ~4, so that techniques must be developed
to reduce impurity contamination of the main plasma.
Helium exhaust studies in JT-60U have focussed on ELMy H-mode
and internal transport barrier experiments. Following the installation of
the W-shaped divertor, systematic analysis of helium exhaust became
possible by using argon frosting of the cryopumps (see Section 12.5).
Experiments in which a 60keV He beam was injected for several
seconds, that is periods considerably longer than the vessel residence time
of helium, showed that in ELMy H-modes values of t^Jte ~ 4 could be
achieved using only inboard pumping (Fig. 12.4.6), with the core helium
concentration maintained in steady-state at ~4%. In addition, the helium
enrichment factor was found to be of order unity, significantly higher
than in JT-60 experiments. When the ion V5 drift was reversed, the
normal enhancement in recycling at the inner strike point relative to the outer
stnke point was reversed, the helium exhaust efficiency fell and the plasma
helium concentration increased by a factor of ~3 With the addition of an
outboard pumping slot to the divertor, the helium exhaust efficiency was
further improved and tj^g/tE ~ 3 has been achieved. Helium exhaust
measurements in discharges with an internal transport barrier revealed
that the helium diffusion coefficient was reduced inside the transport

12.4 JT-60/JT-60U
Fig. 12.4.6 Values of helium residence
time normalized to energy confinement
time, r^g/TE, as a function of plasma
density, h^, for vanous plasma conditions,
using inboard pumping only [Sakasai, A
et al Fusion Energy 1998 (Proc 17th Int
Conf, Yokohama, 1998) paper
IAEA-CN-69/EX6/5 LA E A , Vienna
B001)]
barrier and, as a result, helium was exhausted more slowly. Values of
rj^g/tE ~ 15 were obtained in ITB plasmas with high confinement,
tE ~ 2r™^^^"^, and although reactor-relevant values of rj|g/rE(<10)
could be obtained by gas puffing, which raised the divertor recycling flux
by a factor of 5-10, the energy confinement enhancement was lost, with
rE~1.2r™9-Prg3^^1ti„g
Current drive and steady-state operation
Exploration of current drive techniques, principally via lower hybrid
waves, negative-ion neutral beams and the bootstrap effect, has been a
particular concern of JT-60 and JT-60U expenments. JT-60 was equipped
with three lower hybrid launchers, two optimized for current drive and
one for heating. The maximum power input was 9.5 MW, and full
current drive was achieved at 2 MA Current drive efficiency improved when
the parallel refractive index, n||, of the waves was reduced and the
spectrum narrowed. The efficiency, r]cD (see Section 12.3), rose with electron
temperature and a maximum value of rjcD = 0.34 x 10^°m~^ AW~^
was attained A significant saving in primary flux swing was
demonstrated in current ramp experiments with lower hybnd current drive.
By injecting up to 2 MW of power dunng a 2 5 s current ramp, a flux
saving, A(/>f, of up to 2.5 Vs was obtained. This corresponded to the
resistive flux plus ~10% of the inductive flux during the current drive
pulse. By neglecting the contribution to the inductive flux and using the
known current drive efficiency, the experimental scaling, A#(Vs) =
0 55/[PLH(MW)/nA0^^m~'^)]d?, was shown to be consistent with
simple current dnve theory
It was onginally expected that current profile broadening induced by
a high n\\ wave spectrum would prove the most effective approach to

12.4 JT-60/JT-60U
Fig. 12.4.7 Companson of plasma
parameters dunng two 3 MA plasma
pulses, one with full non-inductive current
dnve usmg LHCD (daric curve) and the
other without LHCD (light curve) The
LHCD power, Pui, the plasma current, /p,
the loop voltage, Vu and the internal
inductance, C^, are shown Note that the
ohrmc input power is turned off at 6 5 s in
both pulses [from Dceda, Y et al Plasma
Physics and Controlled Nuclear Fusion
Research 1994 (Proc 15th Int Conf,
Seville, 1994) Vol 1,415 IAEA, Vienna
A995)]
10 15
suppressing sawtooth oscillations, but experiments with lower hybnd
current drive in neutral beam heated plasmas found that current drive at
low n\\ readily produced sawtooth stabilization. There was some
evidence of current profile modification from the reduction of the sawtooth
inversion radius preceding stabilization. Although this appeared
insufficient to raise q @) above unity, it could not be entirely excluded that
^ @) > 1. Alternative explanations proposed for the stabilization
mechanism included the possibility that local current profile modifications could
affect the sawtooth stability, or that the presence of energetic electrons in
the vicinity of the ^ = 1 surface could play a role in stabilizing sawtooth
oscillations.
In JT-60U experiments current drive performance has been
considerably extended using a second multi-junction launcher with a narrower
n\\ spectrum, Ann ~ 0.2. The scaling of current drive efficiency, as
well as its absolute level, is similar to that in JT-60, with full
current dnve being achieved up to 3.6 MA. Fig. 12.4.7 illustrates a case
in which lower hybrid waves drove the full plasma current at 3 MA.
High energy negative-ion neutral beams C00-500 keV/nucleon) provide
access to higher current dnve efficiencies than the positive ion based
systems conventionally used. Hydrogen N-NBI expenments at injected
energies of up to 360 keV have achieved r]cD = 0.16 x 10^° m~^ AW~^
in plasmas with T^iQi) ~ lOkeV, in agreement with theoretical
calculations and resulting in a total beam driven current of up 1 MA. Electron
cyclotron current dnve (ECCD) generates localized current dnve which
can be applied, for example, in the control of mhd instabiUties.
Measurements of the ECCD efficiencies and profiles for both on- and off-axis
current drive yielded good agreement with Fokker-Planck calculations.
The very localized nature of the current drive profile, Ar/a < 0.1, was
confirmed and r](X) = 0.05 x 10^° m~^ AW~^ was obtained at r/a = 0.2
for a local electron temperature of 7 keV.

12.4 JT-60/JT-60U
Fig. 12,4.8 Bootstrap current fraction as
a function of /?**, showing both measured
values and values denved from
neoclassical theory including the bootstrap
current contnbution [Ishida, S. et al
Plasma Physics and Controlled Nuclear
Fusion Research 1990 (Proc 13th Int
Conf, Washington, 1990) Vol 1, 195
IAEA, Vienna A991)]
As in the other large devices, regimes have been developed in which
the bootstrap current constitutes a substantial fraction of the total current
and, as already noted, such plasmas often exhibit energy confinement up
to several times the L-mode value. A detailed investigation of the high-y6p
regime in JT-60 covered the range of y6p up to 3.2 and included bootstrap
current fractions of up to 80%, giving good agreement between
theoretical estimates of the bootstrap current fraction, including fast ion effects,
and that deduced from analysis of the loop voltage (Fig. 12.4.8). Neutral
beam injection in JT-60 was almost perpendicular to the magnetic field,
so the calculation was not complicated by contributions from neutral
beam driven current, which amounted to only ~1% of the total current.
This analysis also demonstrated that the plasma resistivity in JT-60 was
neoclassical.
The extensive current dnve capabilities of the JT-60U device have
supported the development of steady-state operating regimes with full
non-inductive current drive. Two distinct plasma scenarios have been
pursued: the first is a high-y6p regime having weak positive shear with
^@) > 1 and the second is a reversed shear plasma. Both approaches
combine an ITB core plasma with an H-mode edge. In the former case,
the highest performance has been achieved at ^95 = 4.1 in a 1.8 MA/4.1T
plasma, using positive and negative-ion neutral beam injection and
electron cyclotron resonance heating, in which fully non-inductive
operation has been sustained for ~2 s, with ~50% of the current driven
by N-NBI and ~50% by the bootstrap effect. This plasma maintained
y^N = 2.3-2 5, tE '
1.3
IPB98(y,2)
and reached a fusion tnple product of
3 X 10^° keV sm~^ during the non-inductive phase. In the reversed shear
scenario, fully non-inductive current drive has been sustained for 2.5 s
with 80% of the current driven by the bootstrap effect in a 0.8 MA/3.4 T
plasma at ^95 ~ 9. Though the fusion triple product of this plasma

12.4 JT-60/JT-60U
Fig. 12.4.9 Radial profiles of plasma
parameters from a plasma with zero
current density over the region rja < 0 4
(a) plasma current density, j, (b) safety
factor, q, for which the shaded band
indicates the expenmental uncertainties,
(c) electron density, rig, (d) ion and
electron temperatures, 7, and Tg
respectively [Fujita, T et al. Physical
Review Letters 87, 245001 B001)].
0 0.2 0.4 0.6 0.8 1.0
' i*i.
la^
(c)
0 0.2 0.4 0.6 0.8 1.0
0 0.2 0 4 0.6 0.8 1.0
was a factor of 4 below that in the high-jSo case, the confinement and
IPB98(v ll
Stability parameters were nevertheless striking, with re ~ 2.2rg
y^N ~ 2 and y6p ~ 3 during the full current drive phase.
As in JET, studies of reversed shear operation have led to the
development of a regime in which a significant region of the core plasma has zero
current density (Fig. 12.4.9). In discharges at 1.35 MA with ^95 ~ 5, in
which neutral beam injection provides the major form of auxiliary
heating, the region of zero current density can extend up Xor /a = 0.4 and can
persist for many (>5) seconds, though with a gradual shrinking in radius.
Development of the current hole is driven by the growth of a strong off-
axis bootstrap current which develops in the region of steep pressure
gradient associated with an internal transport barrier. Motional Stark effect
measurements of the poloidal field indicate that q @) > 70 and that the
integrated current within r /a = 0.4 is no more than 12kA. In cases with
moderate values of ^95, the plasma remains stable to global mhd modes
throughout the duration of the current hole. As in the JET experiments,
no reversal of the central current density has been observed to date.
MHD studies
Major disruptions in JT-60U usually develop as discussed in Sections 7.8
to 7.10. As in JET, density limits, current rise instabilities, and error field
modes are frequent triggers for disruptions. Additional causes include the
occurrence of high-£i in the current ramp-down and high-y6p collapses
caused by ideal kink ballooning modes, particularly in experiments at
high fusion performance. Operation at the highest values of y^N is often
limited by disruptions and, as in other tokamaks, neoclassical tearing

12.4 JT-60/JT-60U
Fig. 12.4.10 €,-geff diagram
summarizing the general stability
properties of plasmas in JT-60U. The open
squares represent pulses which form a
locked mode at low (-i, while the closed
squares represent the disruptive boundary
at high €,. The dotted curve indicates the
approximate boundary above which
sawtooth oscillations occur, and the dashed
curve corresponds to the locus of plasmas
in quasi-steady-state [Kamada, Y. et al.
Nuclear Fusion 33, 225 A993)].
2.0
1.5
1.0
0..5
■ High / disruption
O Sawtoothing
■ ■■
:
-'^^p^g*^
1 1
•
• Sawtooth-free
□ Lx)w / locked
o o
0 .-^I^--.
§%•
□ cP
1
1 1
2 4 6
10 12 14
modes can set the ^^AmAi in long pulse operation. The L-mode density
limit was studied in JT-60 experiments which confirmed that the limit was
due to excessive radiated power and could, therefore, be characterized as
an edge density limit. Consequently, pellet injection was used to extend
the line average density by a factor of 2, with the density limit parameter,
\Q~^'^nRqcy\/B, increasing from 15 to 28 m~^ T~ ^. The behaviour at the
density limit in JT-60U is similar.
The general stability properties of JT-60U plasmas at low-y6 are
summarized in the l\ — q^n diagram shown in Fig. 12.4.10. The principal
disruption boundaries lie at low-£i, due to modes growing during the
current rise, and at high-£i, where density limit and current ramp-down
disruptions occur. Between these limits, the plane can be further
subdivided according to the presence or absence of sawtooth activity. One
subdivision, indicated by a dotted curve, marks the threshold for the
onset of sawtooth oscillations. Another, indicated by the dashed curve,
represents the locus of plasmas in quasi-steady-state, in which the current
profile is fully diffused except in the plasma centre, where it is controlled
by sawtooth oscillations.
Considerable attention has been given to the development of strategies
for the avoidance of disruptions and for reducing their impact wherever
possible. Since the major difficulties during the current rise are
associated with passing through ^eff ~ 4, this is normally crossed during the
first 200 ms by forming a small bore inner wall plasma and subsequently
expanding the plasma aperture. With this method, current ramp rates of
2MAs~^ have been achieved during ramps from 0.5 to 3.5 MA. Minor
disruptions can occur for ramp rates in excess of 1 MAs~ ^, but the plasma
survives. Similarly, current ramp-down disruptions can be avoided by
shrinking the plasma aperture to reduce l^. It is also found that in some
cases the plasma current profile can be broadened, and disruptions
prevented, during this phase by applying an external static helical field with

12.4 JT-60/JT-60U
Fig. 12.4.11 Disruptive behaviour
following the injection of a cryogenic neon
'killer' pellet (a) the plasma current, /p,
the loop voltage, Vl, and the ^JBI heating
power, P^{B, (b) hard X-ray, HXR, and
neutron yield, Y„, signals, (c) change in
power deposited on the divertor targets,
AP,5'eat [from Yoshino, R etal Plasma
Physics and Controlled Fusion 39, 313
A997)].
HXR
(a.u)
r(a)
1 ^
L
(b)
(c)
h
.njA2MW) /
pe„e,,V
\
Total Heat Flux
\_j^^^^ ]
\ 1 1
x' j
HXR (>lMeV) Y -\
1 , 1
8.32
Time (s)
principal mode numbers m = 3/n = 2. This must be used with care,
however, as application of the external field can provoke disruptions for
rg=i/a >0.3.
Infrared measurements of the heat flux to the divertor at the thermal
and current quenches have revealed that it suddenly mcreases to values
above lOOMWm"^ several hundred microseconds before the quench,
and this is followed by a rapid rise in carbon impurity emission from
the bulk plasma. In addition, the timescale for the current decay, defined
by Ip/{dlp/dt), increases as the plasma stored energy decreases, where
the energy is measured just before the quench. These observations lend
support to the idea that the fast current quench is driven by radiation
cooling of the plasma.
Experiments to mitigate the effects of disruptions have dealt with the
three key issues: the thermal quench, the generation of runaway
electrons, and the vertical instability and associated halo currents. It has
been demonstrated that the peak heat flux to the divertor plate can be
significantly reduced by the injection of cryogenic neon 'killer' pellets
before the thermal quench (Fig. 12.4.11). In studies in which one or more
neon pellets was injected into ohmic and neutral beam heated discharges,
the peak heat divertor flux during the thermal quench was reduced from
values in the range 100-300 MWm"^^ {^ 20-50 MWm"^^. Extension of
neutral beam heating through the current quench phase is also found to
be beneficial in reducing the current decay rate, though the mechanism
is not understood.
During the disruption current quench, in particular following the
injection of neon pellets, substantial currents of runaway electrons can be

12.4 JT-60/JT-60U
generated with energies extending beyond 30MeV. In some cases,
however, the runaway electrons can be suppressed by the intrinsic magnetic
fluctuations occurring during the disruption. This has been exploited by
using external saddle coils to apply a predominantly m = 3/n = 2
magnetic perturbation, with 5rC/2) < 7 x lO^'^T at the plasma centre.
This causes bursts of magnetic activity in the plasma, possibly
associated with further disruptive events, which suppress the development of
the runaway electron current. The occurrence of a rapid vertical
instability following major disruptions has also been substantially reduced by
adjusting the plasma vertical position to the 'null point' of the vacuum
vessel. It was shown that asymmetries in the eddy currents induced in
the vacuum vessel at a major disruption can contribute significantly to
an enhancement of the growth rate of the subsequent vertical
instability. By identifying the plasma position at which these asymmetries are
minimized, it has been possible to establish an optimum position, the
'null point', for plasma operation at which the likelihood of a vertical
instability following disruptions is small.
In high-y6p L-mode experiments in JT-60 and JT-60U, y6 values were
limited by rapid collapses in the plasma core. Although values of sfip as
high as 1.2 were reached in JT-60 without a collapse, the high confinement
deteriorated after several seconds due to mhd modes with m = 1,2,3. At
y^N ~ 1-1 an internal collapse, which occurred on a timescale of 100/iS
with no detectable precursor activity, degraded confinement.
Calculations suggested that the large bootstrap current fraction gave rise to a
negative shear region in the plasma centre with a minimum q value just
below 3, and it was proposed that this destabilized an ideal low-n kink
or ballooning mode which triggered the y6-limiting collapse. In JT-60U
experiments, y6 was limited by an internal collapse at values of y^N ~ 2.3.
ECE measurements of Tg showed that the collapse exhibited rapidly
growing m = odd precursor activity, with a significantly higher amplitude on
the outboard side of the plasma centre, and that this mode propagated to
the plasma centre in a time of ~200 /is. Stability analysis indicated that
low-n ideal kink ballooning modes were unstable under these conditions,
with a dominant m = 3/n = 2 mode at the ^ = l.Ssurface. In several
discharges at lower values of ^*(~4.5), where ^* = 7ia^B{\ + K^)/{iXQRI)
is a cylindrical equivalent value of ^, and k is the plasma elongation, y6p
collapses were responsible for inducing major disruptions. Similar
limitations were encountered in ITB plasmas with negative central shear and an
L-mode edge, where ^^ was limited to values of ~2 in experiments with
?min -- 2.
These problems are alleviated in H-modes due to their broader pressure
profiles. For example, in the high-y6p H-mode regime, values of y^N = 4.8
have been achieved transiently. In these cases, y6 is limited by pressure
driven modes, with n = 1-2 and m = 2-5, which grow as the current
profile broadens under the influence of the bootstrap current, leading to
a gradual degradation of confinement. The highest sustainable values of
y^N in quasi-steady-state discharges (>5rE) are lower, with y^N = 3.05
having been achieved in moderate triangularity plasmas Ex = 0.34).

12.4 JT-60/JT-60U 659
Studies of y6-limiting phenomena in JT-60U H-modes show that the global
behaviour can be understood primarily in terms of the pressure profile
peaking factor, p{0)/{p), and the plasma triangularity. At low values
of p{0)/{p), the ySN-limit is Hnked to an edge pressure limit associated
with ELMs, although neoclassical tearing modes appear at the highest
values of y6^f, while at high values of p{0)/{p) the limit is determined by
the internal y6p collapses discussed above. Higher triangularity increases
the magnetic shear at the plasma edge, improving the edge stability
and allowing access to increased values of ^^ at low pressure peaking
factor.
Further improvements in the plasma shaping capability have extended
the range of plasma triangularities up to 8x = 0.6 at 1 MA, which may
further expand the accessible range in ^t^: for example, in a 1 MA/1.8 T
high-y6p H-mode with 8x = 0.45, y^N = 2.7 was sustained for 7.4 s under
quasi-stationary conditions. In this case, the y6-limit was determined by
a neoclassical tearing mode with m = 3/n =2 which persisted for
the duration of the high-y6 phase. A capability for stabilization of such
modes by localized electron cyclotron current drive, as first demonstrated
in ASDEX Upgrade, has been successfully tested in JT-60U with the aim
of allowing access to higher values of y^N-
Confinement and fusion performance in JT-60U
L-mode confinement in JT-60U is similar to that in other tokamaks and
broadly follows the ITER89-P scaling. However, for ^eff < 5, energy
confinement in conventional L-mode plasmas falls below the ITER89-P
scaling and degrades with decreasing ^eff • Analysis suggests that this is
related to current profile variations, which can be expressed through ii and
^eff • Some of the dependence on ^eff reflects the observation that ii tends
to decrease as ^eff falls, but there is an additional contribution to
transport from the expansion of the sawtooth inversion radius with decreasing
^eff • L-mode plasmas have also been studied using ion cyclotron second
harmonic minority heating at power levels of up to 6 MW, with
similar results to those in JET first harmonic minority heating experiments.
Observations include the production of sawtooth stabilization by on-axis
heating and the destabihzation of toroidal Alfven eigenmodes by fast
minority ions. Bursts of TAE modes, leading to drops of several percent
in neutron emission, are also excited by 360 keV hydrogen ions injected
during negative-ion neutral beam heating in reversed shear plasmas.
Following boronization of the torus, H-modes have been established
at plasma currents of up to 4.5 MA with a variety of heating scenarios.
The power threshold for the L- to H-mode transition increases linearly
with toroidal field as in other tokamaks and lies close to the generally
accepted scaling. Performance in H-mode plasmas has improved with
the gradual upgrading of the poloidal field shaping capability to allow
higher triangularity operation. The observation that the nature of the ELM
behaviour changes significantly with increasing triangularity and edge
safety factor is particularly significant, since the type I ELMs normally

12.4 JT-60/JT-60U
Fig. 12.4.12 Experimentally measured
ripple loss fraction, defined as the ratio of
the ripple loss power to the neutral beam
input power, as a function of the toroidal
field ripple size on the midplane,
ASnpple/-S [Tobita, K. etal. Physical
Review Utters 69, 3060 A992)].
0.5 1.0 1.5
A^rioole/^(%)
observed are expected to cause enhanced erosion of the divertor targets
in a fusion reactor. At high-y6p (y6p > 1.6), high triangularity {8x >
0.45) and in the region ^95 > 6, complete suppression of type I ELMs
is observed and an irregular, 'grassy', behaviour, possibly associated
with type 11 ELMs, is observed. This results in a significant reduction
of the pulsed heat flux to the divertor generated by the ELMs. There
is some evidence that, as triangularity is further increased, the grassy
ELM behaviour can be obtained at ^95 ~ 4. Mhd stability analysis of the
edge indicates that the transition to the grassy ELM regime is associated
with access to the second stability regime for ballooning modes and that
the grassy ELM behaviour may be associated with the occurrence of
ideal modes with n > 10, while modes with n in the range 5-10 may be
responsible for type I ELMs. Further progress in ameliorating the divertor
heat flux during ELMy H-modes has been attained via the use of noble
gas seeding, as discussed previously. The use of inboard pellet injection,
as pioneered in ASDEX Upgrade, has allowed high confinement ELMy
H-modes to be maintained at higher densities, and re ~ r^ ^ '^^' has
been sustained at approximately 70% of the Greenwald density.
JT-60U has only 18 toroidal field coils, and so full bore plasmas
experience a large toroidal field ripple, 8B/B ~ 3%, at the plasma edge. Ripple
losses of beam injected fast ions or fusion products can, therefore, be
substantial, and this provides an opportunity for testing the theoretical
understanding of the processes involved. Controlled experiments were
performed by expanding the outside edge of the plasma into the high
ripple region and monitoring the losses of energetic particles, either by
measurements of loss power on the first wall of the torus, or by
observations of 2.4 and 14 MeV neutron emission. A linear relationship between
the fraction of injected beam ions lost in this way and the ripple at the
outer edge was derived from infrared camera measurements of the heat
flux on the outer wall of the torus (Fig. 12.4.12). Detailed calculations
using an orbit-following Monte Carlo code, which included losses due
to ripple trapping and banana drifts, yielded good agreement with the

12.4 JT-60/JT-60U 661
measured loss fractions. Additional information came from the decay of
2.4 MeV neutrons following a short beam pulse. This showed that the
discrepancy between the calculated neutron decay rate and that predicted by
classical beam slowing-down calculations increased as the plasma edge
was expanded into regions of larger toroidal field ripple, indicating a rise
in ripple induced losses with increasing ripple amplitude as expected.
In a related experiment, in which the influence of the toroidal field
ripple losses on the quality of hot ion H-mode confinement was analysed,
no correlation was observed between the magnitude of ripple losses and
the H-mode energy confinement enhancement factor after correcting for
the injected power losses caused by the ripple. In contrast, the impact
of TF ripple on fast particle confinement in reversed shear plasmas was
clearly demonstrated in an experiment which compared the bumup of
1 MeV tritons produced by D-D reactions in a plasma with ^nun = 2.1 and
^@) = 3.6 with that measured in a conventional sawtoothing plasma. As
the plasma edge was expanded into the high ripple region on the outboard
side of the torus (SB/B ~ 1%), the fraction of confined tritons fell by
more than a factor of 3 in the reversed shear case, but by only 25% in
the conventional scenario, in good agreement with calculations using the
orbit following Monte Carlo code.
The two regimes explored as potential steady-state scenarios, the
high-y6p H-mode and the reversed shear mode, have also been developed
towards high fusion performance. The former regime is similar to high
performance scenarios in other large experiments in that it is established
by high power neutral beam injection into a low density target plasma.
As in other devices, low recycling is found to be a requirement for
producing the highest performance, and the improved deuterium recycling
and impurity control properties of the W-shaped divertor have been found
to be important in this respect. Fig. 12.4.13 illustrates the evolution of
a 2.4 MA/4.3 T plasma with ^95 ^ 3 which attained the highest fusion
triple product, 1.5 x 10^^ keV sm~^, equivalent to 2dt ^ 0.4. Initially a
high-y6p regime, characterized by an internal transport barrier at typically
r/a^ 0.7, is formed. A transition to an ELM-free H-mode then occurs,
leading to an increase in the edge parameters and a further improvement
in confinement. The phase of highest fusion performance is terminated at
y^N = 2byadisruptioncausedbytherapidA0/is-lms) growthofn = 1
kink-ballooning modes. At 1.5 MA/3.7 T this regime can be sustained in
quasi-steady-state conditions for periods of between 4.5 s and 9 s with
Qjn ~ 0.16-0.11.
Central deposition of the neutral beam power in these plasmas
produces very peaked plasma profiles, resulting in T^ifi) ~ 40keV and
n@) ~ 6 X 10^^ m'^. The existence of an internal transport
barrier, identified by the formation of a steep ion temperature gradient at
r/a > 0.5 (Fig. 12.4.14), is a crucial aspect of the confinement
properties. Measurements of the ^-profile indicate that the barrier often lies
close to the ^ = 2 or ^ = 3 surface and that its location could be related to
the position at which s ~ 1. Analysis of the heat transport in the plasma
core shows that the ion and electron thermal diffusivity fall by almost

12.4 JT-60/JT-60U
Fig. 12.4.13 Overview of the high-/9p
H-mode with the highest fusion triple
product. Shown are. (a) the diamagnetic
stored energy, Wjia, the absorbed heating
power, Pabs. the neutron emission, Sn, the
edge ion temperature, 7, @ 94a), the hne
averaged electron density, he, along chords
at r/a = 0 and r/a = 0.76, the energy
confinement time, rn, the Da emission
from the divertor region, D^", and the
signal from a saddle coil system for
detecting rahd modes with n = 2; (b) the
radial ion and electron temperature
profiles, Ti and Tg respectively, at the time
of peak fusion performance [from Ishida,
S. et al. Fusion Energy 1996 (Ptoc 16th
Int. Conf, Montreal, 1996) Vol 1, 315.
I.A.E.A., Vienna A997)].
an order of magnitude on the formation of the barrier, reaching values
commensurate with the neoclassical value of the ion thermal diffusivity
in the plasma centre. The peaked profiles in this regime resemble those
of TFTR supershots, and an analysis of data from the two tokamaks has
shown that the neutron yield follows the same scaling with respect to the
absorbed power, plasma volume and peaking factor of the NBI fuelling.

12.4 JT-60/JT-60U
Fig. 12.4.14 Development of steep
gradients in the profiles of (a) ion
temperature, Ty, and (b) toroidal rotation
velocity, i;t, at the internal transport
bamer, indicated by the vertical shaded
region, in a high-/9p H-mode such as that
illustrated in Fig. 12.4.13 [Koide, Y. etal.
Plasma Physics and Controlled Nuclear
Fusion Research 1994 (Proc. 15th Int.
Conf, Seville, 1994) Vol 1, 199.1.A.E.A,
Vienna A995)].
(lO^ms-')
-
"f = 5.3 -—-^^
-
-
3
5.5 -"-"^'^/l
5.6 '' //
5.7 -~-„i;^
5.9<?^^^i^
0.2 0.4
L
1,
0.6
0.8 1
Reversed shear plasmas are extensively exploited in the JT-60U
programme. One of the more remarkable achievements is the
establishment of core electron temperatures of 26keV, though at a density of
0.5 X 10^^ m~^, by the injection of 3 MW of centrally deposited electron
cyclotron resonance heating power into a reversed shear plasma
sustained by neutral beam injection and lower hybrid current drive. High
fusion performance is established by injecting moderate neutral beam
power, 10-15 MW, into a low density target plasma, n ~ 1 x 10^^ m~^,
early in the current rise. A central region of reversed shear develops
during the current ramp and an internal transport barrier expands
radially, eventually reaching r ja ~ 0.7-0.8, while the plasma edge remains
in L-mode. The ion temperature rises to almost 20 keV throughout the
plasma core and the core density reaches values of ~8 x 10^^ m~^
(Fig. 12.4.15). The large volume encompassed by the transport barrier
leads to significant enhancement of the energy confinement, with
TE ~ 1 s (~3r|^^^'^-P), yielding nD@O;@)rE = 8.6 x 10²⁰keVsm-^
equivalent to 2dt = 1-25, in the best pulse.
The highest fusion performance is attained under transient conditions,
often with a disruptive termination at moderate values of y^N (<2) when

12.4 JT-60/JT-60U
lo'V
8
6
2
(a)
^^^
\
^—^v^
0 0.2 04 06 0.8 10
15
T
(keV) 10
5
J
-r- ~K
i
Te
02
04
\ ^'
06
08
(b)
1
Fig. 12.4.15 Radial profiles from a
2.6 MA/4.4 T (deuterium) reversed shear
discharge with fusion performance
corresponding to the highest estimated
equivalent value of Gdt (a) electron
density, n^, (b) ion temperature, 7,, and
electron temperature, Tg, (c) safety
factor, q [from Ishida, S. et al Nuclear
Fm«o« 39, 1211 A999I
?min ~ 2. Electron cyclotron emission measurements show a rapidly
growing (y"' ~ 10 /is) precursor mode to the disruption and mhd
stability analysis indicates that the plasma is close to the ideal stability limit
for low-n ideal kink ballooning modes. This level of fusion performance
has been reproduced in plasmas with similar global parameters in which
a current hole develops. These discharges also terminate disruptively, in
contrast to the current hole regime at higher values of ^95 (~5). Careful
programming of the auxiliary heating system to control the development
of the plasma pressure has allowed nD@)ri@)re = 4 x lO^'^keVsm'^,
equivalent to 2dt = 0-5, to be sustained for 0.8 s in a reversed shear
plasma. In this case the plasma disrupted at the modest value of y^N = 1-1
and mhd stability analysis indicates that resistive interchange modes could
be involved in the initial phase of the termination.

DIII-D~General Atomics, San Diego, USA
Din-D was developed from the Doublet HI tokamak, which had been
designed to investigate the properties of doublet shaped plasmas, in
which a waist is created in the midplane of an elongated equilibrium.
The Doublet HI experiment was more successful when operated with
a conventional plasma geometry having an 'expanded boundary' diver-
tor, that is with an internal magnetic separatrix but without a divertor
chamber. It was, therefore, decided to rebuild the tokamak within the
existing toroidal field coil set so as to maximize the volume available for
this configuration (Fig. 12.5.1), at the same time increasing the shaping
capability.
The resultant device, which began operating in early 1986, has an
aspect ratio similar to that of JET, R/a = 1.67/0.67, a maximum toroidal
field of 2.2 T, and is designed to achieve plasma currents of up to 3.5 MA
with a diverted plasma, and 5 MA in the limiter configuration. Deuterium
neutral beam injection provides up to 20 MW of heating power with ion
energies of up to 80 keV, while the ion cyclotron radiofrequency system,
operating at 60 and 83 MHz, has provided up to 4.4 MW and the electron
Fig. 12.5.1 Layout of the DIH-D
experiment.
High heat flux
armour

Fig. 12.5.2 Cross-section of the DHI-D
vacuum vessel showing the main elements
of the upper and lower pumped divertors.
cyclotron resonance heating system, operating at 110 GHz, has injected
up to 3 MW, though this system is being developed towards a 6 MW
capability.
Initially the inconel vacuum vessel had a limited coverage of graphite
tiles, but this was gradually extended, so that by the early 1990s the
internal surface of the vessel was completely covered by graphite. A variety
of techniques has been used to condition the vessel and reduce the
recycling of hydrogen isotopes. Among these are baking of the vacuum vessel
up to 400 °C, deuterium and helium glow discharge cleaning,
carbonization, and boronization, the last two being of particular importance in
limiting metallic sputtering from the vessel walls. Routine helium glow
discharge cleaning between discharges is regarded as a valuable aid to
achieving good H-modes, while the low recycling conditions obtained
after boronization are exploited in producing the highest performance.
The power and particle control capabilities have been significantly
improved by the introduction of pumped divertors at the top and bottom
of the vessel (Fig. 12.5.2). In the period 1990 to 1993, a lower divertor
with a rather open configuration was installed. This not only permits active
pumping of the divertor region, using a liquid helium cooled cryopump,
but also allows radial flows to be generated by application of an external
electric field at the outer divertor strike point. Between 1997 and 2000
a closed divertor, with inboard and outboard cryopumps, was installed
in the upper vessel with the aim of providing particle control for more
highly shaped plasmas.

Confinement and H-mode studies
Extensive investigations of the H-mode have contributed substantially
both to the characterization of its confinement properties and to the
understanding of the physics underlying the transition from L- to H-mode.
As well as demonstrating H-modes with neutral beam injection,
electron cyclotron heating, and fast magnetosonic wave heating in the ion
cyclotron frequency range, experiments have produced ohmically heated
H-modes and H-modes in plasmas limited on the inner wall. Energy
confinement has been enhanced beyond the normal H-mode level by a
number of methods and this is discussed in the next subsection.
The introduction of boronization and the installation of graphite tiles
over the entire area of the first wall have facilitated routine operation
in H-mode, and access to the regime follows similar patterns to those
observed in other tokamaks. In NBI heated single null plasmas, the power
threshold for the H-mode scales linearly with toroidal field, but more
weakly with plasma density. In addition, when the ion VB drift is away
from the X-point, the threshold power can be up to a factor of 5 greater than
that required when the ion drift is towards the X-point. The dependence
on toroidal field and density is absent in the double null configuration,
but the strong relationship between the threshold power and the direction
of the ion VB drift with respect to the dominant X-point persists. A
displacement of only a few centimetres vertically, so that the ion drift
is in the direction opposite to that of the dominant X-point, rather than
towards it, increases the threshold power by more than a factor of 3.
Considerable efforts have been made to characterize the H-mode access
conditions in terms of local parameters at the plasma edge, within the
pedestal region. It appears unlikely that a critical edge temperature is
involved, as demonstrated most clearly by experiments in which H-modes
were triggered by deuterium pellet injection at input powers >20% below
the normal H-mode power threshold. It has been suggested on the basis of
experimental measurements that the temperature and pressure gradients
within the pedestal are more likely control parameters for the L to H
transition.
H-modes usually exhibit some form of ELM activity and the possible
forms have been classified into three broad categories. Type I, or 'giant',
ELMs increase in frequency with input power and can cause energy and
particle losses of more than 10% of the total plasma content. Their
importance in controlling edge parameters, in particular particle confinement,
is illustrated by the achievement of H-modes with durations of up to 10 s
in which near steady-state density, energy, and impurity content were
maintained. Analysis of edge profiles in deuterium plasmas heated by
hydrogen beams suggested that such ELMs occurred when the plasma
edge was at the first ideal ballooning limit, and it was inferred that they
were triggered by ballooning modes. Later experiments showed, however,
that type I ELMs could persist at edge pressure gradients which exceeded
the first stability limit by up to a factor of 2 in plasmas in which the edge
region was in the second stability regime for ballooning modes. It has
subsequently been proposed that type I ELMs in DIII-D are caused by

low to intermediate n (n = 5-10) kink/ballooning modes, a conclusion
supported by detailed stability analyses of plasmas in which the
triangularity and squareness were varied. This confirmed that the edge pressure
gradient at which type I ELMs occurred increased with tnangularity and
was highest at moderate squareness as expected.
Type II, or 'grassy', ELMs have higher frequency and lower
amplitude. They have been observed in plasmas with low to moderate currents,
I(MA)/B(T) < 0.5, corresponding to values of s/q^^ < 0.15, where
s = d(ln^)/d(lni|fr) is the shear, ^ being the enclosed poloidal flux.
Type III, or 'transition', ELMs have small amplitude and occur when
the input power is just above the transition threshold. Their frequency
decreases as the power increases until, at moderate power, the plasma
eventually becomes ELM-free Coherent mhd precursor activity with
4 < n < 13 is a characteristic feature of type HI ELMs A further
type of edge behaviour has been discovered in which the plasma edge
parameters remain in steady-state, with values corresponding to those
of an equivalent type I ELM discharge, but ELMs do not occur The
maintenance of quasi-steady-state conditions distinguishes this regime
from ELM-free H-modes In this 'quiescent' H-mode, discussed in more
detail in the following subsection, the edge pedestal parameters appear
to be controlled by an edge harmonic oscillation, in which multiple
harmonics, with toroidal mode numbers ranging from n = 1 to n = 10,
persist throughout the H-mode.
Studies in DIII-D and other tokamaks have defined the conditions
under which H-mode confinement can be obtained, but understanding
the fundamental cause of the apparent bifurcation in confinement has
proved more challenging A senes of experiments in limiter tokamaks, in
which H-mode-like transitions were provoked by inserting an electrically
biased probe into the plasma, coincided with theoretical developments
which considered the influence of electric fields on transport processes.
These insights have been pursued vigorously and substantial evidence
has accumulated that the H-mode transition is associated with a change
in the radial electric field at the plasma edge.
The essential concept which has emerged from theoretical
investigations is that the electrostatic flute-like modes, commonly supposed to
be responsible for anomalous transport in L-mode plasmas, can be
stabilized in the presence of a sheared fluid flow deriving from a gradient in the
ExB drift velocity The dominant role is played by the radial component
of the electnc field, E^, which can be deduced from the lowest order radial
force balance equation for a single ion species,
Er = (Zen^)-^ dpz/dr - vqB^ + V4,Bq, 12.5.1
where the species has an ionic charge Z, density riz, pressure p^, and
poloidal and toroidal rotation velocities vq and v^^. Analysis of the
characteristics of plasma turbulence and the influence of E x B drifts on
flute-like modes has allowed the derivation of a working criterion that
complete stabilization of the turbulence should occur when the £ x 5

Fig. 12.5.3 Time history across the
L to H transition of (a) Da emission from
the lower divertor of the DUI-D vessel,
(b) the poloidal rotation velocity measured
by an active CXRS channel located within
1 cm of the separatnx, (c) the toroidal
rotation velocity from an active CXRS
channel located within 1 cm of the
separatnx, (d) the radial electric field
measured at the same location as (b) and
(c), (e) the power of a density reflectometer
signal integrated from 75 to 800 kHz for a
channel with a reflection layer within 2 cm
of the separatrix, corresponding to an
electron density of 1.26 x lO'* m'^ The
dashed line indicates the initial fall of the
Da signal, conventionally used to indicate
the onset of the H-mode [from Gohil, P
et al. Nuclear Fusion 34, 1057 A994)].
^^^^
"^ , c vm
iL- + + + ++-K-+++ + _^ ++
cvn (c)
4-+++ +.W-+ ... \+^''
Reflectometer power
2545 2550 2555
Time (ms)
shearing rate for the modes, co^xB, is ~ymax, the maximum hnear growth
rate of the modes.
Analysis of impunty emission in the visible region permits the three
contributions to the radial electric field in equation 12.5 1 to be
determined with submillisecond time resolution The critical quantities are
the radial profiles of poloidal and toroidal ion velocity and those of ion
temperature and density. Imtially, passive emission measurements were
employed, but subsequently active charge exchange recombination
spectroscopy, which exploits charge exchange reactions between plasma ions
and the auxiliary heating beams, has been preferred. These measurements
have shown that a negative radial electric field is established in a region
within 1-2 cm of the plasma edge, virtually simultaneously with the drop
in Da emission which accompanies the H-mode transition (Fig. 12.5.3).
Similar phenomena occur in H-modes produced by neutral beam,
electron cyclotron and ohmic heating, as well as in H-modes obtained in
plasmas limited on the graphite tiles on the high magnetic field side of
the torus.
Langmuir probe measurements at the plasma edge also show that the
plasma floating potential becomes more negative, and that the ion
saturation current falls in a manner consistent with the formation of a steep
density gradient. Moreover, the amplitude of density fluctuations,
measured by microwave reflectometry and far-infrared scattering, decreases
rapidly within 100 /iS of the L to H transition in a layer of width 2-3 cm
at the separatrix. The region in which these changes are observed
corresponds to that commonly identified with the edge transport barrier.

Fig. 12.5.4 (a) E^ as a function of major
radius, R, in the region close to the
separatrix (shaded area) at two times: one
in the L-mode, 3 ms before the L to H
transition, and one in the H-mode, 3.5 ms
after the L to H transition, (b) The w x B
and pressure gradient terms which sum to
the Er given in (a). The open circles
correspond to the L-mode measurement
and the solid circles to the H-mode
measurement, while the shaded region
indicates the experimental uncertainty in
the determination of the location of the
separatnx [Burrell, K.H. et al. Physics of
Plasmas!, 1536A994)].
which IS regarded as a characteristic feature of the H-mode. A region of
improved confinement then penetrates inwards on a timescale of tens of
milliseconds following the transition, and is accompanied by increasing
shear in the radial electric field and a reduced level of density fluctuations.
The expenmental evidence indicates that the change m the electnc field
precedes other signatures of the H-mode, supporting the contention that
this is a primary cause, rather than a consequence, of the L to H transition.
In helium plasmas the radial electric field can be evaluated from the
parameters of the majority ions, rather than impurity ions. Although the
time resolution, ~7 ms, is poorer than that attainable when using
impurity ions, the development of a negative radial electnc field at the plasma
edge has been confirmed Nevertheless, the contnbutions of the individual
terms in the radial force balance equation are rather different (Fig 12.5.4).
In particular, measurements of the velocity of the helium majority ions
made 3 5 ms after the transition show that they rotate in the ion diamag-
netic drift direction, whereas the impurity ions are found to rotate in
the electron diamagnetic dnft direction The magnitude of the rotation is
much less than the ion diamagnetic drift, however, again implying a large
negative radial electnc field.
The confinement characteristics of H-modes have been studied
extensively, with the general conclusion that access to the H-mode and global
energy confinement are independent of heating method. Typical
confinement enhancement factors of ~2 relative to L-mode plasmas are
obtained in deuterium H-modes heated by deuterium NBI, but, as in other
tokamaks, the H-mode confinement enhancement factor usually falls as
the density is raised towards the Greenwald value. In certain low power
discharges, Pnb < 4 MW, fuelled by gas puffing, it has been found that
the density profile becomes more peaked and it is possible to maintain
the quality of H-mode confinement, with re ~ 2r™^^^"^, at densities
~1.4nGw- Further improvement in the quality of H-mode confinement
has been achieved in plasmas with neon puffing, where re ~ 3r|^^^^^"^
has been attained. It has been proposed that the enhancement in
confinement beyond normal H-mode levels is associated with the stabilization
of high wave number drift waves by the presence of impurities.
By preparing NBI heated L- and H-mode plasmas in which the global
parameters were very similar, it was demonstrated that the local heat
diffusivity in an H-mode is lower by a factor of up to 3 than in an L-mode,
and that the edge transport barrier accounts for only a small fraction,
~15%, of the improved energy confinement. More detailed analysis of
the local transport properties of H-mode plasmas has been performed in
dimensionless scaling experiments which have investigated the
dependence of local thermal diffusivity on y6, v* and p^ (= pi/a). Ion and
electron thermal diffusivities exhibit a gyro-Bohm scaling, so that Xe and
Xi have a linear variation with /O*, but have a weak dependence on y6. The
observed dependence of the effective (single fluid) thermal diffusivity on
collisionality, Xeff « v0.49±o.08^ jg ascribed in part to the unfavourable
influence of neoclassical ion thermal diffusivity, which is within a factor
of 3 of the anomalous diffusivity in H-mode plasmas. Comparisons of

12.5 Dlll-D 671
dimensionally similar plasmas between DIII-D and JET also showed that
when the globally averaged values of key dimensionless parameters were
carefully matched, the normalized thermal confinement time, 5rE,th, in
the two devices agreed to within 7%, confirming the validity of the
dimensionless parameter scaling approach to transport analysis. Experiments
have also studied the dependence of local transport on the ratio T\/Tq,
finding that both ion and electron thermal diffusivities increase as the
ratio decreases, independently of whether the ion or electron
temperature is varied. It has been suggested that this can be explained by the
sensitivity of the critical ion temperature gradient for the destabilization
of ion temperature gradient turbulence to the ratio of ion and electron
temperatures.
Basic transport processes in L-mode plasmas have been investigated by
exploiting the localized power deposition of electron cyclotron resonance
heating. Transport analysis of plasmas in which the electron cyclotron
resonance was displaced significantly off-axis, by approximately half
of the minor radius, found that a negative effective thermal diffusivity
was required in the electron channel to explain the form of the electron
temperature profile, which remained peaked. This implied the existence
of a non-diffusive component of thermal transport to support the central
peaking of the profile. However, heat losses through the ion channel
ensured that the total heat flux was outwards, so that the second law of
thermodynamics was not violated. Other L-mode experiments involving
both ECRH and NBI heating have allowed the dependence of ion and
electron heat transport on /O* to be separated for the first time. Electrons
have a gyro-Bohm behaviour, Xe oc p*, but the ions behave in a manner
described as 'Goldston-like', with Xi'^ P* It has been suggested that
the Bohm-like behaviour usually observed in other experiments can be
understood as a single fluid average of these two scalings.
Enhanced confinement and high performance
Developments in several areas have contributed to increases in the level of
plasma performance achieved in DIII-D: gradual improvements in wall
conditioning methods and particle control have lowered recycling
levels and reduced impurity influxes, while the realization of techniques for
modification of the current profile and the exploitation of plasma shaping,
particularly higher triangularity, have provided access to higher
confinement and improved stability. Studies have focussed on the development
of plasmas in which energy confinement is further enhanced relative to
the H-mode, while plasma pressure is maximized, so as to optimize the
fusion gain, y6 x re. Conventionally, figures of merit such as^t^H^g, where
^89 = rE/r™^^'^-^ and ^N^98, where H,, = rE,th/4'^''^'''\ are used
to provide normalized measures of the plasma performance in these
experiments. Regimes with high figures of merit tend also towards high
bootstrap current fractions, which is a desirable feature of steady-state
plasmas.

Fig. 12.5.5 Typical waveforms for a
VH-mode discharge. The ratio of the
thermal energy confinement time to the
JET/DIII-D scaling expression,
TE/fjET-Dm-D, increases to ~2 during the
VH-mode. Also shown are the normalized
toroidal beta, ^/(I/aB), the divertor £)„
emission, the injected NBI power, P[nj,
and the radiated power, /^?ad [from
Dni-D Team (presented by
R D Stambaugh) Plasma Physics and
Controlled Nuclear Fusion Research 1994
(Proc 15th Int Conf, Seville, 1994) Vol 1,
83 IAEA,ViennaA995)]
%^%T-Diii-D ^^y' ~\
^^_.r^ ^J
_ miaB) _^—-^"^"^^^^^-^^
"""-> lit'
2000 2200 2400 2600
Time (ms)
The VH-mode is a regime of very high confinement accessible in
conditions of low recycling and low impunty influxes, particularly metallic
influxes It was first obtained following boronization of the vacuum
vessel, but was later established without boronization after the first wall of
the torus had been completely covered with graphite tiles The regime
was onginally observed in double null plasmas with high
triangularity, hx ~ 0 8, and high input power, P > 8 MW, using low target
densities This produced plasmas with unusually low radiated power
fractions, Pr&i/P ~ 30%, and thermal energy confinement times up to a
factor of 2 above those predicted by H-mode scaling As illustrated in
Fig 12 5 5, the VH-mode develops after several hundred milliseconds of
ELM-free conditions and is charactenzed by an enhanced confinement
relative to H-mode levels, with an energy confinement time which can
continue to rise throughout the ELM-free penod. Core toroidal angular
momentum also increases and bulk plasma density fluctuations fall Ion
temperatures range up to 20 keV, the fusion triple product has reached
10^0 keV sm , and the performance is ultimately limited by mhd
instability. Values of y6 as high as 12.5% have been achieved, the highest
value attained in a tokamak plasma at conventional aspect-ratio
Strong plasma shaping, especially high tnangularity, is essential for
peak performance in the VH-mode. Confinement enhancement is highest
for4 < ^95 < 5, and part ofthe confinement improvement at high
elongation and high tnangularity arises from the increase in ^95 which is obtained
for fixed plasma cunent. In addition, neutral beam driven and bootstrap
cunents cause ^@) to rise above unity initially, suppressing sawteeth.
The high triangularity then promotes low magnetic shear in the plasma
centre so that these plasmas satisfy the Mercier criterion, introduced in

12.5 Dlll-D 673
Section 6.12, and have access to the second regime of ideal
ballooning mode stability in the core. High triangularity also provides access to
second stability at the plasma edge, and this feature is considered to be
necessary for the suppression of ELM activity. These enhanced stability
properties are believed to play a major role in determining the duration
of the VH-mode: the phase during which confinement is significantly
enhanced above H-mode scaling lasts for up to ~ 1 s and is terminated
by a global mhd event, which typically occurs with 2.5 < y^N < 3.5.
This returns the plasma to an ELMy H-mode with lower energy
confinement The mhd event is generally associated with modes having toroidal
numbers in the range 1-5 which grow on a timescale of 20-50/zs. This
is consistent with mhd stability analysis, which indicates that, close to
the termination, the region just inside the plasma edge, 0.8 < p < 0.9, is
marginally stable to ideal kink modes due to the high pressure and edge
current gradients typical of the regime. Coupling to central mhd modes
appears to influence the extent of the energy loss at the termination.
The region of improved confinement extends beyond that which has
access to second stability, and it has been proposed that increased shear
in the £ X 5 rotation velocity is responsible. As the energy confinement
nses above the H-mode scaling prediction, the toroidal rotation velocity
increases in the core plasma and falls at radii close to the plasma edge,
r /a > 0.8. From equation 12.5.1, it follows that the radial electnc field
increases in the plasma core and a region with greater shear in the £ x 5
rotation velocity forms. The importance of this effect was explored in
an experiment in which an error field, produced by an external coil, was
used to slow the plasma rotation by magnetic braking in the vicinity
of the ^ =2 surface Fig. 12.5.6 compares the relevant profiles from
Fig. 12.5.6 (a) E, profiles in two
discharges, one with (dashed line) and one
without (sohd hne) magnetic braking,
(b) single fluid thermal diffusivity, /eff. as
a function of position for these discharges.
p is the toroidal magnetic flux function
[from Burrell, K H. etal. Plasma Physics
and Controlled Nuclear Fusion Research
1994 (Proc. 15th Int. Conf., Seville, 1994)
Vol 1, 221 I A E.A., Vienna A995)].

a representative VH-mode with a case in which magnetic braking was
applied. In the latter case, the toroidal rotation, which is not shown,
decreased, the radial electric field gradient in the region 0.6 < /O < 0.8
decayed, and the thermal diffusivity increased.
Observations from several tokamaks have shown that the almost
universal relationship between energy confinement time and plasma current
can be broken in expenments in which the plasma current profile is
modified. In DIII-D experiments where peaked current profiles were
produced, either by increasing the elongation, or decreasing the current, the
energy confinement enhancement relative to the H-mode scaling
expression exhibited a close correlation with the plasma internal inductance.
In cases in which the elongation was raised from 1.2 to 2 in ~200 ms at
constant current and neutral beam power, an H-mode transition occurred
and £i reached values of ~2. At the same time, the plasma energy
confinement time initially rose, then fell as £i relaxed. Plasmas in which the
current was reduced from 2 to 1 MA at rates of up to —4 MAs~^ yielded
similar results. A magnetic braking experiment similar to that described
above showed that the confinement enhancement was correlated with the
toroidal rotation velocity, again suggesting that E x B shear suppression
of turbulence contributed to the reduced transport. Despite the
beneficial effects of current profile peaking, self-consistent equilibna with such
peaked profiles are difficult to maintain in steady-state, as there is a
substantial bootstrap current at high-y6, which tends to broaden the current
profile, thereby reducing £;.
Simultaneously with TFTR enhanced reversed shear experiments,
enhanced confinement was observed in plasmas in which the current
rise and NBI heating phases were programmed to produce a region
of negative central shear. In such discharges an internal transport
barrier develops, more usually in the ion temperature profile, in L-mode,
ELM-free H-mode, and ELMy H-mode regimes. Ion thermal transport is
reduced significantly in the region of negative shear, and in some H-mode
discharges the ion thermal diffusivity falls to neoclassical levels over
most of the plasma. Strongly peaked pressure profiles can develop, with
p{0)/{p) ~ 2-5, ion temperatures of up to 20keV are obtained, and
the fusion triple product has reached 6.2 x 10^°keVsm~^, equivalent
to <2dt = 0.32 and the highest value attained in DIII-D. These
plasmas have reached global energy confinement times of up to 4.5r|^^^^^'^,
and values of y^N ~ 5 have been achieved by careful control of the
discharge evolution to limit the pressure profile peaking while maintaining
a high internal inductance. Many aspects of stability associated with high
shaping discussed in relation to the VH-mode are equally relevant to the
optimization of performance in discharges with negative central shear.
As discussed in Section 12.2, several factors can contribute to the
reduction of anomalous transport in plasmas with negative central shear.
However, analysis has shown that, in common with other enhanced
confinement regimes established in DIII-D, stabilization of drift wave
turbulence by shear in the £ x 5 rotation velocity appears to play a
dominant role. Details of the current and pressure profiles, together with

12.5 Dlll-D 675
Fig. 12.5.7 Plot of highest values of the
performance figure of merit, /3nH89,
achieved in DIH-D plasmas as a function
of the duration of the high performance
phase normalized to the energy
confinement time, rdurauon/^E- Pulses with
the highest figures of merit at all values of
Tduration/^E Were initially formed with
negative central shear. The quiescent
double bamer point relates to the mode
illustrated in Fig. 12.5.8. Projected values
for ITER reference (inductive) operation
and for a proposed steady-state ftision
power plant, ARIES-AT, are indicated
[from Allen, S.L. et al. Fusion Energy
2000 (Proc. 18th Int. Conf., Sorrento,
2000) paper I.A.E.A -CN-77/OV1/3.
I.A.E.A., Vienna B001)].
■ ELM-free H-mode
• ELMy H-mode
■
•
1 •*
L •
•
• •
1 1
•
c
# L-mode edge
n Quiescent doublet
•
t
•
amer
•
ARIES-AT
• •
ITER
plasma shaping, determine the stability characteristics of the regime, the
duration of the high confinement phase and the level of performance
achieved. Limiting mhd activity can take a number of forms: n = I ideal
kinks, which can trigger disruptions in plasmas with an L-mode edge,
Alfven eigenmodes, neoclassical tearing modes, low to moderate-n ideal
kinks considered to be responsible for type I ELMs, and resistive wall
modes.
As in other devices, it has proved possible to extend the initially
transient improvements in confinement and stability and to develop quasi-
stationary negative shear plasmas with enhanced plasma performance.
Significant non-inductive current fractions have been obtained in such
discharges, although with the limited profile control capability available,
evolution of the current profile generally causes ^ @) to fall towards unity.
Nevertheless, sawtooth-free plasmas with ^mm ~ 1.05 have been
established at 1.2 MA/1.7 T and ^95 = 4.4 in which y^NHsg = 7 has been
maintained for 6.3 s, equivalent to Str and >30rE. Higher performance
discharges have been produced at similar current and toroidal field in
which y^NHsg = 9 was sustained for 2 s, equivalent to 16rE, where 50%
of the current was driven by the bootstrap effect and 25% by neutral
beams. Figure 12.5.7 illustrates the performance levels which have been
achieved in DIH-D experiments as a function of normalized discharge
duration. The envelope of pulses with the highest values of y^NHsg consists
of plasmas which were established as negative central shear discharges.
In experiments in which negative central shear is generated with
counter-NBI, a regime with internal and edge transport barriers forms
in which the edge (H-mode) barrier is not modulated by ELMs, but

Fig. 12.5.8 Comparison of plasma
profiles from quiescent double barrier
(QDB) mode (solid line), L-mode with
ITB (dashed line), and L-mode plasmas
(dotted line): (a) ion temperature, 7,,
(b) ion thermal diffusivity, /,, together
with the calculated neoclassical value for
'e QDB case, x"^ [from Doyle, E.J. etal.
iHasma Physics and Controlled Fusion 43,
A95 B001)].
the plasma is nevertheless sustained in quasi-steady-state conditions.
Denoted the quiescent double barrier mode, the regime combines
enhanced confinement characteristics of an internal transport barrier with
the quiescent H-mode edge discussed previously. This mode of operation
avoids degradation of the transport barrier by ELMs and also eliminates
the pulsed power and particle loads produced on divertor targets by type
I ELMs. The regime has been observed over a wide range of plasma
current and toroidal field, with 3.7 < ^95 < 4.6, but access appears to
require a minimum injected power of ~3MW, low target densities, in
the range 2-3 x 10^^ m~^, which is achieved by strong divertor
pumping, and the maintenance of a gap of at least 10 cm to the outer wall,
possibly associated with large edge excursions of some fast ion orbits in
counter-injection. These plasmas form peaked temperature and density
profiles (Fig. 12.5.8), with edge pedestal parameters characteristic of an
H-mode with type I ELMs. Transport analysis indicates that the ion
thermal diffusivity is commensurate with neoclassical values in the transport
barrier regions in the edge and core of the plasma (Fig. 12 5 8) and that
the suppression of turbulent transport can be explained by £ x 5 velocity
shear. The regime has been sustained for up to 3 8 s B6rE), a duration
limited only by expenmental considerations, and values of ySNHgg ~ 7
have been sustained for penods of up to 1 6 s (lOre) Although
accumulation of high-Z impunties dunng the quiescent phase leads to a gradual
increase in Zgff to values of around 6, initial experiments with central
electron cyclotron heating and current dnve indicate that this can reduce
both peaking of the density profile and central impunty accumulation.
Mhd studies
In DIII-D, as in JET and JT-60U, the operational limitations imposed
by the axisymmetric vertical displacement instability are a key issue.
Equilibrium analysis using a rigid body treatment of axisymmetric
plasma displacements indicated that the control system should be
capable of maintaining stable plasmas for elongations of up to /c = 3.
However, expenments revealed that plasmas became unstable at /c = 2.5,
the lower limit being associated with non-rigid plasma displacements.
More detailed calculations showed that, at maximum elongation,
plasmas were within a few percent of the ideal stability limit. As expected,
the limiting elongation was also found to be a function of the plasma
current profile, with the maximum stable value of elongation falling with
increasing internal inductance (Fig. 12.5.9). During vertical instabilities,
halo currents have been observed with a magnitude of up to 40% of the
plasma current, consistent with the mechanical forces experienced by the
vacuum vessel
Disruptions are triggered by a variety of causes and a range of
techniques has been investigated to mitigate their consequences. Killer pellet
injection, using cryogenic pellets of neon or argon, is effective in reducing

Fig. 12 5.9 Maximum experimentally
achieved elongation, k, for plasmas near
the ideal axisymmetric instability limit, as
a function of the plasma internal
inductance, €,. The broken line indicates
the dependence of the maximum achieved
value of K on €, [Taylor, T.S. et al. Plasma
Physics and Controlled Nuclear Fusion
Research 1990 (Proc. 13th Int. Conf.,
Washington, 1990) Vol 1, 177.1.A.E.A.,
Vienna A991)].
2.5
2.4
2.3
2.2
2.1
2.0
-,^
-
-
-
-
•
•
•
•
• >>
•N •
•
•
^N
N«
''^\^
1.0 1.2 1.4 1.6 1.8
thermal and electromechanical loads, but leads to the generation of
runaway electrons. Injection of high pressure neon or argon gas, however,
has successfully demonstrated complete radiative dissipation of the total
plasma thermal and magnetic energy, within experimental uncertainties,
and reduced halo currents and toroidal asymmetries, by a factor of 2-4
compared to unmitigated vertical instabilities, without generating
significant runaway electron currents. Experiments were performed using a
7 MPa reservoir at room temperature, which injected ~4 x 10^^ particles,
resulting in a gas-jet with a ram pressure of ~30 kPa at the plasma edge,
several times the volume averaged electron pressure of ^1 kPa.
Extrapolation of the relevant parameters to ITER suggests that this is a viable
technique for mitigation of the consequences of disruptions at the reactor
scale.
Disruptions produced by modes destabilized by external error fields
have been of particular concern, since they impose substantial
constraints on the accessible density range. This phenomenon, first identified
in Din-D, involves the growth of non-rotating n = 1 modes, with
m = 1,2,3 components, which are induced by error fields arising from
departures from axisymmetry in the poloidal field circuit. Contributions
from many coils sum to an effective radial field component of 7 G in the
m/n = 2/1 helicity, equivalent to that produced by a horizontal
displacement of a single poloidal field coil by 6 mm. The influence of this error
field also depends on safety factor, so that the operational space was
initially restricted to the region q*D = q*{\Q-^'^nRq*/B) > 72 m'^ T'^,
where ^ * is an analytic approximation to the edge safety factor and D is the
usual density limit parameter (Fig. 12.5.10). As in JET, these modes can be
suppressed by driving plasma rotation with NBI. However, this approach
failed at high-y6, as the critical m/n = 2/1 error field, B^, required to

Fig. 12.5.10 Plot of the lower limit of
the operating region which is stable against
locked n = I modes induced by error
fields in the lQ-^^nRq*/B vs q* plane
The open circles represent points from
expenments without an error field
correction system, with the upper line
illustrating the operating boundary
q*D = 72m-^T"', where
D = lO-^^RRq*/B. The sohd circles
correspond to expenments using a simple
n = I correction coil and the lower line
shows the improved operating boundary
D = Qm-^T-i [ScoviUe, JT et al
Nuclear Fusion 31, 875 A991)]
B
32
24
16
8
-\ °
\ f
».
>
o Old database
• Positive coil current
^~~^~^^--^^-~a_
destabilize an n = 1 mode decreased from C^/3)^=^ = 5 x lO""* at
y6 = 2% to Er/5)r=a = 2 X 10"'' at y6 = 5% To expand the
operating regime, an ad hoc coil was added above the plasma in one toroidal
location to enable the dominant n = 1 component of the error field to
be cancelled This was successful and the operating limit was reduced to
D = 9 for ^* > 3, as illustrated in Fig 12 5 10 A more sophisticated
correction system, the 'C-coil', consisting of 6 external saddle coils
distributed around the equatonal plane and capable of cancelling the error
field more precisely, has subsequently been installed and is in routine use
As noted previously, optimization of plasma shape, current
distribution and pressure profile has contributed significantly to increasing the
maximum attainable y6, allowing global values of y6 of up to 12 5%, with
axial values as high as 44% Values of y6 ~ 8% have been sustained in
quasi-steady-state for penods of ~1 s, but higher values are maintained
only transiently, typically for times of ~ 100 ms, and are limited by
various forms of mhd activity At ^95 < 3, disruptions are observed for ^^
as low as 3 These are preceded by an n = 1 mode with a rapid growth
rate, ~100/is At higher values of ^95, DIII-D plasmas readily attain
values of ^^ ~ 4, and can reach y^N ~ 6 The dependence of y6-limiting
instabilities on current and pressure profiles is well known from
theoretical considerations, and is implicit in the scaling y6 ~ I/aB, which
IS calculated for 'optimized' profiles When the current profile
dependence IS included explicitly through £1, the y6-limit in DIII-D is, with few
exceptions, well descnbed by y6(%) < UJ(MA)/aB (Fig 12 5 11)
In many discharges neoclassical tearing modes, commonly
destabilized by seed islands produced by sawteeth, fishbones, or ELMs,
determine the limiting y^N Modes with n = 2orn = 1 are associated with
a measurable degradation of confinement, with the latter producing major
disruptions In some cases the 2/1 mode has been observed to develop as
the resultofadescending cascade of modes withm/n = 5/4,4/3,3/2, and
finally 2/1 Expenments in collaboration with JET and ASDEX Upgrade
have confirmed that the cntical y^N for the growth of m = 3/n = 2

Fig. 12.5.11 Scaling of the usual
/3-limit in DIII-D plasmas, indicated by the
line /3n = 4€,. The solid circles indicate
individual discharges from an expenment
designed to test whether wall stabilization
could be exploited to achieve higher fi
values Several of these discharges lie
above the usual limit and have exceeded
the predicted stability limits in the absence
of wall stabilization [from TumbuU, A D
et al Plasma Physics and Controlled
Nuclear Fusion Research 1994 (Proc 15th
Int. Conf, Seville, 1994) Vol 1, 705
I.A.E.A, Vienna A995)].
modes scales as /O*, as expected theoretically. Long duration pulses, with
?min ~ 1-05, y^N = 2 8, and y^NRgg = 7, have nevertheless been
sustained for over 6 s in the presence of a small m = 3/n = 2 neoclassical
tearing mode
To optimize performance in long pulse operation, suppression of
neoclassical tearing modes is required, and two possible approaches have
been demonstrated in DIII-D First, localized ECCD has been used, as
in ASDEX Upgrade, to fully suppress an m = 3/n = 2 mode. In
addition, observations in ASDEX Upgrade showed that the growth of
a second neoclassical tearing mode with different helicity from a
preexisting mode can effectively suppress the growth of the first mode,
prompting the suggestion that an externally applied non-resonant
helical field might produce the same result The C-coil saddle set, discussed
above, was therefore used to apply a static, non-resonant
(predominantly m = 1,2) n = 3 helical field before the usual onset time of
an m = 3/n = 2 neoclassical tearing mode in a plasma with y^N ~ 2.
This completely suppressed the mode until the termination of the
externally applied field. However, a significant loss of toroidal momentum
was observed, possibly due to ripple damping of the beam driven toroidal
rotation.
As y6 increases, so does the bootstrap current, leading to a broadening
of the plasma current profile, which tends to lower the instability
threshold for ideal kink modes at the plasma edge With a resistive wall, ideal
kink modes take the form of a 'resistive wall mode', which was
originally believed to be unstable on the wall penetration time. However, it is
expected that if sufficient plasma rotation can be maintained, for example.

by neutral beam injection, these modes can be 'wall stabilized'. Initial
evidence for such an effect was advanced on the basis of experiments in
Dni-D in which the usual limit y6(%) < UJiMA)/aB was exceeded
by up to 50% for periods in excess of 10 wall penetration times, tw- In
these discharges, represented by the experimental points in Fig. 12.5.11,
the high-y6 phase terminated in a collapse, or disruption, caused by the
growth of slowly rotating, or locked, n = I modes with low m. Both
the growth time, y~^ ~ several milliseconds, and the structure of these
modes were in agreement with those expected for the resistive wall mode.
As noted above, the critical error field for the growth of an n = 1
mode falls with increasing y6. Theoretical analysis suggests that this can
be caused by the resonant excitation of a rotationally stabilized resistive
wall mode by the error field when ^^ is above the 'no-wall' y6-limit,
that is the y6-limit predicted when the plasma is not enclosed within a
conducting wall. In experiments in which the C-coil system was used to
correct the error field, either in preprogrammed mode, or in a feedback
mode based on the detection of the resonant response of the resistive
wall mode, operation at ^^ values of up to 50% above the no-wall limit
was maintained for periods of >1 s (>200rw) by sustaining rotational
stabilization of the resistive wall mode It is also predicted that these
modes can be stabilized in the absence of plasma rotation by active
magnetic feedback. Preliminary experiments, using the C-coil system and
an external set of magnetic detection coils, have demonstrated the
feasibility of active feedback control of the mode (Fig. 12.5.12) and have
Fig. 12.5.12 Companson of (a) /3n,
(b) resistive wall mode ampLtude,
(c) plasma toroidal rotation for pulses with
/3n above the no-wall /3-lirmt Two cases
are shown, no active feedbaclc control of
the resistive wall mode (solid line) and
active feedback control using a 'mode
control' algonthm (dashed line),
illustrating the extension of the pulse
duration at high-/3N with active magnetic
feedbaclc [from Garofalo, A.M et al
Fusion Energy 2000 (^roc 18th Int Conf,
Sorrento, 2000) paper
IAEA-CN-77/EXP3/01(R). IAEA,
Vienna B001)]
Mode
amplitude
(gauss) 2
Toroidal
rotation j
(km/s)
No-Wall Limit
(a)
No Feedback
(b) _^
100 ms
(C) 1 1
" \"~'""\
Mode Control ,
\-

12.5 Dlll-D 681
maintained stable operation above the no-wall y6-limit for periods of up to
50rw. Subsequently, an optimized system of sensors and feedback coils
has been installed.
In DIII-D the density limit does not increase with input power, but
is better described by the empirical Greenwald limit. A region of high
density is observed in the X-point region, and there the maximum density
does scale with the net power flowing across the separatrix. In ohmic
and L-mode plasmas, the density limit occurs at high radiated power
fractions, >75%, and is normally followed by a major disruption. This
general behaviour is also true of ELMy H-modes, but they return to the
L-mode before disrupting.
The sawtooth collapse in DIII-D is usually associated with a full recon-
nection and exhibits a growing m = n = I precursor, though, as in many
tokamaks, the collapse time is shorter than the Kadomtsev value by an
order of magnitude. From a statistical analysis of the current profile,
derived from motional Stark effect and magnetic measurements, it was
concluded that the average value of q @) was 0.96 ± 0.08 just before the
sawtooth collapse and 1.02 ±0.1 just after the collapse. This supports
the interpretation that the sawtooth produces full magnetic reconnection
during the collapse and contributes to a pattern of experimental results in
which measurements of the central safety factor in some tokamaks yield
^@) ~ 1, while similar measurements in others find ^@) ~ 0.7.
Magnetic fluctuations with frequencies in the range 50-200 kHz and
with characteristics of TAB modes have been detected in discharges at
low toroidal fields, ~1 T, heated by high power NBI. Detailed studies of
the activity have confirmed that the mode frequency, when properly
corrected for Doppler shifts, exhibits the predicted variation with density and
toroidal field. The fast ion velocity parallel to the magnetic field is
somewhat lower than Va, but is still within the range expected theoretically to
excite TAB modes. Evidence of fast ion losses associated with this
activity is seen, for example, in neutron emission measurements. These show
that the losses scale hnearly with the mode amplitude (Fig. 12.5.13) and
that, in discharges with strong TAB activity, up to 70% of the NBI power,
equivalent to ~10MW, can be lost. This is corroborated by bolometric
observations of fast ion losses and by damage to optical components on
the vessel wall.
Current drive
Full non-inductive current drive was demonstrated in neutral beam
heating experiments with plasma currents in the range 0.3-0.5 MA The
earliest experiments focused on NBI current drive in helium plasmas
at 0.34 MA, estabhshing H-modes with ySp = 3.5 80% of the plasma
current was attributed to NBI driven current, with the remainder arising
from the bootstrap current. In subsequent studies, with plasma currents in
the range 0.4—0 5 MA, full current drive was again achieved, though with
the proportions due to NBI current drive and bootstrap current reversed.

Fig. 12.5.13 Fraction of fast ions lost
during TAE activity, expressed as the
fractional drop in neutron emission, as a
function of the RMS amplitude of high
frequency, />75kHz, mhd activity
[Duong, H H. et al Nuclear Fusion 33,
749A993)]
High frequency amplitude (T/s)
In these experiments, with y6p values of up to 5.1, a spontaneous
improvement of confinement was observed as the current profile broadened under
the influence of the bootstrap current and q @) rose above 2. The highest
absolute levels of non-inductive current drive were obtained with NBI
at plasma currents of ~ 1.2 MA where the non-inductive current reached
700 kA, divided equally between NBI current drive and bootstrap current
drive.
Radio frequency approaches to current dnve include both fast Alfven
waves (FWCD) and electron cyclotron waves (ECCD). FWCD
experiments used antennas operating at 60 and 83 MHz to couple powers of
up to 2 MW into L- and H-mode plasmas heated by NBI and ECRH to
increase the electron y6, on which the FWCD efficiency depends. Up to
llOkA of FWCD was produced, with current dnve efficiencies of up
to 0 54 X 10^^ Am~^ W~^ The centrally peaked nature of the driven
current profile was confirmed (Fig 12 5.14a) and the current drive efficiency
was found to increase with electron temperature, as expected from theory,
though a significant reduction of the efficiency was observed in H-modes
with high frequency (> 100 Hz) ELMs.
Studies of ECCD have used steerable mirrors on the torus outboard
side to launch waves at 110 GHz so as to couple to the second harmonic
resonance in the extraordinary mode. Using up to 2 MW of microwave
power in L- and H-mode plasmas, driven currents of up to 120kA have
been obtained at current drive efficiencies which are in good agreement
with Fokker-Planck calculations. Detailed comparisons of the off-axis
current drive profile, as determined from motional Stark effect
measurements, with calculations have shown that the localization of the driven
current agrees well with theory, the driven current profile having a full
width of Ar/a ~ 0.1 (~7 cm), as illustrated in Fig. 12 5.14b. Although
off-axis current drive is known to be less efficient than central current

- Expenment
-CURRAY
- FASTCD
J
V
/
X
A
ECCD
Fig. 12.5.14 (a) Companson of measured FWCD profile in a VH-mode plasma with calculations by two codes, CURRAY (ray
tracing with multiple pass absorption), and FASTCD (ergodic limit of weakly damped rays), using different formalisms [Petty, C C
et al Nuclear Fusion 39, 1421 A999)]. (b) Measured profile of ECCD in an L-mode plasma, represented by the quantity
A(l/iio)idBz/dR) denved from MSE measurements, compared with a calculation of the dnven current profile using the TORAY-GA
code [Petty, C C etal Radio Frequency Powerin Plasmas (Proc 14thTop. Conf, Oxnard, 2001) 275. A I P, Melville B001)]
drive due to absorption by trapped particles, the current drive efficiency
is found to depend on the local electron y6, an effect which mitigates the
extent to which the current drive efficiency falls with increasing minor
radius This is understood in terms of wave absorption by electrons with
higher v\i as y6 increases, leading to a reduction in the fraction of electrons
which cross the passing/trapped boundary in velocity space As noted
previously, the very localized nature of the ECCD profile has allowed the
stabilization of neoclassical tearing modes.
Divertor performance
Initial experiments at high current, that is above 2IVIA, were restricted
by excessive nickel influxes, and several steps were taken to address
this problem. Carbonization of the first wall was used to deposit a thin,
~100nm, carbon film on plasma-facing surfaces. This reduced nickel
line radiation by a factor of up to 30 in H-mode discharges, permitting
operation at plasma currents of up to 3 IVIA. The effects of the carbon
layer, which also included a reduction in oxygen radiation by up to a
factor of 6, lasted for ~100 pulses. Boronization produced additional
improvements in impunty control and decreased hydrogen recycling.
This process, which was developed in TEXTOR and is discussed in
Section 9.6, involves the deposition of a ~100nm layer of boron on
plasma-facing surfaces. Advances in performance associated with this

technique include the discovery of the VH-mode. Further improvements
in recycling and impurity control have been associated with complete
coverage of the vessel by carbon and the installation of the upper and
lower pumped divertors.
The relative importance of radiation and SOL conduction in power
exhaust has been analyzed in some detail. In single null ELMy H-modes
with the ion VB drift towards the X-point, asymmetries of order 5 in
the ratio of the peak power loading of the outer and inner strike points
have been observed. This asymmetry disappears when the direction of
the ion drift is reversed. Although ELMs can raise the peak heat flux to
the target by two orders of magnitude, with the power lost predominantly
to the inner strike point, they generally contribute <10% of the time
averaged power to the divertor. The power deposition profile is therefore
determined mainly by the steady-state transport between ELMs. A power
balance for the normal ion VB drift direction shows that ~20% of the input
power IS lost as radiation from within the separatrix and ~30% is radiated
from the X-point and divertor regions. The latter comes predominantly,
~65%, from the inner divertor leg, so that the target heating asymmetry is
largely explained by the radiation imbalance. Measured losses account for
80-90% of the input power, which is within expenmental uncertainties
for the total power accountability and is typical for such discharges in
large tokamaks.
Asymmetries between power deposition at the upper and lower diver-
tors were investigated in a highly triangular quasi double null H-mode
plasma in which the distance between the separatrices corresponding to
the upper and lower X-points was varied. This showed that at low to
moderate densities, n/ncw < 0.7, a small change in the distance between the
separatrices at the midplane, SRgep = ±0.4 cm, effectively changed the
power deposition entirely from one divertor to the other. This was
interpreted as being consistent with the width of the power decay length in
the scrape-off layer The transfer of ELM power from one divertor to the
other was found to be more gradual, corresponding to 5i?sep = ±1 -9 cm.
At higher densities, where the plasma returned to L-mode and the
divertor detached, the change occurred very gradually, 5i?sep ~ ^4 cm, which
was of the same order as the scale length for the changeover in
particle fluxes at lower density. It has been suggested that divertor, rather
than scrape-off layer, processes are responsible for determimng this scale
length.
Several methods for decreasing the power conducted to the target
have been investigated by exploiting the flexibility of the lower and
upper pumped divertors (Fig. 12.5.2). Active pumping by the cryopumps
has allowed considerably higher gas injection rates to be used in quasi-
steady-state conditions in high power ELMy H-modes (Fig. 12.5.15).
The increased radiation reduces the peak divertor heat flux by a
factor of 4, leading to the formation of a partially detached divertor,
while leaving global energy confinement unaffected. Thomson
scattering measurements in the divertor region show that the detached phase
IS characterized by an electron temperature of 1-2 eV, indicating that

12.5 Dlll-D 685
Fig. 12.5.15 Overview of an ELMy
H-mode pulse in which strong deutenum
gas injection was used to reduce the peak
heat flux to the divertor target Shown are
the plasma current, /p, the ^fBI power,
Pbeam, the D2 gas input, the peak heat flux
to the divertor, 'Pk div power', and the
total stored energy, Wtot [from Hill, D N
et al. Plasma Physics and Controlled
Nuclear Fusion Research 1994 (Proc 15 th
Int Conf, Seville, 1994) Vol 1, 499
IAEA, Vienna A995)]
0 1000 2000 3000 4000 5000 6000
Time (ms)
volume recombination of hydrogenic species is playing a significant role
in the detachment process, as expected theoretically In addition,
analysis of the radiation and temperature distnbution suggests that convection
IS the dominant energy transport mechanism in the divertor dunng this
phase.
Control of the plasma density in ELMy H-modes became possible for
the first time following installation of the lower divertor cryopump, which
has a measured speed of 40 m^ s""^ at a D2 pressure of 5 mtorr. This allows
the density of ELMy H-mode plasmas to be varied by up to a factor of
2. Particle exhaust rates have been enhanced, by up to a factor of 2, by
divertor biasing, which generates an E x B flow, sweeping plasma
particles towards the entrance to the pump The cryopump can also control
the gas inventory of the vessel wall, providing an additional conditioning
technique. In ELMy H-modes fuelled only by NBI, the particle removal
rate can exceed the beam fuelling rate, implying that gas is removed from
the first wall 'Puff and pump' experiments, involving deutenum puffing
at rates of ~200torr l.s""^ together with active pumping, have
demonstrated that injected argon can be ennched in the divertor plasma by up to
a factor of 17 relative to the core plasma, suggesting that divertor impu-
nty retention improves in the presence of induced scrape-off layer flows
Comparison of particle control with the lower open and upper closed
divertors indicates very similar levels of performance, although the core
ionization rate is found to be a factor of 2 6 lower with the latter,
indicating an influence of the closed geometry on particle fluxes from the
divertor into the main chamber

Fig 12 5.16 Helium density at p = 0 3,
as measured by active CXRS, as a function
of time for discharges with and without
active helium pumping A short, 50 ms,
helium puff is injected at 1 5 s and the
pumping is 'switched on' at 2 s by
changing the radial position of the outer
divertor stnke point In the case with active
helium pumping, provided by argon
frosting of the cryopump, the helium
concentration of the core plasma decays on
a timescale of ~1 s [Hillis, D L etal
Plasma Physics and Controlled Fusion 36,
A171 A994)]
No hehum pumping
With hebum pumping
Investigations of helium transport and exhaust are an important
element of the DIII-D programme Gas puffing expenments producing a
final helium concentration of ~10% showed that in L-mode, ELMy
H-mode, ELM-free H-mode, and VH-mode the helium density profile
relaxed within Is to that of the electron density profile This suggests
that the transport of helium is very similar to that of deutenum and that
there is no preferential accumulation of helium in the plasma centre As
found in TFTR, the ratio of the helium particle diffusivity to the single
fluid heat diffusivity is of order unity Moreover, a dimensionless scaling
analysis of helium transport in ELMy H-modes determined that both the
helium particle and effective thermal diffusivities scaled in a gyro-Bohm
manner
Condensing argon on the cryopump, 'argon frosting', creates a
cryogemc layer capable of pumping helium In DIII-D the measured
pumping speed of the fresh layer on the lower cryopump is in the range
12-18m^ s""\ although this detenorates in the course of a plasma pulse
due to absorption of deutenum by the layer Measurements of helium
transport and exhaust have been performed both with gas puffing and with
central helium fuelling from NBI Figure 12 5 16 compares the time
evolution of the helium concentration in the plasma core for ELMy H-modes
with and without argon frosting on the cryopump In both cases the pump
was 'switched on' by moving the outer stnke point to the pump entrance at
2 s, following a helium gas puff at 1 5 s Only in the discharge with argon
frosting did the helium concentration decay, with an exhaust efficiency of
~5% being achieved Analysis of core helium transport in these
expenments confirmed previous results In addition, the ratio of the residence
time for helium in the plasma chamber to the global energy confinement
time was found to he in the range 8 < r^g/re < 14, which is considered
to be acceptable for a reactor

12.6 ASDEX Upgrade
ASDEX Upgrade—Max-Planck-lnstitut fiir
Plasmaphysik, Garching, Germany
The ASDEX Upgrade design is based on the Axial Symmetnc Divertor
EXpenment, ASDEX The divertor concept of ASDEX was adapted with
ASDEX Upgrade to the techmcal requirements of a fusion reactor In a
burning reactor plasma the poloidal field coils forming the divertor shape
of the plasma with an X-point have to be located outside the vacuum
vessel For this reason, the divertor chambers are no longer separated from
the plasma vessel by narrow slits but are wide open Essential plasma
properties, pnmanly the plasma density and the wall load have been
adapted to the conditions expected in a fusion reactor Sufficiently high
heating power up to 28 MW ensures that the energy fluxes through the
scrape off layer are equivalent to those in a reactor ASDEX Upgrade thus
serves for studying plasma wall interactions under reactor like scrape off
layer conditions Furthermore the expenment was so dimensioned that,
enlarged to reactor size, there would be space for the blanket and first
wall inside the main field magnetic coils. The physics studies also cover
core plasma behaviour and confinement improvement.
The first plasma in ASDEX Upgrade was produced on 21 March 1991
after nearly 10 years of planning, design, and construction. The
reference values for the ASDEX Upgrade design are given in Table 12.6.1.
Figure 12.6.1 shows a 3D cut away view of ASDEX Upgrade with two
different divertor geometries. Major modifications were made to expand
the experimental possibilities of ASDEX Upgrade and to contribute to
the discussion of the ITER design:
Table 12.6.1 Main parameters of ASDEX Upgrade
Major plasma radius
Minor plasma radius
Plasma height
Triangularity
Plasma current
Toroidal magnetic field at magnetic axis
Current flat top duration
Installed auxiliary heating power
Neutral beam heating 60 keV
100 keV
Ion cyclotron heating C0-90 MHz)
Electron cyclotron heating A40 GHz)
Ro
a
b
8
h
Bo
tD
Ph
1,65 m
0,5 m
0,85 m
<0 5
<14MA
<3,9T
10s
28 MW
lOMW
lOMW
6MW
2MW

12.6 ASDEX Upgrade
ECRH tiansmisson line
Open divertor (I) Closed divertor (lib)
Fig. 12.6.1 3D cut away view of
ASDEX Upgrade with neutral beam
injector boxes and DIV I (left) and DIV lib
(nght) divertor configuration
• 1996 installation of tungsten-coated divertor plates
• 1997 closed lyre-shaped divertor and cryo pump
• 1997 second neutral beam injector with 100 keV beams and 10 MW
heating power
• 2001 tangential neutral beam injection for off-axis current drive
experiments
• 2001 adaptation of the closed lyre-shaped divertor to plasma
configurations with a high triangularity shape. The three divertor designs
which have been used are illustrated in Fig. 12.6.2.
A large set of diagnostics to characterize the core, edge, and divertor
plasma conditions provide for the physics programme with the following
main objectives:
• Particle and energy transport in the core plasma, operation boundaries,
and confinement
• Conventional and 'advanced' tokamak scenarios for performance
improvement
• Physics of plasma in-stabilities and their active stabilization
® Plasma edge and divertor physics as well as first wall materials.

Fig. 12.6.2 Evolution of divertor
configurations in ASDEX Upgrade DIV I
A991 -1997), DIV n A997-2000),
DIV lib adapted to higher tnangulanty
Fig. 12.6.3 (i) Computer modelling of
the radiation pattern predicts radiation
bands between X-point and strike points,
(ii) The reconstructed radiation pattern
using virtual lines of sight dunng a vertical
siiift of the plasma reveals a narrow
radiation zone from the inner strike point
to the X-point. A corresponding band at
the outer strike point cannot be detected
due to missing bolometer lines of sight.
Divertor physics
A principal purpose of ASDEX Upgrade is to test concepts for power and
particle exhaust. ASDEX Upgrade came into operation with the open
divertor configuration, DIV I, characterized by flat horizontal divertor
plates made from fine grain graphite. The outer divertor plate was put
close to the X-point to benefit from the large flux expansion in that region.
It had only a small pumping baffle in the outer divertor, which nevertheless
was quite important for good particle exhaust. DIV I was replaced by the
fairly closed lyre-shaped divertor, DIV II, to test the physics underlying
the proposed ITER divertor, in particular the problem of exhausting power
and particles while maintaining good core confinement. In parallel the
heating power was increased to 20 MW by installing a second neutral
beam injector box.
The target plates and the roof baffle of DIV II were shaped to influence
the detachment properties by increasing the ionization of hydrogen
neutrals around the separatrix and reducing the target heat flux, especially
close to the separatrix. Experiments with the DIV II divertor show that
the maximum heat flux at the divertor plates is reduced by a factor of 2
compared with the open DIV I divertor. This reduction of the power flow
results from an increased radiative power loss, which is concentrated in
the divertor region. With DIV II, about 45% of the input power is
radiated below the X-point. Most of the divertor radiation is concentrated in
a small emission zone along the separatrix. This had been predicted by
modelling with a computer code, and a comparison with experimental
results is shown in Fig. 12.6.3.
The enhanced divertor radiation is not caused by a stronger influx
of carbon but is due to an increased radiation efficiency of carbon and
hydrogen in the divertor plasma. Carbon cools the scrape off layer plasma
down to the 5 eV region, where the hydrogen losses become significant.
DIV II was also optimized for particle compression, which is the ratio
between the neutral density in the pump duct and the averaged ion mid-
plane density near to the separatrix, as well as for impurity enrichment,
defined as the ratio of impurity compression to hydrogen compression.
The compression is of particular interest because it determines the
pumping efficiency and the degree of particle control. Hydrogen and helium
compression is much larger in DIV II than in the open divertor DIV I
as predicted by modelling. The resulting enrichment ratio for helium is
practically unchanged and the ratio of helium and energy replacement

12.6 ASDEX Upgrade
times, which has to be below 10 to 15 for a burning plasma not to be
extinguished by the heUum ash, is between 4 and 6.
DIV II was designed to fit plasma configurations with low triangularity
into the narrow divertor legs. Configurations with higher triangularities
could be run with the outer plasma fan at the top of the roof baffle, thereby
losing the benefits of the lyre-shaped configuration, especially the power
handling capacity and the pumping capability. During operation of the
lyre-shaped divertor the interest in higher triangularity plasmas increased
because of the improved confinement at higher density and the possible
access to a confinement regime with reduced ELM size. To overcome the
restriction DIV lib was introduced to accommodate a larger variety of
plasma shapes with higher triangularities.
Plasma waU interactions and first waU material
One of the most difficult design issues for ITER is the choice of plasma
facing materials, in particular for the divertor components. In most
present-day tokamaks carbon is used as divertor material due to the good
heat flux handling capacity combined with the relatively low Z. It has,
however, disadvantages, which might be unacceptable in a future fusion
device. Graphite suffers from an enhanced erosion by chemical processes
even at low temperatures resulting in deposited layers around the vessel
which incorporate up to 40% of hydrogen isotopes. The corresponding
tritium enrichment would be too high for a reactor. Tungsten exhibits
much more favourable properties with respect to erosion and other
physical properties. In addition, there is good evidence that physical sputtering
rates are lowered by prompt redeposition due to the gyro motion in the
local magnetic field. On the other hand, the high self-sputtering rates
make the use of tungsten feasible only for low plasma temperature, high
density divertor conditions. Due to the high radiation power of tungsten,
its fractional abundance in the main plasma should be substantially below
lO""*. To investigate the suitability of tungsten in a divertor tokamak under
reactor relevant conditions, the power receiving fine grain graphite plates
of the open divertor DIV I were coated with a 0.5 mm thick layer of
tungsten. The major points of interest were the investigation of erosion
and deposition processes, the transport of tungsten into and within the
bulk plasma, as well as the effect on the plasma performance. The
discharges used cover almost the full operational space of plasma current,
density, and auxiliary heating power. The averaged power load at the
divertor plates reached 6 MW/m^ whereas the peak power load during
type I ELMs was a factor of 3 higher.
The tungsten concentration in the confined plasma was investigated
spectroscopically. Over 90% of the investigated discharges show
concentrations below 2 X 10~^. The tungsten concentration was strongly
dependent on transport properties and generally decreased with an
increase of additional heating power. A few discharges with counter
neutral beam injection, strongly peaked density profiles, or low energy neutral

12.6 ASDEX Upgrade
:r divertor
Fig. 12.6.4 Migration pattern for an
ohmic discharge wjth a density of
2 5 X lO'^ m~^ and a tungsten
concentration of about 10^^ Only the
fraction 2x10^^ of the initially sputtered
tungsten can leave the divertor region 85%
are promptly redeposited and about 15%
stay in the divertor due to the divertor
beam heating show tungsten accumulation due to a strong inwards drift
compared with the anomalous transport.
Erosion and redeposition was measured by exposing target tile probes
by means of a manipulator system and by post mortem investigation of
long term probes exposed to the divertor and the scrape-off layer plasma.
The migration pattern for an ohmic discharge is shown in Fig. 12.6.4. The
low sputtering yield for plasma temperatures below 20 eV and the high
retention leads to low erosion and negligible migration of tungsten into
the main plasma.
The density and the y6 limits remain unchanged and no detoriation in
the energy confinement occurs. The H-mode threshold and the radiating
boundary scenarios are also unaffected. These results are encouraging for
high-Z plasma facing components to be used in a future device. ASDEX
Upgrade started in 1999 with a programme to replace inner vessel carbon
tiles by tungsten. In three steps the lower, the upper, and then the
central part of the inner heat protection shield were covered with tungsten.
Discharges in all major plasma regimes were performed and specially
dedicated limiter discharges were produced with the closest possible
distance to the tungsten tiles. Generally the tungsten concentration stayed
below 10~^, except discharge types revealing a strong peaking of the
background density profile. With these encouraging results it was decided
to expand the tungsten covered area step by step towards a full tungsten
covered inner wall.
Plasma edge related operation boundaries
It has been shown that various operation boundaries have their cause
at the plasma edge. With a well equipped diagnostic configuration
investigations were made of the physics of the H-mode transport
barrier at the plasma edge, the causes for the density limit, the physics of
ELMs and the connection of edge parameters and the overall plasma
confinement. The edge operational limits can be summarized by combining
the edge parameter dependence of various operational regimes in a single
diagram. In the so called 'edge operation diagram' shown in Fig. 12.6.5
various operation areas with respect to electron density and electron
temperature can be distinguished and scalings for critical parameters can be
derived.
The operational space in this diagram is limited at high edge pressure
gradients by ideal instabilities. A lower temperature limit is given by the
onset of MARFE thermal instability below T^ ^ 90 eV, which occurs
at sufficiently high edge density. The L-H threshold in terms of local
parameters represented by a critical temperature is:
^\eV)
' '^^ V 1019
-0 3
8rU
/p in MA.
The type of ELMs observed varies along the ideal pressure limit from
type III to type I with a small ELM free region.

12.6 ASDEX Upgrade
Fig. 12.6.5 Edge operational diagram
showing regime boundanes for discharges
with /p = 1 MA, B, = 2.5 T, 5 = 0.2.
Te and n^ were taken at a position 2 cm
inside the separatrix in order to represent
absolute values as well as gradients in the
steep gradient region. The dashed line
marks the ideal ballooning limit at a
normalized electron pressure gradient of
tte = 1.2, and assuming a gradient length
pfVp = 3 cm to convert the pressure
gradient to the electron temperature in this
boundary electron density [10"m-3]
Fig. 12.6.6 Completely detached
H-mode discharge. During the Neon gas
puff the divertor detaches as indicated by
the reduced heat flux, and the type I ELMs
vanish This reduction of the maximum
heat flux to the outer divertor is achieved
without a reduction of plasma stored
energy.
5
MW
05
MJ
10^°s 5
MwWi
1 Neutral beam heating
r^ Plasma energy
1 Neon influx
1^ ^
Maximum heat flux
u.
Type I ELMs are expected to cause an intolerable energy impact onto
the divertor of next step fusion experiments. A favourable operational
point in this diagram would be with the occurrence of type III ELMs
near to the ideal pressure limit. The boundary temperature should be low
enough to avoid non-stationary ELM-free H-phases. Type HI ELMs are
obtained either by low heating power just above the H-mode threshold
or, at high power flux, by feedback-controlled impurity radiation using
for example neon as a seed. This latter scenario is found in completely
detached H-mode discharges, which in addition to favourable small ELMs
exhibits full detachment of the divertor, as shown in Fig. 12.6.6. The level
of confinement in this regime may crucially depend on whether a complete
determination of bulk temperature and density profiles by edge stability
limits can be avoided.
An operational window which avoids type I ELMs but keeps good
confinement at high density has been established. This H-mode regime
with type 11 ELMs was obtained for ^95 > 3.5 and an averaged
triangularity 8 > 0.42. The magnetic configuration was close to double null
and the density could be kept just at the empirical Greenwald limit. For
these plasma conditions steady state type II H-modes without any type I
ELM were observed, limited only by the length of the plasma-current
flat top phase. The energy confinement is close to that of type I ELMy
H-mode and H-factors of //nggy = 0.95 have been achieved. The target

12.6 ASDEX Upgrade 693
load during type 11 ELM phases as measured with thermography shows
no large temporal variations and is comparable to the averaged target load
measured in type I ELM discharges.
The experiments indicate that the consequences of edge stability limits
go beyond mere changes of edge parameters such as the edge pedestal
shape or transport across the edge barrier. For a given ideal ballooning
limit, it is observed that core temperature profiles of electron and ion
temperature differ only by an approximately constant factor for a wide range
of plasma parameters. This stiffness of temperature profiles, together
with very flat density profiles typically achieved with edge fuelling by
gas puffing in conventional scenarios, links the edge pressure gradient to
the stored energy and hence the global confinement. Consequently, the
favourable density and magnetic field dependence of ITER H-mode scal-
ings seems to be modified. A confinement improvement can be achieved
in magnetic configurations with higher triangularity which have higher
values for the ideal ballooning limit due to the increased magnetic shear.
normalized poloidal radius
Fig. 12.6.7 H-mode ion temperature
profiles measured dunng a density scan
(lines) and for on- and off-axis heat
deposition (symbols) are stiff with a
constant temperature gradient length
TI'^T in the confinement region between
0.3 and 0 8 of normalized poloidal radius
Confinement and transport studies
Confinement studies of conventional L- and H-modes indicate that the ion
and electron temperature profiles are generally limited by a cntical value
of the temperature gradient length, (VT/T)"^. The resulting stiffness
of the profiles is reflected by the proportionality between core and edge
(or pedestal) temperatures. This means that the temperature profiles
plotted on a logarithmic scale keep the same shape and are shifted vertically
according to the edge temperature as shown in Fig. 12.6.7. Clearly, for
stiff profiles, the edge temperature is an essential parameter for the
profile behaviour and consequently for confinement. The observation that the
temperature profiles are stiff was studied in more detail after upgrading
one neutral beam injection line to a higher beam voltage of 93 kV. At high
plasma densities the 60 and 93 kV neutral beams result in rather different
deposition profiles at otherwise unchanged parameters. The reaction of
the plasma transport to these different heating power profiles was
investigated. The measured temperature profiles are unaffected by the change
in the beam energy, shown in Fig. 12.6.7. The power balance analysis
shows that the heat flux is significantly higher for the 93 kV compared
to the 60 kV beam, owing to the deeper beam penetration. At midradius
the difference amounts to a factor of almost 2. This leads to quite
different effective heat diffusivities, despite the same temperature and density
profiles. It is clear that the heat conductivity adjusts itself to maintain the
observed stiff temperature profiles.
Analysis indicates that the physical mechanism causing such a profile
self-organization is plasma turbulence driven by ion temperature
gradient modes, trapped electron modes, and possibly electron temperature
gradient modes, which causes a strong increase of the heat transport
for temperature gradient length below the critical value. This
mechanism IS not necessarily valid in the plasma centre, where the profiles are

12.6 ASDEX Upgrade
determined by sawtooth activity and at the edge, where the temperature
is so low that other turbulent modes are expected to dominate.
In discharges with pure electron heating, the local heat diffusivity
for electrons, Xe, was measured with Tg modulation by heat pulse
experiments using the ECRH heating system and the electron cyclotron emission
diagnostic. The propagation of modulated ECRH power deposited at a
fixed radius inside the plasma is analysed using the standard method based
on Fourier transform of the Te modulation, and the corresponding
transport coefficient Xe is deduced. VTe/Tg at the fixed radial position was
varied by a power scan. The result shows clearly a threshold in VTg/Te
where already a small increase in VTg/Te results in a strong increase of
Xe by about one order of magnitude.
line averaged density A0 m )
Fig. 12.6.8 The strong degradation of
stored plasma energy with increasing
density build up in discharges with gas
puffing (solid line) could be mitigated by
pellet fuelling with high field side pellet
injection (dots) The temporal evolution is
into the direction of higher density.
Particle transport, fuelling and density profile
Density control by strong gas puffing from the plasma edge is
accompanied by a reduction of the edge temperature and, through profile stiffness,
by confinement degradation. Central plasma refilling can avoid the
temperature degradation and, in addition, may lead to peaked density profiles
and a confinement improvement. Experiments with a moderate gas puff
also reveals the option to increase the confinement by density peaking
without deterioration of the edge parameters (see Fig. 12.6.8).
The effect of pellet injection with different systems on the plasma
density and performance was intensively investigated. Density feedback
control was achieved at levels well above the empirical Greenwald density
limit with injection from the low-field side. But it turned out that the high
pellet particle fluxes result in a degradation of the particle confinement
time. This effect is enhanced by ELMs tnggered for each single pellet
during H-mode phases. With the high particle fluxes and the particles
expelled by the pellet-triggered ELM the energy stored by these particles
is also lost from the plasma. Consequently, strong pellet refilling at low
refuelling efficiency, can cause high convective losses and confinement
degradation. The refuelling efficiency of pellets coming fi-om the low-
field side decreases with increasing heating power, since in hot plasmas
the material ablated by the pellets is rapidly shifted to the plasma edge
and even partially expelled from the plasma. This is because the ablation
cloud of a pellet sucks energy and a localized plasmoid with high internal
pressure is formed. This diamagnetic plasmoid represents an extremely
localized perturbation that is, subjected to a magnetic field gradient,
drifting towards lower fields. This dnft is beneficial if the pellet is injected
from the magnetic high field side because it pushes the plasmoid to the
plasma centre As a result plasma particle and energy losses are reduced
due to the nearly perfect absorption of the pellet matenal.
As found for low-field side pellet injection the high-field side pellets
also tngger an ELM but the related energy and particle losses are much
smaller The fuelling efficiency increases with the penetration depth,

12.6 ASDEX Upgrade 695
which depends on the pellet velocity. The ELM burst losses are of
transient nature with a timescale for plasma energy recovery after a pellet
sequence significantly shorter than the particle confinement time. This
allows transient operation at enhanced density without confinement loss
in respect of the initial conditions on a timescale of particle confinement
time after the last pellet. A further increase in pellet speed results in
pellet induced density ramps suffering less reduction of confined energy and
approaching an adiabatic fuelling behaviour with density increase moving
along an isobar. A first step towards this goal was made by upgrading the
pellet guiding system to cope with pellet speeds up to 1000 m s~Mn 1999.
High density H-mode discharges with moderate constant gas puff and
off-axis heating both with ICRH and NBI show a slowly evolving
density peaking which yields high central density values at unchanged edge
density and electron temperature. The energy confinement is therefore
increased compared to discharges with flat density profiles. A
peculiarity of such scenarios is that the equilibration time for peaked profiles is
much longer than the energy confinement time. This means that these
long time constants have to be considered for determination of a steady
state situation and not the energy confinement time which is commonly
used. The degradation of confinement in phases with increasing gas puff
may be due to such non equilibrated density profiles as long as the
confinement regime is not changed. The equilibrium shape of the density
profiles depends on the heat flux profile in the core plasma. This, and the
rate of peaking, could be modelled supposing that energy and particle
transport due to turbulence is coupled to a certain extent and the
neoclassical inward pinch is active. The ratio of particle and energy diffusivity
of 0.1-0.2 derived from the model calculations corresponds well to the
observation that the density equilibration time is much longer than the
energy confinement time. The density peaking is strongly reduced by
central heating with ICRH. This is due to the increase of the central heat
diffusivity which, according to the model, also causes an increase of the
particle transport. As a consequence, flat density profiles are expected in
a reactor with central heating.
Advanced scenarios and internal transport barriers
The confinement performance of plasma discharges with stiff temperature
profiles and flat H-mode density profiles is mainly fixed by the edge
pedestal pressure. Tailoring of the density profile, by density peaking,
allows an optimization of the plasma stored energy. A more effective
procedure is to suppress the turbulent radial transport and to break the
temperature profile stiffness. This results in so-called internal transport
barriers inside the bulk plasma. These barriers yield a surplus of plasma
energy inside the barrier compared with the presence of a single edge
barrier. Additional conditions for these high confinement scenarios are
that they are mhd-stable at these higher plasma pressures and that they can
be maintained in a stationary state. Basically a reactor with such features

12.6 ASDEX Upgrade
1 ^**'p^'*^
/
'
t V i??''<>2
iUi^0^ "^"gw
^
'A
^
■^Z'"''
I MW lljk maximum heat flux I
Fig. 12.6.9 High ^n discharge with
reduced ELM activity as seen in a
reduction of the maximum heat flux.
can be more compact than with a conventional concept. This has led to
the study of the possibilities for stationary tokamak operation with such
advanced scenarios combined with full non-inductive current drive by the
internal bootstrap current and external driven currents.
Steady state improved H-mode plasmas have been approached by a
combination of improved core confinement through density peaking with
an ELMy H-mode edge and stiff temperature profiles. While the pressure
gradients are distinctly enhanced in these cases, the overall performance
and the pulse length was increased. Quasi steady-state high performance
discharges were obtained by applying moderate neutral beam heating
in the current ramp-up, in order to reduce current diffusion and hence
generating flat current profiles to delay the formation of an m = 1, n = 1
resonant ^-surface. On approaching ^ = 1 in the core, strong m = 1,
n = 1 fishbone instabilities, driven by trapped particles from neutral
injections occur, preventing sawtooth activity and triggering the build-up
of a peaked density profile. The impurity concentration is regulated by
the core fishbones and ELMs at the edge. The high performance phase
lasts for 6 s or 40 energy confinement times, only limited by the duration
of the NBI. The highest fusion product obtained is noTotE = 1.1 x
10^" m"^ keVs and y^N x ^iter89-p = 7-5, which serves as a figure of
merit for stability and confinement, have been achieved at a triangularity
of 5 = 0.3. A further performance increase is prevented by neoclassical
tearing modes which are the limiting instability for monotonic ^-profiles.
Special discharge scenarios were developed to extend the stable
operation without neoclassical tearing modes leading to H-mode plasmas with
y^N > 3.5 and good confinement with //iter89-p = 2.2 in steady state
for several seconds as shown in Fig. 12.6.9. The plasma configuration for
these experiments have maximum shaping with a triangularity of about
8 = 0.42 and a near double null plasma configuration. The electron
density could be increased up to 90% of the Greenwald density without a
significant loss in confinement. The ELM characteristic changes
significantly from type I to type II ELMs, the ELM energy loss being reduced
from about 3% of plasma stored energy to 0.5% during the near double
nufl phase.
The fraction of inductively driven current in a tokamak plasma can
be reduced by increasing the fraction of bootstrap current generated by
the pressure gradient. To achieve this, the poloidal y6 was maximized
by operation at low plasma current and sufficiently high heating power.
Values of y6p «:; 3 have been attained in H-mode plasmas at a plasma
current of 400 kAEt = 2T) and with up to 10 MW neutral beam heating.
With strong gas fuelling in the initial phase of the discharge and the
low plasma current the high y6p plasmas reach the Greenwald density
while keeping the H-mode confinement. The resulting performance value
is y^N X ^ITER89-P = 5 at a triangularity of 8 = 0.2. The fraction of
non-inductive driven current from the combination of large fraction of
bootstrap current and neutral beam driven current is nearly 100%.
Most of the internal transport barriers were obtained through non-
ohmic heating with up to 15 MW neutral beam injection, in the current

12.6 ASDEX Upgrade 697
ramp up phase, and mhd-stable current profiles with an L- or H-mode edge
both in limiter or divertor discharges. The magnetic shear is transiently
reversed in the centre, and internal transport barriers form with central
ion temperatures up to 20 keV and ion temperature gradient lengths much
smaller than those of the H- or L-mode. However this internal transport
barrier regime is limited by continuous evolution of the current profile
which, without an off-axis current drive method, could not be prevented.
This finally leads to a termination of the barrier by mhd instabilities in the
core or edge. Compared with the high performance H-mode discharges
described above, these discharges with internal transport barrier are
limited in performance partly by the L-mode edge and in general by the low
density achievable. However, by combining neutral beam heating and
electron cyclotron current drive, counter to the plasma current direction.
It was possible to simultaneously achieve reactor relevant temperatures of
10 keV for both electrons and ions. Pure internal electron transport
barriers were obtained with electron heating by electron cyclotron current
drive, counter to the plasma current direction, in low density discharges
yielding thermal electron core temperatures above 20 keV.
Magnetohydrodynamic stability
Magnetohydrodynamic instabilities impose a sensitive limit on the
accessible operation areas, and in particular on the confined plasma pressure.
The understanding of the physical mechanism of the instabilities is an
important precondition for the development of efficient, stable
confinement scenarios. The instability with most impact on plasma performance
in H-mode discharges with positive magnetic shear profiles is the
neoclassical tearing mode. This pressure-driven instability limits the
confined plasma pressure by the formation of magnetic islands with a flat
pressure profile inside, thus reducing the efficiency of the magnetic
confinement. The impact of the neoclassical tearing mode on the discharge
depends on the mode numbers: D,3) modes have only small influence on
confinement with less then 10% degradation, whereas C,2) modes can
reduce the confinement by 10-30% of the onginal value. The existence
of B,1) modes geneially leads to an unacceptable loss of about 50% and,
at ^95 < 3, to a disruptive termination. An understanding of
neoclassical tearing mode physics is essential for predicting their occurrence and
for developing adequate tools for avoiding or stabilizing these modes.
The critical normalized beta, ^/{I/aB), for the onset of neoclassical
tearing modes has been found to scale proportionally to the normalized
ion gyroradius, p/a, with a very weak dependence on the normalized
collisionality, yji/o)*
Since neoclassical tearing modes set the y6 limit in discharges with
positive shear, a method of removing or avoiding them is of great importance
A demonstration of the stabilization of neoclassical tearing modes was
performed with electron cyclotron current drive expenments. At beta
normalized values between 2.2 and 2 5, a C,2) mode could be completely
stabilized by applying electron cyclotron current drive power of about 10%

of the total heating power, corresponding to 15-20 kA of helical current
driven within the island, as shown in Fig 12.6 10 Once the mode is
stabilized, the normalized beta can be raised above the onset value if the total
heating power is increased and the electron cyclotron current drive is on.
Extensive modelling of the mode stabilization by electron cyclotron
current drive has been done using a cylindrical non-linear tearing mode
code. In particular, the modelling has shown that the main stabilizing
effect comes from direct generation of helical current within the island
by current drive
Fig. 12.6.10 Stabilization of
neoclassical tearing modes with electron
cyclotron current drive as indicated by the
amplitude of the m = 3, « = 2 magnetic
perturbations. /3n = 2 6 was be achieved in
steady state without these modes by raising
the neutral beam power
Bibliography
Much of the material discussed in this chapter has been
presented at the biennial international conferences sponsored by
the I A.E A , and at the annual conferences sponsored by
ae European Physical Society and the Amencan Physical
Society Details of these meetings are given in the
bibliography to Chapter 11 and individual references ansing
from these conferences will not be listed here In addition,
references given in figure captions will not be repeated
TFTR
Initial confinement results:
Efthimion, PC. et al. Initial confinement studies of ohmic-
ally heated plasmas in the Tokamak Fusion Test Reactor.
Physical Review Letters 52, 1492 A984).
Observation of neoclassical resistivity in TFTR:
Zamstorff, M.C. etal. Parallel electnc resistivity in the TFTR
tokamak. Physics of Fluids B 2, 1852 A990).
Scaling of confinement with major and minor radius in
L-mode plasmas
Gnsham, L.R. et al Scaling of confinement with major and
minor radius in the Tokamak Fusion Test Reactor. Physical
Review Letters 67, 66 A991)
Linuter conditioning for supershot plasmas
Dylla, H F etal Conditioning of the graphite bumper limiter
for enhanced confinement discharges in TFTR Nuclear
Fusion n, 1221 A987)
Achievement of the supershot regime.
Strachan, J D. et al High-temperature plasmas in the
Tokamak Fusion Test Reactor. Physical Review Letters 58,
1004A987).
Limiter H-modes in TFTR:
Bush, C.E. et al. Peaked density profiles in circular-limitei
H-modes on the TFTR tokamak Physical Review Letteis
65,424A990).
Analysis of the carbon bloom in high power heating
experiments'
Ulrickson, M. et al. A review of carbon blooms on JET and
TFTR. Journal of Nuclear Materials 176&177,44 A990)

Influence of low-m,n mhd activity on supershot performance:
Chang, Z. et al. Transport effects of low (m,n) mhd modes
on TFTR supershots. Nuclear Fusion 34, 1309 A994).
Identification of non-linear neoclassical pressure-gradient-
dnven teanng modes in supershots
Chang, Z et al. Observation of nonhnear neoclassical
pressure-gradient-driven tearing modes in TFTR Physical
Review Utters 74,4663 A995)
Analysis of turbulence suppression by radial electric field
shear in TFTR ERS plasmas
Synakowski, E.J etal Role of electnc field shear and Shafra-
nov shift in sustaining high confinement in enhanced
reversed shear plasmas on the TFTR tokamak. Physical
Review Letters 78, 2872 A997)
Observation of Kadomtsev-like sawtooth collapse
Nagayama, Y et al Analysis of sawtooth oscillations using
simultaneous measurements of electron cyclotron
emission imaging and X-ray tomography on TFTR Physical
Review Letters 67, 3527 A991)
Measurement of q@) ~ 0.7 during sawtooth activity:
Yamada, M. et al Investigation of magnetic reconnection
dunng a sawtooth crash in a high-temperature tokamak
plasma. Physics of Plasmas 1, 3269 A994).
Comparison of sawtoothing and sawtooth-free plasmas with
theoretical stability criterion.
Levinton, F.M et al Stabilization and onset of sawteeth in
TFTR. Physical Review Letters 72, 2895 A994).
Observation of medium-n ballooning modes:
Nagayama, Y et al. Observation of ballooning modes
in high-temperature tokamak plasmas. Physical Review
Letters 69,2316 A992).
Evidence for TAE modes in NBI heated plasmas-
Wong, K.L. et al. Excitation of Toroidal Alfven Eigenmodes
in TFTR. Physical Review Letters 66, 1874 A991)
Determination that local transport has Bohm-like behaviour
in L-mode plasmas:
Perkins, F W. et al Nondimensional transport scaling in the
Tokamak Fusion Test Reactor: is tokamak transport Bohm
or gyro-Bohm? Physics of Fluids B 5, 477 A993)
Initial sawtooth heat pulse propagation studies in TFTR:
Fredrickson, E.D. et al Heat pulse propagation studies in
TFTR. Nuclear Fusion 26, 849 A986).
Observation of ballistic component of heat pulse propagation:
Fredrickson, E.D et al. Ballistic contributions to heat-
pulse propagation in the TFTR tokamak Physical Review
Lewera 65, 2869 A990).
Investigation of the temperature dependence of local
transport coefficients-
Efthimion, P.C. et al Observation of temperature-dependent
transport in the TFTR tokamak. Physical Review Letters
66,421A991)
Bibliography 699
Application of beam emission spectroscopy to determine the
characteristics of plasma turbulence:
Durst, R.D. et al. Observation of a localized transition from
edge to core density turbulence in the TFTR tokamak
Physical Review Letters 71, 3135 A993)
Determination of local transport coefficients of helium
Synakowski, E.J et al Measurements of radial profiles
of He^+ transport coefficients on the TFTR tokamak
Physical Review Letters 65, 2255 A990)
First results of experiments with D-T mixtures in TFTR-
Strachan, J D et al Fusion power production from TFTR
plasmas fueled with deutenum and tritium Physical
Review Letters 72, 3526 A994)
Hawryluk, R.J. et al. Confinement and heating of a
deuterium-tritium plasma Physical Review Letters 72,
3530A994)
Evidence for electron heating by a-particles
Taylor, G et al Fusion heating in a deuterium tritium
tokamak plasma. Physical Review Letters 76, 2722
A996)
Use of lithium conditioning to improve fusion performance
in D-T supershots:
Mansfield, D K. et al Enhanced performance of deuterium-
tritium-fueled supershots using extensive lithium condi-
tiomng in the Tokamak Fusion Test Reactor Physics of
Plasmas 2, 4252 A995)
ICRF heating of D-T plasmas.
Wilson, J R. et al. Ion cyclotron range of frequency heating
of a deuterium-tritium plasma via the second-harmonic
tntium cyclotron resonance. Physical Review Letters 75,
842A995).
Measurements of fast confined a-particles in D-T plasmas:
McKee, G et al. Confined alpha distribution measurements
in a deutenum-tntium tokamak plasma. Physical Review
Letters 15, 649 A995).
Fisher, R.K. et al Measurements of fast confined alphas on
TFTR. Physical Review Letters 75, 846 A995).
Losses of a-particles due to kinetic ballooning modes:
Chang, Z. et al First observation of alpha particle loss
induced by kinetic ballooning modes in TFTR deuterium-
tritium experiments. Physical Review Letters 76, 1071
A996).
Measurements of TAE modes excited by a-particles.
Nazikian, R. et al Alpha-particle-dnven toroidal Alfven
eigenmodes in the Tokamak Fusion Test Reactor Physical
Review Letters 78, 2976 A997).
Overview of TFTR experiments in D-T plasmas.
Hawryluk, R.J. Results from deutenum-tntium tokamak
confinement expenments Reviews of Modem Physics 70,
537 A998).

JET
A summary of the scientific work on JET is given in the book:
Wesson, J. The Science of JET. JET Joint Undertaking
B000).
Analysis of ohimc energy confinement.
Bartlett, D.V. et al. Energy confinement in JET ohmically
heated plasmas. Nuclear Fusion 28, 73 A988)
Observation of neoclassical resistivity in JET:
Campbell, D J er al. Plasma resistivity and field penetration
in JET. Nuclear Fusion 28, 981 A988).
First observation of H-modes in JET'
Tanga, A. et al. Magnetic separatrix expenments in JET
Nuclear Fusion 21, 1877 A987).
Production of long steady-state H-modes'
Campbell, D.J. et al. H-modes under steady-state conditions
in JET. Plasma Physics and Controlled Fusion 36, A255
A994)
The density limit and disruptions.
Wesson, J.A. et al Disruptions in JET. Nuclear Fusion 29,
641 A989)
Error field modes:
Fishpool, G.M., Haynes, P.S Field error instabilities in JET.
Nuclear Fusion 34, 109A994).
Reduction of forces at disruptions by control of pre-
disruptive elongation:
Tanga, A. et al. Study of plasma disruptions in JET and its
implications on engineering requirements Fusion
Engineering (Proc. 14th Symp., San Diego, 1991) Vol 1, 201.
I.EE.E, New York A992).
Analysis of asymmetric vertical displacement events.
Riccardo, V. et al Parametnc analysis of asymmetric
vertical displacement events at JET. Plasma Physics and
Controlled Fusion 42, 29 B000).
Observation of a very rapid sawtooth collapse.
Campbell, D.J et al Sawtooth activity in ohmically heated
JET plasmas. A^Mc/earFuijow 26, 1085 A986)
Wesson, J.A. et al. Spontaneous m = 1 instability in the JET
sawtooth collapse. Nuclear Fusion 31, 111 A991).
Analysis of the sawtooth collapse showing
significant differences from the full reconnection model of
Kadomtsev.
Edwards, A.W et al Rapid collapse of a plasma sawtooth
oscillation in the JET tokamak Physical Review Letters
57,210A986).
Variation of q@) during sawtooth activity:
O'Rourke, J. The change in the safety factor profile at a
sawtooth collapse. Plasma Physics and Controlled Fusion 33,
289A991).
First observation of sawtooth stabilization associated with
fast particle populations'
Campbell, D J. et al StabiUzation of sawteeth with additional
heating in the JET tokamak. Physical Review Letters 60,
2148 A988).
Control of sawtooth activity by minonty ion fast wave
current drive-
Bhatnagar, VP. et al. Local magnetic shear control in a
tokamak via fast wave minonty ion current dnve:
theory and experiments in JET. Nuclear Fusion 34, 1579
A994).
Suppression of onset of neoclassical tearing modes by
control of sawtooth period:
Sauter, O. et al. Control of neoclassical tearing modes by
sawtooth control. Physical Review Letters 88, 105001
B002).
Studies of heat and particle transport using sawtooth
temperature and density perturbations:
Tubbing, B.J.D et al. Tokamak heat transport—a study of
heat pulse propagation in JET. Nuclear Fusion 27, 1843
A987)
de Haas, J.C.M. et al. Interpretation of heat and density
pulse measurements in JET in terms of coupled transport
Nuclear Fusion 31, 1261 A991)
First observation of PEP H-modes:
Tubbing, B J.D. et al. H-mode confinement in JET with
enhanced performance by pellet peaked density profiles.
Nuclear Fusion 31, 839 A991).
Rapid change of the electron thermal conductivity over
a significant fraction of the minor radius at the L-H transition:
Cordey, J G. et al. The evolution of the transport through the
L-H transition in JET. Nuclear Fusion 35, 505 A995).
Response of the local heat flux to negative temperature
gradients:
Balet, B et al. Heat transport with strong off-axis heating.
Nuclear Fusion 32, 1261 A992).
Analysis of p* scaling of local transport in L-mode plasmas-
Christiansen, J.P et al. The scaling of transport with
normalized L^armor radius in JET. Nuclear Fusion 33, 863
A993).
Isotope scaling of L-mode energy confinement:
Tibone, F. et al. Dependence of L-mode confinement on
plasma ion species in JET Nuclear Fusion 33, 1319
A993).
Influence of triangularity on energy confinement in ELMy
H-modes.
Saibene, G. et al The influence of isotope mass, edge
magnetic shear and input power on high density ELMy
H-modes in JET. Nuclear Fusion 39, 1133 A999).
Use of beryllium in JET.
The vast majority of results relating to the use of beryllium has
been reported at the biennial conferences on plasma surface
listed in the bibliography to Chapter 9 Highlights have

Bibliography
701
also been presented in invited and contnbuted papers given
at the vanous international conferences noted previously
Divertor experiments in JET:
Results from the pumped divertor have been extensively
reported in the literature, at major international conferences
listed in the bibliography to Chapter 11 and at international
conferences on plasma surface interactions listed in the
bibliography to Chapter 9. Three companion papers
summarizing many of the key results are.
Horton, L.D. et al. Studies in JET divertors of vaned
geometry I non-seeded plasma operation. Nuclear Fusion 30,
1 A999)
Matthews, G F etal. Studiesin JET divertors of vaned
geometry II. impurity seeded plasmas Nuclear Fusion 30, 19
A999).
McCracken, G.M. et al. Studies in JET divertors of varied
geometry III: intrinsic impurity behaviour Nuclear Fusion
30,41A999)
ICRF heated high-;8p plasmas with high bootstrap current
fraction'
Challis, CD. et al. High bootstrap current ICRH plasmas in
JET. Nuclear Fusion 33, 1097 A993).
Quasi-stationary operation with internal transport barriers:
Crisanti, F et al. JET Quasistationary intemal-transport-
barrier operation with active control of the
pressure profile. Physical Review Letters 88, 145004
B002)
Demonstration of 60 kW of fusion power from D-^He
reactions.
Boyd, D A. et al. ^He-D fusion rate measurements during
fast-wave heating experiments in JET. Nuclear Fusion 29,
593A989).
First observations of high fusion performance in X-point
plasmas in JET-
Balet, B etal High temperature L-and H-mode confinement
in JET. Nuclear Fusion 30, 2029 A990)
Mhd activity associated with the termination of the high
performance phase of hot ion H-modes
Nave, M.F.F. et al. An overview of MHD activity at the
termination of JET hot ion H-modes. Nuclear Fusion 37,
809A997).
Rapid change in plasma transport associated with the hot
ion H-mode termination'
Wesson, J.A. and Balet, B. Abrupt changes in confinement
in the JET tokamak. Physical Review Letters 77, 5214
A9%).
Results of deuterium-tntium experiments in JET'
The results of the PTE and DTEl experiments have been
extensively reported in the refereed literature and at
international conferences. The March 1999 (Vol 39) issue of
Nuclear Fusion contained 10 papers detailing many of the
key studies performed during DTEl. Two additional papers
which summarize the major results are:
Keilhacker, M. et al. High fusion performance from
deuterium-tritium experiments in JET. Nuclear Fusion 39,
209A999)
Jacquinot, J et al Overview of ITER physics deuterium-
tritium experiments in JET Nuclear Fusion 39, 235
A999).
JT-60/JT-60U
H-mode expenments with diverted plasmas in JT-60:
Nakamura, H. et al. H-mode experiments with outer and
lower divertors in JT-60. Nuclear Fusion 30, 235 A990).
Improved confinement with pellet injection in JT-60:
Kamada, Y. et al. Improved confinement charactenstics of
pellet fuelled discharges on JT-60. Nuclear Fusion 29,
1785A989).
Ozeki, T. et al. Ideal mhd stability of pellet fuelled plasmas
in JT-60. Nuclear Fusion 31, 51 A991)
Many experimental results from JT-60 and JT-60U on
'remote radiative cooling', impurity seeded H-modes and
divertor performance with the W-shaped divertor were
presented at the conferences on plasma surface interactions
listed in the bibliography to Chapter 9.
Impurity and radiation losses in JT-60U:
Kubo, H. et al. Study of impurity and radiative losses in
divertor plasmas with absolutely calibrated VUV spectrometers
in JT-60U. Nuclear Fusion 33, 1427 A993)
Helium exhaust measurements in JT-60:
Nakamura, H. et al Helium ash exhaust studies with core
fueling by a helium beam' L-mode divertor discharges
with neutral-beam heating in the JT-60 tokamak. Physical
Review Letters 67, 2658 A991)
Measurement of SOL flows in JT-60U'
Asakura, N. et al. Measurement of natural plasma flows along
the field lines in the scrape-off layer on the JT-60U divertor
tokamak. Physical Review Letters 84, 3093 B000).
Measurement of heat and particle fluxes at ELMs
Asakura, N. et al Fast measurement of ELM heat and
particle fluxes, and plasma flow in the scrape-off layer of the
JT-60U tokamak Plasma Physics and Controlled Fusion
44, A313 B002).
High confinement impurity seeded H-modes:
Kubo, H et al High radiation and high density experiments
in JT-60U Nuclear Fusion 41, 227 B001).
Helium transport in reversed shear plasmas
Takenaga, H. et al. Particle confinement and transport in
JT-60U Nuclear Fusion 39, 1917A999).
Increase of lower hybnd current drive efficiency with
electron temperature'
Ushigusa, K. et al. Lower hybrid current drive efficiency in
the JT-60 tokamak. Nuclear Fusion 29, 1052 A989).

702
Bibliography
Power loading of divertor during LHCD experiments.
Ushigusa, K. et al. Direct loss of energetic electrons during
lower hybrid current dnve in JT-60U. Nuclear Fusion 32,
1977A992).
Volt-second saving by LHCD dunng current ramp-up
Naito, O et al Volt-second saving by lower hybnd current
dnveinJT-60 Nuclear Fusion 30, 1137A990)
Analysis of bootstrap current and neoclassical resistivity in
JT-60:
Kikuchi, M. et al Bootstrap current during perpendicular
neutral injection in JT-60 Nuclear Fusion 30, 343 A990)
Current dnve using negative ion based NBI'
Oikawa, T. et al Heating and non-inductive current drive by
negative ion based NBI in JT-60U Nuclear Fusion 40,435
B000).
Establishment of electron transport barrier in reversed shear
plasmas.
Fujita, T et al Internal transport barrier for electrons in JT-
60U reversed shear discharges. Physical Review Letters
78,2377A997).
Fully non-inductive reversed shear plasmas
Fujita, T. et al. Quasisteady high-confinement reversed shear
plasma with large bootstrap current fraction under full
noninductive current drive conditions in JT-60U. Physical
Review Letters 87, 85001 B001).
Density limit studies in JT-60
Kamada, Y. et al Study of the density limit with
pellet fuelling in JT-60. Nuclear Fusion 31, 1827
A991).
Stabilization of current rise locked modes.
Ninomiya, H et al. Large m = 3/n = 1 locked mode
in JT-60 and its stabilization. Nuclear Fusion 28, 1275
A988).
Determination of the 'null point' for vertical instabilities.
Yoshino, R. et al. Avoidance of VDEs dunng plasma
cunent quench in JT-60U. Nuclear Fusion 36, 295
A996)
Control of runaway electrons following disruptions:
Yoshino, R. et al Generation and termination of runaway
electrons at major disruptions in JT-60U Nuclear Fusion
39, 151A999).
Observation of beta collapse in JT-60 high-/8p plasmas:
Ishida, S et al. Observation of a fast beta collapse during
high poloidal-beta discharges in JT-60 Physical Review
Letters 6S, 1531A992).
Suppression of neoclassical tearing modes by electron
cyclotron heating and cunent dnve
Isayama, A et al. Complete stabilization of a tearing mode
in steady state high-;8p H-mode discharges by the first
harmonic electron cyclotron heating/cunent drive on JT-60U
Plasma Physics and Controlled Fusion 42, L37 B000).
Observation of non-circularity induced Alfven eigenmodes
with ICRF heating.
Kramer, G J et al Noncircular triangularity and ellipticity-
induced Alfven eigenmodes observed in JT-60U Physical
Review Letters 80, 2594 A998)
Steady-state plasmas at high-/8N and high-/8p
Kamada, Y et al Non-inductively current dnven H mode
with high Pti and high Pp values in JT-60U Nuclear Fusion
34, 1605A994)
Observation of grassy ELMs in high tnangularity H-modes
Kamada, Y et al Disappearance of giant ELMs and
appearance of minute grassy ELMs in JT-60U high-tnangularity
discharges Plasma Physics and Controlled Fusion 42,
A247 B000).
High fusion reactivity expenments in high-/8p H-modes:
Mori, M et al Achievement of high fusion triple product
in the JT-60U high Pp H mode Nuclear Fusion 34, 1045
A994)
Nishitani, T etal Attainment ofhigh fusion reactivity under
high bootstrap current fraction in JT-60U Nuclear Fusion
34, 1069A994)
Observation of internal transport bamer in high- Pp H-modes:
Koide, Y et al Internal transport barrier on q = 3 surface
and poloidal plasma spin up in JT-60U high-/8p discharges.
Physical Review Letters 72, 3662 A994).
High fusion reactivity experiments in reversed shear
discharges'
Ishida, S et al. Achievement of high fusion performance in
JT-60U reversed shear discharges Physical Review Letters
79, 3917 A997)
DIII-D
First observation of H-modes in DIII-D:
Bunell, K.H. et al Observation of an improved energy-
confinement regime in neutral-beam-heated divertor
discharges in the DIII-D tokamak Physical Review Letters
59, 1432A987).
Observation of ohmic H-modes
Osborne, T.H etal Observation of the H-mode in ohmically
heated divertor discharges on DIII-D Nuclear Fusion 30,
2023A990)
Production of long steady-state H-modes.
Luxon, J L. et al Recent results from DIII-D and their
implications for next generation tokomaks. Plasma Physics and
Controlled Fusion 32, 869 A990).
H-mode threshold dependence
Carlstrom, T N etal Experimental survey of the L-H
transition conditions in the DIII-D tokamak Plasma Physics
and Controlled Fusion 36, A147 A994)
H-modes triggered by pellet injection
Gohil, P. et al Investigations of H-mode plasmas triggered
directly by pellet injection in the DIII-D tokamak Physical
Review Letters 86, 644 B001)

Bibliography
703
Analysis of giant ELMs as an edge ballooning limit.
Gohil, P. et al Study of giant edge-localized modes in DIII-D
and comparison with ballooning theory. Physical Review
Letters 61, 1603A988)
Observation of changes in the edge electric field shear at the
L to H transition
Groebner, R.J. et al. Role of edge electric field and poloidal
rotation in the L-H transition. Physical Review Letters 64,
3015A990)
Use of majonty ions for edge electric field measurements
Kim, J etal Rotation charactenstics of main ions and impu-
nty ions in H-mode tokamak plasma Physical Review
Letters 12, 2199 A994)
Analysis of local transport in L-and H-mode plasmas
Jahns, G L etal Comparison of transport in H-and L-phase
discharges in the DIII-D tokamak. Nuclear Fusion 29,
1271A989)
Influence of safety factor on H-mode energy confinement in
DIII-D
Schissel, DP et al Examination of energy confinement in
DIII-D at small values of the plasma safety factor Nuclear
Fusion 32, 107A992)
Off-axis ECR heating experiments exhibiting a negative
effective thermal diffusivity:
Luce, TC et al. Inward energy transport in tokamak plasmas
Physical Review Letters 68, 52 A992)
Dimensionless scaling of electron and ion transport in
L-mode plasmas
Petty, C C et al Gyroradius scaling of electron and ion
transport Physical Review Letters 74, 1763 A995)
First observation of the VH-mode
Jackson, G L etal Regime of very high confinement in the
boronized DIII-D tokamak. Physical Review Letters 67,
3098A991)
Confinement and stability properties of VH-modes
Osborne, T H etal Confinement and stability of VH mode
discharges in the DIII-D tokamak Nuclear Fusion 35, 23
A995).
Observation of enhanced confinement in plasmas with high
internal inductance
Lao, L L et al High internal inductance improved
confinement H-mode discharges obtained with an elongation ramp
technique in the DIII-D tokamak Physical Review Letters
70, 3435 A993)
Improved confinement in plasmas with negative central
shear-
Strait, EJ et al Enhanced confinement and stability in
DIII-D discharges with reversed magnetic shear Physical
Review Letters 75, 4421 A995)
High fusion performance in highly shaped negative shear
Lazarus, E.A et al. Higher fusion power gain with current
and pressure profile control in strongly shaped DIII-D
tokamak plasmas. Physical Review Letters Tl, 2714
A996).
Quiescent double barrier regime.
Greenfield, C M. et al. Quiescent double barrier regime in
the DIII-D tokamak. Physical Review Letters 86, 4544
B001)
Studies of vertical stability with plasma elongation up to 2 5
Lister, J B et al Expenmental study of the vertical
stability of high decay index plasmas in the DIII-D tokamak
Nuclear Fusion 30, 2349 A990).
Disruption mitigation by high pressure gas injection
Whyte, D.G. et al Mitigation of tokamak disruptions using
high-pressure gas injection Physical Review Letters 89,
55001 B002).
Influence of rotation and /8 on error field modes
La Haye, R J et al Non-linear instability to low m, n = 1
error fields in DIII-D as a function of plasma fluid rotation
and beta Nuclear Fusion 32, 2119 A992)
Initial expenments achieving /8 > 6%
Taylor, TS. etal Achievement of reactor-relevant p in low-q
divertor discharges in the Doublet III-D tokamak Physical
Review Letters 62, 1278 A989)
Strait, E.J. et al. MHD instabilities near the /8 limit in the
Doublet III-D tokamak Physical Review Letters 62, 1282
A989)
Influence of current profile on /8 limit
Lao, LL et al Effects of current profile on the
ideal ballooning mode Physics of Fluids B 4, 232
A992)
Observation of rotational stabilization of resistive wall mode
Strait, E J et al Wall stabilization of high beta tokamak
discharges in DIII-D Physical Review Letters 74, 2483
A995)
Garofalo, AM etal Direct observation of the resistive wall
mode in a tokamak and its interaction with plasma rotation.
Physical Review Letters 82, 3811 A999)
Density limit expenments
Peine, TW etal Plasma density limits during ohmic L mode
and ELMing H mode operation m DIII-D Nuclear Fusion
33,929A993)
Observation of q@) ~ 1 during sawtooth oscillations
Wroblewski, D, Snider, R T Evidence of the complete
magnetic reconnection dunng a sawtooth collapse in a
tokamak Physical Review Letters 71, 859 A993)
Observation of TAB modes in NBI heated plasmas
Heidbnnk, WW. et al An investigation of beam driven
Alfven instabilities in the DIII-D tokamak Nuclear Fusion
31, 1635A991)

704
Bibliography
100% non-inductive current dnve with NBI heating
Simonen, TC et al Neutral-beam current-dnven high-
poloidal-beta operation of the DIII-D tokamak Physical
Review Letters 61, 1720 A988).
Measurement of FWCD efficiency.
Petty, CC et al. Fast wave and electron cyclotron current
drive in the DIII-D tokamak. Nuclear Fusion 35, 773
A995).
First measurements of localized ECCD:
Luce, T.C. et al Generation of noninductive current by
electron cyclotron waves on the DIII-D tokamak. Physical
Review Letters 83, 4550 A999).
Experience with vanous approaches to wall conditioning,
including boromzation, and operational experience with the
advanced divertor were the subject of many presentations at
the conferences on plasma surface interactions listed in the
bibliography to Chapter 9
DIII-D power handling experience-
Lasnier, C.J. et al Survey of target plate heat flux in diverted
DIII-D tokamak discharges. Nuclear Fusion 38, 1225
A998).
Control of density in ELMy steady-state H-modes'
Stambaugh, R.D et al Divertor pumping and other
reactor application issues for H-mode. Plasma Physics and
Controlled Fusion 36, A249 A994)
Control of extnnsic impunties by scrape-off layer flows
Schaffer, M.J. et al Impurity reduction during 'puff and
pump' experiments on DIII-D. Nuclear Fusion 35, 1000
A995)
Helium exhaust studies in ELMy H-modes-
Wade, M.R. et al. Helium exhaust studies in H-mode
discharges in the DIII-D tokamak using an argon-frosted
divertor cryopump. Physical Review Letters 74, 2702
A995)
ASDEX Upgrade
An overview on radiation and heat load in DIVII is given in-
Herrmann, A. Overview on stationary and transient
divertor heat loads. Plasma Physics and Controlled Fusion 44,
883-903 B002)
Kallenbach, A et al. Scrape off-layer radiation and heat load
to the ASDEX Upgrade LYRA Divertor Nuclear Fusion
39,901-917A999).
Scrape off-layer transport
Neuhauser, J. et al. Transport into and across the Scrape-off
Layer in the ASDEX Upgrade Divertor Tokamak Plasma
Phys Controlled Fusion 44, 855 B002)
Divertor detachment and H-mode behaviour.
Gruber, O et al. Observation of continuous divertor
detachment in H-mode discharges in ASDEX Upgrade Physical
Review Letters 74, 4217-4220 A995)
Plasma performance with tungsten covered surfaces
Neu, R. et al New results from the tungsten programme at
ASDEX Upgrade. Journal of Nuclear Materials 313, 116
B003).
Rohde, V et al Operation of ASDEX Upgrade with tungsten
tiles at the central column. Controlled Fusion and Plasma
Physics (Proceedings of the 27th European Conference,
Budapest, 2000)
Confinement and core transport studies
Ryter, F et al Confinement and transport studies of
conventional scenarios in ASDEX Upgrade Nuclear Fusion 41,
537-550B001)
Pellet fuelling.
Lang, P. et al. High density operation in H mode discharges
by inboard launch pellet refuelling Nuclear Fusion 40,
245-260 B000).
H-mode discharges at high density
Stober, J. et al. Optimization of confinement, stability and
power exhaust of the elmy H-mode in ASDEX Upgrade
Plasma Physics Controlled Fusion 43, A39-A53
B001).
Advanced tokamak discharges and internal transport bamer.
Gruber, O et al. Steady state H mode and Te » Ti
operation with internal transport barrier in ASDEX Upgrade
Nuclear Fusion 40, 1145-1155 B000)
Wolf, R et al. Performance heating and current dnve sce-
nanos of ASDEX Upgrade advanced tokamak discharges.
Nuclear Fusion 41, 1259-1271 B001).
Active mhd-mode stabilization:
Zohm, H et al The physics of neoclassical teanng modes and
their stabilisation by ECCD in ASDEX Upgrade. Nuclear
Fusion 41, 197-202B001).
Disruption recognition and mitigation:
Pautasso, G etal Prediction and mitigation of disruptions in
ASDEX Upgrade Journal of Nuclear Materials 290-293,
1045-1051B001).

The future

status
In Section 1 1 the success of tokamak research was demonstrated in a
simple way by presenting a graph showing the progress in achieving
values of the parameter nTte It is appropnate here to give a somewhat
fuller account using a more precise parameter, Qdt, together with the
plasma temperature.
Recalling from Section 1.5 that Q is the ratio of the thermonuclear
power, Pfa, to the heating power supplied, Qdj is defined for a deutenum
plasma as the value of Q which would be obtained if half of the deuterium
were replaced by tntium at the same density and temperature In addition
to the greatly increased reaction rate there would also be a reduction of
the required applied heating power as a result of the contribution from
a-particle heating Thus the required applied heating power would be
reduced from Pn to Pn ~ Pa and so,
Sdt = , ^ . 13 1 1
P^-^nHav)^j8V
where 6 = 116 MeV, Pa = ^Pjn, the bars indicate spatial averages,
and V is the plasma volume
The relation of Qdj to hTte is obtained using the energy balance
equation, P^ = 3nTV/te, to replace Ph m eqn 13 1 1 Thus, taking n
and T to be parabolic with peak values n and T
Qm--
1
3 ^ 1
(ctu)dt (nfre)
T and T in KeV 13 1 2
T^/{av) being a slowly varying function of temperature (see eqn 1 5 4)
In Fig 13 1 1 contours for effective break-even Bdt = 1) and ignition
Bdt -> oo) are plotted in the (nfre, 7") plane together with the
values achieved over the years by a number of tokamaks This makes clear
the expenmental progress culminating in 2dt — 1- Furthermore, as
described in Chapter 12, expenments using D-T mixtures have
produced actual fusion powers of several megawatts In addition to this direct
progress in terms of achieved parameters there has been a vast
accumulation of information on the behaviour of tokamak plasmas, the principal
aspects of which have formed the content of this book
Having reached this point in the development of tokamaks the question
arises as to how to proceed This matter is addressed in the remaining
sections, where the plans for the future are descnbed

Fig 13 1.1 Contours for effective
break-even Bdt = 1) and ignition
Bdt -^ 00) in the (htxE, Z) plane,
together with values obtained in several
tokamaks
A0^%-^keVs)
-
-
_
-
\ \lgnition
eDT=i\
DlflD
Alcator C • , • „
FT»
Alcator A • wASDEX
TIO. -PLT
•TFR
T3»
_. , , 1 1 ._
/
^JT60U
TFTR
13.2 strategy
The successful development of tokamaks over four decades has brought
the subject to the point where a reactor is in sight This is not to say
that the case for a commercial reactor has been proven, but rather that the
general requirements and features of an experimental reactor can be seen.
Of course there are problems and uncertainties, it could not be otherwise
However none of these appear to present insoluble difficulties and it is
now necessary to choose the best way forward
The obvious way to identify the issues to be resolved is to attempt the
design of an experimental reactor. In addition to an enumeration of the
questions to be answered, such a procedure provides a deeper insight into
the true problems
This was the strategy adopted by the 'fusion community' It was
recognized that the level of support available meant that the sensible
way to proceed would be through international collaboration As a result,
an agreement was reached between four partners—the European
Community, Japan, the USSR (later the Russian Federation) and the USA
Their decision was to design a tokamak which would ignite and produce
fusion power in the GW range The name given to this tokamak is ITER,
the International Thermonuclear Experimental Reactor
The Conceptional Design Activity (CDA) for ITER was started in 1988
and completed in 1990. This was followed by the Engineering Design

13 3 Reacto r req u i rements
Activity (EDA), carried out on three sites—San Diego in the USA, Naka
in Japan, and Garching in Germany which produced a design for ITER
in 1998
The estimated construction cost of ITER was 6 bilhon A989) dollars
This cost was found to be unacceptable at the present stage and it was
decided to proceed to the design of a less expensive device which would
address the same issues at the original design but would not necessarily
reach ignition The target for the new design would be a ratio, Q, of fusion
power to input power of 10 rather than the infinite values of Q implied by
igmtion. A further development was the withdrawal of the United States
from the partnership in 1998. They rejoined in 2003 together with new
partners China and South Korea
The following sections outline first the design issues and then bnefly
descnbe the physics and engineering parameters of both 'Ignition ITER'
and 'High-2-ITER'.
Reactor requirements
The pnncipal areas which determine the design are
A) confinement
B) disruptions
C) exhaust
D) technology
and these will be discussed in turn
Confinement
The influence of confinement on the requirement for an ignited tokamak
was discussed in Section 1.7. It was shown there that the plasma current
required is / = 30///(MA) where H is the confinement improvement
factor over L-mode scaling. This immediately raises the matter of the
confidence in the scaling and the practicality of the regimes of enhanced
confinement. These are matters of uncertainty and this uncertainty
imposes a conservative design, with a current greater than 20 MA.
A new confinement issue arises in a reactor. What happens to the
a-particles produced in the fusion reaction'' The a-particles are confined
by the magnetic field, and the number which can be tolerated in the plasma
is limited. For a given confined energy each a-particle reduces the number
of reacting deuterons and tntons. The rate of production of a-particles is
given by Paj^a where Pa is the thermonuclear power in the a-particles
and ga (= 3.5 MeV) is the energy of each a-particle. This is equal to the

13.3 Reactor requirements
loss rate Na/ta where A^q, is the total number of a-particles in the plas
and Xa their confinement time. Thus
Para
The power is related to the energy confinement time through
3NT
where A^ is the total number of electrons and re the energy confinement
time Combining eqns 13 2 1 and 13 2.2 gives
^ = 51!. 13.3.3
N Sa tE
For r = 14 keV, eqn 13 3 3 becomes
^=0.012—
N tE
The tolerable level of Na/N is not a precise figure but it is clear that
Za must not be very much greater than te. To keep the a-particle
concentration below 10% requires Tq, < Ste.
The subject of a-particle confinement is linked to the general
confinement question through the behaviour of impunties in H-modes It
IS found that impunties tend to accumulate in the best confined H-mode
plasmas and relief is only obtained when the confinement is reduced
by ELM activity There is therefore a conflict between the requirement
of good confinement and the need to minimize impunties and to expel
a-particles
Disruptions
Disruptions have three types of implication for a reactor. In the first place
the existence of dismptions limits the operating space In the second they
give nse to large forces in the vacuum vessel and other components as
discussed in Section 7.9 Thirdly there is the question, particularly for
the longer term, as to the extent to which disruptions can be avoided.
In present tokamaks disruptions limit the edge density and the edge
value of q The low q limit is around ^95 — 2 and this limit can be avoided
by operating at a value which leaves a margin of safety, say ^95 = 3.
It IS possible therefore, by choosing the operating conditions, to avoid
systematic disruptions. However, in practice disruptions also occur away
from the operation boundanes. These disruptions are usually due to an
unsatisfactory time development of the profiles and, with care, can be
avoided A further type of disruption often results when there is a
vertical plasma displacement following the loss of feedback control of the
vertical instability described in Section 7.12 Other disruptions are due to

13 3 Reacto r req u i rements
transient impurity influx or falling fragments of solid matenal Whether
such disruptions can be completely avoided is at present a matter for
conjecture.
The effect of q constraints was discussed in Section 1 7 where
the approximate requirement RBtp> F5///) mT was obtained Thus a
toroidal magnetic field in the plasma of 6T implies a major radius of
9 m for a confinement enhancement factor of one, and a proportionately
smaller radius as H is increased
Exhaust
The problem of heat exhaust arises from the need to unload the a-particle
heating. The a-particle heating amounts to 20% of the fusion power and,
being deposited in the plasma, must be transmitted to material surfaces
outside the plasma These can, in pnnciple, be either surfaces facing
the main plasma or surfaces within a divertor system. The requirement
of minimizing the introduction of impurities into the plasma seems to
favour the divertor solution
However the divertor is subject to a severe difficulty arising fi^om the
narrowness of the scrape-off layer channel which transmits an enormous
heat flux density to the divertor.
The heat flux into the scrape-off layer, per unit toroidal length, can be
written
dT InanxT
h ~ —Inany— — , 13 3.4
dr X
where X is the scrape-off layer thickness This must equal the heat flux
along the scrape-off layer to the divertor, which can be wntten
h-3nT (-cs)x, 13 3 5
where L is the connection length along the magnetic field and Cg is the
sound speed The quantity {a/L)c^ can be thought of as the component of
the parallel flow speed in the poloidal plane. From eqns 13.3 4 and 13 3 5
the scrape-off thickness is given by
X^CMV'^ 13 3 6
For L = 30 m, X = 2 m^ s~^ and Cg = 10^ m s"^ the scrape-off layer
thickness A ~ 3 cm.
Taking 3 GW of fusion power the thermal heat flux is 600 MW. Thus
for a toroidal circumference of 50 m and hence a scrape-off area of 2 x
50 X 0 03 m^ = 3 m^, the power load would be 200 MW vcT^ This is a
completely unacceptable power load to a material surface and presents a
major design problem for a reactor Possible sources of amelioration are
inclined surfaces which spread the load, plasma radiation to reduce the
surface heating, and the use of a gas target to protect the material surface

by diffusing the heat flux A further problem is the erosion of heat loaded
surfaces as a result of sputtenng and evaporation
Technology
The first wall will need to be maintained at a temperature around 600 °C,
and to receive and survive the neutron flux associated with a GW power
level The blanket will have a cooling system to remove the deposited
power and must have a tritium breeding capability with an associated
tntium handling system
To avoid the unacceptable ohmic heating losses of normal conductors
the toroidal field coils must be superconducting with a magnetic field in
the coil ~ 13 T Even higher fields have been proposed The production of
massive coils with these properties has required substantial development
The coils must carry the large magnetic stresses of normal operation
and also be able to accept the transient forces which would arise from a
disruption.
The plasma current must be maintained, preferably in a steady state
but possibly for long pulses. Steady state current dnve would require an
RF system This would have to be supplied with electncal power and
the consequent recirculating power fraction constitutes a drain on the
efficiency of the reactor However, the current dnve requirement can be
much reduced by the existence of the internally driven bootstrap current.
Many components of the reactor will require control systems. The
plasma position is intnnsically unstable and requires feedback control,
and the fuelling must be adjusted to control the burning plasma.
Furthermore a wide range of systems need to be monitored and fault control
systems need to be installed to reduce the effect of unplanned events such
as disruptions
Dunng the ITER engineenng design phase there has been a large
amount of technology development with the production of prototypes
of all the major components and their maintenance systems. Although
designed specifically for ITER, these prototypes demonstrate the viability
of fusion technology more generally
ITER
The initial aim of the ITER programme was to design a tokamak which
could demonstrate controlled ignition and extended bum in deutenum-
tritium plasmas. Such a tokamak would require development of
technologies necessary for an integrated reactor system, and would allow the
testing of high heat flux, and neutron flux, components.

Table 13.4.1 Principal parameters of the Outhne
Design for Ignition ITER The values of fusion power
and bum time are nominal values
Fusion power
Bum time
Plasma current
Major radius
Plasma minor radius
Elongation
Divertor
Toroidal field (at major radius)
Toroidal field npple at
edge
15GW
1000 s
21 MA
8 14 m
2.8 m
16
Single null
5.7 T
±2%
The guiding design principles were (i) to minimize the number of
components, (ii) to simplify each component, (lii) to increase the reliability
of key systems, (iv) to design for intrinsic safety and flexibility, and (v) to
favour reactor relevant technologies
The pnncipal design parameters of Ignition ITER are set out in
Table 13 4.1 and drawingsof the layout are given in Figs 13 4 1 and 13 4 2.
In the design, the toroidal field is produced by 20 superconducting
coils. The field at the coils is 13 T and this would require niobium-tin
technology To limit the nuclear heating and insulation degradation in the
coils the minimum thickness of the blanket-shield and vacuum vessel is
~13m.
Some additional heating would be required to reach ignition, and
around lOOMW was planned, the type of heating not being decided.
At Ignition the plasma would have an average temperature ~10keV and
adensity ~102°m"^
The nominal fusion power was 1.5 GW For stationary bum
conditions with ~15% He ash the D-T bum-up rate was ~10 mgs~^ The
fusion power level would be feedback controlled through a combination
of the fuel input rate, the auxilliary heating and the helium pumping rate
Possible fuel injection methods include a shallow pellet injection and gas
fuelling
The confinement required for sustained ignition was within that
predicted by the H-mode scaling law
It would be necessary to design a divertor which would reduce the
steady power flux to solid surfaces to below 10 MW m~^ It was thought
that this could be achieved by arranging that the energy exhaust along the
scrape-off layer terminated in a cold dense plasma cooled by line radiation
and interaction with a neutral gas. The concepts involved required further
development and the problem of transient heat pulses, arising for example
from mhd instabilities, needed to be addressed
The efficiency of current drive techmques in the high density operation
of ITER IS low and only a few MA could be dnven by this means A current
drive scenario would only be of value if it were associated with a low

Central _
solenoid
Preload -
structure
Vertical port
Blanket
modules
Divertor
port
Fig. 13 4.1 Cross-sectional drawing
showing the major components of Ignition
ITER
Table 13.4.2 Ignition ITER Outline Design estimated
construction costs A989 million dollars)
Superconducting magnet systems 1910
Vacuum vessel, blanket, divertor 760
Cryostat, cryoplant, vacuum and heat transport 640
Heating, fuelling, power supply and other plant 1090
Building and structures 1040
Assembly equipment and assembly 430
TOTAL
5870
plasma current, with a high beta poloidal providing a large bootstrap
current
Remote handling would be required for three types of operation,
(i) planned introduction of a new component, (ii) renewal of components

Cryostat
Fig. 13.4.2 Drawing giving an overall
view of the layout of Ignition ITER
Divertor
cooling
pipes
eroded by the plasma, and (lii) repair of faults. This last requirement
should be minimized by high reliability components and duplication of
vulnerable components with difficult access.
The estimated costs are summarized in Table 13.4.2.
High-e ITER
The design of High-2 ITER did not preclude the possibility of ignition
but the objective was that the device should achieve extended bum with
a ratio of fusion power to auxiliary heating power of at least 10 and with
a duration sufficient to reach stationary conditions on the characteristic
timescales of the plasma. The design also aims at demonstrating steady-
state operation using non-inductive current drive with Q > 5.
On the engineering side the device would demonstrate the
implementation of superconducting coils and remote maintenance. It would also test
components for a future reactor and explore tritium breeding concepts.
The plasma performance requirements call for an inductively driven
flattop current capability during bum of 300-500 s. To carry out nuclear and
high heat flux testing requires an average neutron power load on the first
wall of 0.5 MWm~^. It is envisaged that the device would operate over
a period of approximately 20 years with up to 30,000 pulses.

13.4 ITER 715
Much sophistication has gone into assessing the requirements for
achieving Q = 10. However it is possible to illustrate the basic analysis
using the simple model introduced in Section 1.5. Thus, the definition
y{ov)SV
^ Pa
and the power balance equation 1.5.7 for Pn give
nrE{(rv)S
With the approximation for (av) given by eqn 1.5.4 and the allowance
for plasma profiles used in Section 1.5, eqn 13.4.1 becomes
nTzE
giving ignition, Q ^- oo, at nfzE = 5 x 10^^ m~^ keV s.
Equation 13.4.2 specifies the confinement time required at a given n
and T to achieve the desired Q. The target value of Q = 10 calls for
annftE value which is 2/3 of that needed for ignition. Using the large
amount of data on the scaling of energy confinement time it was decided
that to achieve Q = 10 would require a plasma current of 15 MA. The
principal design parameters are set out in Table 13.4.3.
Table 13.4.3 Principal parameters for High-2 ITER
Fusion power 500 MW
Bum time >400 s
Plasma current 15 MA
Major radius 6.2 m
Plasma minor radius 2.0 m
Elongation 1.70/1.85
Plasma volume 837 m^
Toroidal field 5.3 T at major radius
12Ton conductor
Heating/current drive power 73 MW (up to 110 MW)
The device has superconducting coils, the toroidal field coils and
central solenoid using niobium-tin cooled to 4.5 K by supercritical helium and
the poloidal field coils using niobium-titanium. The single null divertor
is made of tungsten with carbon plasma-facing components. The water
cooling system is designed to extract 750 MW of heat and the entire
tokamak is enclosed in a cryostat. Plasma fuelling is provided by gas
injection and solid hydrogen pellets.

The shielding blanket is divided into two parts. The front part has 1 cm
thick beryllium armour, 1 cm thick copper to diffuse heat, and around 5 cm
of steel. The back part is a 35 cm thick shield made of steel and water.
It is planned that once the flat top current is reached, with an inductively
driven current of 15 MA, subsequent fuelling and plasma heating for
~100 s will produce a \ugh-QD-T run with a fusion power of 500 MW.
Then with non-inductive current drive the bum duration is envisaged to
be extended to 1 hour.
Figures 13.4.3 gives a cross-sectional drawing showing the major
components of High-2 ITER and Fig. 13.4.4 gives an overall view.
The estimated costs are summarized in Table 13.4.4 which uses 1989
dollars to facilitate a comparison with the expected cost of Ignition ITER.
The 2755 million A989) dollar cost of High-Q ITER is about half that
of Ignition ITER. Using an inflation factor of 1.39 for 1989/2000 gives a
cost estimate in year 2000 prices of 3829 million dollars.
Fig. 13.4.3 Cross-sectional drawing
showing the main components of High-g
ITER. PF and TF refer to the poloidal and
toroidal field coils.
GRAVITY SUPPORT

Fig. 13.4.4 Cutaway vi
High-e ITER
Table 13.4.4 Estimated capital costs of High-2
ITER (million A989) dollars).
Magnet systems
Vacuum vessel, blanket, divertor
Other core components
Assembly
Buildings
Power supplies
Cooling water systems
Cryoplant
Other auxiliaries
Heating and current drive
Diagnostics and CODAC
762
471
139
93
380
215
131
89
101
1465
916
206
168

13.5 Prospects
13.5 Prospects
Power plant
In moving from ITER to a demonstration power-plant, the main step will
be the integration of the physics and technology developments. Most of
the physics issues will be the same as in ITER with limited extrapolation,
but the issues of operating continuously, or semi-continuously will come
to the fore. A power plant must produce power most of the time, not in
pulses interspersed by sigmficant downtime. This factor would already
have been explored in ITER but will become very important in
demonstrating fusion's ability to produce electricity in a dependable way. In a
tokamak power plant this will require either an efficient form of current
drive, which looks feasible but remains to be adequately demonstrated,
or operation in long pulses with a high duty cycle.
The main technology development will be the use of a full power-plant
blanket. This will perform the dual function of generating tritium for use
in the plasma (through the transmutation of lithium) and providing the
structure containing the coolant which carries the heat away to generate
electricity. Although tests will inevitably be carried out in advance, this
will be the real demonstration of the integration of blanket technology in
the environment characteristic of a fusion power plant.
The step to a demonstration power plant is a key one, which must
combine all the developments in establishing, sustaining, and
controlling plasmas, with all the technology of superconducting magnets, power
handling, and tntium generation. This must be achieved without
compromising the passive safety features and good environmental properties that
can be achieved in a fusion power plant, and must still allow the power
to be generated in an economically viable way. Conceptual designs of
such power plants exist and appear to be feasible, however it will only
be by building such a device that the establishment of fusion power as
a commercial reality will be established. This remains a goal for the
future—the near term goal for the development of fusion power is the
building of ITER or a similar device with a high power gain.
In considering the various power producing systems available
additional weight is now given to the potential harm to future generations
resulting from the deterioration that they may cause to the natural
environment. This supports the development of future energy supplies with
reduced levels of pollution. The present trend in the future energy market
towards lower polluting, more sustainable energy sources lends support
to the need for fusion research.
Estimates of the costs of a future power plant, use conceptual
designs based on our present knowledge, making some allowance for

13.5 Prospects 719
developments that are foreseen in the coming decades. The likely errors
will result from unexpected technological developments, for instance the
development of a cheap, room-temperature superconductor which could
be used for the magnets, seen at present to be the biggest single cost item
in a fusion power plant. However, using conventional materials in the
designs, it should be possible to make reasonable estimates of the costs.
In practice, it seems most sensible to consider a range of power plant
designs, with different degrees of assumed developments, to give a likely
range for the cost of electricity. This approach is supported by looking at
the cost of electricity around the world at the present day, which shows
variations by a factor of more than two between countries even when
the same technology is employed. Since the present cost of electricity
lies in such a wide range, it does not seem reasonable to expect a single
figure for a future cost of electricity of a power source that is still under
development.
The costing of conceptual fusion power plants gives, as expected,
different results in different countries. The overall outcome, however, is
that fusion costs lie in a range comparable to the range for projections for
other power sources. This means that, using present conceptual designs,
fusion is not ruled out on the basis of costs.
An alternative view of the economics of fusion can be gained from
looking at the development of the cost of experimental devices. Although
these will tend to be high because they are one-off devices with high
levels of diagnostics, they give an indication of the level of costs to be
expected. This approach suggests that a prototype plant in the gigawatt
range will have a commercially acceptable cost.
Outlook
The development of fusion power is at an important decision point where
the commitment to move to a next generation of experiment is required.
With the prospect of fusion as an energy source coming closer to technical
demonstration, the role that fusion could play in the future energy market
becomes an important issue.
Although commercial viability will depend primarily on the direct
costs of fusion, the market in which fusion would have to compete is
uncertain. Increasing weight is being given to the external costs of energy
generation associated with safety and environmental issues, and these will
move market conditions favourably for fusion.
Overall the potential value of a future energy option, capable of
supplying a large fraction of mankind's energy needs, is so high that it would
seem unwise to neglect it. Rather, the potential for success and the
potential rewards should be used as input to determine the level of expenditure
that is justified. Expenditure on energy research and development is a
very small fraction of the total energy spend, and so seems to be clearly
justifiable. Since it appears likely that the option of a power source for
future generations can be secured without excessive cost, the sensible
choice is to press ahead.

Bibliography
A description of Ignition ITER is given in Technical basis High-Q ITER is described in ITER Design Activi-
for the ITER intenm design report, cost review and ties Summary of the ITER Final Design Report,
safety analysis; ITER EDA Documentation Senes No. 7, ITER EDA Documentation Series No. 22 I.A.E.A,
I.A.E.A, Vienna, 1996. Vienna 2001.

Appendix

14.2 Differential operators
14.1 Vector relations
A) A-{B xC) = B -{C xA) = C -{Ax B)
B) AxiBxC) = iA-C)B-{A- B)C
C) V • {(j)A) = (I)V ■ A + A- (V^)
D) V X {(pA) = <j)V xA + (V^) X A
E) V-(Ax5) = 5-VxA-A-Vx5
F) V(A • 5) = A X (V X 5) + (A • VM + 5 x (V x A) + E • V)A
G) V X (A X 5) = A(V • B) - 5(V • A) - (A • VM + E • V)A
(8) V X (V X A) = V(V • A) - V^A
(9) V X (V</>) = 0
A0) V • (V X A) = 0.
In cylindrical coordinates the components of (A • VM are
{A.VB), = A.VB,-^^
r
(A • VB)e = A-VBe + ^^
r
(A-V5)^ = A-V5,.
Gauss' Theorem
/v.Ad. = /.
where d5 is outward from the volume r and normal to the bounding
surface S.
Stoke' Theorem: j {V x A) ■ AS ^ I A ■ Al
where d/ is along the curve bounding the surface S.
Green's Theorem: / (mV^i; - vV^u) dr = / {uVv - vVu) ■ dS.
14.2
Differential operators
In an orthogonal coordinate system with coordinates ui, and ui, and 1C,
the line element d^ is given by
d^^ = hi du] + hi dul + h] Au]

14.2 Differential operators 723
and if the unit vector is i
\ d(t) 13^ \ d(t)
h\ du\ /t2 9m2 h^ 9m3
^ • ^ = TTT- \^(h2h3A,) + ^(h3hiA2) + ^{hihjAs)]
hihzhs idui dU2 dU3 J
V X A = -i- T-^C/tsAs) - ^(/t2A2I ri
«2«3 Lo 0M3 J
1 r a d 1
h^hi L0M3 dMi J
1 r a d 1
+ THT ^—(^2A2) - r—(//lAi) rs
/zi/T2 L9 9m2 J
r_a_ /^_a^\ ^ _a_ /^_a^\
3 [9mi V hi du\) du2 V ^2 9m2/
1
/T1/T2/T3 [
9 (h\h2 ('
9m3 \ /t3 9M3y
In cyHndrical coordinates r, 9, z,
ds^ = dr^ + r^ d9^ + dz^
del) 1 9^ 9^
dr r d9 dz
„ . 19, 1 9Ae dA,
V • A = (rAr) + + —-
rdr ' r 89 dz
, /19A^ dAg\ (dAr dA{-
V X A = Mr +
\r W dz J V 9^ dr .
(\ 9 19AA
--(rA,)--—^
\r dr r 39 J
. 1 9 / 9(/>\ 1 9^(/> 92(/>

14.3 Units—conversions
14.3
Units—conversions
Physical quantity
Capacitance
Charge
Electrical conductivity
Current
Electric field
Electric potential
Energy
Force
Inductance
Magnetic field
Magnetic flux
Magnetic intensity
Power
Pressure
Resistance
Resistivity
Thermal conductivity
Thermal diffusivity
Vector potential
Viscosity-dynamic
Viscosity-kinematic
Voltage
Value expressed in m.k.
1 pascal =
1 millibar (mb) =
Atmospheric pressure =
G60mmHg,0°C)
1 torr
Symbol
C
1
a
I
E
<P
W
F
L
B
$
H
P
P
R
n
K
X
A
n
V
V
m.k.s. unit
farad (F)
coulomb (C)
ohm~^m~^
ampere (A)
voltm""^
volt (V)
joule (J)
newton (N)
henry (H)
tesla (T)
weber (Wb)
ampere m~^
watt (W)
pascal (Pa)
ohm {Q)
ohmm
m-is-i
m^s-i
weber m~^
kgm~^s~^
m^s-i
volt (V)
3. units X conversion factor
1 Nm"^-
lOONm-2
1013 mb =
1.013 X lO^N
pressure at 1 mm Hg
^ atmospheric pressure
Conversion factor
—multiply^-
-e-divide—
9x 10^1
3x 10*^
9x10*^
3x 10*^
i X 10-4
1 X 10⁻²
107
10^
i X 10-11
10^
10^
An X 10-3
107
10
\ X 10-11
1 X 10-'^
10-2
10^
10^
10
10^
5 X 10-2
= value expressed in
m'2
Gaussian
unit (c.g.s.)
cm
statcoulomb
sec-i
statampere
statvoltcm-i
statvolt
erg
dyne
sec^cm'^i
gauss
maxwell
oersted
erg sec-1
dyne cm-^
sec cm-1
sec
cm-i sec-i
cm^ sec-i
gauss cm
poise
cm^sec-i
statvolt
Gaussian units.
= 133Nm-2

14.4 Coulomb logarithm
14.4
14.5
Physical constants
Electron charge
Electron mass
Proton mass
Velocity of light
Planck's constant
Proton-electron mass ratio
Fine structure constant
Classical electron radius
Gravitational acceleration
Boltzmann's constant
1 electron volt (eV)
1 eV temperature
1 joule
Energy of electron rest mass
Atomic mass unit
Atmospheric particle density
G60mmHg, 0°C)
Coulomb logarithm
me
nip
c
h
rrip/ms
e^/2sohc
e'^ 1 An SQmeC^
8
k
Mo
So
fMQSQc'^
1.6022 X 10⁻¹'^ coulomb
9.1096 X 10⁻³¹ kg
1.6726 X 10⁻²⁷ kg
2.9979 X lO^ms-i
6.626 X 10⁻³⁴joules
1836.1
1/137.04
2.817 X 10⁻¹⁵ m
9.807 ms-2
1.3806 X 10⁻²³ joule K-
1.6022 X lO-i*^ joule
1.1605 X lO^K
0.6241 X lO^*^ eV
0.51 IMeV
1.6605 X 10⁻²⁷ kg
4n X 10-7 Hm-i
8.854 X 10⁻¹²Fm-i
1
2.69 X 1025 m-3
The classical Coulomb logarithm arises from the integral over collision
impact parameters as described in Section 2.8. With a Coulomb
potential the integral diverges at large impact parameters, but Debye shielding
removes the divergence by effectively removing collisions for impact
parameters greater than the Debye length Aq. The resulting form of
In A is
Jo r2 + r2
Atvsqiiv^

14.5 Coulomb logarithm
ei and 62 being the charges of the colliding particles and ji their reduced
mass, m\m2/{m\ + mi). Thus
lnA = iln(l + (r/roJ)|^'
and since ro <g A-d,
Introducing the temperature through
the expressions required for eqn 14.5.2 are
>-D = J , ro
rise^J ' UnsoT'
However, under some circumstances quantum mechanical effects
intervene and modify In A. In tokamaks this principally affects collisions
involving electrons. The numerical consequences of the modification will
be discussed first and then a brief description of the nature of the quantum
mechanical effect will be given.
Equation 14.5.2 is changed if ro is less than A,qin/2:7r where Aqm is the
de Broglie wavelength given by
: 62/e and the fine structure constant
Using relation 14.5.3, the condition 14.5.4 for the applicability of the
classical formula for singly charged particles becomes
~ 5 X 10⁴'
Since the rest mass energy of electron, nigC^, is 0.5 MeV the critical
temperature for collisions involving electrons is ~10 eV, so that for
temperatures of interest the quantum mechanical correction is necessary.
For ions the critical temperature is about 10 keV for protons and is
correspondingly higher for higher masses. For present purposes therefore any
quantum mechanical correction for ion-ion collisions will be small and
v =
fMV
This occurs for
">
c
where Z
" = :
ZlZ2«
1 = ei/e
.sohc
,Z2--
1
137'

14.5 Coulomb logarithm
727
consequently it is usually adequate to use the classical formula for ion-
ion collisions. Precise calculations for these cases lead to the following
formulas:
electron—electron collisions
In A = 14.9 - \ ln(ne/10^°) + In T^, T^ in keV
electron-ion collisions (T > 10 eV)
In A = 15.2 - i ln(ne/10^°) + In T^, T^ in keV
ion-ion collisions (singly charged ions, T < 10(mi/mp) keV
In A = 17.3 - i ln(ne/102°) + | In T, T in keV.
Values of In A for electron-ion collisions are given in Fig. 14.5.1.
Given the low level of accuracy which is generally possible in plasma
physics it is usually inappropriate to take account of the slow variation
of In A with n and T. The value In A = 17 is accurate for electron-ion
coUision to within 10% between Wg = 2 x 10^^ m"^ and 2 x 10^^ m~^ at
r = 5 keV, and between T = 600 eV and 18 keV for Wg = 3 x lO^*^ m'l
To see the relation between the classical and quantum mechanical cases
it is convenient to rewrite eqn 14.5.1 in terms of the scattering angle x
Fig. 14.5.1 Values of the Coulomb
logarithm, In A, for electron-ion colhsions
plotted against electron density and
temperature.
:/lO
- /
~ /
- /
y
: /
-/
1 /
/l2
1 1 M l/
17
/l3
1 1
/l4
/l5
r
/l6
jJ
/17
/l8
jTry
/l9
/ :
1 ~_
'-
r
/1
/20
100 eV 1 keV
Temperature

14.5 Coulomb logarithm
which, classically, is related to the impact parameter by
Thus classically
/■I dsin^x
J(r„/^u)' 2 sin^ X
- 'x/2
Turning now to the quantum mechanical behaviour, the first point to
note is that (ignoring spin) the quantum mechanical and classical
differential cross-sections for Coulomb collisions are the same. The difference
arises through the effect of Debye shielding, the Debye shielded potential
taking the form
For the collision to appear classical it requires that the uncertainty.
Ax, in scattering angle be much less than the scattering angle itself
and the uncertainty in position, Ar, be much less than the impact
parameter
Ar « r. 14.5.6
Writing Ax = Ap±/p and x = Sp±/p, where Ap± is the
uncertainty and 8p± is the change in transverse momentum, inequality 14.5.5
becomes Ap± <S 8p±, that is
Ap_i « 2iiv /^° , . 14.5.7
r2 + r^
From Heisenberg's uncertainty principle Ap±Ar ~ h and so, using
inequaUties 14.5.6 and 14.5.7, the colHsion will appear classical if
1 + r^/r^
Thusif (A,qin/4:7r) > ro this condition cannot be satisfied and the collisions
will not be classical for any scattering angle.

14.6 Collision times
Using the Bom approximation the quantum mechanical expression for
In A is
sin^X/2dsin^X/2
It is seen from eqn 14.5.8 that for Aqm <g: Aq the contributions from large
angle scatters are unaffected by quantum effects but that small angle
contributions with sin x/2 < Xqm/4:7rXD are essentially removed. Thus
effectively
In A =
/■I dsin^x/2
i(V/4'r;tD)- 2sin2x/2
In A = In I 4:7r -
14.6
Collision times
The electron collision time characterizing electron collisions with ions is
_12^£>y^
^' V2 niZVlnA"
For singly charged ions
7;3r
-s, lnA = 17, TeinkeV.
The values of tg given by eqn 14.6.1 are plotted in Fig. 14.6.1.
The rate of energy transfer from electrons to ions is given by
where the energy exchange time
2me
This time may therefore also be obtained using Fig. 14.6.1.

14.6 Collision times
Fig. 14.6.1 Values of re plotted against
electron density and electron temperature
(Equation 14.6 1 with the precise values of
In A.)
The ion collision time is
_ .2^1/2^3/2
' niZVlnAi
and for singly charged ions
= 6.60 X 10¹⁷ -^
- s, Ti in keV.
The Coulomb logarithm for ions is approximated by In A; = 1.1 In A
to within 10% over the range covered by Fig. 14.6.1. Using this relation,
eqns 14.6.1 and 14.6.2 give the following approximations for tj putting
ions (Z = 1) ti ~ -— ( —'-
1.1 \me ,
protons tp ~ 55re
deuterons rj ~ 78re
tritons tt ~ 95re.
Using these relations approximate values of the ion collision time may
be obtained from Fig. 14.6.1.

14.7
Lengths
Debye length
= 2.35 X lO^iTs/ric)^/^ m, T^ in keV.
Larmor radius (thermal particle, d^ = 2vj)
electron
a>ce eB
J1/2
: 1.07 X 10"^-^ m Te in keV,
- m, T, in keV,
proton
j.l/2
Pp = 4.57 X 10⁻³ _P^ ^^ jp jj^ j^gY^
deuteron
J1/2
Pd = 6.46 X 10⁻³ ^ ^^ j^ jj^ j^gY^
triton
J1/2
Pt = 7.92 X 10⁻³^ m, Tt in keV,
a-particle
jl/2
p„ = 4.55 X 10⁻³-^— m, Ta in keV,
a-particle with perpendicular energy s±
Pa = 1.44 X 10-^-i-m, ffiinMeV.

Fig. 14.7.1 Graphs of Larmor radius
and Debye length against temperature
(eqnsl4 7 1, 14 7.2, and 14 7 3)
— Imi
r
\y
' ' ""' ' ' ' '""' ■yiiiH
5^ X \
^ 4^^ -
y^^ -
y^ :
Fig. 14.7.2 Graphs of electron mean
free path against temperature (eqn 14.7.4)
The ion mean free path is approximately
equal to the electron mean path at the same
temperature
10^
lO"
10^
t
s 1
10"'
10-^
in-3
-
— 1 kilometre —
, , ,
p /
/A/
1 , ,,
/ / -
/
-
— 1 metre —
-
-
,,„! , ,
100 eV 1 keV 10 keV
Temperature

14.8 Frequencies
Mean free path (vj x collision time) (Z = 1)
electron
^e = UTete = I tg
j2
= 1.44 X 10^^—^- m, Te in keV
nln A
= 8.5 X 10^1 {Ti/n\ m, In A = 17, T^ in keV.
At a given temperature the ion mean free path k^ ~ X^ since
14.8 Frequencies
Plasma frequency
electron
(Wpe =
/pe =
ion (Z =
(Wpi =
\meSoJ
^ = 8.98n
2:t
1)
= 56.4n
y^Hz,
= 1.32(n
1/2 g-l^
./A)i/2
/pi = ^=0.210(n,/A)i/2Hz.
Gyrofrequency
electron
= 0.176 X 10^^ 5 s

14.9 Velocities
Lower hybrid frequency
Upper hybrid frequency
col, =0.1+col
Trapped particle bounce frequency
14.9
Velocities
Thermal velocity
electron vje = 1.33 x 10^T^' ms"
ion VT, = 3.09 X 10⁵(ri/A)i/2 ms-
proton UTp = 3.09 X lO^Tp''^ ms'
deuteron uxd = 2.19 x lO^T^''^ ms"
triton UTt = 1.79 X lO^T^^^^ ms"
Alfven velocity
" ifion.my/^ '
(niA)i/2

Fig. 14.9.1 Values of electron and ion
thermal velocities and the Alfven velocity
14.10 Resistivity
-Velocity of lig
10 eV 100 eV IkeV lOkeV 100 keV
Temperature
14.10 Resistivity
The resistivity of a hydrogen plasma is discussed in Section 2.16. The
value of the resistivity parallel to a magnetic field given by eqn 2.16.2 is
rj, = 7711 = 1.65 X lO-*^ InA/T^^^ ohm m, T^ in keV. 14.10.1
The resistivity is given as a function of temperature in Fig. 14.10.1.
There is a weak dependence on density through In A and values are given
for n = 10^^ m~^ and 10^° m~^. The perpendicular resistivity, r]j_, is
larger by a factor 1.97.
In a plasma with ions of charge Z the resistivity is larger than in
a plasma with singly charged ions. It is seen from eqn 2.15.1 that the
collision frequency is proportional to Z^, so the drag on an electron is
increased by a factor Z^. However, the number of electrons is «; Z, so the
number of current carriers per ion is proportional to Z. Consequently the
resistivity is roughly proportional to Z. The precise form is
;7||(Z) = ^(Z)Z;7||A)
14.10.2
where ;7||A) is the resistivity given by eqn 14.10.1 and A^ is a numerical
factor depending on Z. Calculations by Spitzer and Harm lead to the
values of Af given in Table 14.10.1.
In an impure hydrogen plasma the situation is complicated because
of the multiplicity of levels of ionization of the impurity. An empirical

14.10 Resistivity
Fig. 14.10.1 Spitzer resistivity against
electron temperature for a hydrogen
plasma
n=
^\
\
^
li
o2« m-i:^
ilH«=io
[K
\
^
M
\
\h\\\
100 eV 1 keV
Temperature
Table 14.10.1 Resistivity factor NiZ) of
eqn 14.10.2
Z i 2 4 16 o^
^ 1 0.85 0.74 0.63 0.58
formula which has the correct limiting forms is
'7||(Zeff) = A^(Zeff)Zeff'7||(l)
the effective value of Z being given by
1+/Z2
Zeff =
1+/Z
where / is the ratio of impunty ions to hydrogen ions and Z and Z^ are
averages over the impunty ions.

14.11 Chang-Hinton formula for Xi
737
When trapped electrons exist these electrons do not carry a current
and the plasma conductivity is reduced to its neoclassical value. An
approximate formula is
''" (l-(r/i?o)l/¥"
More generally the neoclassical resistivity is a function of the collision
frequency and Zgff. An approximate formula is
l+0.27(Zeff-l)
'A-</.)(!-C</.)l+0.47(Zeff-l)
1 + @.58 + 0.20Zeff )v*e
0.56 /3.0-Zeff\
Zeff V3.0 + Zeff7
,-3/2 J^
UTe^e
R IS the major radius of the plasma, q is the safety factor, s is the aspect-
ratio R/a, vje = {Te/fn^)^!'^, fy is the fraction of electrons trapped (for
v*e = 0)
/t = 1-
A - sf
A-£2I/2A + 1.46£l/2)
nee'^lnA
14.11 Chang-Hinton formula for x\
Because there are circumstances in which ion neoclassical thermal
transport IS comparable with expenmental values it is appropnate to give an

14.12 Bootstrap current
expression for Xi which extends the formula of eqn 4.6.22 to incorporate
finite aspect-ratio effects, and interpolates between banana, plateau, and
Pfirsch-Schluter regimes allowing for the effects of impurities. Thus,
with ^1 = -nxi dTi/dr, this expression is
-^vp.Mro
66A + I54a) + (I.88ei''^- I 54e)(I + 3 75aI
I + I 03iJ.l[
+ 0 3IAI*,
33a(I+0 60a)"
(I+0 74M*,e3/2) [
(/i - fi)
14.11.1
where s = r/R, ^ = {2TJmi)^l^/coa, a = niZJ/riiZ^
measures the effect of impunty ions with charge Zj and density nj, and
/i^i = v*i(l -I- 1.54a!) with v*i = ViRq/s^l'^vju a colhsionality
parameter allowing the interpolation between collision regimes. The first term
in eqn 14.11.1 contains a factor f\ where
l + ICff^ + gAO + lff^A'
A' = d A/dr being the denvative of the Shafranov shift (see Section 3.6).
This term descnbes the neoclassical contnbutions from the banana and
plateau regimes and the transition between them as /i*i vanes. The conec-
tions proportional to s^l'^ and s represent the effects of energy scattenng
terms in the collision operator which play a role at finite aspect ratio
when the fraction of trapped particles is not small. The second term
in eqn 14 11.1, which has a factor f\ - /i where
/2 =
A'.
1 + —(Vl-£2-l)
S
represents the Pfirsch-Schluter contnbution when fi^iS^^^ > 1.
Bootstrap current
An introductory account of the bootstrap cunent was given in Section 4 9
In that descnption collisions were neglected and only a limited range of

14.12 Bootstrap current 739
aspect-ratio was covered. The need to calculate the dependence of the
bootstrap current on these parameters calls for an equation which covers
their full range.
The equation given below gives one such form. The gradients are
expressed in terms of the poloidal flux i/r. In a large aspect-ratio circular
approximation these are related to the radial gradients by
1 dv
In terms of the inverse aspect-ratio, s = r/R, and the collisionality
soyb]
where Ve = r^^ and Vj = r~ , tg and tj being given by eqns 2.15.1 and
2.15.2, anda»b; = £^/^(r,/my)^/2/i?^, the bootstrap current is given by
fiof{ir)xp, ( p' p' T' t;\
where fix//) is the equilibrium flux function RBc^/^iq (see Section 3.2),
X IS the ratio of the number of trapped to circulating particles (~ ^Jle^l'^
for small e), p,{ir) and T,{-^) are the pressure and temperature of
species ],
D{x) = 2.4 + 5.4x + 2.6x2
4.0 + 2.6x
(l + 1.02vi/^ + 1.07v*e) A + 1.07£3/2v^g)
7.0 + 6.5x 5
(l + 0.57vie^^ + 0.61v*e) A + 0.6l£3/2v,e) ^
and
/^+035yf ^.,\
Vl+0.7v;/' *7A-
^^v2)(l+.3,y ■
where
1.17
rf =
1 + 0.46x ■
The average ( ) is defined by
d/
(M> =
J / B,
where d/ is a poloidal line element in the magnetic surface and 5p is the
poloidal magnetic field.

14.13 Confinement scaling relations
'^4.13 Confinement scaling relations
The international activity associated with ITER has generated a
number of scaling expressions for the energy confinement time, re, in both
L- and H-mode. These have been gradually refined as the quality of the
multi-tokamak database has improved. Nevertheless some of the older
versions are often quoted in the literature and new experimental data
IS frequently expressed in terms of them. A number of expressions are
tabulated here for reference purposes. They all have the generic form
tE = C/"' B"'
^°'{wo)'''■""'
where C is a constant, / is in MA and P in MW.
For L-mode, the well established standard scaling is ITER89-P, but a
more recent one for thermal energy confinement is known as r^j^. The
constant C and exponents a/, ag etc are tabulated in Table 14.13.1
In H-mode, early expressions for thermal energy confinement were
given for both ELMy and ELM free cases. These were known as ITER
H92-P (y) and ITER H93-P for ELMy and ELM free, respectively. More
recently, the scalings IPB98(y) and IPB98 (y,2) have been denved for
ELMy H-mode, the latter using a different definition of k to account
for the bean-shaped tokamak PBX-M. In addition a newer ELM free
expression, z^^''
'■, has been introduced. These ELMy and ELM free
scaling expressions are tabulated in Tables 14.13.2 and 14.13.3.
Table 14.13.1 L-Mode confinement time scaHngs.
re C ai ub ap a„ aA ccr
^ITER89-P QQ4g Qg5 Q2 _o.5 0.1 0 5 1.5
4^ 0.058 0.96 0.03 -0.73 0.40 0.20 1.83
Table 14.13.2 ELMy H-mode confinement time scalings.
tE C ai UB ap a„ ua (Xr
a^ Uk
0.3 0.5
-0.06 0.64
«6 «K
ITERH92-P(>>)
^IPB98(>.)
0.068 0.90 0.05 -0.65 0.30 0.40 2.1 0.20 0.80
0.094 0.97 0.08 -0.63 0.41 0.20 1.93 0.23 0.67
0.145 0 93 0.15 -0.69 0.41 0.19 1.97 0.58 0.78

14.14 Plasma shape
Table 14.13.3 ELM free H-mode confinement time scalings.
tE
^ITERH93-P
-ELMfree
%,th
c
0.053
0.068
ai
1.06
0.94
as
0 32
0.27
ap a„ aA
-0.67 0.17 0.41
-0.68 0.34 0.43
(Xr
1.79
1.98
«6 «K
-0.11 0.66
0.10 0.68
14.14 Plasma shape
The elongation and triangularity of the plasma are defined using the
dimensions shown in Fig. 14.14.1.
Elongation
K = b/a.
Triangularity
{c + d)l2
The vertical and honzontal limit of the plasma are defined either by
tangents to the plasma edge or by the X-point of a separatrix.

14.15 Formulae
14.15 Formulae
Maxwellian distribution function
Force between two charges, separation d
AnsQd?-'
Inductance per unit length of a uniform current of radius a with a coaxial
return at radius b (energy = \LI'^)
2n \4 a)
Inductance of a circular uniform current of radius a in a circular loop of
radius R
L = ;.oi?^ln---j.
Resistive skin depth in the surface of a conductor of conductivity o for
oscillations with angular frequency co (oscillations decay as exp(—x/5))
\lXQawJ
Average value over a circular cross-section, r < a,ofy — yoil — r'^la^y
v + \
Definition of error function
erf(x) =
-= / e ^ dz
-"--\a"
2 Va/
1 / :t- \ 1/2
x^ e~"^ dx

14.16 Symbols
The following is a list of symbols in this book which are used without
repeated definition.
Geometry
{R, (j), z) Cylindrical coordinates based on the major axis of the
torus, z = 0 being the median plane
(r, 9) Polar coordinates in the minor cross-section
Rq (or R) Major radius of the plasma
a Minor radius, half-width, of the plasma
b Half-height of the plasma
m Poloidal mode number
n Toroidal mode number
s Inverse aspect ratio, r/R
K The elongation of the plasma, b/a
Magnetic field
50 Toroidal magnetic field
5p Poloidal magnetic field
Bg Poloidal magnetic field for large aspect-ratio circular cross-section
q Safety factor
^0 q at the magnetic axis
^a q at the plasma surface
Particles
Particle types are denoted by subscnpts e (electron), i (ion), p (proton),
d (deuteron), t (tnton).
Bj Electric charge
nij Mass
Zj (or Z) Charge/e
A J (or A) Atomic mass
vij Thermal velocity, {Tj/rrij)
cocj Cyclotron frequency, ejB/rUj
Pj Larmor radius, vxj /cocj or V2i;t; /cocj
v\\ Velocity parallel to the magnetic field
vx Velocity perpendicular to the magnetic field
Species denoted by subscripts
Tj Temperature
T Temperature when Tg is taken to be equal to Tj

Particle density
Electron density in pure hydrogen plasma (= ion density)
Collision frequency
Energy confinement time
Debye length
Plasma frequency
Bibliography
There is a more complete collection of plasma physics
formulas and data in
Book, D.L. NRL Memorandum Report 3332, Naval
Research Laboratory, Washington D.C.
and in a condensed form in
Book, D L. NRL Plasma Formulary, Naval Research
Laboratory, Washington D C A977).
low-density, high-temperature plasmas. Atomic Data and
Nuclear Data Tables 20, 397 A977).
The approximate formula for the neoclassical resistivity is
from
Hirshman, S.P, Hawryluk, R.J., and Birge, B. Neoclassical
conductivity of a tokamak plasma Nuclear Fusion 17, 611
A977)
Coulomb logarithm
Calculation of the Coulomb loganthm is described in
Sivukhin, D V Coulomb collisions in a fully ionized plasma.
Reviews of plasma physics (ed Leontovich, M. A.) Vol 4,
Consultants Bureau, New York A966)
Chang-Hinton formula
Chang, C S. and Hinton, F.L. Effect of impurity particles
on the finite aspect-ratio neoclassical ion thermal
conductivity in a tokamak. Physics of Fluids 29, 3314
A986).
Resistivity
Values of Z and Z^ may be obtained from
Post, D.E., Jensen, R.V, Tarter, C B., Grasberger, W.H,
and Lokke, W A, Steady-state radiative cooling rates for
Bootstrap current
The equation for the bootstrap current is a corrected form
from
Wilson, H.R. UKAEA Report Fus 271 A994).

Index
Abel transform 509
AC operation 621
adiabatic compression 239, 598
adiabatic equation 80
adiabatic invanants 49
adsorption 461
Alcator scaling 567
Alfvenwave 98
alpha particle
heating 9,617,641
losses 616
TAB excitation 616
Ampere's law 80
anomalous transport 150
candidate modes 213
arcing 473
Artsimovitch 562
scaling 563
aspect-ratio expansion 117
atomic processes 457
axisymmetric instability 342
baclcscattenng, surface 454
baking, vacuum vessel 463
ballooning modes 337
inTFTR 605
banana diffusion 159
banana orbits 130
banana regime 159
beam emission spectroscopy 611
beryllium surfaces 633
effect on density limit 624
beta,/3, 115
mOni-D 678
poloidal 116
beta limit 343
scaling m DHI-D 347,678
bindmg energy, surface 466
blanket 18
Bohm scaling 194
bolometry 541
bootstrap current 172
general formula 738
m DHI-D 681
mJET 637
in JT-60/JT-6OU 654
inTFTR 605
boronization 465, 580
bounce frequency 129
bounce point 127
Braginskii equations 88
bremsstrahlung 227
measurement 537
bucket source 254
canomcal momentum 125
carbon bloom
in JET 642
in TFTR 601
carbonization 465
mDm-D 683
in TEXTOR 580
centrifugal effects 133
Chang-Hinton formula for /, 737
charge exchange 255, 457
neutrals 523
recombination spectroscopy 530
cleanmg, discharge 463
Clemmow-MuUaly-AUis diagram 291
coils, layout 17
collisions 51
momentum and energy change 53
collision times 69
compressional heating 240, 598
conditiomng of wall 461
conductivity, neoclassical 173, 737
confinement 150
m DHI-D 667
mJET 629
inJT-60 647
in JT-60U 659
in TFTR 608
momentum 197
confinement modes and scaling 180
Goldston scaling 20, 152, 182
H-mode 184, 185
improved ohmic 181
ITER 89-P scaling 183
ITER H93-P scaling 184
L-mode 182
PEP 184
radiatively improved 185
supershot 184
V-H modes 185
confinement time
definition 9, 150
particle 537
ir^ scaling 17,563
see also confinement; confinement
modes and scaling
continuity equation 78, 89
Cordeypass 13
coronal equilibnum 230, 532
Coulomb barrier 4
Coulomb loganthm 53, 725
critical gradients 217
charge exchange 245
fusion 5
lomzation by ions 245
cryopump 666
current dnve 136
DIH-D 681
electron cyclotron 143
fast wave, electron 142
fast wave, minonty ion 144
JET 637
JT-60/JT-6OU 652
lower hybnd 139
neutral beam 137
current penetration 364
hollow 181
model 119
current quench, disruption 376
cyclotron frequency 40
cyclotron radiation 229
Debye length 36
Debye shielding 35
in collisions 53
decay mdex, magnetic field 343
deflection time, particle 65
density limit
mDII-D 681
mJET 623
in JT-60/JT-6OU 656
desorption 462
deutenum, abundance 25
deutenum-tntium expenments
in JET 640
inTFTR 612
diamagnetic frequency 421
diamagnetic loop 501
diamagnetism 84

dielectnc tensor 76, 94
diffusion, plasma 152
diffusion tensor 58
discharge cleamng 463
dispersion relation 94
disruptions 374
causes 376
current decay 387
density limit 378
inOm-D 676
in JET 623
mJT-60U 655
low q 377
physics 382
reactor 709
runaway electrons 387
inTFTR 605
vacuum vessel currents 389
dissociative ionization 458
dissociative recombination 458
divertor expenments
m ASDEX 578
in ASDEX upgrade 689
mOm-D 683
in JET 633
JT-60/JT-6OU 649
divertors 19 477
bundle 570
design considerations 487
flow 485
heat flux 489
one-dimensional model of SOL 479
volume power losses 483
Doppler broadening 539
Doppler shift 539
Dnecer electnc field 74
dnft instabilities 418
dnft kinetic equation 58
drifts, particle 44
curvature 46
£■ X B 44
polanzation 47
VB 45
dnft surfaces 126
dnft wave 420
dynamic faction 58, 64
ECE, measurement of Te 518
economics, tolcamak 26
ECRH 290
edge localized modes 409
electnc fields 123
sheared 210
electromagnetic waves 96
lectromagnetism 75
sctron cyclotron emission, r
ofTe 518
sctron cyclotron heating 290
sctron density measurement 507,511
sctron dnft mode 425
toroidal 426
n dnft w
s 421
ctron temperature gradient
mode 429
electron temperature measurement 51'
ELMs 409
energy balance equation 92
energy confinement time,
definition 9, 148
energy consumption, world 25
energy loss 9
energy principle 309
energy resources, world 26
entropy conservation 80
equation of motion 78
equilibnum 106
ergodicity 397
ergodic magnetic field 353, 398
transport 204
erosion, arc 473
enor field instability 394
expenment 583,677
enor function 742
evaporation 489
Fabry-Perot interferometer 520
Faraday rotation 510
feedbacic control of mstability 571
field particles 65
fishbone instability 399
fluctuations
conelation with transport 200
L-H transition 202
measurement 551
observations 199
transport 199
fluid equations 77
flux functions 108
Fokker-Plancic equation 56, 57
for a Maxwellian distnbution 62
for a plasma 60
Founer transform spectrometer 520
friction force 90
'frozen in' magnetic field 83
fuel resources 24
fusion cross-sections 5
Gaunt factor 228, 538
Gauss' theorem 722
gettenng 463
Goldston scaling 20, 152, 182
Grad-Shafranov equation 109
Green's theorem 722
Greenwald limit 377
gyro-averaged equations 58
gyro-Bohm scaling 194
gyrofrequency (cycotron frequency) 40
gyro-kinetic equation 59
gyrotron 291
halo cunent 396
in expenment 620, 676
Hamilton's equations 55
heat exchange 93
time 67
heating 238
ECRH 290
ICRH 270
lower hybnd 286
neutral beam 243
ohmic 240
heat transfer in solid 489
heavy ion beam probe 552
helical magnetic field 366
helical magnetic flux 366
hehum transport 612, 650, 686
high p, in DIII-D 678
H-modes 185
edge localized modes 189
hoop force 107, 155
HugiU diagram 377
ICRH 270
ideal mhd modes 304
Ignition 10, 12
impact parameter 53
impurities 23
coronal equilibnum 461
459
120
gap mode 403
gauge transformation 77
525
impunty radiation 229
impurity transport 219
incompressibility
inductance, plasm
measurement 503
instabilities 352
axisymmetnc 342, 396
ballooning 337
coUisionless trapped particle 431
dissipative trapped particle 432
dissipative trapped electron 434
edge localized modes, ELMs 410
electron dnft 420

error-field 394
fishbone 399
internal kink 329
ion temperature gradient 428
kink 313
localized 336
m = 1 teanng 334
MARFE 406
rmcroinstabiLties 417
micro-tearing 435
Mimov 362
modes for transport 213
passing particle 422
resistive m = 1 332
sawtooth oscillations 365
teanng 318
thermonuclear 13
toroidal Alfven 402
trapped particle 430
trapped ion mode 433
umfied m = 1 theory 336
vertical 396
interferometry 507
internal inductance, I, 120
measurement 503
internal kink instability 329
internal transport bamers 189, 226
inward pinch 196
ion cyclotron heating 270
expenments 285
ionization, dissociative 458
ionization, molecular 458
ion source 253
ion temperature gradient
mode 428
ion temperature m
ITER 711
costs 713,717
kinetic equations 55
Lagrangian 311
Landau collision integral 61
Landau contour 101
Landau damping 100
Langmuir probes 546
measurements 669
large aspect-ratio expansion 117
Larmor orbits 40
Larmor radius 41
laser diagnostics 514
Lawson en tenon 12
L-H transition
mASDEX 577
in oni-D 667
fluctuations 202
in JET 226
radial extent 225
LIDAR 516
lirmters 475
linearization 306
(-„ mtemal inductance 122
Lthium 24
blanket 18
reserves 24
In A 53,725
localized modes 336
loop voltage, measurement 5C
lower hybnd frequency 734
lower hybrid heating 286
Mach-Zehnder interferometer 507
magnetic islands 354
overlap 397
width 355
magnetic measurements 500
magnetic moment 49
magnetic reconnection 354
sawtooth 366
magnetic shear 107
magnetic surfaces 108
magnetohydrodynarmcs (mhd) 79
magnetohydrodynamic waves 97
magnetosonic waves 99
MARFEs 406
measured radiation 541
mass deficit 4
Maxwell distnbution function 6
Maxwell's equations 75
mean free path 733
melting 491
Mercier cntenon 337
metallic films 464
mhd stability
axisymmetnc modes 342
ballooning modes 337
^-limit 343
effect of conducting
wall 326
energy pnnciple 309
growth rates 307
internal kink 329
kink instabihty 313
large aspect-ratio expansion 312
quasi-interchange 331
resistive m = 1 332
teanng mode 318
tokamak instabilities 311
unified m = 1 theory 336
rmcroinstabilities 418
micro-teanng mode 419, 435
Mimov oscillations 362
mmror effect 43
minor force, tokamak 127
mode locking 390
molecular lomzation 458
momentum equation 89
motional Stark effect 557
measurements 605, 681
Murakami parameter 377
306
localized modes 336
m — \ teanng mode 334
neoclassical teanng mode 359
neoclassical transport
banana 159
Pfirsch-Schluter 158
plateau 167
neutral beam
expenments 251
heating 243,246
injection 243
from negative ions 256
production 253
slowing 248
neutral particles
measurement of 7, 524
production 523
neutron emission, measurement
of 7, 526
nx^ for Ignition 10
nTrE, tnple product 11
improvement in 3
Ohkawacunent 571
ohtmc heating 240
Ohm's law 80
O-point 355
optical depth 519
optimized shear 181,190
particle motion
along B 42
dnfts 44
particle orbits 124
trapped 129
potato 131
particle trappmg 127
conditions for 128

passing particle instabihties 422
passing particles 124
pedestals 217
pellet injection
AlcatorC 567
JET 625, 638
TFTR 598
PEPs, pellet enhanced plasmas 184,638
permeability 76
Pfirsch-Schluter current 155
Pfirsch-Schluter diffusion 159
pick-up coils 500
505
plasma elongation, axisymmetnc modes
342
plasma energy, measurement 503
plasma frequency 38,95
plasma oscillations 95
plasma parameter 38
plasma rotation 133
plasma sheath 446
plasma-surface interactions 444
plasma waves 94
plateau regime 167
plateau transport 167
polarimetry 509
polanzation 84
poloidal magnetic field 16
potato orbits 131
power balance 8, 10
Poynting vector 77
precursors, disruption 375
pressure, anisotropic 83
pressure tensor 82
pnmary coils 17
probes, Langmuir 546
profile stiffness 693
pump limiter 580
g, power ratio 12
Got 706
g, safety factor HI
cylindncal 114
expenment 372,674
profile determination 556
profiles 113
quasi-hnear theory, turbulence 206
quasi-neutrality 36
quench, current 376
radiation from plasmas 531
bolometry 541
bremsstrahlung 227
impunty 229
536
power 229
soft X-rays 542
radiation losses
bremsstrahlung 227
cyclotron 229
impunty 229
radiation shield 19
radio-frequency heating 258
rational surfaces 305
reactor parameters 19
reactor power 22
reactor requirements 708
Rebut-Lalha-Watkins model in JET
transport 216
recombination, dissociative 458
recombination radiation 539
reconnection, magnetic 354, 367
recychng 453
reduced mass 6
refiectrometry 511
refractive index 94
relaxation processes 65
resistive diffusion 152
resistive instabilities 304
resistive layer, teanng mode 320
resistive skin-depth 742
axisymmetnc modes 342
instability 679
mode locking 390
resistivity 70
expenment 598
neoclassical 175
Spitzer 71
resonant surface 305
npple transport 175
colhsional 179
coUisional well trapping 176
expenment 179
fast particles 177
stochastic 179
Rogowskicoil 501
Rosenbluth potentials 61
rotation, plasma 133
rotational transform 113
runaway electron cunent 387
runaway electrons 72
in disruptions 387
mechanisms 72,74
Rutherford scattenng 52
safety factor, g. 111
Sakharov 562
sawtooth oscillations 365
collapse time 370
first observation 565
heat pulse 610
in JET 625
Kadomtsev's model 366
quasi-interchange 371
ramp phase 373
soft X-ray measurement 521
spontaneous onset 373
stabilization 627
inTEXTOR 373
mTFTR 605
thermal collapse 374
value of go 372
scaling laws, confinement 191
Artsimovitch 563
Bohm scahng 194
Connor-Taylor
Goldston 20
gyro-Bohm scaling 194
identity experiments 194
Kadomtsev constraint 191
tables 192,739
scrape-off layer, SOL 449
one-dimensional model 479
parallel transport 452
Shafranov shift 119
shear damping 421
shear magnetic 107, 340
electnc field 210
sheath, plasma 446
shield, neutron 19
skin-depth, resistive 742
slideaway regime 567
slowing-down time 65
small aspect-ratio tokamaks 586
snake 625
soft X-rays 542
SOL, see scrape-off layer
soundwaves 96
spectroscopy 536
Spitzer resistivity 71
sputtenng 466
Stark effect, motional 557
Stix-Golant accessibility condition 288
Stoke's theorem 84
superconductmg coils 16
supershots-577
switch-off expenment 224
synchrotron (cyclotron) radiation 229
nOm-D 681
nJET 628

inJT-60U 659
inTFTR 608
Taniin 562
teanng mode
in disruptions 383
linear theory 318
micro- 435
neoclassical 359
non-linear 356
stability 333
temperature pedestals 217
test particle 65
thermal conductivity 88, 93
thermal force 90
thermal stability 13
thermal velocity 734
thermonuclear fusion 5
thermonuclear power density 8
thermonuclear reaction rate 5, 11
Thomson scattering 514
measurement of Te 562
tokamak, name 27
tokamak plasma 34
tokamak reactor 18
costs 26
electncity production 19
tokamak research, history 27
tomography 544
toroidal Alfven eigenmodes, TAB 402
toroidal field coils 16
transformer action 16
transport
anomalous 150
banana regime 159
bamers 189
classical, cylinder 153
coefficients 195
electnc field shear 210
fluctaations 199
H-mode 152
impunty 219
instability modes 213
L-mode 152
neoclassical 151
Pfirsch-Schluter 158
plateau regime 167
Rebut-Lalha-Watkins 216
npple 175
tarbulence-induced 202
transport coefficients 195
banana regime 166
plateau regime 169
trapped particle instabilities 430
colhsionless 431
dissipative 432
dissipative trapped electron 434
trapped ion 433
trapped particles 124
bounce frequency 129
instabilities 430
orbits 129
trapping, condition for 128
behaviour in surfaces 492
breeding 18
inventory 492
tritium expenments
m JET 640
inTFTR 612
tarbulence
electrostatic 203
magnetic 204
quasi-linear theory 206
saturation 208
simulations 217
stochastic 204
transport 192
'universal' trapped electron instability 419,
vacuum magnetic field 121
baking 463
forces 389
vapour pressure 490
vector potential 76
vertical instability 396, 342
in JET 620
vertical magnetic field 123
VH-mode 672
viscosity 92
Vlasov equation 56
voltage, loop 502
wall conditiomng 461
wall stabilization 680
Ware pinch 169
waves, plasma 94
X-event 223
X-point 115
magnetic island 355
X-rays, soft 542
Zeeman effect 557
definition 72
in JET 633