/


Text
For personal non-commercial use only. Do not edit or alter. Reproductions not permitted.
To reprint or license content, please contact Barron's reprints department at 800-843-0008 or www.djreprints.com
C O NT EN TS
06.03.24
VOL.CIV NO.23
P. 14
P. 10
P. 20
Rate Cuts Are Probably
Off the Table in 2024
Stocks for India’s Building Boom
Economy: This Feels
Like 1984 in Reverse
Cover Story: A strong economy,
sticky inflation, and the November
election are likely to keep the Fed
on the sidelines through year end.
A likely third term for Narendra Modi will keep money flowing into roads and rail as the
prime minister seeks to make India a global manufacturing center. By CRAIG MELLOW
A massive U.S. deficit could force
the Fed to embrace money printing
and inflationary policies.
By RANDALL W. FORSYTH
By NICHOLAS JASINSKI
P. 21
P. 11
Trader: Stocks Could
Be Ready to Crumble
WD-40 Belongs in Your
Toolbox—and Portfolio
Too much optimism is a red flag.
Sizing Up Small-Caps: A setback
for the lubricant maker’s shares
has created a buying opportunity.
By JACOB SONENSHINE
By TERESA RIVAS
International: Telcos
Turn to Tie-Ups
P. 24
P. 12
Can European telecoms consolidate
their way to profitability?
By CRAIG MELLOW
We map the real estate terrain in
the wake of recent rulings—with
advice for buyers and sellers.
P. 25
By SHAINA MISHKIN
Striking Price: Utility
Stocks Are Hot
P. 13
This strategy invests with less risk.
Rockefeller’s Standard
Oil Could Live Again
By STEVEN M. SEARS
A spate of energy-sector mergers
is reuniting properties that were
broken up by the feds in 1911.
Retirement: The Perks
of a Roth 401(k)
P. 47
The shift to renewable energy is expected to attract more private investment to India’s projects.
By KENNETH G. PRINGLE
New rules kick in this year.
By ELIZABETH O’BRIEN
P. 18
P. 46
Europe Enjoys a Host
of Economic Tailwinds
Q&A: James Rossiter of TD
Securities says growth in Europe
is accelerating—unlike in the U.S.
By BRIAN SWINT
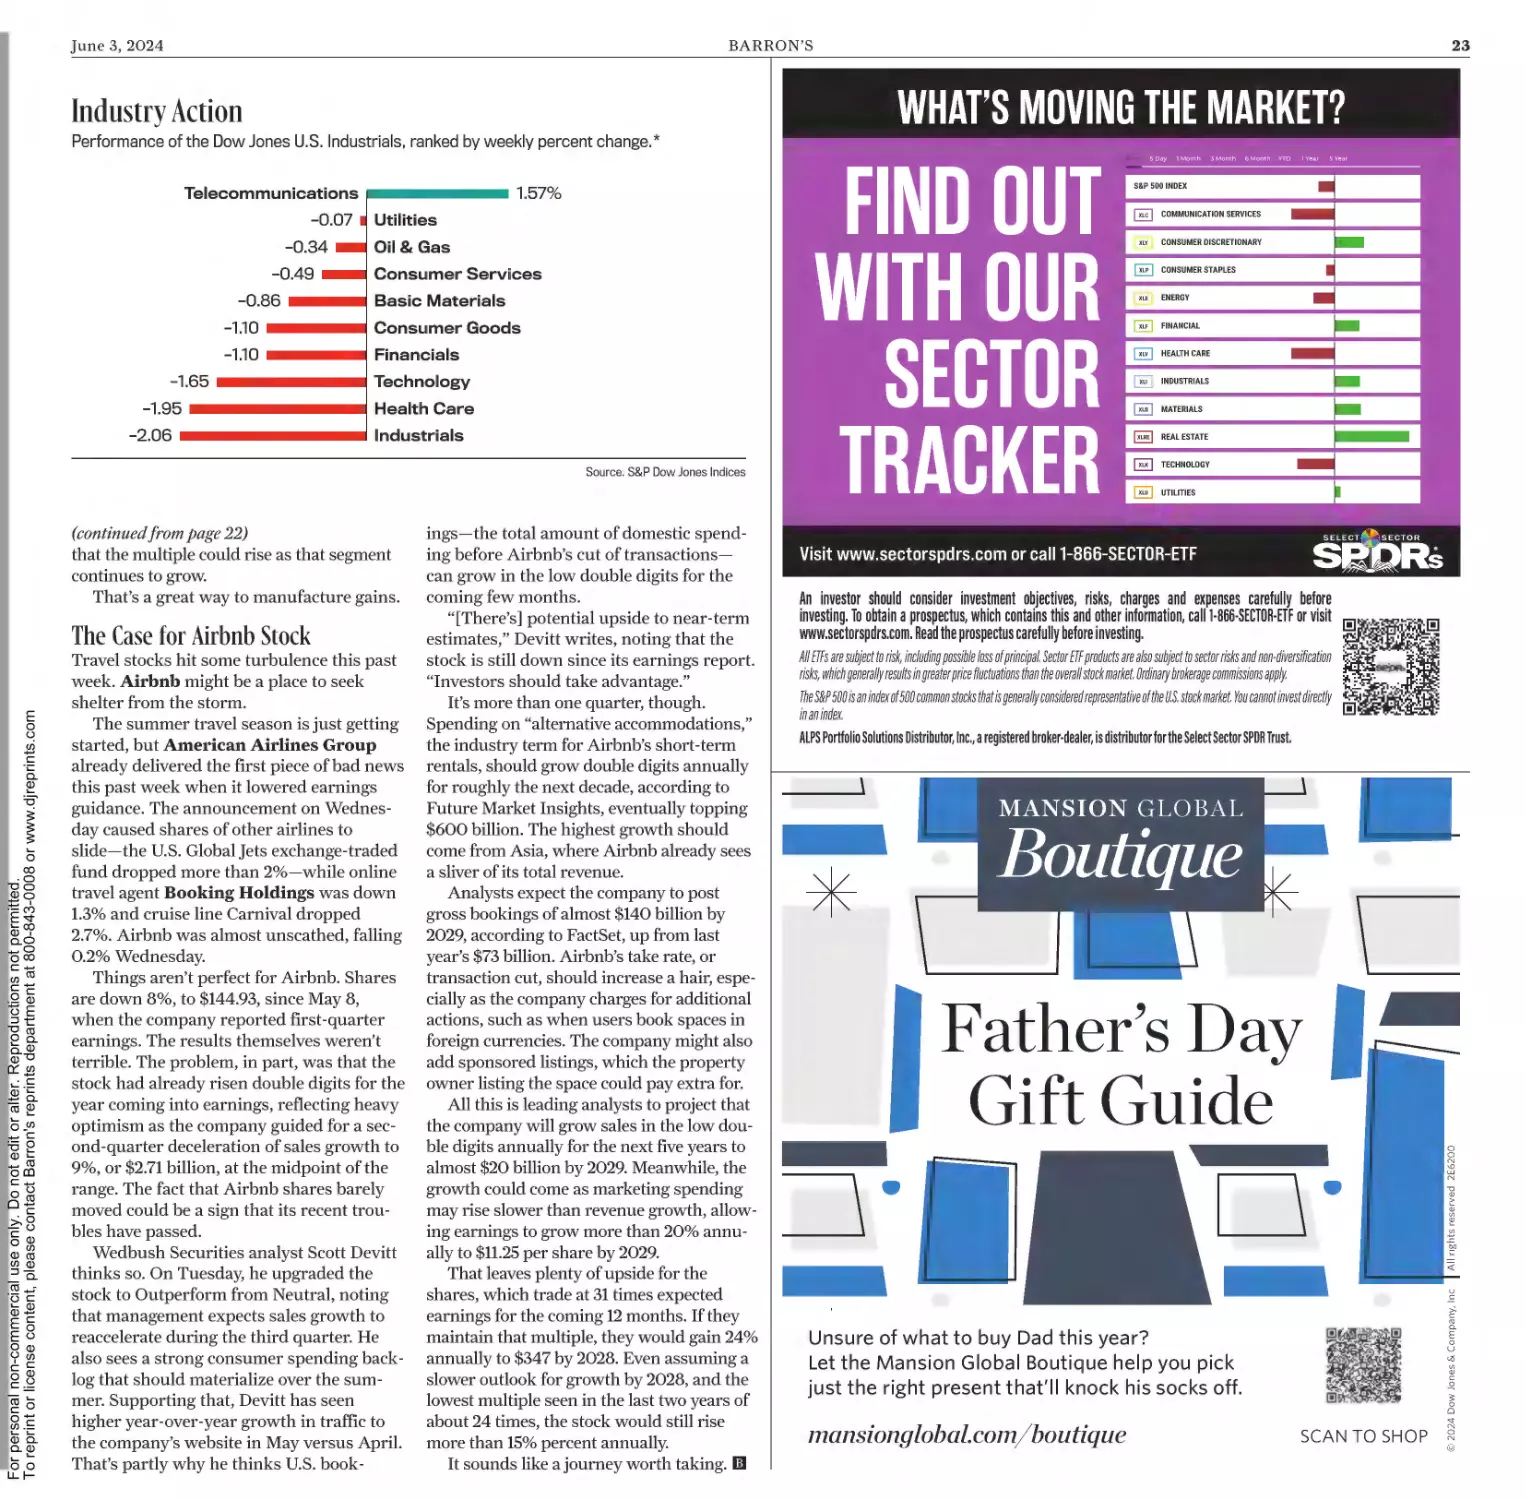
P. 22
Tap Into 7% Yields—
With a Tax Benefit
Nigel Parry /
Trunk Archive
Some preferred stocks offer a far
richer yield than the 4.65% rate on
30-year Treasuries. How to buy in.
© 2024 Dow Jones & Company,
Inc. All Rights Reserved.
By ANDREW BARY
BARRON’S (USPS 044-700) (ISSN
1077-8039) Published every
Monday. Editorial and Publication
Headquarters: 1211 Avenue of
the Americas, New York, N.Y.
10036. Periodicals postage paid at
Chicopee, MA and other mailing
offices. Postmaster: Send
address changes to Barron’s, 200
Burnett Rd., Chicopee, MA 01020
Index
P. 4
Winners & Losers
P. 27
Review & Preview P. 9
Research Reports P. 28
Inside Scoop
P. 26
Market Data
P. 29
13D Filings
P. 26
Mailbag
P. 47
Our newspapers are 100% sourced
from sustainable certified mills.
P. 5
P. 16
Up & Down Wall Street:
Out of AI, Into the Dow
Funds: How Bill Nygren
Beats His Peers
As the Nvidia-driven market loses
steam, consider shifting money
into the Dow industrials, led by
stalwarts such as UnitedHealth
and Goldman Sachs.
The Oakmark Fund’s star manager
lately likes Alphabet, Citi, and GM.
By BEN LEVISOHN
Income: Buy Big Tech
for The Dividends
P. 8
An Investing Strategy
for a Changing World
Other Voices: Portfolios need to
account for rising geopolitical risks
and structurally higher inflation.
By JOSEPH QUINLAN
By LAWRENCE C. STRAUSS
P. 17
Streetwise: Insurance
for Your Portfolio
By AL ROOT
Progressive, Hartford Financial,
Aon, and others are standouts in a
volatile industry.
Tech Trader: There’s
Hope for U.S. Chips
By JACK HOUGH
By BILL ALPERT
P. 17
Barron’s Roundtable
on Fox Business
Watch our TV show Fridays at
7:30 p.m. ET, and Saturdays and
Sundays at 9:30 a.m. and 10:30
a.m. ET. This week, Eurasia Group
President Ian Bremmer on risks of
escalation in the Ukraine war.
Plus, investors are demanding that
companies deliver on AI promises.
Anupam Nath/AP
For personal non-commercial use only. Do not edit or alter. Reproductions not permitted.
To reprint or license content, please contact Barron's reprints department at 800-843-0008 or www.djreprints.com
Navigating the New
Rules of Homebuying
For personal non-commercial use only. Do not edit or alter. Reproductions not permitted.
To reprint or license content, please contact Barron's reprints department at 800-843-0008 or www.djreprints.com
June 3, 2024
BARRON’S
EXECUTIVE LOUNGE.
BMWUSA.com
BMWUSA.
com
©2024 BMW of North America, LLC. The BMW trademarks are registered trademarks.
3
HAVING IT ALL NEVER FELT SO SIMPLE.
31" ENTERTAINMENT SCREEN.
4
I N D EX
A ABB . . . . . . . . . . . . . . . . . . . . . . . . . . . . . . . . . . . . . . . 10
Adobe . . . . . . . . . . . . . . . . . . . . . . . . . . . . . . . . . . . . . 16
Advanced Micro Devices . . . . . . . . . . . . . . . . . . . 17
AES . . . . . . . . . . . . . . . . . . . . . . . . . . . . . . . . . . . . . . . 22
Airbnb . . . . . . . . . . . . . . . . . . . . . . . . . . . . . . . . . . 23,28
Allstate . . . . . . . . . . . . . . . . . . . . . . . . . . . . . . . . . . . . . 8
Alphabet . . . . . . . . . . . . . . . . . . . . . . . . . . . . . . . . 16,17
Amazon.com . . . . . . . . . . . . . . . . . . . . . . . . . . 16,17,25
American Airlines Group . . . . . . . . . . . . . . . . 23,28
Anglo American . . . . . . . . . . . . . . . . . . . . . . . . . . . . . 9
Aon . . . . . . . . . . . . . . . . . . . . . . . . . . . . . . . . . . . . . . . . . 8
APA Group . . . . . . . . . . . . . . . . . . . . . . . . . . . . . . . . 16
Apollo Global Management . . . . . . . . . . . . . . . . . 17
Apple . . . . . . . . . . . . . . . . . . . . . . . . . . . . . 5,9,17,25,26
Arch Capital Group . . . . . . . . . . . . . . . . . . . . . . . . . 8
Arthur J. Gallagher . . . . . . . . . . . . . . . . . . . . . . . . . 8
ASML Holding . . . . . . . . . . . . . . . . . . . . . . . . . . . 5,18
AstraZeneca . . . . . . . . . . . . . . . . . . . . . . . . . . . . . . . 19
BARRON’S
Our index lists significant companies mentioned in stories and columns,
plus Research Reports, and Corrections & Amplifications. The references
are to the first page of the item in which the company is mentioned.
For personal non-commercial use only. Do not edit or alter. Reproductions not permitted.
To reprint or license content, please contact Barron's reprints department at 800-843-0008 or www.djreprints.com
D Deere . . . . . . . . . . . . . . . . . . . . . . . . . . . . . . . . . . . . . 22
Dell Technologies . . . . . . . . . . . . . . . . . . . . . . . . . 5,9
Delta Air Lines . . . . . . . . . . . . . . . . . . . . . . . . . . . . 16
Deutsche Telekom . . . . . . . . . . . . . . . . . . . . . . . . . 24
Diebold . . . . . . . . . . . . . . . . . . . . . . . . . . . . . . . . . . . . 26
Digi Communications . . . . . . . . . . . . . . . . . . . . . . 24
Dominion Energy . . . . . . . . . . . . . . . . . . . . . . . . . . 22
J Johnson Controls International. . . . . . . . . . . . . .5
J.P. Morgan Chase . . . . . . . . . . . . . . . . . . . . . . . 5,22
G Gamco Investors . . . . . . . . . . . . . . . . . . . . . . . . . . . 26
General Electric . . . . . . . . . . . . . . . . . . . . . . . . . . . 22
General Motors . . . . . . . . . . . . . . . . . . . . . . . . . . . . 16
Gildan Activewear . . . . . . . . . . . . . . . . . . . . . . . . . 26
Goldman Sachs Group . . . . . . . . . . . . . . . . . . . . 5,22
H Hartford Financial Services Group . . . . . . . . . . 8
HDFC Bank . . . . . . . . . . . . . . . . . . . . . . . . . . . . . . . 10
Hess . . . . . . . . . . . . . . . . . . . . . . . . . . . . . . . . . . . . . 9,13
Hims & Hers Health . . . . . . . . . . . . . . . . . . . . . . . 26
HP Inc. . . . . . . . . . . . . . . . . . . . . . . . . . . . . . . . . . . . . . 5
I ICICI Bank . . . . . . . . . . . . . . . . . . . . . . . . . . . . . . . 10
Illinois Tool Works . . . . . . . . . . . . . . . . . . . . . . . . . 22
M M&T Bank . . . . . . . . . . . . . . . . . . . . . . . . . . . . . . . . 22
Marathon Oil . . . . . . . . . . . . . . . . . . . . . . . . . . . . . 9,13
Marvell Technology . . . . . . . . . . . . . . . . . . . . . . . . . 5
K KKR . . . . . . . . . . . . . . . . . . . . . . . . . . . . . . . . . . . . . . 24
Lachlan Murdoch, Executive Chairman, News Corp
Rupert Murdoch, Chairman Emeritus, News Corp
Robert Thomson, CEO, News Corp Almar Latour, CEO, Dow Jones
EXECUTIVE VICE PRESIDENT AND GENERAL MANAGER
EDITOR IN CHIEF
EXECUTIVE EDITOR
Bob Rose
David Cho
SENIOR MANAGING EDITOR
DEPUTY EDITORS
Dan Shar
Lauren R. Rublin
Alex Eule, Ben Levisohn
Phil Roosevelt
EDITORIAL DIRECTOR, MAGAZINE
EDITOR AT LARGE
Andy Serwer
Matt Bemer, Daren Fonda, Amey Stone, Joe Woelfel
MANAGING EDITORS
Henry Cutter, Mel Gray, Mary Romano,
Robert Sabat, Rupert Steiner (London bureau chief)
ASSISTANT MANAGING EDITORS
ASSOCIATE EDITORS
Andrew Bary, Randall W. Forsyth, Jack Hough, Reshma Kapadia, Al Root, Eric J. Savitz
SENIOR WRITERS
Bill Alpert, Nicholas Jasinski, Tae Kim, Paul R. La Monica, Megan Leonhardt,
Joe Light, Elizabeth O’Brien, Teresa Rivas, Ian Salisbury, Avi Salzman, Rebecca Ungarino
REPORTERS
Jacob Adelman, Janet H. Cho, Adam Clark, Emily Dattilo, Catherine Dunn,
Sabrina Escobar, Anita Hamilton, Callum Keown, Evie Liu, Shaina Mishkin, Josh Nathan-Kazis, Angela Palumbo,
Laura Sanicola, Connor Smith, Jacob Sonenshine, Brian Swint, Karishma Vanjani, Andrew Welsch
STORY EDITORS
Ed Lin, Erin McCarthy, Liz Moyer, Patrick O’Donnell, Stacy Ozol,
Ross Snel, Neal Templin, J.J. Thompson
Michael J. Burlingham, Robert Teitelman
COPY DESK
E Eaton . . . . . . . . . . . . . . . . . . . . . . . . . . . . . . . . . . . . 5,22
Eli Lilly . . . . . . . . . . . . . . . . . . . . . . . . . . . . . . . . . . . 26
Entergy . . . . . . . . . . . . . . . . . . . . . . . . . . . . . . . . . . . 22
Exxon Mobil . . . . . . . . . . . . . . . . . . . . . . . . . . . . 5,9,13
F FedEx . . . . . . . . . . . . . . . . . . . . . . . . . . . . . . . . . . . . . 22
First Trust Inst’l Pfd Securities & Income . 22
Fortrea Holdings . . . . . . . . . . . . . . . . . . . . . . . . . . 26
Franklin Templeton . . . . . . . . . . . . . . . . . . . . . . . . 14
For Customer Service, call 1 (800) 544-0422, or go to
customercenter.barrons.com. For reprints of articles,
call 1 (800) 843-0008, or go to djreprints.com.
L Larsen & Toubro . . . . . . . . . . . . . . . . . . . . . . . . . . 10
Live Nation Entertainment . . . . . . . . . . . . . . . . 28
Lucid Group . . . . . . . . . . . . . . . . . . . . . . . . . . . . . . . 26
Lululemon Athletica . . . . . . . . . . . . . . . . . . . . . . . 28
LVMH Moet Hennessey Louis Vuitton . . . . . 18
Indian Railway Finance . . . . . . . . . . . . . . . . . . . . 10
Industrial Select Sector SPDR . . . . . . . . . . . . . 22
Intel . . . . . . . . . . . . . . . . . . . . . . . . . . . . . . . . . . . . . . . 17
iShares Preferred & Income Securities . . . . 22
B BHP Group . . . . . . . . . . . . . . . . . . . . . . . . . . . . . . . . . 9
Boeing . . . . . . . . . . . . . . . . . . . . . . . . . . . . . . . . . . . . . . 5
Booking Holdings . . . . . . . . . . . . . . . . . . . . 18,23,28
BP . . . . . . . . . . . . . . . . . . . . . . . . . . . . . . . . . . . . . . . . . 13
Broadcom . . . . . . . . . . . . . . . . . . . . . . . . . . . . . . . . . . . 5
Brown & Brown . . . . . . . . . . . . . . . . . . . . . . . . . . . . 8
BT Group . . . . . . . . . . . . . . . . . . . . . . . . . . . . . . . . . . 24
C C3.ai . . . . . . . . . . . . . . . . . . . . . . . . . . . . . . . . . . . . . . . . 5
Carnival . . . . . . . . . . . . . . . . . . . . . . . . . . . . . . . . . . . . 9
Caterpillar . . . . . . . . . . . . . . . . . . . . . . . . . . . . . . . . . 22
Chevron . . . . . . . . . . . . . . . . . . . . . . . . . . . . . . . . . . 9,13
Cincinnati Financial . . . . . . . . . . . . . . . . . . . . . . . . . 8
Citigroup . . . . . . . . . . . . . . . . . . . . . . . . . . . . . . . 16,22
Citi Trends . . . . . . . . . . . . . . . . . . . . . . . . . . . . . . . . 26
Citizens Financial Group . . . . . . . . . . . . . . . . . . . 22
CK Hutchison Holdings . . . . . . . . . . . . . . . . . . . . 24
ConocoPhillips . . . . . . . . . . . . . . . . . . . . . . . . . . . 9,13
Constellation Energy . . . . . . . . . . . . . . . . . . . . . . . 5
Costco Wholesale . . . . . . . . . . . . . . . . . . . . . . . . . . 28
June 3, 2024
IDEAS EDITOR
SENIOR AUDIO MANAGER
Matt Peterson
DEPUTY DIGITAL MANAGING EDITOR
Zoe Szathmary
Mette Lützhøft
Robert Cushing, Nick Devor, Clare McKeen
DIGITAL PRODUCERS
Chelsea Schiff
Lynne Carty, Shayanne Gal, Sue Ng
Sarina Finkelstein PHOTO EDITORS Alis Atwell, Nicole Silver
HEAD OF VISUALS
ART DIRECTORS
DIRECTOR OF PHOTOGRAPHY
RESEARCHER
STATISTICS MANAGER
Dan Lam
Michael T. Kokoszka
STATISTICIAN
Darren Chima
James H. Balmer
barronsstats@barrons.com CUSTOMER SERVICE 800-544-0422
ADVERTISING SERVICES MANAGER
NEWS
editors@barrons.com
STATISTICS
GLOBAL HEAD, WEALTH & ASSET MANAGEMENT
Jack Otter
Barron’s is a trademark of Dow Jones and its affiliates. Barron’s (USPS 044-700) (ISSN 1077-8039) Published every Monday. Editorial and Publication
Headquarters: 1211 Avenue of the Americas, New York, N.Y. 10036. Periodicals postage paid at Chicopee, MA and other mailing offices. Regular U.S.
subscription rate: one year, $359.88. Entire editorial content of this publication copyrighted by Dow Jones & Co., Inc. and must not be reproduced in whole
or in part without special permission. Unsolicited manuscripts should be accompanied by self-addressed envelope with proper postage. All advertising
published in Barron’s is subject to the applicable rate card, copies of which are available from the Advertising Director, 1211 Avenue of the Americas, New
York, N.Y. 10036. Barron’s reserves the right not to accept an advertiser’s order. Only publication of an advertisement shall constitute acceptance of the advertiser's
order. Postmaster: Send address changes to Barron’s, 200 Burnett Rd., Chicopee, MA 01020.
McDonald’s . . . . . . . . . . . . . . . . . . . . . . . . . . . . . . . . 19
Merck . . . . . . . . . . . . . . . . . . . . . . . . . . . . . . . . . . . . . . 9
Meta Platforms . . . . . . . . . . . . . . . . . . . . . . . . . . 17,25
Micron Technology . . . . . . . . . . . . . . . . . . . . . . . . . 17
Microsoft . . . . . . . . . . . . . . . . . . . . . . . . . . . . . . . . . 5,17
Mondelez International . . . . . . . . . . . . . . . . . . . . 19
N Netflix . . . . . . . . . . . . . . . . . . . . . . . . . . . . . . . . . . . . . 16
NextEra Energy . . . . . . . . . . . . . . . . . . . . . . . . . . . 25
Norwegian Cruise Line Holdings . . . . . . . . . . . . 9
Novo Nordisk . . . . . . . . . . . . . . . . . . . . . . . . . . . 18,26
NTPC . . . . . . . . . . . . . . . . . . . . . . . . . . . . . . . . . . . . . 10
Nvidia . . . . . . . . . . . . . . . . . . . . . . . . . . . 5,11,17,22,25
O Oakmark Fund . . . . . . . . . . . . . . . . . . . . . . . . . . . . 16
Oakmark Select . . . . . . . . . . . . . . . . . . . . . . . . . . . . 16
Orange . . . . . . . . . . . . . . . . . . . . . . . . . . . . . . . . . . . . 24
Overseas Shipholding Group . . . . . . . . . . . . . . . 26
P Parker-Hannifin . . . . . . . . . . . . . . . . . . . . . . . . . . . 22
Power Grid Corp. of India . . . . . . . . . . . . . . . . . 10
Procter & Gamble . . . . . . . . . . . . . . . . . . . . . . . . . 11
Progressive . . . . . . . . . . . . . . . . . . . . . . . . . . . . . . . . . 8
R Reliance Industries . . . . . . . . . . . . . . . . . . . . . . . . 10
Royal Caribbean Group . . . . . . . . . . . . . . . . . . . . . 9
Royal KPN . . . . . . . . . . . . . . . . . . . . . . . . . . . . . . . . 24
S Salesforce . . . . . . . . . . . . . . . . . . . . . . . . . . . . . . . . . . . 5
Samsung Kodex S&P500 Technology . . . . . . . 17
Shopify . . . . . . . . . . . . . . . . . . . . . . . . . . . . . . . . . . . . 26
Siemens . . . . . . . . . . . . . . . . . . . . . . . . . . . . . . . . . . . 10
SoftBank Group . . . . . . . . . . . . . . . . . . . . . . . . . . . . . 9
Spirit Airlines . . . . . . . . . . . . . . . . . . . . . . . . . . . . . 28
Super Micro Computer . . . . . . . . . . . . . . . . . . . . . 11
Swisscom . . . . . . . . . . . . . . . . . . . . . . . . . . . . . . . . . . 24
T Taiwan Semiconductor Manufacturing . . . . . . . 5
Tele2 . . . . . . . . . . . . . . . . . . . . . . . . . . . . . . . . . . . . . . 24
Telecom Italia . . . . . . . . . . . . . . . . . . . . . . . . . . . . . 24
Telesat . . . . . . . . . . . . . . . . . . . . . . . . . . . . . . . . . . . . 26
Tesla . . . . . . . . . . . . . . . . . . . . . . . . . . . . . . . . . . . . . . . 9
Texas Instruments . . . . . . . . . . . . . . . . . . . . . . . . . . 9
T-Mobile US . . . . . . . . . . . . . . . . . . . . . . . . . . . . . 9,24
TransDigm Group . . . . . . . . . . . . . . . . . . . . . . . . . . 5
U Uber Technologies . . . . . . . . . . . . . . . . . . . . . . 16,22
UiPath . . . . . . . . . . . . . . . . . . . . . . . . . . . . . . . . . . . . . . 5
UltraTech Cement . . . . . . . . . . . . . . . . . . . . . . . . . 10
Union Pacific . . . . . . . . . . . . . . . . . . . . . . . . . . . . . . 22
UnitedHealth Group . . . . . . . . . . . . . . . . . . . . . . . . 5
United Parcel Service . . . . . . . . . . . . . . . . . . . . . . 22
Universal Music Group . . . . . . . . . . . . . . . . . . . . 18
U.S. Cellular . . . . . . . . . . . . . . . . . . . . . . . . . . . . . . . . 9
Utilities Select Sector SPDR . . . . . . . . . . . . . . . 25
V Viking Holdings . . . . . . . . . . . . . . . . . . . . . . . . . . . . 9
Virgin Galactic Holdings . . . . . . . . . . . . . . . . . . . 26
Vistra . . . . . . . . . . . . . . . . . . . . . . . . . . . . . . . . . . . . . . . 5
Vodafone Group . . . . . . . . . . . . . . . . . . . . . . . . . . . . 24
W Walmart . . . . . . . . . . . . . . . . . . . . . . . . . . . . . . . . . . . 11
Waste Management . . . . . . . . . . . . . . . . . . . . . . . . 22
WD-40 . . . . . . . . . . . . . . . . . . . . . . . . . . . . . . . . . . . . . 11
June 3, 2024
BARRON’S
UP & D OWN WALL STREET
T
I-Hwa Cheng/Bloomberg
For personal non-commercial use only. Do not edit or alter. Reproductions not permitted.
To reprint or license content, please contact Barron's reprints department at 800-843-0008 or www.djreprints.com
AI: From the Market’s
Biggest Strength to
Its Biggest Weakness
he gap between
what artificial intelligence wants to
deliver and what it
can deliver is still
wide—and that
could be an issue
for investors, as well.
The promises of artificial intelligence are many. We’ll never have to
fill out a form, order takeout, or drive
a car for ourselves again. Eventually,
we’ll either end up like the human
beings in WALL-E, reclining in deck
chairs as robots do all the work,
or those in The Terminator, where
robots try to end humanity.
AI stocks have been the main
driver of the S&P 500 index this
year, whether it’s Nvidia, whose
chips make it go, or Microsoft,
which is benefiting from its relationship with ChatGPT and the use
of the technology in its products.
Apple has bounced after a tough
start to the year, thanks in part to
hopes that the technology will create
demand for AI-enabled iPhones.
All we needed to know was that
AI stocks were rising to know that
the market would rise, as well.
But there are signs that the riskreward for AI stocks isn’t quite what
it once was. For every C3.ai, which
surged 19% after reporting a smallerthan-expected loss, there was a UiPath, which tumbled 34% after offering below-consensus sales guidance
and announcing the surprise resignation of its CEO. And for every HP
Inc., which jumped 17% after beating
earnings forecasts and calling out its
“innovative portfolio of solutions
BY BEN
LEVISOHN
designed for the AI and hybrid era,”
there was a Dell Technologies,
which plunged 18% in Friday trading
after beating earnings by a penny.
Clearly, that wasn’t enough for a stock
that had gained 80% over the past
three months.
Betting on individual AI stocks
has been high-reward, high-risk all
through earnings season. 22V Research’s Dennis DeBusschere notes
that 86% of what he terms “AI Usage” companies have been beating
earnings since ChatGPT4 was released in 2022, better than the 78%
for the rest of the market. These
stocks also gained more when they
beat than the run-of-the-mill stock—
averaging a 0.3% rise after a beat this
past quarter against a 0.3% decline
after a beat for other stocks. But
5
With the rally losing steam, it might be time to
consider moving out of what has worked into
what hasn’t—the Dow Jones Industrial Average.
when they fall short of expectations,
watch out. AI stocks that miss
dropped an average of 5.3% after the
release, versus a 2.5% drop for other
companies. “The bottom line is these
names have higher beta to earnings
surprises,” DeBusschere explains.
Still, when it comes to the overall
market, only one AI stock truly
matters—Nvidia. Heading into its
earnings on May 22, its shares had a
correlation of 0.95 with the S&P 500,
according to Evercore ISI data. That’s a
fancy way of saying that the two moved
in almost perfect lockstep with each
other over the past year. While correlation isn’t the same thing as causation,
in this case, it’s pretty darn close.
But something has changed in
recent days. Shares of Nvidia gained
9.3% the trading day after its release,
an astounding feat for a company valued at more than $2 trillion. Nvidia’s
earnings also helped boost a select
group of other stocks, according to
22V’s DeBusschere: chip stocks like
ASML Holding, Broadcom, Marvell Technology, and Taiwan Semiconductor Manufacturing; industrials like Eaton, TransDigm Group,
and Johnson Controls International; and utilities like Constellation Energy and Vistra.
The S&P 500, however, finished
lower the day after Nvidia’s release.
“Momentum is very strong in the AI
An artificial-intelligence system using
an Nvidia GH200
Grace Hopper
Superchip on
display in Taipei.
trades,” DeBusschere writes. “The AI
trade off of Nvidia’s earnings did not
take the whole market with it.”
That’s concerning. While Nvidia
stock gained 20% over the three days
following its earnings, the S&P 500
dipped ever so slightly (less than one
index point), notes Evercore ISI strategist Julian Emanuel. The fact that the
third-largest stock in the S&P 500
could gain so much and the index
move so little puzzled him, so he went
looking for another example of a topfive holding in the S&P 500 gaining at
least that much with the index finishing lower. He couldn’t find one.
“Nvidia’s no longer being The Stock
That Is The Market will likely end the
market’s low volatility ‘hush’ of the
past two weeks,” he writes.
The calm does seem to be breaking,
if only a little. The Cboe Volatility
Index, or VIX, rose as high as 14.88
this past week from 12.36 on Monday,
as a little bit of noise crept into what
had been a very dull market. With the
rally losing steam, it might be time to
consider moving out of what has
worked into what hasn’t—the Dow
Jones Industrial Average.
Nothing has been more the antithesis of the AI-driven market than
the Dow. Nvidia isn’t in the benchmark, and because it’s price-weighted,
its largest holdings are UnitedHealth
Group and Goldman Sachs Group.
Microsoft comes in third, but Apple is
someplace in the middle, sandwiched
between JPMorgan Chase and Boeing. No wonder the blue-chip benchmark is up just 2.6% this year, far less
than the S&P 500’s 10.6% rise and the
Nasdaq Composite’s 11.5% gain.
It has also taken a beating of late,
thanks to a dismal update from UnitedHealth and disappointing earnings
from Salesforce, which, let’s face it,
never should have been swapped in
for Exxon Mobil.
Still, after dropping 4.7% since
crossing 40,000 on May 17, the Dow
was at its most oversold since September 2022 at Thursday’s close, according to the Bear Traps Report’s Larry
McDonald.
It might not be the robot’s choice,
but if the AI trade has run its course,
you could do worse than the Dow.
6
BARRON’S
June 3, 2024
Up & Down Wall Street (continued)
“Investing with a valuation
and defense. Value stocks with
Portfolio Manager,
Executive Director
For personal non-commercial use only. Do not edit or alter. Reproductions not permitted.
To reprint or license content, please contact Barron's reprints department at 800-843-0008 or www.djreprints.com
Schafer Cullen has become synonymous
High Dividend Equity
!
Value Equity
"
!
#
$ %
& $ %
' !
212.644.1800
Cullen Capital Management, LLC. (CCM) is an independent investment advisor
registered under the Investment Advisers Act of 1940 and is doing business as
Schafer Cullen Capital Management, Inc. (SCCM). The Cullen Funds Trust (CFT),
Investing involves risks, including loss of principal and may not suitable for all
investors.
F
ormer President Donald Trump
was convicted on all counts in
his New York hush-money trial
on Thursday, opening up an
uncertain new era in U.S. politics.
The Manhattan jury found him guilty
of 34 felonies related to falsifying business
records. Sentencing is scheduled for July 11.
This year has already threatened to
upend some of the truisms of American
public life. Polls show voters, stung by
inflation, reluctant to award credit to
the incumbent president for strong economic growth and low unemployment.
That has weakened one of the clearest
analytical guides to U.S. politics—the idea
that voters reward the leaders who make
them materially better off. Now, voters
have to contend with the unprecedented
fact that the other major-party candidate
has been convicted of crimes.
Trump is expected to appeal. Speaking
on Friday, after the verdict, he called the
judge crooked and announced that his campaign had raised $39 million in 10 hours.
For investors, for whom the biggest question of late might be whether to buy or sell
Nvidia, Trump’s conviction might seem
secondary. There was little immediate sign
in the markets that investors were changing
their positions based on the outcome of the
trial. But the difficulty of forecasting the
winner of the presidency, and the sharp
policy differences between the two candidates, raise the risk of a political shock in
November.
It’s normal for election-year uncertainty
to weigh on economic growth. Corporate
planners resist making spending decisions
that could be knocked off course if the presidency changes hands. Trump’s conviction
could turbocharge that effect.
Pollsters have for months been trying to
determine whether a conviction would help
sway voters. A recent Quinnipiac University
poll conducted during the trial found that
70% of voters were watching news of the
proceedings at least somewhat closely. Just
6% of Trump voters said they would be less
likely to vote for him were he convicted.
Is that enough to affect the margin of
victory in the handful of battleground
states that will determine the election outcome? The prosecution’s theory of the case
was that Trump’s team believed that his
conduct mattered to voters. In the government’s telling, a payoff to adult-film star
Stormy Daniels was intended to keep news
of Trump’s relationship with her out of
public view before November 2016. His
public standing had already been damaged
by the publication of Access Hollywood
tapes that showed disregard for women.
(Trump has said the payments to fixer
Michael Cohen were for legal services and
denies having an affair with Daniels.)
But voters knew both of those stories
by 2020, when Trump lost by narrow
margins. And even as the trial unfolded,
putting ugly stories about his conduct on
front pages almost daily for weeks, Trump
maintained a narrow lead in the polls.
Part of the problem here may simply
be that national opinion polling is a weak
guide to how voters will react in November,
especially this early. And that, in turn, is
because it’s too much to ask to try to process four years of change in the lives of hundreds of millions of citizens through the
lens of one yes-or-no decision in November.
Though, of course, we still do it.
Some people surely see their vote as a
moral endorsement of an individual. The
left-wing voters threatening to abandon
President Joe Biden over his support for
Israel are acting that way. But the presidency brings with it command of the military, control of administrative agencies,
nominations for judgeships, countless regulatory powers, and much more. And who
doesn’t want to back the winning team?
So, it’s easy for voters to back damaged
candidates. And that’s leaving aside the
virulent narrative that Trump has promoted that the court outcome was the
result of a politically driven witch hunt.
None of this is to say that this conviction means Trump will win the presidency,
or lose it. That’s still up in the air.
But that’s isn’t to say it’s unimportant,
either. Should Trump lose, some portion of
the electorate will believe it’s because political elites closed ranks against him. What
happens to that angry energy in our calcified political system is difficult to judge,
though the points of stress are clear. Congress has barely functioned this year,
while flirting with debt default. That dynamic isn’t likely to improve if voters continue supporting rejectionist candidates.
And what if he wins? The rule of law
underpins the health of markets and the
glorious returns they’ve delivered in recent
years. A president who believes that the
legal system has been weaponized against
him could test U.S. companies’ ability to
thrive, even though it’s hard to see how
anyone could knock off course the profitgenerating machines in the S&P 500 index.
That’s the bottom line. A decisive moment for Trump’s legal issues may turn out
to be anything but certain for the broader
political system and the economy.
— Matt Peterson
June 3, 2024
BARRON’S
7
THE HEALTH CARE SECTOR OF THE S&P 500 IN ONE ETF
Sector SPDRs allow you to invest in pieces of the S&P 500. Like Health Care. While adding diversification and reducing single stock risk. These ETFs
For personal non-commercial use only. Do not edit or alter. Reproductions not permitted.
To reprint or license content, please contact Barron's reprints department at 800-843-0008 or www.djreprints.com
combine the diversification of a mutual fund and the tracking of an index with transparency and liquidity.
XLV
HEALTH CARE SECTOR SPDR ETF TOP 10 HOLDINGS*
Company Name
Symbol
Weight
LLY
12.00%
UNH
8.62%
JNJ
6.71%
Merck
MRK
6.31%
AbbVie
ABBV
5.53%
Thermo Fisher Scientific
TMO
4.23%
Abbott Labs
ABT
3.54%
Danaher
DHR
3.12%
AMGN
2.82%
PFE
2.79%
Eli Lilly
Unitedhealth
Johnson & Johnson
*Components and weightings as
of 4/30/24. Please see website for
daily updates. Holdings subject
to change.
Amgen
Pfizer
Aninvestorshouldconsiderinvestmentobjectives,risks,chargesandexpensescarefullybeforeinvesting.Toobtainaprospectus,whichcontainsthisandotherinformation,call1-866-SECTOR-ETFor
visit www.sectorspdrs.com. Read the prospectus carefully before investing.
The S&P 500, SPDRs®, and Select Sector SPDRs® are registered trademarks of Standard & Poor’s Financial Services LLC. and have been licensed for use. The stocks included in each Select Sector Index were selected by the compilation agent.
Their composition and weighting can be expected to differ to that in any similar indexes that are published by S&P. The S&P 500 Index is an unmanaged index of 500 common stocks that is generally considered representative of the U.S.
stock market. The index is heavily weighted toward stocks with large market capitalizations and represents approximately two-thirds of the total market value of all domestic common stocks. Investors cannot invest directly in an index.
The S&P 500 Index figures do not reflect any fees, expenses or taxes. Ordinary brokerage commissions apply. ETFs are considered transparent because their portfolio holdings are disclosed daily. Liquidity is characterized by a high level
of trading activity.
Select Sector SPDRs are subject to risks similar to those of stocks, including those regarding short-selling and margin account maintenance. All ETFs are subject to risk, including possible loss of principal. Funds focusing on a single sector
generally experience greater volatility. Diversification does not eliminate the risk of experiencing investment losses.
ALPS Portfolio Solutions Distributor, Inc., a registered broker-dealer, is distributor for the Select Sector SPDR Trust.
8
BARRON’S
June 3, 2024
ST R E E T W I S E
Loss-making insurers have a convincing pitch for
regulators: Allow us to operate profitably, or we’ll
leave and you’ll be stuck with the job.
For personal non-commercial use only. Do not edit or alter. Reproductions not permitted.
To reprint or license content, please contact Barron's reprints department at 800-843-0008 or www.djreprints.com
Insurance Is Through
The Roof. These 7
Stocks Offer Refuge.
I
’m starting to feel like the pharaoh in The Ten Commandments—because of the plague
scenes, not because I’m trending toward Yul Brynner from
the forehead up. I went to
Houston recently, and a freak
storm brought wind so fierce that it
blew windows out of high rises and left
a million people without power. When
I got back to my little town north of
New York City, hail the size of quarters
took down tree branches and covered
streets in a pea soup of puréed leaves.
I was hoping for only frogs or boils
next. But when I checked my records,
I realized that my homeowner’s insurance premiums had jumped 70% over
three years. Not even Rameses II was
smited thusly.
It could be worse. In Houston, a
worker at my hotel told me that the
storm badly damaged her roof, and
she didn’t think insurance would
cover it. Like a rapidly rising number
of Americans in damage-prone areas,
she had been unable to secure private
coverage, forcing her into a skimpy
policy of last resort from the state.
It’s not just Texas—or Florida, or
California. Last year, 18 states had
unprofitable homeowner’s insurance
industries, leading carriers across the
country to jack up rates and turn finicky on coverage.
It’s also not just house insurance—
the cost of car coverage is up 48% over
three years, according to government
inflation data. And it’s not just due to
weather—inflation and litigation are
key factors. More on that in a moment.
There are important implications
here for household budgets and the
BY JACK
HOUGH
health of the housing market. But this
being an investment column, let’s focus
on what it means for insurance stocks.
Insurance can be a lucrative business. One key is to keep your combined
ratio—claims plus expenses as a percentage of premiums collected—safely
below 100%. Another is to put customer money to profitable use between
collecting it as premiums and paying it
out as claims. Some years are unlucky
for claims. That’s OK. A year of big
losses leads to price increases, which
leads to profits once claims normalize.
One hitch is that insurers typically
have to ask state regulators for permission to raise prices, which takes
time. So you can get volatile earnings,
but lately the ride has been particularly wild. Consider Allstate. In 2020,
earnings per share jumped 41% to
nearly $15. Two years later, Allstate
reported a loss. This year, it’s expected
to once again approach $15 a share in
earnings, and two years from now,
analysts see it topping $20. That’s because early in the Covid-19 pandemic,
customers stopped driving and claims
plunged—a windfall for insurers.
Then driving and claims rebounded,
and repair costs shot higher because
choked supply chains made cars much
more expensive, as did all those pricey
electronics packed into new vehicles.
Meanwhile, have you heard the term
“social inflation?” That’s an insurance
industry euphemism for liability judgments gone wild. The median size of
so-called nuclear verdicts—ones over
$10 million—increased by 35% from
2015 to 2020, according to an analysis
cited by Travelers. It argues that the
public has grown numb to the numbers; sentiment toward big companies
among jurors has declined; tort reform
has shifted into reverse; and plaintiffs
have sharpened their tactics. Take advertising. “If you’re a lawyer, especially
with the rise of social media, you can
be more surgical and quantitative in
how you’re targeting folks versus just
doing blanket ads you see on the highway,” says Mike Zaremski, an insurance analyst at BMO Capital Markets.
Wall Street has gotten in on the
courtroom money grab. The U.S. allows third-party investors to fund
cases that law firms might otherwise
find too shaky—in exchange for a cut
of the awards. With institutional cash
behind them, plaintiffs are less likely
to settle quickly and more willing to
hold out for a verdict, says Zaremski.
Loss-making insurers have a convincing pitch for regulators: Allow us
to operate profitably, or we’ll leave and
you’ll be stuck with the job. California
recently gave Allstate permission for a
30% price increase; New Jersey, 20%;
and New York, 14.6%. As profits rebound, so might policy growth.
Hence, 70% of analysts who cover
Allstate say to buy shares. One of the
BARRONS.COM/PODCASTS
Barron’s Streetwise
In a weekly podcast by Barron’s, columnist Jack Hough looks
at the companies, people, and trends you should be watching.
This is Wall Street like you’ve never heard before. Subscribe
to Barron’s Streetwise on Spotify, Apple Podcasts,
or your favorite listening app.
bears, Elyse Greenspan at Wells Fargo
Securities, views Progressive as being better positioned to win market
share. It has had a smoother ride on
earnings in recent years. Progressive
was an early adopter of telematics—
using a smartphone app or other device to track driver data in exchange
for discounts. Allstate and others have
gotten in on the game.
With car inflation subsiding, insurance price growth could slow meaningfully, says BMO’s Zaremski. That’s perhaps less true for homeowner’s
insurance, which has also been affected
by rising prices and repair bills. “The
weather trend is really not most people’s friend,” he says. Zaremski’s favorite stocks include insurance brokers
Arthur J. Gallagher and Brown &
Brown. Brokers collect fees for advice
and don’t carry the same underwriting
risk as insurers. Zaremski also likes
Cincinnati Financial for its pricing
power and what he estimates are abundant reserves to cover future losses.
Commercial insurance refers to
coverage bought by dry cleaners and
global corporations alike. That industry had a reckoning on losses and pricing just before the pandemic. “I’ve
never seen it quite this profitable,” says
TD Cowen analyst Andrew Kligerman.
His top picks include Hartford Financial Services for small-company
coverage and Arch Capital Group,
which specializes in coverage for
things that traditional carriers won’t
touch and where regulators, accordingly, allow underwriters a freer hand.
It also handles reinsurance, used to
transfer risk from insurers. Kligerman
also recommends broker Aon.
Many insurers participate in multiple markets, but given the challenges in
home insurance, Kligerman says he
feels fortunate that companies he covers have more exposure to auto insurance. It’s much larger than the home
insurance market. Apartment dwellers
have cars, and many households have
more than one. Plus, cars move, adding
to risk—although considering what’s
happening with the weather, says
Kligerman, “it feels like the houses are
moving, too.” B
email: jack.hough@barrons.com
June 3, 2024
BARRON’S
R E V IEW & PREV IEW
38,686.32
Dow Industrials: - 383.27
9
592.66
Dow Global Index: - 4.27
LAST WEEK
TH IS WEEK
Blue Skies
For Cruising
Illustration by Elias Stein
For personal non-commercial use only. Do not edit or alter. Reproductions not permitted.
To reprint or license content, please contact Barron's reprints department at 800-843-0008 or www.djreprints.com
Markets: Wall Street went to T+1,
meaning one-day trade settlement,
for the first time in a century. Eurozone inflation crept up in May, China
manufacturing fell, and markets
seemed to shrug off Donald Trump’s
conviction on 34 counts in his New
York hush-money trial. April inflation rose 0.3%, as expected. On a
holiday-shortened week, stocks
struggled: The Dow industrials fell
0.98%; the S&P 500, 0.51%; and the
Nasdaq Composite, 1.1%.
Annie Lennox may have been channeling the cruise
lines when she sang of traveling the world and the
seven seas in her 1983 hit “Sweet Dreams (Are
Made of This).” Today, millions are following her.
The top cruise operators, Carnival, Norwegian
Cruise Line Holdings, and Royal Caribbean, are
reporting record bookings. Royal Caribbean stock
trades above its prepandemic price. Carnival shares
are up 4% since Barron’s highlighted the stock in
early April. Norwegian caught an upgrade on Tuesday, and analysts launching coverage of newly public Viking Holdings have been giddy.
“The cruise industry has overcome a lot and is
now set to see margins expand over the next several
years,” wrote Melius Research analyst Conor
Cunningham. Despite previous boom-bust cycles,
much has changed, he says. Companies are tapping
a growing pool of potential customers rather than
poaching from one another. “The cruise industry is
2% of a $5.4 trillion travel and tourism market,” he
writes. “The opportunity to capture just 100 basis
points of share is huge for all players.”
New cruise travelers are likely to book another
trip. The value is compelling: It’s often cheaper to
book a cabin than a hotel room. The result of rising
demand and constrained capacity—shipbuilding
sank during the pandemic—is that industry earnings before interest, taxes, depreciation, and amortization could hit 30% to 40% of revenue, he says,
after five years in the red. — Teresa Rivas
Rising Tide
Cruise lines have long been prone to
boom-bust cycles, capped off by the
pandemic. Is this time different?
Royal Caribbean Group
Norwegian Cruise Line Holdings
Carnival
50%
0
-50
-100
2020
'21
'22
'23
'24
Source: FactSet
Return Customers
One big advantage for cruise stocks
today: constrained ship capacity and
a growing customer base.
Oceangoing Passengers
0 million
25
50
Sign up for the Review &
Preview daily newsletter at
barrons.com/reviewpreview.
Companies: SoftBank Group said it
would invest $8.9 billion in artificial
intelligence. Proxy adviser ISS joined
Glass Lewis in urging Tesla shareholders to reject the board’s $56 billion pay
plan for Elon Musk, but split on incorporating in Texas. Apple saw iPhone
sales in China rise 52% in April, after
discounting. Dell Technologies fell
18% after an earnings beat but a
smaller-than-expected AI server backlog. Elliott Management took a $2.5
billion stake in Texas Instruments.
Deals: Hess shareholders voted approve its $53 billion sale to Chevron—
a deal roiled by a dispute with Exxon
Mobil over Hess’ stake in Guyana oil
reserves. Exxon has taken the dispute
to arbitration…ConocoPhillips is
buying Marathon Oil in an all-stock
deal worth about $17.1 billion...BHP
Group walked after Anglo American rejected its request to extend takeover talks…Merck agreed to buy Eyebiotech for $1.3 billion...T-Mobil US
said it is buying U.S. Cellular’s wireless operation and 30% of its spectrum for $4.4 billion.
Monday 6/3
The Institute for Supply Management releases both its Manufacturing
and Services Purchasing Managers’
Indexes for May. Consensus estimate
for the Manufacturing PMI, which
will be announced on Monday, is for
a 49.6 reading, slightly more than
April’s 49.2. The Services PMI,
released on Wednesday, is expected
to come in a 50.8, compared with
49.4 previously.
Thursday 6/6
The European Central Bank announces its monetary-policy decision. The ECB is widely expected
to cut its key short-term interest rate
by a quarter of a percentage point to
3.75%. The policy paths of Europe’s
central banks are seen diverging
from the Federal Reserve’s, which
isn’t expected to cut interest rates for
some time.
Friday 6/7
The Bureau of Labor Statistics
releases the jobs report for May.
Economists forecast an increase of
180,00 in nonfarm payrolls, 5,000
more than in April. The unemployment rate is expected to remain unchanged at 3.9%. Jobs growth has
slowed to an average monthly increase of 245,500 this year, from a
blistering 314,208 over the past two
years, but is still above historical
trends.
2017
2018
2019
2020
2021
2022
2023
2024E
2025E
2026E
2027E
Source: Statista
THE NUMBERS
$172 B $4.92 $1.4 T 40%
U.S. mutual and
exchange-traded
funds net inflows
in 2024, after large
outflows in the two
prior years.
Orange juice futures per pound.
Already pricey,
they hit new highs
on fears of a poor
Brazilian harvest.
The market value
that Nvidia, Microsoft, Apple, and
Alphabet contributed to the S&P
500 index in May.
The rise in big bank
exposure to commercial real estate,
if loans to real estate investment
trusts are included.
BARRON’S
India Keeps Building Roads.
7 Stocks to Buy.
For personal non-commercial use only. Do not edit or alter. Reproductions not permitted.
To reprint or license content, please contact Barron's reprints department at 800-843-0008 or www.djreprints.com
As India’s prime minister seeks a third term, infrastructure is key to his
ambitions to make the country a global manufacturing center.
BY CRAIG MELLOW
I
ndia is building like crazy. Expenditures on road construction
have jumped 12-fold since Narendra Modi became prime minister
10 years ago. Budgets for urban
metro systems are up eight
times, and railroads five times.
Total infrastructure spending over
the past five years has come to about
$800 billion, estimates Srishti Ahuja,
an mergers-and-acquisitions partner at
EY in New Delhi who is focused on the
sector. Relative to gross domestic product, that’s similar to the U.S. spending
$6 trillion, or five times as much as its
huge 2021 infrastructure bill provided.
And it shows. “Dedicated freight
corridors” to Mumbai and other ports
will cut train times in half, says Angus
Shillington, deputy portfolio manager
for emerging market equities at VanEck. Adds Conrad Saldanha, a senior
emerging markets portfolio manager
at Neuberger Berman: “Indian airports
are much better than in the U.S.”
Modi, 73, promises much more of
the same in a third term, which he is
expected to win once votes are tallied
in India’s multistage election on June 4.
There’s just one thing missing from
this dynamic picture: private capital,
especially domestic private capital. India’s treasury has footed more
than 75% of the infrastructure bill so
far, estimates Miren Lodha, senior
director for research at Crisil Market
Intelligence & Analytics in India.
Modi could afford it, as a digitization campaign brought swaths of the
country’s informal economy online—
and paying taxes. Ever-improving
infrastructure is a key to Modi’s ambitions to make India a global manufacturing center, and to leapfrog
Japan and Germany as the No. 3
world economy.
Technocratic Modi lieutenants are
revising the creaky image of Indian
bureaucracy, pushing projects
through efficiently and with perceived
financial probity. “They’re really good
at laying down the regulatory stuff,
Spending on road
construction in India
has jumped since
Narendra Modi became prime minister
10 years ago.
June 3, 2024
then delivering at scale,” Shillington
says. Focus over the next five years
will shift to renewable power. Modi’s
government aims to install about 270
gigawatts of solar and wind power by
2030, nearly as much as current U.S.
capacity, says Lodha.
This sort of state spending can’t go
on forever, though. Modi has relaxed
the fiscal hawkishness of his early
years; combined central and state budget deficits may exceed 7% of GDP, a
sobering figure even at India’s rate of
growth. The government aims to double the private sector’s share of infrastructure investment over the next five
years, Lodha says. That means bringing in $225 billion to $250 billion.
India also needs public-private
partnerships to avoid the excesses of
its neighbor China, where state planners built ghost cities and roads to
nowhere along with genuine improvements. “India is on a very different
infrastructure journey from China
because a large part has been funded
by private players,” Ahuja says.
Or hopefully will be. Global longhorizon investors—Middle Eastern
sovereign-wealth funds, Canadian pension funds, family offices, European
utilities, and road builders—are starting to bite on India projects, Ahuja
says. “New investors are coming in,
and the deal sizes are getting larger.”
Indian domestic capital, not so
much. The dominant state banks are
just recovering from a 2018 crisis that
exploded nonperforming loan ratios
well over 10%—partly driven by massive credits to mining and telecommunications, infrastructure priorities
of the last decade. Smaller, bettermanaged privately owned rivals like
HDFC Bank and ICICI Bank have
all the business they can handle writing mortgages and other loans for a
burgeoning middle class.
The shift to renewable energy will
bring India’s big private conglomerates more into the mix. The country’s
two richest men—Mukesh Ambani of
Reliance Industries and Gautam
Adani, with his eponymous empire—
have large ambitions in solar power.
Newly built solar generation is already
cheaper than coal across the Asia-Pacific region, and will be a third
cheaper by 2030, predicts consultant
Wood Mackenzie.
The would-be Indian green oligarchs still face obstacles. Electricity
distribution remains largely in the
hands of regional state monopolies,
which work with aging equipment and
Fast Pace
Some of India’s infrastructure stocks are
outpacing the overall market.
Indian Railway Finance
Larsen & Toubro
Power Grid Corp. of India
iShares MSCI India ETF
800%
700
600
500
400
300
200
100
0
June 2022
‘23
‘24
Source: FactSet
politicians who force them to subsidize
farmers and other influential groups.
All of these challenges, however, look
more like footnotes to the momentous
history in progress with Indian infrastructure. The question is less whether
Modi is remaking the face of the country, but how fast and efficiently.
Cashing in on Indian infrastructure
stocks is another matter. “I believe in
the larger growth story, but it has not
been an easy space to invest in,” says
Venkat Pasupuleti, portfolio co-manager for India at Dalton Investments.
Larsen & Toubro, an engineering
firm that is the leading traditional sector play, looks pricey after a twothirds’ increase over the past year, at
least to Pasupuleti. “We may get back
in with a price correction,” he says.
L&T’s run is modest compared with
rail-related names like Indian Railway Finance, which has shot up fivefold. Other more-or-less blue-chip
infrastructure shares have doubled.
These include locally listed Indian
units of European equipment giants
Siemens and ABB, and state-owned
energy providers Power Grid Corp.
of India and NTPC, formerly National Thermal Power. That leaves cement as Pasupuleti’s preferred proxy
for infrastructure. Shares in industry
leader UltraTech Cement have gained
some 30% over the past 12 months.
Despite some wobbles on the campaign trail, a win for Modi looks about
as safe a bet as you can make in democratic politics. A continuation of India’s infrastructure revolution is safer
still; no one has an interest in stopping
it. Investing in that revolution is much
riskier business. B
Bhushan Koyande/Hindustan Times via Getty Images
10
June 3, 2024
BARRON’S
11
S I Z I N G U P S M A LL- CA P S
WD-40 Is Entering a
Growth Era. It’s a Buy.
BY TERESA RIVAS
For personal non-commercial use only. Do not edit or alter. Reproductions not permitted.
To reprint or license content, please contact Barron's reprints department at 800-843-0008 or www.djreprints.com
W
D-40 began life as the
Rocket Chemical Co.
Its stock could be
ready to take off.
Founded just ahead
of the Space Age in
1953, WD-40 is a
household name today. The low-viscosity oil is a multipurpose product that
provides lubrication for everything
from squeaky doors to stubborn nuts
and bolts, and rust prevention to boot.
Its name is short for the 40th iteration
of a water displacement product developed in the 1950s—a formula that’s still
guarded in a vault today.
WD-40’s blue and yellow can—perhaps the second-most recognizable
brand to use that color scheme, after
IKEA—has become a byword for the
market, as Google has become for
search. Some analysts put its brand
awareness at a near-perfect 98%. The
brand is so strong that it doesn’t need
to advertise, though it often gets used
in the ads of retailers, says Julie Kutasov, a portfolio manager at Kayne Anderson Rudnick, which was the company’s fourth-largest shareholder at
the end of the first quarter.
“WD-40 stands out when it comes
to consumer brands,” Kutasov explains. “It’s a brand that’s stood the
test of time.”
WD-40, which has a market cap of
$3 billion, has had a tough 2024.
Shares took a hit on April 10, falling
8.6%, after the company reported fiscal-second-quarter earnings that beat
analyst expectations. But those earnings were helped by a lower tax rate—
not investors’ favorite profit driver—
while sales came in a bit light. The
stock hasn’t recovered and is down
6% this year.
More worrisome than the drop
itself is the fact that shares still change
hands at 40 times 12-month forward
earnings, making it more expensive
than such hot growth stocks as
Nvidia and Super Micro Computer
and other high-quality stocks like
Procter & Gamble and Walmart.
The stock may just be worth it.
WD-40 is a perennially popular product, one that produces consistent
earnings and sales growth. The stock
is thinly covered on Wall Street, and
only one of the three analysts following WD-40 is bullish on the shares.
Even so, consensus estimates call for
earnings per share to climb 7.7% year
over year in the current fiscal year,
ending in August, to $5.44, and 13.3%
in fiscal 2025 to $5.89. In fact, those
estimates have edged higher over the
past three months, even as the stock
has fallen.
That looks like a buying opportunity to D.A. Davidson analyst Linda
Bolton Weiser. The company returns
25% on its invested capital, while
management is committed to boosting
gross margins, which were 51% last
year, to 55% by fiscal 2026, led by
lower supply costs and strong pricing
power in markets around the world.
WD-40 also consistently returns
cash to shareholders: It has bought
back $5.3 million of its stock this year
and has nearly $45 million left in its
repurchase authorization through
August 2025. It also features a 1.6%
dividend yield and has minimal net
debt, with about $60 million on its
balance sheet against 2024 earnings
before interest, taxes, depreciation,
and amortization, or Ebitda, of $107
million.
“[WD-40 is the] only global brand
in its category,” explains Weiser, who
believes shares should trade at $313,
up nearly 40% from Friday’s close of
$224.69. “[It has a] clean balance sheet
and a high-quality management team
WD-40
Lubricant manufacturer
Headquarters: San Diego
(WDFC / Nasdaq)
$300
Recent Price: $224.43
275
YTD Change: -6.1%
250
Market Value (billion): $3.0
225
2025E Sales (million): $612
200
2025E Net Income (million): $80
175
2025E EPS: $5.89
150
2025E P/E: 38.1
125
2022
'23
'24
Note: E=estimate; estimates for fiscal year ending August 2025.
Dividend Yield: 1.6%
Sources: Bloomberg, FactSet
WD-40’s blue and
yellow can—perhaps
the second-most
recognizable brand
to use that color
scheme, after IKEA—
has become a byword for the lubricant market, as
Google has become
for search.
with a clearly articulated growth strategy.”
Part of that strategy has been to sell
off underperforming brands. As part
of its April earnings report, it announced plans to divest its U.S. and
U.K. home-care and cleaning products
segment. While that didn’t sit well
with investors overall, it should allow
the company to focus on expanding
market share for its core, higher-margin business.
That would seem to leave WD-40
overly reliant on one product. Yet the
company has been expanding the uses
of the lubricant itself, including into
commercial areas, after being largely a
consumer brand. Besides the basic
formula, it sells engine degreasers,
corrosion inhibitors for wind turbines, electrical contact cleaners, and
lubricants that don’t attract dust,
which can be used on farming equipment and other machinery.
“WD-40 continues to find new
uses for its universal lubricant and
water repellent that already have a
million and one uses and solve a million different problems,” Tigress Financial Partners Chief Investment
Officer Ivan Feinseth noted following
the company’s earnings. “I believe
further upside exists from current
levels.”
WD-40 is a well-oiled machine,
and the stock should once again reflect that. B
Courtesy of WD40
A recent pullback in the lubricant company’s shares has created an
opportunity for investors. It’s ready to put a bad quarter behind it.
12
BARRON’S
June 3, 2024
New Rules
For Buying a
Home Are
Coming
The changes could lead to better
representation for consumers and
lower commissions. A guide to
getting the best deal.
A
major shift is coming this
summer to the way
homes are bought and
sold. The changes are
already under way in
many cities and suburbs
across the U.S. as the
prime selling season rolls on.
Rules on how homes are marketed
are being upended following a landmark $1.8 billion jury verdict in October in an antitrust case and a subsequent string of settlements. That, in
turn, could change how real estate
commissions are paid—and who foots
the bill.
Up until now, most buyers and sellers have been represented in home
transactions by their own agents, who
each earn a commission on sales. Sellers make a blanket offer in the earliest
stages of listing a home to a seller’s
agent, who generally pays the buyer’s
agent commission out of the sale proceeds. That means buyers don’t have to
think about their agent’s fee. But under
changes set to begin on Aug. 17, commissions will join the list of items—
such as who pays to replace the roof—
that are hashed out at the negotiating
table by both buyers and sellers.
This move, among others, should
create more transparency about the
process—and create more competition
among agents. That could lead to better representation for consumers,
lower commissions, and fewer unproductive agents.
Things are bound to be messy and
rife at first, with pitfalls for buyers,
sellers, and agents before the changes
become commonplace. “It’s not like this
light switch flipped and now we do
things a certain way,” says Massachusetts-based Compass real estate agent
Dana Bull. “We need to adapt based on
what happens in our local market.”
The residential property market’s
myriad rules were confusing before,
so it’s even more important to explore
this unfamiliar landscape. Barron’s
has done the legwork to come up with
a guide to navigating the new terrain.
Negotiations Are Key
The negotiation process will become
even more important, so embrace it.
Consumers stand to save: The average
buyer’s agent commission will drop
about 0.1 percentage point annually to
2.1% in 2027, while the seller’s agent
commission will remain flat, estimates
Soham Bhonsle, a BTIG analyst covering real estate brokerages.
There’s no set rate, but the average
total commission is about 5.5% of a
home’s sale price, according to a survey by real estate referral company
Clever, with about 2.8% going to the
listing agent and 2.7% going to the
buyer’s agent.
Currently, a buyer’s agent knows
from the start how much they’ll earn
from any given home sale. Agents
advertise the amount a seller is willing
to pay a buyer’s agent when a home is
listed. This practice kept fees higher
for sellers than they should have been,
a group of them claimed in their lawsuit, and the federal jury agreed.
Under the changes, offers of compensation can’t be made on most multiple-listing services, the networks
agents use to share home listings with
each other. This was a point of contention in the lawsuits, which claimed the
practice didn’t allow room for negotiations over the cost and services of a
buyer’s agent that would drive commissions lower. Now buyers and sellers are more likely to be able to haggle
over the fee as part of negotiations.
It may be tempting for sellers to
decide they’ll pay only their agent’s fee
and offer nothing to the buyer’s
agent—but that can be costly for the
seller. “Any seller’s agent worth their
salt” will explain how foregoing any
offer entirely is unwise, says Laurie
Goodman, founder of the Urban Institute’s Housing Finance Policy Center,
as it could reduce the number of offers
by pricing out some buyers.
New Contracts
Another big switch is the soon-to-bemandatory buyer agreements outlining
a broker’s fees and services from the
get go. These contracts are common
practice in some states and brokerages,
but in general buyers either weren’t
required to sign them or signed them
late in the process. The advantages to
this change: Buyers will get a detailed
outline of the process at the start of
their home search and can evaluate the
services they’re willing to pay for.
Contracts, however, aren’t uniform.
A good contract will be easy to understand, and the agent should review it
with a potential client. “Find somebody
who’s experienced, competent, and
honest,” says Stephen Brobeck, the
former executive director at the consumer advocate Consumer Federation
of America, who published a report in
Illustration by Jan Buchczik
For personal non-commercial use only. Do not edit or alter. Reproductions not permitted.
To reprint or license content, please contact Barron's reprints department at 800-843-0008 or www.djreprints.com
BY SHAINA MISHKIN
For personal non-commercial use only. Do not edit or alter. Reproductions not permitted.
To reprint or license content, please contact Barron's reprints department at 800-843-0008 or www.djreprints.com
June 3, 2024
February outlining differences in
buyer agreements. Review an agent’s
previous sales to gauge their experience, and check if your state provides
an online database to research an
agent’s disciplinary history.
The scope and cost of the agent’s
services are details that need to be
included. Look for information about
terminating an agreement that isn’t
working and extra fees outside of
commissions. These can be a nonspecific “administrative,” “transaction,”
or “regulatory compliance” fees, according to Brobeck’s report. “It’s really
about customer transparency and
understanding who’s doing what in
this process,” Joe Rath, head of industry relations at online broker Redfin,
tells Barron’s.
Before signing an agreement, buyers
should understand what happens if a
seller isn’t willing to pay the full commission. That discussion “introduces a
level of negotiation that wasn’t there
before,” says Brian D. Schneider, an
antitrust attorney at ArentFox Schiff,
who represents two Realtor associations involved in commission lawsuits.
Different Services
Buyers can shop without an agent—but
that doesn’t mean they should. Costsensitive consumers should consider a
range of representation and weigh the
services they’re getting against the cost
before deciding to go it alone.
“As we say all the time, fee is only
an issue in the absence of value,” says
Paul Karger, the co-founder of Bostonbased wealth advisory firm TwinFocus, which has $7.9 billion under advisement. “You’ve got to know what
you’re getting for the fee.”
Agents offer insight into local processes, regulations, and quirks that a
buyer might have trouble navigating on
their own, says Rich Rosa, co-founder
of buyer’s agent real estate firm Buyers
Brokers Only. “There are obvious
things that I’m going to see that a client
is not going to see,” he says.
An agent typically leads clients
through the entire process, evaluating
their options, helping navigate local
rules, scheduling tours, negotiating
offers, and facilitating a smooth closing. Not every agent delivers the same
services—or quality. A 2023 Freddie
Mac study found that comparing four
or more quotes from mortgage lenders
saves buyers up to $1,200 a year. The
selection process for an agent
shouldn’t be any different.
In some instances, nothing will
13
BARRON’S
change. Some sellers will continue to
offer to pay a buyer’s agent, just not
on the listing service. But buyers concerned about fees can seek out lowercost agents, or those who offer discounts.
Some agents and brokerages offer
rebates, paying buyers who use their
services some of their commission
after closing, or other perks. Redfin,
for example, offers discounts to sellers
who also buy with the company.
Buyers who have done the legwork
of identifying a house they are interested in could consider streamlined
services, which are becoming more
common among agents.
Gea Elika, the managing principal
broker at New York City–based Elika
Real Estate, rolled out a “light” service
option—charging buyers a flat out-ofpocket fee—late last year.
In this model, the brokerage will
review a listing price, submit and negotiate an offer, provide guidance, and
prepare the application for $3,500,
$5,000, or $7,500, depending on the
price of the home. The other perks are
left out. “We just wanted to have a
menu of services to enable a broader
spectrum of buyers,” Elika says.
Potential Road Bumps
There are roughly 2½ months before
the changes formally start, and even
longer before the settlement’s final approval hearing in late November. That’s
plenty of time to work out the kinks—
and for others to come to light.
Take Veterans Affairs loans. Borrowers who use this benefit are barred
from paying real estate agent commissions. There are concerns that veteran
borrowers will be disadvantaged under the new rules. But the rules will
likely change. The Department of Veterans Affairs is “fully committed to
ensuring that veterans are neither
disadvantaged nor overcharged in the
homebuying process,” spokesman
Terrence Hayes said in a statement.
For consumers, the adjustment
period could be tricky. Some home
sales could fall through if buyers and
sellers fail to come to terms on agent
commissions.
Road bumps will lessen as buyers,
sellers, and real estate professionals
get used to the new normal. “We have
navigated loads of changes over the
decades—double-digit interest rates,
the Great Recession,” says Re/Max
president Amy Lessinger. “What I
have learned in my 30 years is that we
adapt, we shift, we change.” B
Rockefeller’s Oil Empire Is
Coming Together Again
A series of the mergers and acquisitions are reassembling the ‘octopus’
that was broken up by the Supreme Court in 1911.
BY KENNETH G. PRINGLE
I
t’s as if John D. Rockefeller is
reaching out from the grave to
reassemble his old Standard Oil
monopoly.
ConocoPhillips’ $22.5 billion all-stock acquisition of
Marathon Oil—both former
pieces of Standard Oil—is the latest
consolidation deal in the oil patch, as
companies look to bolster their reserves in a fossil-fuel industry still
raking in profits despite growing climate-change concerns.
The deal follows Exxon Mobil’s
$60 billion takeover of Pioneer Natural Resources and Chevron’s $53 billion purchase of Hess, part of $250
billion in energy mergers-and-acquisitions activity in 2023.
Nearly every deal involves companies that were at one time part of
Rockefeller’s oil empire. At its height,
Standard Oil controlled 90% of the
U.S. market. But accusations of monopoly dogged it, and in 1911 regulators broke it up into 34 smaller companies.
They have been trying to get back
together ever since.
Before he became the world’s richest man, Rockefeller was a small-time
wheeler-dealer. He sold produce to the
Union Army during the Civil War,
then moved into crude oil, which he
bet would replace whale oil as a power
source.
Starting with a single refinery in
1863, Rockefeller built his company
with a ruthlessness that frightened
competitors and spurred attacks from
politicians and journalists.
Standard Oil “has throttled every
man or weaker corporation which
refused to do its bidding,” wrote the
Chicago Tribune on May 21, 1887,
comparing the company to an “octopus in some vast sea pool…fattened
and strengthened daily upon the victims swept into its maw.”
The Continental Oil and Transportation Co.—Conoco—was swept into
Standard Oil’s maw in 1885; the Ohio
Oil Co., Marathon’s predecessor, followed four years later. In 1872’s “Cleveland Massacre,” Rockefeller acquired
22 of 26 competitors in that city.
Standard Oil was controlled by a
“trust” comprising nine men controlling 41 companies; it owned everything from pipelines and tankers to
railroads. Standard Oil didn’t answer
to the market—it was the market.
That ended in 1911, as trumpeted on
front pages nationwide, even drawing
a rare multiple-deck headline in The
Wall Street Journal: “STANDARD
OIL CO. DISSOLUTION ORDERED
BY SUPREME COURT.”
The justices unanimously decided
that Standard Oil had engaged in “unreasonable” restraint of trade—a qualification that would color all subsequent antitrust decisions—and split it
up.
Besides the predecessors to ConocoPhillips and Marathon, other Standard Oil spawn included Standard of
Indiana, which became Amoco, now
part of BP; Standard of Ohio, which
became Sohio, also part of BP; and
Standard of California, which became
Chevron.
The most prominent of Rockefeller’s progeny were Standard of New
Jersey, which became Exxon; and
Standard of New York, later Mobil. In
1999, these two combined to form
Exxon Mobil.
“It seems that for oil and gas companies, size really has mattered,” Barron’s wrote on May 28, 2001, as Chevron was courting Texaco for yet
another merger.
Much the same is being said today,
during another era of industry consolidation, which seems to be drawing
back the old pieces of Standard Oil
like a magnet.
Rockefeller, who remained unrepentant about what he had built—he
called Standard Oil “one of the greatest, if not the greatest, of upbuilders
we ever had in this country”—would
probably be pleased. B
BARRON’S
The Fed Won’t Cut
Rates This Year
Federal Reserve Chairman Jerome Powell and his team had
expected to lower interest rates in 2024. But sticky inflation, a
strong economy, and calendar quirks are thwarting their plans.
For personal non-commercial use only. Do not edit or alter. Reproductions not permitted.
To reprint or license content, please contact Barron's reprints department at 800-843-0008 or www.djreprints.com
BY NICHOLAS JASINSKI
Federal Reserve Chairman
Jerome Powell prepares
to deliver remarks in
Washington, D.C.
T
he Federal Reserve
isn’t likely to lower
interest rates in
2024. Elevated
inflation, a resilient economy, and
a still-strong, if
softening labor market argue against
the need for easing monetary policy,
especially as these conditions are
expected to persist through year end.
Nor is an increase in interest rates
seriously in the cards. Despite an
inflation scare earlier in the year, the
rate of price growth continues to
move, slowly, in the right direction,
heading toward the Fed’s 2% annual
target.
That means the central bank can
keep its federal-funds rate target, for
now, in the range of 5.25% to 5.50%,
June 3, 2024
where it has been since July 2023—
and the stock market might not
mind.
Think of the Fed’s policy stance as
higher for longer than almost anyone
anticipated, because the U.S. economy
has been stronger for longer than
almost anyone imagined.
Back in January, investors were
banking on at least six interest-rate
cuts totaling 1.5 percentage points
over the next 12 months, based on
pricing in the interest-rates futures
market. Central bank officials, who
had lifted rates by 5.25 percentage
points from March 2022 through July
2023 to curtail a spike in inflation,
had penciled in three quarter-point
cuts for the year.
But the Federal Reserve, under
Chairman Jerome Powell, is an
avowedly data-dependent institution,
and the data haven’t complied with
either forecast. Specifically, inflation
remains uncomfortably stuck at
nearly 3%, above the Fed’s annual
target. The release, on May 31, of the
personal consumption expenditures
price index reading for April confirmed the Fed’s conundrum: The
measure rose 2.7% in the year through
April, following gains of 2.7% in
March and 2.5% in both January and
February.
A more-or-less sideways move
isn’t bad news, considering that PCE
inflation has fallen from a high of
7.1% in the summer of 2022. But it
isn’t good news, either. Fed officials,
including Powell, have emphasized in
recent remarks that they need greater
confidence that inflation is sustainably trending toward a 2% annual
rate before they can consider cutting
rates.
“The Fed is willing to be patient
until they’re convinced that inflation
is good and dead,” says Wylie Tollette, chief investment officer of
Franklin Templeton Investment Solutions. “It’s clear that they’ve been
looking at what happened in the
1970s, when the Fed took its foot off
the brake too soon and inflation came
roaring back.”
Thanks to a decent economy—real
gross domestic product has expanded
by 2.9% in the past four quarters—the
Fed has the luxury of time to wait for
better inflation readings. “Theory
dictates that the combination of restrictive rates and quantitative tightening should soften the economy over
time,” says Jason Granet, chief investment officer at BNY Mellon. “What
Chip Somodevilla/Getty Images
14
For personal non-commercial use only. Do not edit or alter. Reproductions not permitted.
To reprint or license content, please contact Barron's reprints department at 800-843-0008 or www.djreprints.com
June 3, 2024
has been surprising for most economists and market participants is the
slow speed at which that has been
happening.”
There are many reasons for the
economy’s resilience in the aftermath
of the Covid-19 pandemic, and many
relate to the consumer’s persistent
strength.
Although recent readings of the
University of Michigan’s Consumer
Sentiment Survey have been near
multidecade lows, retail sales rose 3%
in the past year. Household wealth
has increased meaningfully in the
past several years across all income
levels, due to pandemic stimulus payments, wage growth, and the booming stock and housing markets.
Unemployment, now at 3.9%, has
held below 4% for more than two
years, the longest such stretch in
more than half a century. Unfilled job
openings have declined significantly
from a peak in early 2022, but remain
well above prepandemic levels.
“All the hand-wringing about a
slowdown in the labor market has
been premature,” says Lara Rhame,
chief U.S. economist at FS Investments. “People have a tendency to
mistake normalization for weakness,
when in fact the labor market remains
quite strong.”
In other words, the Fed doesn’t
need to lower interest rates to achieve
full employment, part of its dual
mandate along with promoting price
stability.
T
o be sure, not all economists
have written off rate cuts this
year. Tom Porcelli, chief U.S.
economist of PGIM Fixed Income,
cites the moderating pace of hiring in
more-cyclical sectors of the economy,
a decline in temporary-help-services
jobs this year, and a lower percentage
of firms intending to increase employment according to surveys. All three
factors suggest a labor market that is
losing momentum.
“The Fed knows all of this, and I
think what’s in their minds is the
thought that if they can get some cuts
in, they can help extend the cycle,”
Porcelli says. “I have a lot of sympathy for the idea.”
Porcelli sees Powell and other Fed
officials as predisposed to lowering
rates, and just waiting for the opportunity to do so. He expects at least
one quarter-percentage-point rate cut
by the end of 2024, if not two.
“How would that opportunity
15
BARRON’S
Higher for Longer
The Federal Reserve raised interest rates rapidly from 2022 to
2023. Borrowing costs will be slow to come back down.
Effective federal-funds rate
March '24 FOMC median projection
6%
5
4
3
2
1
0
2020
'21
'22
'23
'24
'25
'26
'27
Sources: Bloomberg, Federal Reserve Board of Governors
Sticky Business
Inflation decelerated in 2023, but progress in cooling price
growth has stalled this year, forcing the Federal Reserve to
put off interest-rate cuts.
Core PCE M/M change (annualized)
Six-month average
8%
6
5.1
4.5
4
3.1
2.3
2
0
July
2022
Oct.
Jan
2023.
April
July
Oct.
Jan.
2024
April
Note: Core PCE=personal consumption expenditures price index less food and energy
Sources: Bloomberg, Federal Reserve Bank of Minneapolis
present itself?” Porcelli says. “If you
get some weakness in the labor market, that would get them to go. But it’s
simpler than that: They just need
more inflation numbers going in the
right direction.”
Time isn’t on the Fed’s side this
year, however. Rate cuts at the Federal Open Market Committee’s June
and July meetings are widely thought
to be off the table, given the lack of
progress on inflation so far in 2024.
The September meeting will be “live,”
meaning a decision could be made in
the moment, but again, the data
aren’t likely to cooperate, due to the
economy’s enduring strength and
technical factors.
Base effects are one example. The
PCE price index rose by 0.1% in May
2023, 0.2% in June of last year, and
0.1% in July. If inflation increases at a
faster pace during the same months
this year, the inflation rate will rise
year over year, making it difficult for
Fed officials to gain the confidence
they desire that inflation is cooling
toward 2%. The PCI price index
hasn’t risen by less than 0.3% a
month so far in 2024.
What about the November meeting? It will begin on Nov. 6, the day
after Election Day, and unless the
data scream for a change in interest
rates, FOMC members probably
won’t want to make waves, given the
timing.
That leaves December as the last
opportunity for a rate cut in 2024,
but there are strong arguments for
the status quo to hold.
For one, tighter monetary policy
has been offset in the past two years
by looser fiscal policy, and there is
little reason to expect diminished
federal largess in an election year—or
in 2025, either. “Nothing is so permanent as a temporary government program,” as economist Milton Friedman
famously said.
The U.S. federal budget deficit is
on track to hit $1.5 trillion in the current fiscal year that ends on Sept. 30,
equivalent to about 6% of U.S. GDP.
That’s a powerful boost to growth
that will continue to flow into the
economy through the end of the year.
Monetary policy, meanwhile, might
have a less powerful impact on the
real economy than in past interestrate cycles, partly because of the legacy of ultralow rates that prevailed
from 2009 to 2022. As a result of that
period, millions of homeowners are
sitting with 30-year mortgages fixed
at rates below 4%. Corporations likewise took the opportunity to refinance at historically low rates and
extended their borrowings, while
many of the largest U.S. companies
are net interest earners.
Also, while bank lending standards might have tightened, firms
have other options for raising cash
these days, including private debt and
private-equity funds. And broader
measures of financial conditions in
the U.S. economy are in easy territory.
The Chicago Fed’s National Financial
Conditions Index is as loose as it was
in January 2022, two months before
the Fed began increasing interest
rates. Rising stock prices and tight
credit spreads are inputs to financialconditions indexes.
A 21st century shift to more software-based, capital-light businesses
further insulates economic activity
from changes in interest rates, and
that’s before artificial intelligence
really takes off.
The result is that it’s taking longer
than usual for the sharp rise in interest rates to restrict economic activity,
another reason that the Fed might
conclude it makes sense to keep rates
steady for a lengthy period.
“The economy is like an 18wheeler—it has a lot of momentum
going along,” Rhame says. “In prior
cycles when the Fed slammed on the
brakes [by raising interest rates], that
probably hit eight or 10 of those
wheels. I’d argue that this time
around, it’s only braking on four or
six of the 18 wheels.”
At some point, says BNY Mellon’s
Granet, older debt will need to be
refinanced, and higher rates will
start to bite. But we’re not there yet.
Higher interest rates have dampened
activity in housing and other ratesensitive areas of the economy such
as autos, but consumer spending on
services and experiences continues to
grow. And growth areas such as AI
remain unaffected by the policy
backdrop.
Tollette, of Franklin Templeton,
expects steady rates to have a minimal impact on the stock market, despite many investors’ professed
hopes for rate cuts. Tollette expects
the major indexes to trade sideways
for the remainder of 2024. That’s
after the S&P 500 index returned
27% in the past year.
“We don’t see a significant drawdown in the offing,” Tollette says.
“Although we see economic growth
softening, we’re not expecting a recession….While some of the AI stocks are
frothy, there is real opportunity there
that should support valuations.”
Still, monthly data on jobs, inflation, and economic activity will move
the market in the months ahead, and
could inject more volatility. Election
uncertainty will become more front of
mind as November approaches and
could be another source of turbulence. But absent a data shock that
materially changes the Fed’s calculus,
the stock market probably will sail
through the noise.
“Nominal growth is still really
good,” Rhame says. “And if you have
the growth, you don’t need rate cuts
for markets to continue to move
higher.” B
16
BARRON’S
June 3, 2024
F UN DS
A new high for the market, says Bill Nygren, is “not
nearly as rare as people try to make it sound; nor
is it as dangerous as they try to make it sound.”
For personal non-commercial use only. Do not edit or alter. Reproductions not permitted.
To reprint or license content, please contact Barron's reprints department at 800-843-0008 or www.djreprints.com
Why This Top Value
Manager Likes
Alphabet and Citi
B
ill Nygren, an eclectic
value investor, tries
not to get too caught
up in the market’s
latest vagaries.
Nygren has played
a key role in running
the $21.4 billion Oakmark Fund
(ticker: OAKMX) since 2000, and he is
looking for bargains, as always. But his
approach to value investing at times
has been more receptive to fastergrowing stocks, unlike more traditional value managers.
“Buying great businesses at average
prices is just as much value investing
as buying average businesses at great
prices,” says Nygren, who has begun
to think about a timeline for stepping
away from his portfolio management
duties—though not anytime soon.
A few years ago, his holdings included Amazon.com, Uber Technologies, Netflix, and Adobe—not
typical cheap value stocks.
In calculating a stock’s valuation,
Nygren says, it’s important to consider
intangible assets such as research and
development, intellectual property,
and customer acquisition costs.
“As the economy has moved to
more of an information economy, intangible assets have become much
more important,” he says.
A few tech stocks with a higher
growth profile remain in the Oakmark
Fund, notably Alphabet, its largest
holding as of April 30.
Nygren, however, sold most of
those growthier holdings by the end of
2022 and has since focused on more
traditional value stocks with lowerprice/earnings ratios, such as Citi-
BY
LAWRENCE
C. STRAUSS
nuanced approach to value investing
“pretty consistently” over the years.
Nygren sold stocks like Amazon
and Adobe after “they had run up a
good bit and he thought that they
were fully valued,” says Thomas. He
sees that “as proof that the [investing]
process can really work.”
N
group, exploration-and-production
company APA, and Delta Air
Lines—all with P/Es below 10 times
forward estimates.
“We are deep in traditional value
territory because of the way the market has repriced these higher organic
growth businesses,” he says.
The Russell 1000 Value Index
trades at 15.8 times 12-month forward
earnings, a deep discount to its
growth counterpart at 27.9 times.
Nygren has compiled a strong record at the helm of the Oakmark Fund.
Its 15-year annual return of about 15%
bests 97% of its Morningstar peers. It
has also outperformed most of its competitors based on one-, three-, five-,
and 10-year results. The OAKMX
share class has an expense ratio of
0.91%, according to Morningstar.
Tony Thomas, an associate director of equity strategies at Morningstar, says that Nygren has applied his
ygren’s interest in finance
and numbers dates to the
1960s when, as a child growing up in Minnesota, he read
the box scores in the local newspaper’s
sports section. That sparked a lifelong
love of baseball for Nygren. At 65, he
still plays on his firm’s softball team.
Those box scores also led to his
interest in investing, thanks in part to
the newspaper’s stock tables.
Nygren earned a B.S. in finance at
the University of Minnesota in 1980,
followed by a master’s degree the next
year in the University of Wisconsin’s
applied security analysis program.
After working as a financial analyst
at an insurer, Nygren joined Chicagobased Harris Associates in 1983, serving as head of U.S. research there from
1990 to 1998 and joining the Oakmark
Select fund as a manager in 1996. He
began his role as a portfolio manager
on the Oakmark Fund in 2000.
When Barron’s caught up with
Nygren recently, he pointed out that
even though the stock market has
been setting new highs, it isn’t necessarily a cautionary signal.
Nygren says he asked a colleague to
Bargain Hunting
The Oakmark Fund’s Bill Nygren casts a wide net. Here are the fund’s top 10 holdings.
Company / Ticker
Alphabet / GOOGL
Recent Price
Market Value (bil)
$176.40
$2,189
62.45
119
Citigroup / C
1-Yr Return
Forward P/E
41.6%
22.7
46.0
10.2
Charles Schwab / SCHW
70.79
129
34.0
19.9
Wells Fargo / WFC
59.48
207
48.5
11.8
ConocoPhillips / COP
118.96
139
20.8
13.1
General Motors / GM
43.09
49
30.9
4.6
Deere / DE
369.27
103
4.8
15.9
Iqvia Holdings / IQV
226.71
41
13.7
20.1
Fiserv / FI
148.42
87
30.5
16.5
EOG Resources / EOG
125.85
72
19.0
10.3
Note: Holdings as of April 30; market data as of May 28.
Sources: Bloomberg, Oakmark Funds
track several hypothetical investing
scenarios. The upshot was that over the
past 50 years investors were much
better off holding on to their portfolios
when the market hit new highs, rather
than selling a big chunk and waiting
for a major selloff to buy the dip.
A new high for the market, he says,
is “not nearly as rare as people try to
make it sound; nor is it as dangerous
as they try to make it sound.”
In addition to Citigroup and APA,
the fund’s holdings include General
Motors. All of them, Nygren says, are
undergoing transformations and returning a lot of capital to shareholders.
Citigroup has been cutting costs
aggressively, among other moves. Last
year, the global bank returned about
$6 billion to shareholders via common
stock dividends and share buybacks—
a sensible option given how cheap the
stock is, says Nygren.
As for GM, it announced in the fall
that it plans to buy back $10 billion of
stock in addition to an existing authorization, a move Nygren expects will
help boost earnings growth.
APA, whose stock was recently
around $30, sells for roughly six times
forward earnings, says Nygren. “We
think its earnings-per-share growth
will be better than the market, largely
because of share repurchases,” he says.
Last year the company’s free cash
flow totaled $965 million, about a
third of which APA used to buy back
its common stock. Nygren thinks the
market is undervaluing the company’s
assets in Suriname and its recent acquisition of Callon Petroleum.
Although he has been helping to
run the Oakmark Fund for nearly a
quarter of a century and has worked
at Harris Associates for more than 40
years, Nygren isn’t close to retiring.
During the pandemic, Nygren says, he
missed the face-to-face interactions
with co-workers. The firm’s portfolio
management approach is more teamfocused than it used to be.
“I see my transition as gradually
giving up some of my internal responsibilities and moving more toward a
role that I would call external spokesperson and internal mentor,” he says.
For now, there are more value
stocks to find. B
June 3, 2024
17
I N C O M E I N V E ST I N G
TECH TRADER
Dividend Payouts Could
Power Tech Stock Prices
There’s Reason to Be
Bullish on U.S. Chips
BY AL ROOT
I
For personal non-commercial use only. Do not edit or alter. Reproductions not permitted.
To reprint or license content, please contact Barron's reprints department at 800-843-0008 or www.djreprints.com
BARRON’S
nvest in tech giants for their dividends. Seriously.
Shares of the tech giants have dominated stock returns over the past
year. That’s great, but big gains always
lead to investor anxiety about whether or
not they can continue. Sales and revenue
growth might already be baked into current valuations, but dividend growth
might not be. And higher payouts can
keep investors satisfied in years to come.
The trillion-dollar stocks Microsoft,
Apple, Amazon.com, Alphabet, Meta
Platforms, and Nvidia have accounted
for almost half of the $9 trillion-plus gain
of the S&P 500 over the past 12 months.
The six were up an average of 66% over
that span, with all but Apple outperforming the broader market.
Yet the group trades for a lofty 32 times
estimated 2024 earnings, a 45% premium
to the market’s 22 times multiple.
There’s a good reason for this, of
course. Wall Street projects about 25%
average earnings growth for the stocks in
the next few years, about twice the rate
of the overall S&P 500. Faster growth
supports bigger valuation multiples
now—and should also translate into
above-average dividend growth.
And dividend growth alone can be
enough to justify higher stock prices for
patient investors. Take Microsoft. In 10
years, if it grows and pays out cash flow
like a typical company, a shareholder
could be getting about $4 per quarter, up
from 75 cents today. That’s an 18% average
growth rate. A $16 annual dividend implies a stock price of about $1,100, assuming the current market dividend yield
stays constant. The current share price is
about $430.
A lot will change in the coming decade,
but it illustrates the power of higher payouts. Similar math works for four of the
six stocks. Amazon doesn’t pay a dividend,
but should. Nvidia pays only a token one.
The artificial-intelligence darling recently raised its dividend by 150%. That’s
impressive, but the hike was only so the
quarterly payout would be one cent after
a 10-for-1 stock split. Nvidia shares now
yield about 0.04%, the lowest of any dividend-paying stock in the S&P 500. For
now, Nvidia stock will continue to be
dominated by growth from AI computing
and not growth in its dividend payout.
That shouldn’t be the case for Amazon.
It’s about time for it to do what Meta and
Alphabet did this year and start paying a
sizable quarterly dividend. For the e-commerce and cloud giant, that kind of yield
would work out to a quarterly payout of
20 or 25 cents and consume about 14% of
its projected 2024 free cash flow. That’s a
safe payout rate. Dividend payers in the
S&P 500 spent about 43% of free cash
flow on dividends over the past year.
It’s also a potential catalyst for shares.
To be sure, dividend initiations don’t always work out that way, points out Wolfe
Research strategist Chris Senyek. “Results
are ultimately dependent on whether the
market deems the announcement to be a
positive change in capital allocation or a
signal of the end of secular growth,” he
wrote in a recent report.
Investors have put the Meta and Alphabet dividends in the “positive capital allocation” bucket. Meta shares were up about
21% since it declared its first dividend on
Feb. 1, beating the S&P 500 by about 14
percentage points. Alphabet stock was up
about 13% since declaring its first dividend
on Apr. 25, beating the S&P 500 by about
nine percentage points.
Dividends at Meta and Alphabet aren’t
coming at the expense of growth. Wall
Street still expects earnings growth of
roughly 20% a year on average over the
coming few years. That’s similar to or better than the growth realized by the pair
over the past few years.
High valuations are always a concern
for investors. Cash flow and dividend
payout growth can be the antidote. B
BY BILL ALPERT
L
ast week, China launched a $48
billion fund to build a worldbeating semiconductor industry,
and surrounded Taiwan in a
military war game.
“If you want to be scared in a geopolitical way,” says semiconductor investor
Paul “Chip” Schorr, “if China were to
take over Taiwan, you could still build a
toaster oven, because the chips you need
are available from other locations. But
advanced servers based on Nvidia chips?
Not so much.”
One of the longest active private-equity
specialists in technology, Schorr lined up
$120 million from the U.S. Commerce
Department in May to help expand Polar
Semiconductor’s factory in Minnesota,
which makes power management chips
for auto and aerospace customers.
The federal contribution is part of the
$53 billion that’s aimed at returning chip
production to American shores, under
the Biden Administration’s Chips and
Science Act.
“What the Chips Act is doing is leveling the playing field,” Schorr says. Chinese factories may be less burdened by
things like environmental rules and building codes. The Chips Act money helps
U.S. factories match China’s cost profile.
Schorr knows the semiconductor business. At Citi’s venture fund in 1997, he
arranged one of the chip industry’s first
management buyouts. It carved out three
units of National Semiconductor and put
them into Fairchild Semiconductor. After
tripling its profit, Fairchild came public in
1999. Schorr went on to run technology
investing at Blackstone and then the J.P.
Morgan-affiliated One Equity Partners.
When Schorr was starting in the 1990s,
America manufactured all the world’s
advanced semiconductors. Now, more
than 90% of leading-edge processor chips
are made in Taiwan by firms like Taiwan
Semiconductor Manufacturing. Nearly
all the memory and logic chips that accelerate artificial intelligence are fabricated
there, in Korea, or Japan.
Globalization cut costs, but it created
unanticipated dependencies. “With Covid,
people really suddenly found out where
their supply chains were,” Schorr says.
Chip shortages stalled U.S. auto makers. Car prices spiked nearly 30% in 2021
and jump-started today’s inflation.
The next year, Biden signed the Chips
Act, with bipartisan support. In February 2023, Commerce Secretary Gina
Raimondo began taking applications for
the Act’s $53 billion in investment and
other incentives.
“Failure is not an option here,” she
said at the launch.
The Chips Act awards began this year.
Micron Technology, Samsung Technology, and Taiwan Semi each will get
$6 billion to build U.S. chip factories.
Intel will get more than $8 billion.
Private capital is investing alongside
the government. The Polar foundry’s upgrade will be backed by midsize privateequity firms like Prysm Capital and
Schorr’s Niobrara Capital. Apollo Global
Management has backed other chip fabs.
America has a mixed record with industrial policy subsidies in synthetic fuels
and solar power. Schorr is optimistic that
the Chips Act is getting it right.
“If you want to feel better about our
government, go meet the Chips Act office,”
he says. “It is incredibly well staffed, from
Gina Raimondo on down.”
China can pour money into chip fabs,
but it lacks the drivers of semiconductor
success. The leading production process
engineers in the world are in the Western
ecosystem, says Schorr, and U.S. firms
like Nvidia and Advanced Micro Devices lead chip design.
“If you can get the same cost here as
you can get there, but you know that the
supply chain is safer here, then you’re
absolutely going to want to use a fab
here,” he says. B
18
BARRON’S
Q&A
June 3, 2024
An Interview With James Rossiter, Head of
Global Macro Strategy, TD Securities, London
Europe Is Open
For Business—
And Investors
For personal non-commercial use only. Do not edit or alter. Reproductions not permitted.
To reprint or license content, please contact Barron's reprints department at 800-843-0008 or www.djreprints.com
BY BRIAN SWINT
G
iven the U.S.
stock market’s
lofty gains in the
past 12 months,
it’s easy to forget
that major European bourses
have notched new highs, too. The
euro zone economy is improving,
inflation is cooling, and the European
Central Bank is widely expected to
cut interest rates by a quarter of a
percentage point this month, beating
the Federal Reserve to the punch.
There are plenty of reasons for
optimism, says James Rossiter, head
of global macro strategy at TD Securities in London. The economy not
only weathered an energy price
shock in 2021, but its growth drivers
also have been diversified in recent
years, and a soft landing could be
in store.
Rossiter has worked at the Bank of
Canada, the Bank of England, and the
ECB, and has held his current job
since 2019. He contributed the opening essay in TD Cowen’s annual European Best Ideas report, published in
March, highlighting four themes likely
to play out in Europe for the rest of
the year: Macroeconomics will remain
a key driver of markets, growth is
likely to rebound, integration has
made the region more resistant to
external shocks, and U.S. elections
are a bigger issue for Europe than the
electoral contests in its own backyard.
Rossiter elaborated on these themes
in a recent interview with Barron’s.
While he couldn’t discuss specific
stocks, we can share that TD’s top 26
include ASML Holding, Booking
Holdings, LVMH Moët Hennessey
Louis Vuitton, Novo Nordisk, and
Universal Music Group, all either
listed in Europe, headquartered there,
or heavily dependent on the region as
an end market.
An edited version of Rossiter’s
comments follows.
Barron’s: What are the big themes
in European markets this year?
James Rossiter: There are periods
when the macro backdrop and markets become disentangled, moving in
opposite directions. We saw massive
divergences when Covid hit markets
and everything went into meltdown,
and when the war in Ukraine broke
out. Markets were unsure of where
things were going.
There are also times when markets
move in tandem with macro trends.
In Europe, especially, markets are
generally doing what the macro
trends suggest they should. Economically, things are looking up for the
euro zone and the United Kingdom. If
anything, things have improved
faster than expected. European
growth is accelerating toward trend,
or the sustainable long-term pace of
growth, while the U.S. is decelerating
toward trend.
If markets continue to reflect the
macro fundamentals, things are go-
ing to improve quite a bit for Europe.
How is Europe doing compared
with Asia?
Europe, Asia, and the U.S. are
broadly growing at about their longterm trend, but they are coming from
different places.
The U.S. growth picture is strong,
even if growth is slowing. It’s good,
don’t get me wrong, but in the last
half of last year it was better. ArguPhotograph by CONOR O’LEARY
June 3, 2024
BARRON’S
19
“Economically, things are looking up for the euro zone and the United Kingdom.
If anything, things have improved faster than expected.”
For personal non-commercial use only. Do not edit or alter. Reproductions not permitted.
To reprint or license content, please contact Barron's reprints department at 800-843-0008 or www.djreprints.com
picking up, but like the U.S., it is
driven by the private sector rather
than government spending.
The European Union, by the way,
is being pragmatic in its approach to
China. Europeans are playing the
global trade game, but also looking to
open more doors into China. The U.S.
isn’t doing that, partly because a
presidential election is coming.
There is nothing that Germans
would love more than to accelerate
manufacturing exports to China. As
much as the headlines highlight trade
wars and antidumping policies in the
EU, Europeans would rather open
doors.
ably, China is also growing at trend,
at around 5% a year, but the composition of Chinese growth is less private
sector, more public sector. It is government money going into expanding
manufacturing, construction, and
infrastructure. Like China, Europe is
The U.S. economy outperformed
others last year, while Europe’s
performance was disappointing.
Why, and what does that mean for
the future?
We don’t know for sure what kinds of
policies should have been put in place
to offset the demand and supply
shocks of the pandemic. Those things
are difficult to ascertain in real time,
and even with hindsight, but you can
look at the U.S. and think fiscal stimulus was right. If your households
are full of cash, they’re going to
spend money.
Whereas the U.S. chose cash in
hand, in Europe the priority was job
security. We are now seeing the differences in labor-market participation. Compare the euro area, Canada,
the U.S., and the U.K.: The euro area
is the only place where participation
is higher than prepandemic.
If you layer on the shock of the
energy-price increase from mid-2021
into a good macro model, it tells you
the euro zone economy should have
shrunk by 3% to 5%. That implies an
immense recession. That the euro
zone economy grew in the first two
quarters after Russia’s invasion of
Ukraine—and managed to stay flat
after that—is a sign of policy success.
The important thing isn’t that the
euro zone underperformed the U.S.
It’s that it isn’t falling off a cliff.
What’s more, Germany’s DAX
index and France’s CAC 40, not
to mention the U.K.’s FTSE 100,
have all hit new highs this year.
Do you expect them to keep
climbing?
The European growth outlook is
optimistic, and markets are catching
up. Expectations for Europe’s growth
rates are roughly doubling, so it isn’t
a surprise to see that reflected in
markets.
TD Cowen included companies
such as AstraZeneca, Mondelez
International, McDonald’s, Universal Music, and LVMH in its
latest Best Ideas report. Which
sectors play to Europe’s strengths
now?
The composition is changing. The
health of the European economy is no
longer correlated to German manufacturing. Now, the services sector is
doing well. Southern Europe is outperforming, which is also unusual.
Discretionary spending can be
even better. Consumer-facing services are generally doing OK. Manufacturing is still struggling, and while
there are still reasons to worry, it
should start to rebound.
The report notes that despite the
heated political rhetoric in the
European Union, the U.S. election
is a bigger issue for Europe than
its own elections. Why is that?
Based on the polls, it looks like the
EU elections will result in maintenance of the status quo. The surge in
support for the far right looks impressive, but is unlikely to shift the
center of gravity in terms of policy. If
Ursula von der Leyen remains EU
Commission president, she might
have to engage with [the far right] a
bit more, but it isn’t really a big shift.
In the U.S., there are two political
phases—before the election, and after.
In the run-up, you’ll see attention on
China and foreign relations in general. Policies such as the U.S. taxing
Chinese electric vehicles could mean
that more Chinese EVs end up in Europe, so the U.S. taking a hard line
definitely has an impact on Europe.
Once the election is over, a win for
President Joe Biden would maintain
the status quo. The Biden administration is fairly hard-line on trade. If
former President Donald Trump
wins, there could be more uncertainty.
What is the outlook for the euro
and pound?
Better growth in Europe and the U.K.
would lift the euro and the pound,
other things being equal. But with
the Federal Reserve planning fewer
interest-rate cuts than initially expected, we expect both currencies to
be weaker by the end of the year.
We are looking for only two rate
cuts from the Fed this year. The ECB
could make as many as five quarterpercentage-point cuts. Once central
banks start cutting, they are probably
on a clear path to cut further. That
isn’t to say they can’t change, but it
will take an accumulation of evidence
to change quickly.
Why is Europe likely to cut interest rates before the U.S.?
Inflation is getting back into a fairly
comfortable range. In the U.S., it will
take longer for that to happen.
We don’t expect the ECB or the
Bank of England to go to a neutral
monetary-policy stance. Even after
they start cutting, there will still be
tightness in their policy stance. They
will be putting on the brakes, but it’s
a longer journey. You can have abovetarget inflation and also be cutting
rates from a point above the neutral
rate.
The U.S. economy seems to be running hot from a demand perspective.
Last year, in contrast, there was a lot
of disinflation coming from supply
factors, such as working through
energy issues. There is a bit more
certainty that a supply shock will go
away. In the case of a demand shock,
you have to hope it goes away, and
you aren’t sure that has happened
until afterward.
There is a decent chance that Europe nails a soft landing and the U.S.
doesn’t, which isn’t what people said
a few months ago. The house view is
that the U.S. gets a soft landing. But
there is a good chance that the U.S.
stays too hot.
Thanks, James.
B
20
THE EC ONOMY
'90
BARRON’S
2000
'10
'15
'20
June 3, 2024
Massive deficits were easy to fund
when interest rates were at historic
lows of 1% or less. But Gundlach
pointed out there are trillions of dollars
in maturing Treasury securities that
will be replaced with new ones with
yields in the 4% range, which means
that Uncle Sam’s interest expense will
exceed the military budget.
Not counting interest costs, the government’s so-called primary deficit has
run 5% higher as a percentage of gross
domestic product in the past five years,
according to an analysis by Goldman
Sachs economists Manuel Abecasis
and David Mericle. There are several
paths to a sustainable fiscal situation,
starting with the tough one of raising
taxes, cutting spending, or both.
Other expedients are to make the
economy grow at a faster rate, in current-dollar terms, than interest rates
on the debt. That can be accomplished
by faster real growth (from enhanced
productivity and immigration). Or it
could come from higher inflation or
“financial repression,” which would
artificially hold down interest costs
(at the expense of bond investors).
Evercore ISI Chairman Ed Hyman,
who was quoted at the end of the 1984
Barron’s editorial expressing confidence in the Fed’s anti-inflation
stance, thinks the deficit isn’t a problem yet. Bond yields of 4.5% appear
consistent with nominal GDP growing
about 5.5% year over year, he says.
When borrowing costs are higher
than they should be, or the dollar is
weak, that would be a worrisome sign.
Jim Paulsen, former chief investment strategist for Leuthold Group
and Wells Capital Management, also
doesn’t see bond yields starting on a
long-term ascent but settling into a
range, as was the case in the 1950s.
Moreover, 10-year Treasury notes also
offer value, yielding more than equityincome alternatives such as the MSCI
U.S. High Dividend Index, he adds.
For now, the Fed has held off on rate
cuts until inflation approaches its 2%
target. But buyers’ resistance was evident in poorly bid Treasury auctions
this past week. Over the longer term it’s
tough to dispute Gundlach’s view that
we’re at the reverse of the great bondbuying opportunity of 40 years ago. B
The Fed, says Jeffrey Gundlach, “will go back to
its old tricks...of money printing and inflationary
policies” when confronted by recession.
Jeffrey Gundlach, founder and CEO
of DoubleLine Capital, in a recent webcast with Rosenberg Research founder
David Rosenberg. “And I feel like we
almost have the exact reverse going
on,” Gundlach pointedly added.
Government has shown what it
is willing and able to do, he said. The
Federal Reserve, he feared, “will go
back to its old tricks” when confronted
with the next recession. But while inflation and bond yields will fall initially as
the economy slumps, he sadly expected
the policy response to be “money printing and inflationary policies.”
Former International Monetary
Fund chief economist Kenneth Rogoff
also sees central banks reverting to
what he calls their “new-old inflationary bias.” The Fed and its counterparts
will probably see their independence
compromised. “In a global environment
marked by political polarization, onerous government debt burdens, geopolitical tensions, and deglobalization,
central-bank autonomy cannot be absolute,” he wrote at Project Syndicate.
The greatest potential for pressure
on monetary policy could come from
massive government deficits and the
debt burden they exert, especially
in terms of rapidly growing interest
expense. This could result in what has
been dubbed fiscal dominance, where
monetary policy’s explicit aim of price
stability is subordinated to funding
the government’s borrowing needs.
'05
For personal non-commercial use only. Do not edit or alter. Reproductions not permitted.
To reprint or license content, please contact Barron's reprints department at 800-843-0008 or www.djreprints.com
BY RANDALL
W. FORSYTH
'85
30-Year Treasury Bond Yield
16%
14
12
10
8
6
4
2
0
1980
Source: Bloomberg
'95
Bond yields fell for more than four decades, thanks to disinflationary policies and the
effects of the financial and Covid crises. But soaring deficits could change all that.
Reversal of Fortune
have been penned the previous week
during the depths of the bond debacle.
(Many thanks to Barron’s alum Jim
Grant, editor of Grant’s Interest Rate
Observer, whose files preserved this
extraordinarily prescient call by our
much-missed colleague and friend.)
As the chart shows, long-term Treasury yields continued on a steady, stairstep decline for decades, all the way to
1% in the 2020 depths of the Covid-19
crisis. Those who followed Bob’s call
scored huge total returns as bond
prices soared in the next few years. The
benchmark 10-year Treasury returned
13.73% in calendar 1984, despite the
bear market early in the year, followed
by returns of 25.71% in 1985 and
24.28% in 1986, according to data from
the NYU Stern School of Business.
This was the turning point for the
generational decline in yields, observed
40 Years Ago, the Bond
Bull Market Began.
Is This the Reverse?
T
he year may be
recalled as the title
of George Orwell’s
dystopian novel,
Nineteen EightyFour. Or when
Ronald Reagan
was re-elected president in a landslide
on the theme of “Morning in America.” Or the counterpoint from “Born
in the U.S.A.,” Bruce Springsteen’s
song about returning Vietnam veterans in a deindustrializing economy.
Bond investors of a certain age will
recall that the Treasury 30-year bond
yield briefly touched 14% 40 years ago
this past week. While the all-time record of about 15% was hit in September
1981, the 14% yield was more valuable,
given that inflation by 1984 was in retreat from the double digits of the late
1970s and early ‘80s, to 4%. That
meant a real return of 10% from a riskfree government security, more than
stocks have returned historically.
Such opportunities typically result
from deeply depressed sentiment.
“Trouble in the Government Bond
Market” blared the cover of Business
Week magazine on the newsstands
that week. “Investors can do little but
brace for further depression of the
prices of their bonds,” it said.
“Buyers are refusing to support the
government,” said a leading economist
quoted by the New York Times on May
31, 1984, as the federal budget was facing a deficit upward of $200 billion.
Barron’s took a contrarian tack. “A
Case for Bonds? The Negatives Have
Been Overdone, the Positives Overlooked,” wrote Robert M. Bleiberg in
the issue dated June 4, which would
June 3, 2024
21
BARRON’S
MARKET WEEK
May 27 through May 31, 2024
International Trader
P. 24
Winners & Losers
P. 27
Striking Price
P. 25
Research Report
P. 28
Inside Scoop
P. 26
Statistics
P. 29
13D Filings
P. 26
MARKET PERFORMANCE DASHBOARD
Dow Jones Industrials
S&P 500
Nasdaq Composite
iShares Edge MSCI USA Momentum Factor ETF
52-wk: +14.58% YTD: +2.64% Wkly: -0.98%
52-wk: +23.24% YTD: +10.64% Wkly: -0.51%
52-wk: +26.39% YTD: +11.48% Wkly: -1.10%
52-wk: +34.84% YTD: +18.94% Wkly: -2.09%
38,686.32
5277.51
16,735.02
$186.60
2%
For personal non-commercial use only. Do not edit or alter. Reproductions not permitted.
To reprint or license content, please contact Barron's reprints department at 800-843-0008 or www.djreprints.com
Tech Pain
Stock indexes were dragged lower
by a slide in technology shares on
Thursday. Salesforce tumbled 20%
after a poorly received quarterly
earnings report.
Staging a Comeback
The S&P 500 and Nasdaq opened
in the green on Friday, drifted
lower, then rose again. Both
indexes snapped five-week
winning streaks.
1
0
-1
-2
Bad Breadth
Only 132 S&P 500 stocks rose on
Tuesday, but they included many
of the biggest names in the market.
Nvidia jumped 7%, lifting the Nasdaq
Composite to a record high.
Yield Signs
Hot consumer confidence data and
hawkish Fedspeak on Wednesday
pushed bond yields higher, which
weighed on the stock market. All
three major indexes fell.
-3
-4
-5
Tuesday
Wednesday
Thursday
Friday
Note: Markets were closed Monday for Memorial Day
THE TRADER
The Stock
Drop Could
Just Be
Getting
Started
Close
Source: Barron’s Statistics
I
nvestors have been too optimistic about the stock market—and they’re starting to
pay the price.
Heading into this past
week, signs of optimism were
everywhere. Bulls outnumbered bears in a recent American Association of Individual Investors poll
by more than 20 percentage points,
while Wall Street strategists at firms
such as UBS, BMO, and Morgan Stanley were busy raising their price targets. And why shouldn’t they? The
S&P 500 index has gained 26% since
bottoming in late October.
But markets can get too optimistic,
and that just might be the case now,
according to Renaissance Macro Research’s Jeff deGraaf. He notes that a
BY JACOB
SONENSHINE
recent Investors Intelligence survey
had put the number of bulls at 60%,
even though the S&P 500 had risen
about 5% over the previous 13 weeks, a
gain more consistent with a reading
below 50%. “Wouldn’t you know it,
returns tend to be below average (not
negative) when bulls are excessive to
historical returns,” he writes.
Of particular concern are portfolio
managers, who have just 4% of their
portfolios in cash, according to a Bank
of America survey. That’s the lowest
level in three months, and anything
below 4% is a sell signal, BofA says.
Anecdotally, fund managers are already starting to get more careful. Ken
Mahoney of Mahoney Asset Management, for one, says he’s holding on to
much of his remaining cash “because
we just had some great runs [in
stocks],” adding that he’s waiting for
lower stock prices before buying more.
That type of hesitation could leave
stocks with a dearth of buyers and put
them in a vulnerable spot. Weakness is
already creeping in—the S&P 500
dropped 0.5% this past week, while the
Dow Jones Industrial Average declined
1% and the Nasdaq Composite fell
1.1%—but most dips this year have
been mild, ending with higher lows
and leading to higher highs.
Still, early signs that the market will
crack are cropping up. For one, the
market isn’t reacting positively to good
or bad news. On Tuesday, the S&P 500
finished little changed even after consumer confidence rose more than expected, and it declined 0.6% on Thurs-
22
BARRON’S
day even after the Bureau of Economic
Analysis revised first-quarter U.S. gross-domestic-product growth down to 1.3% from
1.6%. That’s a sign that the market is looking
increasingly fragile.
Fragility could soon turn into a nasty
slide if Nvidia stock pauses its run-up. The
company is worth $2.72 trillion, just over 6%
of the S&P 500’s market value, and a drop
would pull the index downward. It would
also drag other chip stocks lower, putting
even more pressure on the index, especially
if nontech stocks don’t pick up the slack.
Substantial declines in Nvidia shares are
inevitable; it has had multiple double-digit
drops even as its stock has risen almost
200% over the past year.
“Nvidia is sucking up all the oxygen in
the room,” says Steve Sosnick, chief strategist at Interactive Brokers.
It might be time to suck it up and take
some money off the table.
For personal non-commercial use only. Do not edit or alter. Reproductions not permitted.
To reprint or license content, please contact Barron's reprints department at 800-843-0008 or www.djreprints.com
4 Industrial Stocks for Growth
Industrial stocks have soared—but their
run may only be getting started.
Yes, it’s been a good year for the group.
The Industrial Select Sector SPDR exchange-traded fund—home to Caterpillar
and General Electric; Union Pacific,
FedEx, and United Parcel Service; airlines; and even Uber Technologies—has
gained about 8% this year after dropping a
bit this past week.
The sector has benefited from the Federal
Reserve’s move to stop lifting interest rates,
which is good news for makers of heavy
equipment, while transport companies also
see strong demand.
Trivariate Research, which upgraded the
sector to Market Weight from Underweight,
now sees industrials as essentially growth
stocks. Revenue growth will come from
clean energy demand, which is displacing
traditional energy and requires more manufacturing equipment and capacity. Among
other tailwinds, industrial automation
means increased spending on more efficient
manufacturing products and supplies.
Together, that should help sales grow at a
rate a few percentage points above gross
domestic product, while profit margins can
inch higher as the cost of goods and labor
increases at a pace slower than revenue
growth. Analysts expect earnings for the
Industrial Select ETF to grow at about 16%
annually for the two years after this year.
The stocks aren’t cheap, trading at 21
times 12-month forward earnings, a hair
above the S&P 500’s 20.7 times. Their profit
growth—a few percentage points better than
the S&P 500’s—is why they can maintain
their high valuations for a lengthy period.
Trivariate screened industrial stocks for
those with stronger growth potential. Ones
that made the list include Eaton, Deere, and
Waste Management, all of which are expected to grow earnings in the low double
digits annually for the next three years.
Parker-Hannifin, the $68 billion maker
of motion and control systems, also passed
the screen. That makes sense. It is expected
to grow sales at about 5% annually for the
next three years, to $23.5 billion by 2027,
according to FactSet. The company could
see some combination of higher prices and
greater volumes, and since it generates
more than $2 billion in free cash flow each
year, it can add to its profits by making
small acquisitions, something it’s done
most years.
That should help earnings grow at a 10%
annual clip through 2027, when they should
reach $34 a share, according FactSet. Mizuho Securities analyst Brett Linzey, who
upgraded the stock to Buy from Neutral,
sees a share price of over $35 within the next
five years on the back of more deals.
The stock trades at 21 times earnings, a
discount to comparable companies such as
Illinois Tool Works and RTX. Linzey argues that the market is undervaluing
Parker-Hannifin’s aerospace business, and
(continued of page 23)
Vital Signs
Friday’s
Close
Week’s
Change
Week’s
% Chg.
Friday’s
Close
Week’s
Change
Week’s
% Chg.
-0.68
DJ Industrials
38686.32
-383.27
-0.98
Barron’s Future Focus
1074.64
-7.32
DJ Transportation
15238.30
+155.36
+1.03
Barron’s Next 50
3175.18
+5.14
+0.16
946.42
+20.31
+2.19
Barron’s 400
1147.83
-4.97
-0.43
DJ 65 Stocks
12412.96
-13.37
-0.11
DJ US Market
1284.23
-8.06
-0.62
NYSE Advances
NYSE Comp.
DJ Utilities
Last Week
1,529
Week Earlier
888
1,339
2,008
18083.69
-26.90
-0.15
Declines
NYSE Amer Comp.
4975.53
+77.39
+1.58
Unchanged
63
32
S&P 500
5277.51
-27.21
-0.51
New Highs
227
410
S&P MidCap
2982.86
+6.19
+0.21
New Lows
118
102
S&P SmallCap
1329.65
+9.06
+0.69
Av Daily Vol (mil)
4,140.1
3,560.9
Nasdaq
16735.02
-185.78
-1.10
Dollar (Finex spot index)
104.63
104.72
Value Line (arith.)
10348.53
+26.75
+0.26
T-Bond (CBT nearby futures)
116-02
116-26
2070.13
+0.46
+0.02
Crude Oil (NYM light sweet crude)
52354.32
-304.29
-0.58
Inflation KR-CRB (Futures Price Index)
Russell 2000
DJ US TSM Float
Gold (CMX nearby futures)
76.99
77.72
290.16
294.28
2322.90
2332.50
June 3, 2024
Where to Find 7% Yields on
Preferred Stock
BY ANDREW BARY
Incoming
T
Preferred Issue /
Cusip or Series
here’s an awful lot to like right
now about some preferred
stocks.
The market for preferreds
now offers 7% yields on a variety of
recent bank deals, a nice premium
above the 4.65% rate on the Treasury
30-year bond. Investors also get a tax
benefit. Generally, preferred dividends
are taxed like those on common
shares rather than at ordinary income-tax rates.
Citigroup issued $1.75 billion of
7.125% preferred in May and regional
banks M&T Bank and Citizens Financial Group sold preferreds with
7.5% and 7.375% yields, respectively.
Both the $750 million M&T Series J
issue and $400 million Citizens Series
H issue trade around their face value
of $25 a share on the New York Stock
Exchange.
The Citigroup issue, like other large
preferred deals this year from JPMorgan Chase and Goldman Sachs
Group, was sold with a face value of
$1,000 in what’s known as the institutional market. These deals trade in an
over-the-counter market similar to
corporate debt.
The $1,000-par preferreds, including the Citi, JPMorgan, and Goldman
issues, are available to retail investors.
They’re traded based on a Cusip number, rather than a ticker symbol. Major
securities firms with preferred stock
trading desks can be the best source
for these deals. This market is worth a
look from income investors, since the
bulk of big new deals are sold there
and deal terms are often more appealing than in the $25 market.
The Citi issue, known as fixed to
floating, gets a rate reset in five years
based on the five-year Treasury yield
(now 4.5%) plus 2.69%. The dividend
on M&T and Citizens preferred
doesn’t change.
The recent spate of preferred issuance has been driven partly by the
banks redeeming about $17 billion of
high-cost preferred so far this year,
according to UBS analyst Frank Sileo.
Citigroup has paid off more than $2
billion of preferred shares.
Preferred shares offer decent payouts
for relatively low risk.
Recent
Price
Yield
Citigroup 7.125% /
172967PK1
99.96
7.15%
M&T Bank 7.50% / Series J
25.13
7.48
Citizens Financial
Group 7.375% / Series H
25.00
7.375
IShares Preferred and
Income Securities / PFF
$31.19
6.5%
First Trust Institutional
Preferred Securities and
Income / FPEI
18.24
5.8
ETF / Ticker
Sources: Bloomberg, company reports
Banks dominate the $300 billion
preferred market. That concentration
involves some risk. Investors were
burned on preferred deals from parents of Silicon Valley Bank and First
Republic after they failed last year.
But the preferred from the country’s mega- and regional banks looks
safe, given that these large institutions
are well capitalized and amply profitable. Preferred is a senior form of equity, riskier than corporate debt but
senior to common stock. Companies
generally can’t pay common stock dividends if they aren’t paying preferred.
One drawback of preferred stock is
that companies can redeem, or call,
issues at face value, normally five
years after issuance. This limits upside potential. But the 7%-plus preferred yields offer some compensation
for this call risk.
There are numerous exchangetraded funds focused on the preferred
market. The largest is the $14 billion
iShares Preferred & Income Securities ETF, now trading around $31
and yielding 6.5%. The First Trust
Institutional Preferred Securities
& Income ETF focuses on the $1,000
market and yields 5.8%.
There have also been subordinated
debt deals from utilities priced recently
like institutional preferred with $1,000
face values. AES sold $950 million of
7.6% bonds due in 2055, Entergy $1.2
billion of 7.125% bonds due in 2054,
and Dominion Energy offered $2
billion of long-term bonds. B
BARRON’S
Performance of the Dow Jones U.S. Industrials, ranked by weekly percent change.*
1.57%
Telecommunications
–0.07
–0.34
–0.49
–0.86
Utilities
Oil & Gas
Consumer Services
Basic Materials
–1.10
Consumer Goods
–1.10
Financials
–1.65
–1.95
–2.06
Technology
Health Care
Industrials
Source: S&P Dow Jones Indices
(continued from page 22)
that the multiple could rise as that segment
continues to grow.
That’s a great way to manufacture gains.
For personal non-commercial use only. Do not edit or alter. Reproductions not permitted.
To reprint or license content, please contact Barron's reprints department at 800-843-0008 or www.djreprints.com
The Case for Airbnb Stock
Travel stocks hit some turbulence this past
week. Airbnb might be a place to seek
shelter from the storm.
The summer travel season is just getting
started, but American Airlines Group
already delivered the first piece of bad news
this past week when it lowered earnings
guidance. The announcement on Wednesday caused shares of other airlines to
slide—the U.S. Global Jets exchange-traded
fund dropped more than 2%—while online
travel agent Booking Holdings was down
1.3% and cruise line Carnival dropped
2.7%. Airbnb was almost unscathed, falling
0.2% Wednesday.
Things aren’t perfect for Airbnb. Shares
are down 8%, to $144.93, since May 8,
when the company reported first-quarter
earnings. The results themselves weren’t
terrible. The problem, in part, was that the
stock had already risen double digits for the
year coming into earnings, reflecting heavy
optimism as the company guided for a second-quarter deceleration of sales growth to
9%, or $2.71 billion, at the midpoint of the
range. The fact that Airbnb shares barely
moved could be a sign that its recent troubles have passed.
Wedbush Securities analyst Scott Devitt
thinks so. On Tuesday, he upgraded the
stock to Outperform from Neutral, noting
that management expects sales growth to
reaccelerate during the third quarter. He
also sees a strong consumer spending backlog that should materialize over the summer. Supporting that, Devitt has seen
higher year-over-year growth in traffic to
the company’s website in May versus April.
That’s partly why he thinks U.S. book-
ings—the total amount of domestic spending before Airbnb’s cut of transactions—
can grow in the low double digits for the
coming few months.
“[There’s] potential upside to near-term
estimates,” Devitt writes, noting that the
stock is still down since its earnings report.
“Investors should take advantage.”
It’s more than one quarter, though.
Spending on “alternative accommodations,”
the industry term for Airbnb’s short-term
rentals, should grow double digits annually
for roughly the next decade, according to
Future Market Insights, eventually topping
$600 billion. The highest growth should
come from Asia, where Airbnb already sees
a sliver of its total revenue.
Analysts expect the company to post
gross bookings of almost $140 billion by
2029, according to FactSet, up from last
year’s $73 billion. Airbnb’s take rate, or
transaction cut, should increase a hair, especially as the company charges for additional
actions, such as when users book spaces in
foreign currencies. The company might also
add sponsored listings, which the property
owner listing the space could pay extra for.
All this is leading analysts to project that
the company will grow sales in the low double digits annually for the next five years to
almost $20 billion by 2029. Meanwhile, the
growth could come as marketing spending
may rise slower than revenue growth, allowing earnings to grow more than 20% annually to $11.25 per share by 2029.
That leaves plenty of upside for the
shares, which trade at 31 times expected
earnings for the coming 12 months. If they
maintain that multiple, they would gain 24%
annually to $347 by 2028. Even assuming a
slower outlook for growth by 2028, and the
lowest multiple seen in the last two years of
about 24 times, the stock would still rise
more than 15% percent annually.
It sounds like a journey worth taking. B
WHAT’S MOVING THE MARKET?
FIND OUT
WITH OUR
SECTOR
TRACKER
1 Day
5 Day
1 Month
3 Month
6 Month
YTD
1 Year
5 Year
S&P 500 INDEX
XLC
COMMUNICATION SERVICES
XLY
CONSUMER DISCRETIONARY
XLP
CONSUMER STAPLES
XLE
ENERGY
XLF
FINANCIAL
XLV
HEALTH CARE
XLI
INDUSTRIALS
XLB
MATERIALS
XLRE
REAL ESTATE
XLK
TECHNOLOGY
XLU
UTILITIES
Visit www.sectorspdrs.com or call 1-866-SECTOR-ETF
An investor should consider investment objectives, risks, charges and expenses carefully before
investing. To obtain a prospectus, which contains this and other information, call 1-866-SECTOR-ETF or visit
www.sectorspdrs.com. Read the prospectus carefully before investing.
All ETFs are subject to risk, including possible loss of principal. Sector ETF products are also subject to sector risks and non-diversification
risks, which generally results in greater price fluctuations than the overall stock market. Ordinary brokerage commissions apply.
TheS&P500isanindexof500commonstocksthatisgenerallyconsideredrepresentativeoftheU.S.stockmarket.Youcannotinvestdirectly
in an index.
ALPS Portfolio Solutions Distributor, Inc., a registered broker-dealer, is distributor for the Select Sector SPDR Trust.
Father’s Day
Gift Guide
Unsure of what to buy Dad this year?
Let the Mansion Global Boutique help you pick
just the right present that’ll knock his socks off.
mansionglobal.com/boutique
SCAN TO SHOP
All rights reserved. 2E6200
Industry Action
23
© 2024 Dow Jones & Company, Inc.
June 3, 2024
24
BARRON’S
June 3, 2024
INTERNATIONAL TRADER
Not All Europe’s Telecoms
Are Past Their Glory Days
BY CRAIG MELLOW
Invest with the
1
For personal non-commercial use only. Do not edit or alter. Reproductions not permitted.
To reprint or license content, please contact Barron's reprints department at 800-843-0008 or www.djreprints.com
Best Online Bonds Broker
Interactive Brokers’ Bond Marketplace offers over
one million global bonds, with no mark-ups or
spreads and low, transparent commissions.
Try our free Bond Search tool to compare available
yields against those of other brokers.
The best-informed investors choose Interactive Brokers
ibkr.com/bestbonds
Rated Best
Online Broker 2023
for Bonds
by Benzinga1
Interactive Brokers
Rated #1 ... Again
Best Online Broker
2023 by Barron’s2
Member - NYSE, FINRA, SIPC – Supporting documentation for any claims and statistical information will be
provided upon request. [1] Rated best online broker for bond brokers according to Benzinga - Best Online
Brokers for Bonds, February 22, 2023. [2] Interactive Brokers rated #1, Best Online Broker according to
Barron’s Best Online Brokers Survey of 2023: June 9, 2023. For more information see, ibkr.com/info Barron’s is a registered trademark of Dow Jones & Co. Inc.
09-IB23-1651
E
uropean telecommunications
providers are merging and acquiring like it’s 1999. That won’t
return their downtrodden stocks
to the glory days. But it may churn up
value in particular companies.
Within the past few months, Swisscom
agreed to buy Vodafone’s Italian business
for eight billion euros ($8.7 billion), French
champion Orange merged its Spanish
operations with local operator Masmovil at
a 19 billion euro valuation, and Telecom
Italia sold its fixed-line assets to privateequity giant KKR for €22 billion.
The companies are trying to consolidate their way out of ruinous competition.
Growth in their core cellular and broadband services has slowed to a crawl,
while too many players—from an industry point of view—keep prices down.
“Overcapacity makes connectivity a
commodity, and customers don’t care
anymore,” Deloitte consultants concluded
in a recent report.
Debt from building 5G networks has
risen with interest rates. Remaining state
stakes in former monopolies constrain
cost-cutting, as governments want to
maintain employment.
Stocks reflect these concurrent calamities. “Returns on most of these companies
have been negative over the past 10 years,”
says Javier Correonero, an equity analyst
covering the sector at Morningstar.
The holy grail for telecom dealmakers is
a “four to three” transaction. Having three
rivals in a given national market offers a fair
shot at profitability; quartets not so much.
Regulators tend to like competition,
however. Even where they have permitted
mergers, they take steps to bring in new
market entrants. Spanish authorities
cleared the Orange-Masmovil tie-up on
condition that Masmovil yield spectrum
to Digi Communications, an aggressive
outsider based in Romania.
Not all European telecoms are equally
afflicted, though, Correonero says. A few
smaller markets do offer less ruinous
three-way competition. These include the
Netherlands, where he likes market leader
KPN, and Sweden, where he favors Tele2.
He’s also bullish on Deutsche Telekom,
which retains exceptional brand loyalty
in its native Germany, while its T-Mobile
US unit gains market share in the U.S.
Fabio Caldato, an equities portfolio
manager at AcomeA, sees broader positive
trends in European telecoms. Capital expenditure should ease as the 5G buildout
nears completion, and an expected fall in
rates lightens debt burdens. Enough pricing power is returning to at least keep up
with inflation.
“I think telcos will be a sector trade for
the next year,” he concludes.
One of Caldato’s top picks is former
United Kingdom monopoly BT Group,
which has told investors it can cut capex
by 35%, doubling free cash flow. He also
flags Telecom Italia as a deep value play
once it unloads debt through the KKR
divestiture. The shares have lost half their
value over the past five years.
Wheeler-dealer in chief on the European telecoms scene is Margherita Della
Valle, an Italian who took over as chief
executive of U.K.-based Vodafone last year.
She is looking to exit both Spain and Italy,
while pushing a four-to-three merger in
the home market with CK Hutchison
Holdings (brand name Three).
London’s Competition and Markets
Authority may have other ideas. The combination “could lead to mobile customers
facing higher prices and reduced quality,”
it sniffed in a preliminary report. Caldato
gives Della Valle an “A” for effort nonetheless. “Vodafone is finally focusing on efficiency, not an acquisition binge,” he says.
Investors haven’t quite gotten the
memo; Vodafone shares have slumped
another 20% since Della Valle took the
reins last April.
A lesson for today’s market stars:
No one stays hot forever. B
June 3, 2024
BARRON’S
25
T H E ST R IKING PRIC E
Utilities Are Hot. Jump In
Without Getting Burned.
If you are willing to own utilities, which are worthy
income-generating stocks, you can sell puts and
buy calls, the so-called risk-reversal strategy.
Equity Options
CBOE Volatility Index
VIX Close
The Equity-Only Put-Call Ratio
VIX Futures
Put-Call Ratio
S&P 500 Index
23
194
174
20
BY STEVEN M. SEARS
For personal non-commercial use only. Do not edit or alter. Reproductions not permitted.
To reprint or license content, please contact Barron's reprints department at 800-843-0008 or www.djreprints.com
T
his is a story about something
that isn’t supposed to happen in
the stock market.
The utility sector, renowned
for its stodgy performance, high dividend
yields, and intense regulation, is outperforming the S&P 500, which houses the
world’s most admired companies. Nvidia,
Meta Platforms, Amazon.com, Apple,
and other top technology companies dominate the benchmark index.
The Utilities Select Sector SPDR
exchange-traded fund (ticker: XLU) is up
almost 14% this year, compared with
about 10.6% for the S&P 500. Some XLU
components are operating at an even
more feverish pace. NextEra Energy,
which is based in Florida, is up almost
28% this year.
The relationship between the two proxies over the past year is more typical,
though: The utility ETF is up 15%, compared with a 23% gain for the stock index.
But the future, not the past, is how we
invest. The price divergence in the utility
sector should prompt investors to reconsider their traditional view of utility
stocks.
Some investors were early to recognize
the role that utility stocks play in the nascent artificial-intelligence phenomenon.
Others would do well to consider an options strategy that monetizes some of the
fear and greed of the latecomers.
Computers that operate with AI semiconductor chips use a lot of electrical power,
creating intense demand for data centers.
Conversations with data-center executives
suggest that only a few states currently have
enough utility system capacity to address
AI-power demands. That makes picking
specific utilities a challenge.
For that reason—and because the Utility
2.0 phenomenon is so fresh and so hot—
investors interested in the theme might
well be better served renting utility exposure via options than buying hot stocks
that could revert to their usual behavior.
The traditional stock rental strategy is
buying bullish call options. Should the
stock price increase, the call follows. The
allure is that calls cost a lot less than
stocks.
When investors are willing to own the
underlying stock—and utilities are worthy income stocks—there’s another approach: selling put options and buying
calls. This so-called risk reversal—selling
a put and buying a call with a higher
strike price but similar expiration—monetizes the fear of a pullback and uses that
to defray or entirely pay for the hope of
an advance.
134
17
114
94
14
74
11
J
A
S
O
N
D
J
F
M
A
Daily Values
54
M
J
A
S
O
N
D
J
Source: CBOE
F
M
A
M
Source: McMillan Analysis Corp.
SPX Skew
NDX Skew
Implied volatility %
Implied volatility %
W
ith the Utilities ETF at
$72.72, sell the January $67
put and buy the January $74
call for about $1.70. The Jan.
25 expiration positions investors to buy
XLU at $67 and to participate in gains
above $75.70 (strike price plus the cost of
position).
If the trade works, the call is worth $6
should the ETF trade to a new high of
$80 by January’s expiration. During the
past 52 weeks, it has ranged from $54.77
to $72.91.
If the ETF is below the put strike at
expiration, investors must buy the shares
or adjust the put to avoid assignment.
The XLU trade expresses a belief that
utility management teams will use coming earnings reports to highlight and
hype how their companies are linchpins
in the AI revolution.
Since prices and liquidity aren’t great for
XLU’s distant expirations, investors should
use limit orders to pick their buy and sell
prices to avoid being steamrolled by dealers
who will otherwise execute orders at the
obscenely wide bid and ask spread.
Investors need time to fine-tune their
utility sector view. By January, the studs
and duds will likely have been identified.
The trade outlined above is a good wager
until that time. B
154
13%
11%
12
10
11
9
10
8
9
7
8
6
7
5
6
J
A
S
O
N
D
J
F
M
A
4
M
J
Source: Credit Suisse Equity Derivatives Strategy
A
S
O
N
D
J
F
M
A
M
Source: Credit Suisse Equity Derivatives Strategy
Skew indicates whether the options market expects a stock-market advance or decline. It measures the difference between the implied
volatility of puts and calls that are 10% out of the money and expire in three months. Higher readings are bearish.
Week’s Most Active
Company
Symbol
Tot Vol
Calls
Puts
Avg Tot Vol
IV %ile
Ratio
Merus
MRUS
26764
9720
17044
300
0
89.2
Calliditus Therapeutics
CALT
2942
289
2653
68
2
43.3
Verastem
VSTM
5677
4527
1150
160
89
35.5
Dyadic Int’l
DYAI
2165
2141
24
148
90
14.6
Salesforce.com
CRM
1103035
507418
595617
83268
53
13.2
Maxeon Solar Technologies
MAXN
194468
38658
155810
17572
98
11.1
nCino
NCNO
9647
7486
2161
952
6
10.1
Phreesia
PHR
6632
1977
4655
684
41
9.7
Credo Technology
CRDO
30588
26918
3670
3256
26
9.4
Birkenstock
BIRK
15258
7138
8120
1684
1
9.1
Six Flags
SIX
13083
6205
6878
1500
3
8.7
8.5
Box
BOX
24116
15064
9052
2852
8
Abercrombie & Fitch
ANF
180427
88029
92398
22936
13
7.9
nCino
CURV
4149
4145
4
528
2
7.9
Hewlett-Packard
HPQ
303015
209193
93822
46172
52
6.6
Summit Therapeutics
SMMT
36909
23373
13536
5764
96
6.4
Centene
CNC
53802
12550
41252
8632
15
6.2
UiPath
PATH
401295
214066
187229
64312
19
6.2
Workday
WDAY
187540
86528
101012
30936
13
6.1
Okta
OKTA
147205
83193
64012
24612
3
6
This table of the most active options this week, as compared to average weekly activity – not just raw volume. The idea is that the unusually heavy trading in these options might be a predictor of
corporate activity – takeovers, earnings surprises, earnings pre-announcements, biotech FDA hearings or drug trial result announcements, and so forth. Dividend arbitrage has been eliminated. In
short, this list attempts to identify where heavy speculation is taking place. These options are likely to be expensive in comparison to their usual pricing levels. Furthermore, many of these
situations may be rumor-driven. Most rumors do not prove to be true, so one should be aware of these increased risks if trading in these names
26
BARRON’S
June 3, 2024
IN SIDE SC OOP
Hims & Hers Director Buys
Stock After Recent Surge
BY ED LIN
For personal non-commercial use only. Do not edit or alter. Reproductions not permitted.
To reprint or license content, please contact Barron's reprints department at 800-843-0008 or www.djreprints.com
H
ims & Hers Health
stock has soared this
year, and one director
just bought a large block
of shares of the health
and wellness platform.
Hims & Hers shares
have gained nearly 90% in 2024. A
strong outlook lifted the stock in late
February, and on May 20, shares got
another boost when Hims & Hers said
it would offer GLP-1 weight-loss injections cheaper than Eli Lilly’s Zepbound and Novo Nordisk’s Ozempic.
Director Christopher Payne, a former CEO of Tinder and President of
DoorDash, paid $2 million on May 21,
the day after the weight-loss announcement, for 110,000 Hims & Hers shares,
an average price of $17.74 each. Payne
Switzerland’s Central
Bank Sold Apple Stock
T
he central bank of Switzerland
recently made some major adjustments in its portfolio of
U.S.-listed equities.
The Swiss National Bank reduced
its investment in Apple stock,
slashed positions in Lucid Group
and Shopify, and bought more
shares of Virgin Galactic Holdings
in the first quarter. The bank disclosed the trades, among others, in
a form that it filled with the Securities and Exchange Commission.
The bank declined to comment on
its investment changes. Swiss National
Bank’s assets stood at $869 billion at
the end of 2023, down $95 billion from
a year earlier, “mainly due to foreign
currency sales,” according to its latest
annual report.
bought the stock through a family
trust, according to a filing with the
Securities and Exchange Commission.
Hims & Hers didn’t respond to a
request to make Payne available for
comment. It’s the first open-market
purchase of Hims & Hers stock for
Payne, who joined the board in
March. Shares purchased represent
his entire holdings in the company.
Hims & Hers weight-loss offering
“is priced well below average, in addition to including unlimited medical
consultations,” wrote Guggenheim
Securities analyst Jack Wallace in a
May 20 report. “Additionally, we believe Hims & Hers’ trusted brand and
scaled affiliated pharmacies position
the company to be a leader in the compounded weight-loss category.” Wallace rates Hims & Hers stock at Buy
with a $20 price target. B
Swiss National Bank sold 4.9 million Apple shares in the first quarter
to cut its investment to 44 million
shares.
The bank sold one million Lucid
shares to end the first quarter with 1.8
million shares of the maker of electric
vehicles.
Swiss National Bank sold 270,500
Shopify shares to end the first quarter
with 3.6 million.
The bank bought 62,400 more
shares of Virgin Galactic in the first
quarter to lift its investment in the
space-tourism firm to 749,800 shares.
KeyBanc Capital Markets noted
in May that Virgin Galactic burned
through less cash than expected in the
first quarter. Virgin Galactic also indicated as it reported first-quarter results that the company is likely to use
up less cash in the second quarter,
although the revenue outlook was
disappointing. B
Hims & Hers
Health stock
rallied after the
company said
it would offer
weight-loss
doses. A director
later bought $2
million worth
of stock.
Activist Holdings Decreases in
Holdings
Gildan Activewear
Browning West increased its stake
in the apparel maker to 9,617,135
shares. Browning West purchased
976,687 Gildan Activewear shares
from May 10 through May 17 at
prices ranging from $33.48 to
$35.64 each. In December 2023,
Browning West had called for the
reinstatement of former Gildan
CEO and co-founder Glenn Chamandy, along with a reconstituted
Gildan board. In May, Browning
West announced Chamandy’s reinstatement, and that Gildan’s
entire board was replaced with
Browning West’s slate. Browning
West now owns 5.7% of Gildan’s
outstanding stock. Shares have
gained 15% year to date.
Increases in
Holdings
Fortrea Holdings
Starboard Value increased its
stake in the contract clinicalresearch company to 7,595,000
shares. Starboard did so through
the purchase of 2,293,000 Fortrea
Holdings shares from May 6
through May 28 at prices ranging
from $25.30 to $36.27 each. Following the latest purchases, Starboard
now owns 8.5% of Fortrea’s outstanding stock. Shares have lost
roughly 26.9% year to date.
Citi Trends
Fund 1 Investments increased
its stake in the apparel retailer
to 2,119,019 shares. Fund 1 did so
through the purchase of 132,952
Citi Trends shares from May 6
through May 23 at prices ranging
from $22.07 to $24.21 apiece. Following the latest purchases, Fund
1 now owns 24.8% of Citi Trends’
outstanding stock. Shares have
lost roughly 16.8% year to date.
Diebold Nixdorf
Millstreet Capital Management
reduced its stake in the provider
of software and hardware services
to 6,027,361 shares. Millstreet
Capital did so through the sale
of 450,000 Diebold Nixdorf shares
in an open-market transaction on
May 23 for $42.50 per share. Following the sale, Millstreet Capital
continues to own 16% of Diebold
Nixdorf’s outstanding stock. Shares
have gained roughly 53.4% during
the year.
Telesat
Gamco Investors lowered its
stake in the global satellite operator to 3,218,063 shares. Gamco did
so through the net sale of 150,126
Telesat shares from March 26
through May 22 at prices ranging
from $7 to $9.25 each. Following
the sales, Gamco continues to own
23.6% of Telesat’s outstanding
stock. Shares have lost 4.5%
during the year.
Overseas Shipholding
Group
Cyrus Capital Partners slashed
its stake in the tanker company
to 160,696 shares. Cyrus sold
4,103,391 Overseas Shipholding
Group shares on May 22 for $8.43
apiece. Cyrus now owns a 0.2%
stake, which is below the 5%
threshold that would require
Cyrus to report further Overseas
Shipholding Group stock sales.
Shares have gained 64.5% year
to date.
These disclosures are from 13Ds filed with
the Securities and Exchange Commission.
13Ds are filed within 10 days of an entity’s
attaining more than 5% in any class of a
company’s securities. Subsequent changes
in holdings or intentions must be reported in
amended filings. This material is from May 23
through May 29, 2024. Source: VerityData
(verityplatform.com)
June 3, 2024
BARRON’S
27
W I N N E R S & LO S E R S
NYSE Biggest % Movers
NYSE Most Active
NYSE American Most Active
Winners
Volume Percentage Leaders
Volume Percentage Leaders
Name (Sym)
Gap(GPS)
US Cellular(USM)
Chewy(CHWY)
FootLocker(FL)
C3.ai(AI)
OrionGroup(ORN)
GameStop(GME)
SunnovaEnergy(NOVA)
Volume
Close
Change
%Chg.
98867
3721
106085
35286
74900
2457
178479
22787
28.96
55.46
21.21
27.73
29.57
10.78
23.14
5.22
+7.98
+12.48
+4.64
+5.66
+5.53
+2.00
+4.14
+0.91
+38.0
+29.0
+28.0
+25.6
+23.0
+22.8
+21.8
+21.1
Volume
Close
Change
%Chg.
162185
1960
31
48341
510
3588
61230
5186
12.26
10.32
7.17
16.83
4.54
18.92
22.39
145.32
–6.72
–3.51
–2.23
–4.79
–1.26
–3.71
–4.10
–25.36
–35.4
–25.4
–23.7
–22.2
–21.7
–16.4
–15.5
–14.9
Losers
Name (Sym)
UiPath(PATH)
NoahHoldings(NOAH)
SunlandsTech(STG)
SentinelOne(S)
GCT Semiconductor(GCTS)
Phreesia(PHR)
Kohl's(KSS)
PaycomSoftware(PAYC)
Name (Sym)
EverestConsolA(MNTN)
BW LPG(BWLP)
Offerpad(OPAD)
PerceptionCapIV(RCFA)
Salesforce(CRM)
TejonRanch(TRC)
UiPath(PATH)
CRH(CRH)
EnphysAcqnA(NFYS)
FlutterEnt(FLUT)
CNA Fin(CNA)
DellTechC(DELL)
AresAcqnII A(AACT)
CAVA(CAVA)
RobertHalf(RHI)
Birkenstock(BIRK)
NationalGrid(NGG)
PyrophyteAcqn(PHYT)
LifezoneMetals(LZM)
US Cellular(USM)
NYSE American Biggest % Movers
By Share Volume
Winners
Name (Sym)
Name (Sym)
For personal non-commercial use only. Do not edit or alter. Reproductions not permitted.
To reprint or license content, please contact Barron's reprints department at 800-843-0008 or www.djreprints.com
Saturday Inbox: Sign up for the
Market Lab Newsletter every Saturday
at Barrons.com/newsletters
LogisticProp(LPA)
AultDisruptive(ADRT)
MaiaBiotech(MAIA)
BiteAcqn(BITE)
ContangoOre(CTGO)
Southland(SLND)
BM Tech(BMTX)
RileyExpln(REPX)
Volume
528
315
1895
74
493
328
569
979
Close
Change
%Chg.
130.00 +115.90
45.00 +31.50
4.75
+1.01
10.16
+1.71
23.92
+3.65
5.89
+0.83
3.46
+0.45
29.20
+3.54
+822.0
+233.3
+27.0
+20.2
+18.0
+16.4
+15.0
+13.8
Losers
Name (Sym)
Volume
Close
Change
%Chg.
NovaBayPharm(NBY)
SkyHarbour(SKYH)
AirIndustries(AIRI)
RydeGroup(RYDE)
Mynd.ai(MYND)
Electromed(ELMD)
Myomo(MYO)
BetterChoice(BTTR)
2562
577
176
2429
36
236
768
270
3.44
10.27
3.48
8.99
2.50
14.62
3.41
4.03
–1.17
–2.33
–0.69
–1.74
–0.44
–2.03
–0.42
–0.47
–25.4
–18.5
–16.5
–16.2
–15.1
–12.2
–11.0
–10.4
Nasdaq Biggest % Movers
SummitTherap(SMMT)
Insmed(INSM)
CalliditasTherap(CALT)
AST Space(ASTS)
CartesianTherap(RNAC)
ForwardAir(FWRD)
AC Immune(ACIU)
OrchestraBioMed(OBIO)
Name (Sym)
Volume
Close
Change
%Chg.
87741
70310
412
173418
446
7391
1820
861
8.69
55.05
39.99
8.27
34.72
16.80
4.65
6.93
+5.30
+33.05
+17.57
+3.54
+10.15
+4.47
+1.11
+1.63
+157.0
+150.2
+78.4
+74.6
+41.3
+36.3
+31.4
+30.8
Volume
Close
Change
%Chg.
6.13
–3.91
1.88
–1.15
236.06 –113.68
7.26
–3.24
55.31 –17.53
1.95
–0.60
23.96
–6.74
2.67
–0.70
–38.9
–38.0
–32.5
–30.9
–24.1
–23.5
–22.0
–20.8
Losers
Name (Sym)
SolarmaxTech(SMXT)
MaxeonSolar(MAXN)
MongoDB(MDB)
AdlaiNortye(ANL)
Nutanix(NTNX)
CognitionTherap(CGTX)
B RileyFin(RILY)
CalAmp(CAMP)
670
50290
18641
183
27617
1429
3271
75
704
1830
809
149
126289
1581
162185
73990
529
7245
3260
153379
2881
38806
17297
8884
4937
285
889
3721
%Chg.
Close
Change
1217.8
11.26
990.1
21.93
543.0
4.85
489.3
11.29
468.0 234.44
460.2
18.23
458.8
12.26
426.3
81.76
385.7
10.92
359.6 192.09
329.7 45.94
321.1 139.56
305.5
10.64
281.9
92.55
278.2
64.23
277.3
57.00
272.5
57.86
261.9
11.40
251.3
9.02
250.5
55.46
–0.01
+3.76
–0.15
+0.04
–37.85
–0.23
–6.72
–0.18
+0.01
–12.02
+1.89
–20.62
+0.02
+9.62
–2.32
+8.89
–2.83
+0.03
+1.20
+12.48
BerkHathwy A(BRK.A)
Salesforce(CRM)
DellTechC(DELL)
UnitedHealth(UNH)
EliLilly(LLY)
TaiwanSemi(TSM)
ExxonMobil(XOM)
ServiceNow(NOW)
Visa(V)
JPMorganChase(JPM)
BankofAmerica(BAC)
BerkHathwy B(BRK.B)
Merck(MRK)
CRH(CRH)
J&J(JNJ)
Accenture(ACN)
Caterpillar(CAT)
Alibaba(BABA)
HomeDepot(HD)
Snowflake(SNOW)
Volume Percentage Leaders
Name (Sym)
Volume
%Chg.
Close
Change
LogisticProp(LPA)
EVeMobilityA(EVE)
SkyHarbour(SKYH)
ContangoOre(CTGO)
Southland(SLND)
flyExclusive(FLYX)
EvansBancorp(EVBN)
BiteAcqn(BITE)
EVI Industries(EVI)
Electromed(ELMD)
AcmeUnited(ACU)
RydeGroup(RYDE)
RileyExpln(REPX)
SerinaTherap(SER)
IssuerDirect(ISDR)
CaledoniaMining(CMCL)
CentrusEnergy(LEU)
EmpirePetrol(EP)
ConcordAcqnIIA(CNDA)
IvanhoeElectric(IE)
528
751
577
493
328
661
195
74
104
236
162
2429
979
57
74
254
1174
317
489
2241
505.2
480.1
382.4
255.6
231.3
185.7
145.7
85.9
85.7
79.6
62.6
50.9
50.6
50.6
42.3
42.2
37.9
18.8
12.0
9.1
Volume
Close
Change
%Chg.
Name (Sym)
255530
214000
112579
67659
66948
55744
43495
34166
31221
29701
27539
22846
19813
18552
16631
13952
13605
13130
12499
12086
0.17
0.11
0.51
2.42
0.18
2.19
1.38
2.80
1.09
0.17
0.48
7.14
1.63
0.20
0.19
0.25
0.17
0.33
2.76
1.80
+0.00
+0.01
–0.00
+0.10
–0.01
+0.22
–0.12
+0.04
–0.01
–0.00
+0.12
–0.12
–0.29
–0.02
–0.04
–0.04
–0.01
–0.04
–0.09
+0.04
+2.4
+5.5
–0.6
+4.3
–6.2
+11.2
–8.0
+1.4
–0.9
–2.0
+35.0
–1.7
–15.1
–9.8
–17.0
–13.7
–5.3
–10.7
–3.2
+2.3
AmerAirlines(AAL)
Nikola(NKLA)
Tesla(TSLA)
FuelCell(FCEL)
AdvMicroDevices(AMD)
NVIDIA(NVDA)
Apple(AAPL)
Intel(INTC)
AST Space(ASTS)
SiriusXM(SIRI)
WarnerBrosA(WBD)
Amazon.com(AMZN)
Rivian(RIVN)
BanzaiIntl(BNZI)
Grab(GRAB)
Robinhood(HOOD)
SoFiTech(SOFI)
Microsoft(MSFT)
Alphabet A(GOOGL)
Bitfarms(BITF)
Close
130.00 +115.90
11.04 +0.00
10.27
–2.33
23.92
+3.65
5.89
+0.83
5.40
–0.21
26.46
–1.14
10.16
+1.71
20.95
–0.99
14.62
–2.03
35.49
–3.86
8.99
–1.74
29.20
+3.54
9.41
–0.43
9.70
–0.24
10.45
+0.13
49.63
+1.66
7.24 –0.48
10.56
–0.03
11.37
–0.34
By Share Volume
Volume
Name (Sym)
Change
%Chg.
229878
0.53
216505
5.39
202094
12.13
181096
4.33
178479
23.14
171949
0.86
166576
39.99
162185
12.26
155294
28.66
153379 139.56
149777
18.22
142588
21.68
126289 234.44
121525
28.96
120435
15.08
113508
11.88
106085
21.21
104863
12.05
98867
28.96
97461
17.65
–0.13
+0.56
–0.03
–0.51
+4.14
+0.01
+0.29
–6.72
–0.22
–20.62
+0.72
+0.67
–37.85
+3.40
–0.05
+0.15
+4.64
–0.55
+7.98
–0.76
–20.1
+11.6
–0.2
–10.5
+21.8
+0.9
+0.7
–35.4
–0.8
–12.9
+4.1
+3.2
–13.9
+13.3
–0.3
+1.3
+28.0
–4.4
+38.0
–4.1
Change
%Chg.
Name (Sym)
$ Volume
Change
%Chg.
32874549627400.00+11500.00
28358565 234.44 –37.85
23075287 139.56 –20.62
10811121 495.37 –12.80
9072150 820.34 +12.91
8199503 151.04
–8.96
8110115 117.26
+3.84
7875183 656.93 –81.58
6891793 272.46
–2.03
6837803 202.63
+1.92
6293141
39.99
+0.29
6037818 414.40
+6.99
5981371 125.54
–3.95
5962912
81.76
–0.18
5765842 146.67
–0.30
5645376 282.29 –18.70
5547390 338.52 –10.38
5256755
78.34
–2.92
5149585 334.87
+9.77
4880389 136.18 –19.98
+1.9
–13.9
–12.9
–2.5
+1.6
–5.6
+3.4
–11.0
–0.7
+1.0
+0.7
+1.7
–3.1
–0.2
–0.2
–6.2
–3.0
–3.6
+3.0
–12.8
UraniumEner(UEC)
DenisonMines(DNN)
NewGold(NGD)
B2Gold(BTG)
ImperialOil(IMO)
EnergyFuels(UUUU)
PerspectiveTherap(CATX)
CentrusEnergy(LEU)
Tellurian(TELL)
Nuburu(BURU)
LogisticProp(LPA)
EquinoxGold(EQX)
SilverCrestMetals(SILV)
TasekoMines(TGB)
NovaGoldRscs(NG)
i-80Gold(IAUX)
MAG Silver(MAG)
SilvercorpMetals(SVM)
GoldRoyalty(GROY)
Seaboard(SEB)
166807
7.14
–0.12
161381
2.42
+0.10
117829
2.19
+0.22
93110
2.80 +0.04
89667
70.50
+1.46
68091
7.00 +0.44
62050
1.38
–0.12
58768
49.63
+1.66
57641
0.51 –0.00
50711
0.17 +0.00
50498 130.00 +115.90
50399
5.42
–0.15
46432
8.92
+0.18
35389
2.76
–0.09
35064
3.93
+0.33
33606
1.09
–0.01
33223
13.38
+0.03
32649
3.99
–0.11
31095
1.63
–0.29
30566 3341.13
–8.87
–1.7
+4.3
+11.2
+1.4
+2.1
+6.7
–8.0
+3.5
–0.6
+2.4
+822.0
–2.7
+2.1
–3.2
+9.2
–0.9
+0.2
–2.7
–15.1
–0.3
Nuburu(BURU)
Scorpius(SCPX)
Tellurian(TELL)
DenisonMines(DNN)
OceanPwrTech(OPTT)
NewGold(NGD)
PerspectiveTherap(CATX)
B2Gold(BTG)
i-80Gold(IAUX)
CamberEnergy(CEI)
FoxoTech(FOXO)
UraniumEner(UEC)
GoldRoyalty(GROY)
LoopMedia(LPTV)
CalidiBiotherap(CLDI)
SplashBeverage(SBEV)
Zomedica(ZOM)
KulrTech(KULR)
TasekoMines(TGB)
Ur-Energy(URG)
By Dollar Volume
$ Volume
Close
Name (Sym)
Volume
%Chg.
Close
Change
CalliditasTherap(CALT)
Surmodics(SRDX)
KeenVisionAcqn(KVAC)
LotusTech(LOT)
Insmed(INSM)
99Acqn(NNAG)
AscentIndustries(ACNT)
SareptaTherap(SRPT)
ArtesianRscs A(ARTNA)
Tech&TelecomA(TETE)
APxAcqnI A(APXI)
AdlaiNortye(ANL)
OrchestraBioMed(OBIO)
AtlanticaSust(AY)
Alarm.com(ALRM)
GlobalLightsAcqn(GLAC)
ChordEnergy(CHRD)
BlueWorldA(BWAQ)
SnapOne(SNPO)
OmegaFlex(OFLX)
412
4742
1550
4227
70310
726
196
26213
897
439
138
183
861
30181
5515
384
13835
454
6092
143
1791.0
1547.1
997.9
939.8
898.0
757.7
633.8
632.7
525.0
524.6
470.9
463.4
443.0
434.2
414.2
370.0
366.3
365.2
356.1
347.0
39.99
42.06
10.56
9.81
55.05
10.48
10.33
129.86
35.87
11.94
11.55
7.26
6.93
21.98
65.41
10.27
185.41
11.18
10.72
59.21
+17.57
+7.68
+0.02
–0.19
+33.05
+0.04
+0.09
+6.40
–2.64
+0.03
+0.05
–3.24
+1.63
–1.44
–1.70
+0.01
+5.65
+2.45
+0.02
–5.70
Volume
Close
Change
%Chg.
308677
11.50
270917
0.51
258920 178.08
247824
0.90
233154 166.90
230402 1096.33
230268 192.25
199458
30.85
173418
8.27
154612
2.82
151981
8.24
149773 176.44
130950
10.92
119491
0.21
110132
3.67
108568 20.90
107677
6.90
107546 415.13
103406 172.50
101745
2.24
–2.34
–0.01
–1.16
+0.02
+0.54
+31.64
+2.27
+0.13
+3.54
+0.07
+0.51
–4.31
+0.48
+0.01
+0.01
+0.39
–0.02
–15.03
–2.49
+0.22
–16.9
–2.8
–0.6
+2.7
+0.3
+3.0
+1.2
+0.4
+74.6
+2.5
+6.7
–2.4
+4.6
+7.7
+0.3
+1.9
–0.3
–3.5
–1.4
+10.9
Change
%Chg.
1096.33 +31.64
178.08
–1.16
415.13 –15.03
192.25
+2.27
166.90
+0.54
176.44
–4.31
466.83 –11.39
1328.55 –79.29
784.51 –99.37
172.50
–2.49
173.96
–2.37
204.05
–6.31
1524.49 –160.35
225.92 –11.73
809.89
+0.16
641.62
–5.13
444.76 –30.67
125.00
–4.49
149.78
–7.79
576.44 –30.55
+3.0
–0.6
–3.5
+1.2
+0.3
–2.4
–2.4
–5.6
–11.2
–1.4
–1.3
–3.0
–9.5
–4.9
+0.0
–0.8
–6.5
–3.5
–4.9
–5.0
By Share Volume
Close
By Dollar Volume
Winners
Name (Sym)
GinkgoBioworks(DNA)
NIO(NIO)
FordMotor(F)
AMC Ent(AMC)
GameStop(GME)
VirginGalactic(SPCE)
BankofAmerica(BAC)
UiPath(PATH)
Pfizer(PFE)
DellTechC(DELL)
AT&T(T)
PalantirTech(PLTR)
Salesforce(CRM)
MarathonOil(MRO)
Carnival(CCL)
NuHoldings(NU)
Chewy(CHWY)
Vale(VALE)
Gap(GPS)
HewlettPackard(HPE)
Volume
Nasdaq Most Active
By Dollar Volume
Includes Common shares only. All figures reflect activity for the most-recent five-day trading week. Share volume figures are expressed in thousands. Volume percentage leaders exclude stocks with average daily volume of fewer than 5,000 shares or priced under $5.
Average volume is based on 65 trading days. Volume figures do not reflect extended trading hours. a-Stock has not been in existence or not been traded for 65 consecutive sessions. S-Stock split or stock dividend amounting to 10% or more. X-Ex-dividend
Name (Sym)
NVIDIA(NVDA)
Tesla(TSLA)
Microsoft(MSFT)
Apple(AAPL)
AdvMicroDevices(AMD)
Amazon.com(AMZN)
MetaPlatforms(META)
Broadcom(AVGO)
SuperMicroComp(SMCI)
Alphabet A(GOOGL)
Alphabet C(GOOG)
Qualcomm(QCOM)
MicroStrategy(MSTR)
CoinbaseGlbl(COIN)
Costco(COST)
Netflix(NFLX)
Adobe(ADBE)
MicronTech(MU)
PDD(PDD)
Intuit(INTU)
$ Volume
254766010
45711082
44810323
43929138
38743240
26453607
21876336
19428147
19125498
17510524
13235156
10476038
8729375
8723232
8291859
8072692
8000252
7914602
6961395
6390260
Close
28
BARRON’S
June 3, 2024
RE SEARCH REPORTS
How Analysts Size
Up Companies
For personal non-commercial use only. Do not edit or alter. Reproductions not permitted.
To reprint or license content, please contact Barron's reprints department at 800-843-0008 or www.djreprints.com
These reports,
excerpted and
edited by Barron’s,
were issued recently
by investment and
research firms.
The reports are a
sampling of analysts’
thinking; they should
not be considered
the views or recommendations of
Barron’s. Some of
the reports’ issuers
have provided, or
hope to provide,
investment-banking
or other services to
the companies being
analyzed.
Live Nation • LYV-NYSE
Overweight • Price $94.89 on May 28
by J.P. Morgan
We’re updating our thoughts on Live
Nation following the Department of
Justice’s announced [antitrust] lawsuit. Our base case view is that Live
Nation isn’t broken up, noting a high
bar for structural relief, with AT&T in
1981 the most recent precedent. Live
Nation, we think, has presented a reasonable defense, and its vertical integration has run parallel to a time of
better revenue splits for venues and
artists, a reality a judge would have to
consider. We further see the government’s request for a trial by jury as
indicative of some caution regarding
the strength of its case. Alternative to
the breakup option, it’s possible some
behavior adjustments come out of this
process, either by mandate or settlement....We do expect some sentiment
overhang to persist near term and
reduce our December 2024 price target to $116 from $126, reflecting this,
but remain Overweight and believe
that continued execution on adjusted
operating-income growth should drive
shares higher, with significant valuation upside should developments in
the lawsuit break positive.
Lululemon Athletica • LULU-Nasdaq
Buy • Price $295.25 on May 28
by TD Cowen
Competitor growth and weaker barriers to entry have valuation multiples
at the lowest point since 2017 and
multiyear discounts relative to peers.
Our model suggests fiscal-2024 earnings-per-share guidance is conservative. While growth is moderating, financial returns on capital are at the
top of the sector, and competitive risk
could be overpriced. Investors are
bracing for guidance cut....We have
confidence that new product, integrated marketing, and online momentum combined with loyalty, a healthy
high-end customer demographic, and
athleisure fashion trends will yield
traffic, improving conversion, and
comps. Our recent survey indicates
that a high degree of loyalty and conversion levels should increase as we
For a look back at more analyst
research and reports, go online to
barrons.com/researchreports
expect new product to incorporate
fashionable versatility. We see longterm EPS potential of $23-plus on
low-teens revenue compound annual
growth, and high-teens EPS CAGR
through fiscal 2027. Price target: $437.
Costco Wholesale • COST-Nasdaq
Buy • Price $809.73 on May 27
by UBS
Irrespective of what’s happening in
the macro, Costco continues to do
what it does best—consistently growing traffic at a moving-standard-deviation pace, increasing its market share,
and sweating its assets. Costco’s consistency is best illustrated by how it
navigated different backdrops over the
past few years: 1) when consumers
were flushed with cash during the
pandemic, Costco averaged 5% growth
in traffic; 2) when the macro backdrop
took a step down in 2023, Costco continued to average 5% growth in traffic;
and 3) yet again, although macro has
remained volatile so far in 2024, with
consumer budgets stretched and
spending patterns continuing to normalize, Costco has grown its traffic at
an average of 5% year to date. With
such strong and consistent growth in
footsteps, Costco offers exactly what
the market is looking for right now,
given that retail investors have very
little appetite to be exposed to market
share losers and are increasingly favoring market share winners. In the
absence of broad-based retail sales
growth, this investor sentiment will
probably only intensify with volatility
in consumer spending likely rising
toward the election. As this takes
place, Costco’s share gains will look
even more compelling and the stock
will sustain its premium valuation, in
our view. Price target: $940.
Airbnb • ABNB-Nasdaq
Outperform • Price $144.47 on May 28
by Wedbush
Shares of Airbnb have declined 8.5%
since the company reported firstquarter 2024 earnings on May 8,
underperforming both the Nasdaq
(+3.8%) and Booking Holdings
(+9.3% since reporting results on
Insider Transactions
Purchases
Sales
Company
Symbol Insiders
Shares
Privia Health
PRVA
2
566,716
Shift4 Payments
FOUR
1
39,135
Petco Health And Wellness Company WOOF
1
750,000
Luxurban Hotels
LUXH
3 7,200,000
Boston Omaha
BOC
2
112,528
Integra Lifesciences
IART
1
52,641
Claros Mortgage Trust
CMTG
3
181,000
Agree Realty
ADC
2
21,000
Omniab
OABI
1
240,000
Titan Machinery
TITN
2
55,275
Traeger
COOK
1
455,007
Vestis
VSTS
2
77,710
Compass Diversified
CODI
5
37,956
Shutterstock
SSTK
2
17,850
Sunoco Lp
SUN
3
10,000
Zura Bio Ltd
ZURA
1
80,000
Treace Medical Concepts
TMCI
2
80,100
Sofi Technologies
SOFI
1
57,760
Hilton Worldwide
HLT
1
2,000
American Healthcare Reit
AHR
1
25,000
$ Val
(000's)
9,213
2,506
2,354
1,800
1,608
1,500
1,307
1,245
1,060
1,002
998
923
851
680
502
496
407
400
399
355
Company
Lifestance Health
Amphenol
Macom Technology Solutions
Advanced Drainage Systems
Acv Auctions
Carvana
Salesforce
Squarespace
Aspen Aerogels
Appfolio
Boston Scientific
Ccc Intelligent Solutions
Ralph Lauren
Reddit
Microsoft
Generac
General Electric
Draftkings
Amazon.Com
Atlassian
$ Val
Symbol Insiders
Shares (000's)
LFST
2 5,426,983 31,965
APH
1
185,000 25,038
MTSI
1
173,192 17,876
WMS
3
98,514 17,193
ACVA
1
787,955 14,854
CVNA
1
120,000 13,670
CRM
3
49,200 13,447
SQSP
3
296,548 12,918
ASPN
2
438,160 12,827
APPF
1
50,409 12,183
BSX
3
159,129 12,030
CCCS
1 1,000,000 11,779
RL
1
67,243 11,515
RDDT
6
192,689 11,358
MSFT
1
25,000 10,642
GNRC
2
70,239 10,277
GE
3
55,900 9,072
DKNG
1
200,000 8,718
AMZN
4
47,574 8,641
TEAM
3
49,891 8,479
An insider is any officer, director or owner of 10% or more of a class of a company's securities. In most cases, an insider must report any
trade to the SEC within two business days. The tables highlight companies that filed with the SEC through last Wednesday. The tables
do not include pension-plan or employee stock-option activity, trades by beneficial owners of 10% or more, trades under $2 per share or
trades under 100 shares. The "Purchases" column includes only open-market and private purchases; the "Sales" column includes only
open-market and private sales, and excludes trades preceded by option exercise in the 12 months prior to the reported event.
Source: Thomson Reuters
Insider Transactions Ratio
150
125
100
Bearish
75
Ratio = 9
50
25
Bullish
J
J
A
S
O
N
D
J
F
M
0
A
M
Ratio of Insiders Sales to Buys. Readings under 12:1 are Bullish. Those over 20:1 are Bearish. The total top 20 sales and buys are
274,481,462 and 29,605,776 respectively; Source: Thomson Reuters
May 2). We think investors should
take advantage of this period of relative weakness and see potential upside to near-term estimates following
disappointing second-quarter guidance that we view as conservative,
given positive travel data points thus
far in the second quarter. Longer
term, Airbnb’s underlying growth
opportunity remains attractive, and
there is significant optionality ahead
as Airbnb expands beyond the core.
Airbnb continues to hold a leading
competitive position within the alternative-accommodation segment, and
we believe the opportunity for growth
in adjacent products and services is
becoming more tangible as management’s focus shifts to new areas of
growth. We are upgrading shares of
Airbnb to Outperform from Neutral
and are raising our target price to
$165 from $160.
American Airlines • AAL-Nasdaq
Neutral • Price $13.44 on May 29
by Seaport Research Partners
American Airlines’ revenue challenges are likely to persist beyond
this summer, given escalating ultralow-cost carrier growth at its top
hubs; we are cutting our earnings
outlook and downgrading shares to
Neutral from Buy and withdrawing
our price target. Spirit Airlines and
Frontier Airlines are shifting growth
to Dallas-Fort Worth and Charlotte,
N.C., American Airlines’ top two
hubs, as they de-emphasize growth
in Florida.
We’re also seeing third-quarter
2024 pricing that is beginning to
soften at the industry level. In short,
American Airlines’ plans for highsingle digit growth this summer are
proving premature.
June 3, 2024
29
BARRON’S
DATA
Barron's 50-Stock Average
Cash Track
Coming Earnings
Conference Call Calendar
Consensus Estimate
Delta Tactical Sentiment
Distributions & Offerings
Dividend Boosts - Reductions
Dividend Ex-Payment Dates
DJ Averages
DJ U.S. Total Market Industry Groups
Dow Jones Averages
45
39
43
43
43
43
42
44
44
41
43
41
Dow Jones Per Share Values
Exchange Traded Portfolios
Federal Reserve Data Bank
Foreign Exchange
Gold & Silver Prices
Gold Mining Index
Indexes P/Es & Yields
Initial Public Offerings
Investor Sentiment Readings
Key Foreign Market Indexes
Market Lab
Money Rates, U.S. & Foreign
42
38
44
43
44
44
42
42
42
37
41
43
Mutual Funds
N.Y. Stock Exchange
Nasdaq National Market
New Corporate Listings
New Highs & Lows
NYSE Half-Hourly Volume
Other Market Indexes
Pulse of the Economy
Stock Splits - Special Dividends
Stock Volume
Trading Diary
Vital Signs
39
29
33
42
45
42
41
43
44
42
41
22
Statistics from May 28-31, 2024
NEW YORK STOCK EXCHANGE COMPOSITE LIST NOTICE TO READERS: Due to
space constraints, Charting the
Market isn’t in this week’s edition. It will be back next week.
–52-Week–
High
Low
Name
Tick
Sym Yld P/E
Last
Div
Chg. Amt.
70.99
47.27
5.09
12.41
3.43
7.11
87.34
21.59
89.87
107.33
6.82
16.95
4.33
55.94
4.02
1.72
11.43
2.67
10.78
93.91
18.22
61.34
4.76
31.83
15.15
73.88
47.96
83.88
8.48
102.19
161.24
172.87
17.24
9.91
282.29
259.61
65.90
9.84
28.24
64.39
70.64
173.49
23.70
6.46
92.71
3.23
162.60
130.41
6.30
68.21
60.76
47.64
266.70
189.99
16.71
42.02
87.72
122.59
20.64
44.27
89.13
16.80
212.20
119.00
78.34
7.75
121.82
.75
63.15
33.55
75.81
167.52
–0.34 ...
+0.40 .225
+0.05 .075
–0.40 ...
–0.25 ...
–0.11 .055
–1.66 .22
+0.68.1725
+2.18 .50
+0.77 2.50
+0.15 .18
+0.24 ...
–0.51 ...
–0.30 ...
+0.14 ...
–0.01 ...
+0.03 ...
–0.05 .05
–0.37.5714
–1.43 ...
+0.72.2775
+0.81 ...
–0.05 ...
–0.04 ...
+0.03 .06
+1.51 .44
+0.57 ...
–0.72 .17
+1.27 .125
–1.76 .55
+4.18 1.55
+22.70 ...
+0.88 .18
+0.30 ...
–18.70 1.29
–3.27 .15
+1.45 .215
–0.11.1649
+1.00 ...
–1.15 ...
+1.07 .25
–0.81 .16
+0.66 .16
–0.24.1734
+0.22 .25
–0.18 ...
+2.13 .01
–20.25 .236
+0.21 ...
+0.50 .40
+1.45 .25
–0.91 .21
+2.09 1.77
–2.14 .26
+0.12 .025
–0.68 ...
–0.56 .26
–5.00 .40
+0.27 .12
+2.63 .10
–0.30 ...
+0.29.2225
+2.344.50
+0.60 1.27
–2.92 .66
–0.44 ...
–0.78 .48
–0.15 ...
+0.23 .705
–0.19 .73
+0.01 .25
+2.68 .92
For personal non-commercial use only. Do not edit or alter. Reproductions not permitted.
To reprint or license content, please contact Barron's reprints department at 800-843-0008 or www.djreprints.com
A
73.95
53.05
6.62
14.35
6.04
7.60
98.72
22.60
89.91
140.46
6.99
33.73
54.97
112.44
8.42
5.25
12.42
3.69
11.68
106.42
18.27
62.44
14.50
48.89
16.46
74.05
50.78
86.94
16.16
121.64
182.89
196.99
17.90
12.05
387.51
272.74
70.10
12.51
46.51
67.69
88.56
184.27
40.85
6.96
93.71
7.60
169.65
155.35
21.52
71.50
69.26
52.31
307.71
231.40
17.29
57.18
99.41
247.44
23.88
45.48
91.08
19.99
237.18
135.45
102.50
10.38
136.91
3.88
65.86
35.84
83.42
177.37
51.48
37.61
4.64
6.62
0.36
5.53
74.40
11.43
65.31
102.76
4.82
3.81
2.38
53.00
2.92
1.65
10.63
2.56
7.20
67.30
13.43
35.03
4.00
29.78
10.04
52.02
24.72
36.14
6.62
89.67
130.96
30.40
12.96
9.37
278.69
153.62
45.82
8.82
26.78
33.59
47.73
98.63
21.55
4.59
57.18
2.33
120.22
96.80
4.41
43.22
52.69
33.33
212.24
157.74
10.78
30.75
78.20
106.69
19.85
23.07
69.44
15.53
162.50
90.73
66.63
6.33
95.94
0.57
49.29
25.83
49.00
100.57
AAR
ABMIndustries
ACCO Brands
AcresCmclRlty
ADC Therap
ADT
AECOM
AES
Aflac
AGCO
AG Mortgage
a.k.a.Brands
AMC Ent
AMN Healthcare
AMTD Digital
AMTD IDEA
AP Acqn A
ARC Document
ASE Tech
ASGN
AT&T
ATI
ATI PhysTherapy
ATS
A10Networks
AXIS Capital
AZEK
AZZ
Aaron's
AbbottLabs
AbbVie
Abercrombie&Fitch
AcadiaRealty
AccelEnt
Accenture
AcuityBrands
Acushnet
Adecoagro
Adient
AdtalemGlbEduc
AdvanceAuto
AdvDrainageSys
AdvanSix
Aegon
AerCap
AevaTech
AffiliatedMgrs
AgilentTechs
agilon health
AgnicoEagleMines
AgreeRealty
AirLease
AirProducts
AlamoGroup
AlamosGold
AlaskaAir
AlbanyIntl
Albemarle
Albertsons
Alcoa
Alcon
Alexander&Baldwin
Alexander's
AlexandriaRlEst
Alibaba
Alight
Allegion
Allego
Allete
AllianceBernstein
AllisonTransm
Allstate
AIR
...
ABM 1.9
ACCO 5.9
ACR ...
ADCT ...
ADT 3.1
ACM .9
AES 3.2
AFL 2.2
AGCO 1.1
MITT10.6
AKA ...
AMC ...
AMN ...
HKD ...
AMTD ...
APCA ...
ARC 7.5
ASX 3.9
ASGN ...
T
6.1
ATI
...
ATIP ...
ATS ...
ATEN 1.6
AXS 2.4
AZEK ...
AZZ .8
AAN 5.9
ABT 2.2
ABBV 3.8
ANF ...
AKR 4.2
ACEL ...
ACN 1.8
AYI .2
GOLF 1.3
AGRO 3.3
ADNT ...
ATGE ...
AAP 1.4
WMS .4
ASIX 2.7
AEG 4.3
AER 1.1
AEVA ...
AMG .0
A
.7
AGL ...
AEM 2.3
ADC 4.9
AL 1.8
APD 2.7
ALG .5
AGI .6
ALK ...
AIN 1.2
ALB 1.3
ACI 2.3
AA
.9
ALC ...
ALEX 5.3
ALX 8.5
ARE 4.3
BABA 2.5
ALIT ...
ALLE 1.6
ALLG ...
ALE 4.5
AB 8.2
ALSN 1.3
ALL 2.2
42
12
dd
18
dd
10
dd
30
10
7
4
dd
dd
15
...
...
49
13
24
22
10
25
dd
22
25
11
60
28
dd
32
48
22
cc
20
26
22
23
4
17
24
cc
27
cc
dd
6
dd
9
31
dd
72
36
10
24
17
33
22
25
45
9
dd
42
28
10
cc
18
dd
20
dd
15
14
10
37
–52-Week–
High
Low
10.94
41.77
7.30
452.00
17.72
17.98
3.82
24.00
46.60
7.28
18.45
3.23
10.51
18.23
26.13
88.72
63.19
22.86
23.92
9.55
26.44
244.41
137.72
14.90
37.97
80.83
25.96
92.85
9.60
219.10
18.38
151.22
2.74
33.90
442.79
186.33
4.00
138.59
8.21
10.63
24.36
12.86
26.01
67.49
21.07
22.49
15.10
35.83
9.43
347.37
1.49
22.54
4.30
142.27
14.25
8.23
1.75
11.68
39.07
3.41
11.26
2.17
8.45
13.10
16.63
67.03
17.55
16.00
17.15
6.29
10.48
140.91
105.22
12.63
31.36
54.16
11.69
66.03
5.46
154.58
8.41
113.34
0.40
21.87
305.14
136.89
1.25
76.28
3.56
1.22
14.65
7.26
14.91
51.66
14.52
4.79
10.37
20.10
4.03
268.06
Tick
Sym Yld P/E
Name
AllurionTech
AllyFinancial
AlmacenesExito
AlphaMetal
AlpineIncmProp
AltaEquipment
AlticeUSA
AltoNeurosci
Altria
AltusPower
AmbacFin
Ambev
Amcor
AmerSports
AmerantBncpA
Ameren
Ameresco
AmericaMovil
AmericanAssets
AmericanAxle
AmerEagle
AmerExpress
AmericanFin
AmerHlthcrREIT
AmHomes4Rent
AIG
AmRltyInv
AmerStWater
AmerStratInvt
AmerTowerREIT
AmerVanguard
AmerWaterWorks
AmericanWell
AmericoldRealty
Ameriprise
Ametek
Ampco-Pitt
Amphenol
AmplifyEnergy
AmpriusTech
Amrep
AngelOakMtgREIT
AngloGoldAsh
AB InBev
AnnalyCap
AnnovisBio
AnteroMidstream
AnteroResources
AnywhereRealEst
Aon
ALUR ...
ALLY 3.1
EXTO .2
AMR .6
PINE 7.0
ALTG 2.7
ATUS ...
ANRO ...
MO 8.5
AMPS ...
AMBC ...
ABEV 5.8
AMCR 4.9
AS
...
AMTB 1.6
AEE 3.7
AMRC ...
AMX 1.9
AAT 6.2
AXL ...
AEO 2.3
AXP 1.2
AFG 2.2
AHR 6.8
AMH 2.9
AIG 2.0
ARL ...
AWR 2.3
NYC ...
AMT 3.4
AVD 1.4
AWK 2.3
AMWL ...
COLD 3.3
AMP 1.4
AME .7
AP
...
APH .7
AMPY ...
AMPX ...
AXR ...
AOMR10.3
AU
.9
BUD ...
NLY 13.2
ANVS ...
AM 6.1
AR
...
HOUS ...
AON 1.0
dd
16
73
8
dd
dd
cc
...
10
dd
13
12
23
...
33
17
33
17
24
dd
20
20
12
dd
37
12
83
24
dd
44
35
27
dd
dd
15
30
dd
40
9
dd
51
7
dd
24
dd
dd
18
cc
dd
22
Last
Div
Chg. Amt.
1.51
38.97
4.59
315.41
15.68
8.44
2.48
11.96
46.25
4.05
17.72
2.22
10.17
15.37
22.04
73.37
36.52
18.54
21.75
7.64
21.97
240.00
129.91
14.66
36.04
78.82
14.09
73.59
9.20
195.74
8.69
130.77
.43
26.67
436.61
169.58
1.32
132.37
6.30
1.39
21.17
12.47
24.19
63.07
19.70
6.55
14.65
35.63
4.07
281.64
–0.12 ...
+0.17 .30
+0.02.0121
+8.23 .50
+0.43 .275
–0.37 .057
+0.15 ...
–0.96 ...
+0.76 .98
+0.11 ...
+0.43 ...
–0.07.1443
+0.23 .125
+0.55 ...
–0.27 .09
+2.03 .67
+2.56 ...
–0.90.1967
+0.62 .335
+0.23 ...
–1.19 .125
+1.82 .70
+0.88 .71
+0.66 .25
–0.09 .26
+0.79 .40
+0.25 ...
–0.50 .43
–0.20 ...
+9.81 1.62
–0.17 .03
+2.54 .765
... ...
+1.30 .22
–4.36 1.48
–4.08 .28
–0.19 ...
–3.87 .11
+0.13 ...
–0.06 ...
+1.22 ...
+0.21 .32
–0.11 .19
–1.97 ...
+0.22 .65
–0.74 ...
+0.23 .225
+2.35 ...
–0.42 ...
+0.89 .675
–52-Week–
High
Low
38.84
8.93
39.98
12.74
119.55
17.90
201.76
151.73
113.60
34.00
17.74
7.27
29.15
187.60
7.49
87.30
21.61
13.20
89.44
25.47
4.17
23.44
10.76
11.24
150.12
70.97
17.27
329.04
14.36
13.11
27.00
125.56
147.42
46.75
25.51
26.27
256.39
5.09
100.99
30.28
37.54
22.77
38.64
189.48
96.60
194.98
37.86
24.93
125.28
33.70
28.22
5.63
22.71
9.22
68.38
14.08
126.09
111.63
68.84
23.95
11.77
3.67
21.30
106.78
2.79
50.72
9.46
8.59
61.98
12.95
2.57
11.59
10.10
6.36
87.43
37.37
7.22
148.32
7.77
9.81
13.32
63.00
108.51
32.12
12.16
12.85
178.40
1.14
70.82
5.33
22.92
15.16
31.12
121.51
51.45
121.00
25.22
15.55
101.00
18.21
Tick
Sym Yld P/E
Name
AptIncmREIT
ApartmtInv
APi Group
ApolloComRlEst
ApolloGlblMgmt
AppleHospREIT
AppliedIndlTechs
Aptargroup
Aptiv
Aramark
ArborRealty
ArcadiumLithium
ArcelorMittal
ArchResources
ArcherAviation
ADM
Archrock
ArcosDorados
Arcosa
ArcusBiosci
ArdaghMetalPkg
ArdmoreShipping
AresAcqnII A
AresCommRealEst
AresMgmt
Argan
ArisWater
AristaNetworks
ArloTech
ArmadaHoffler
ArmourResREIT
ArmstrongWorld
ArrowElec
ArtisanPtrsAsset
Artivion
Asana
AsburyAutomotive
AshfordHosp
Ashland
AspenAerogels
AssetMarkFin
AssociatedBanc
AssocCapital
Assurant
AssuredGuaranty
Atkore
AtlUnionBkshs
AtlasEnergy
AtmosEnergy
AtmusFiltration
AIRC .0
AIV ...
APG ...
ARI 13.9
APO 1.6
APLE 6.6
AIT .8
ATR 1.1
APTV ...
ARMK 1.2
ABR 12.6
ALTM ...
MT 1.6
ARCH .6
ACHR ...
ADM 3.2
AROC 3.3
ARCO 2.5
ACA .2
RCUS ...
AMBP10.1
ASC 3.9
AACT ...
ACRE14.4
ARES 2.7
AGX 1.7
ARIS 2.7
ANET ...
ARLO ...
AHH 7.2
ARR 14.9
AWI 1.0
ARW ...
APAM 5.8
AORT ...
ASAN ...
ABG ...
AHT ...
ASH 1.6
ASPN ...
AMK ...
ASB 4.1
AC
.6
AIZ 1.7
AGO 1.6
ATKR .8
AUB 3.9
AESI 2.6
ATO 2.8
ATMU ...
9
dd
dd
dd
13
17
20
32
8
14
9
...
27
10
dd
11
25
12
30
dd
dd
9
39
dd
62
30
21
41
dd
cc
dd
22
10
14
dd
dd
9
dd
26
dd
18
22
22
12
6
9
12
15
17
16
Last
Div
Chg. Amt.
38.75
7.89
35.64
10.10
116.16
14.44
193.00
147.69
83.26
32.15
13.68
4.43
26.49
173.93
3.27
62.44
20.24
9.66
87.91
15.07
3.95
22.41
10.64
6.96
140.17
70.63
15.37
297.65
14.21
11.34
19.34
115.80
131.31
44.03
23.60
13.05
235.07
1.17
100.17
29.92
34.39
21.42
34.35
173.47
77.72
152.15
32.63
24.22
115.92
30.84
+0.04 .45
–0.28 ...
–0.77 ...
–0.07 .35
+0.64.4625
–0.03 .08
–2.72 .37
–0.40 .41
+0.71 ...
+0.19 .11
+0.31 .43
–0.27 ...
+0.72 .25
+3.33 .86
–0.03 ...
+1.95 .50
+0.45 .165
–0.28 .06
+0.67 .05
–1.05 ...
+0.01 .10
–0.57 .31
+0.02 ...
+0.41 .25
–5.84 .93
+0.11 .30
+0.14 .105
–8.90 ...
+1.82 ...
+0.01 .205
+0.36 .24
–0.95 .28
–0.21 ...
–1.02 .61
–0.18 ...
–1.40 ...
+3.77 ...
–0.11 ...
+0.52.405
+0.25 ...
+0.29 ...
+0.18 .22
... .10
+4.48 .72
+1.64 .31
–3.85 .32
+0.30 .32
+0.39 .06
+3.31 .805
+0.70 ...
Five-Day Dow Composite
It’s Never Enough: The Dow dropped 1% this week following disappointing financial updates from some of its largest components. Salesforce dropped 14% on weak earnings, while Nike gained 3.6%.
Monday
Tuesday
Wednesday
Thursday
Friday
39,060
(Prev Fri)
H
O
L
I
D
A
Y
10 12 2
38,795
38,530
38,265
-216.73
4
10 12 2
-411.32
4
10 12 2
+574.84
-330.06
4
10 12 2
38,000
4
10 12 2
4
–52-Week–
High
Low
3.25
10.85
34.10
129.38
182.08
3256.37
200.71
39.14
26.56
26.16
229.98
47.87
42.66
36.76
63.00
13.87
Last
Div
Chg. Amt.
ATRenew
Auna
Autohome
Autoliv
AutoNation
AutoZone
Avalonbay
Avangrid
AvanosMedical
Avantor
AveryDennison
Avient
Avista
AxaltaCoating
AxosFinancial
Azul
RERE ...
AUNA ...
ATHM ...
ALV 2.1
AN
...
AZO ...
AVB 3.5
AGR 4.9
AVNS ...
AVTR ...
AVY 1.5
AVNT 2.3
AVA 5.1
AXTA ...
AX
...
AZUL ...
Tick
Sym Yld P/E
dd
dd
13
20
8
19
29
16
dd
63
33
39
15
32
7
dd
2.31
8.80
28.40
127.57
170.25
2769.94
192.68
36.01
19.91
24.08
227.59
44.68
36.98
35.59
53.87
5.45
... ...
+0.59 ...
+1.27 ...
+1.84 .68
+0.51 ...
–22.96 ...
–2.66 1.70
–0.18 .44
–0.05 ...
–0.06 ...
+0.54 .88
–0.30.2575
+0.20 .475
+0.44 ...
–3.22 ...
–0.51 ...
0.70
7.20
18.71
31.82
1.68
6.40
54.28
50.41
1.79
60.45
33.52
2.00
2.51
1.69
15.21
9.24
61.51
0.75
134.06
5.57
42.81
7.28
9.96
3.78
6.86
2.19
19.20
19.81
17.30
4.93
16.89
3.32
24.15
24.96
24.62
39.02
73.98
39.66
39.80
19.95
6.23
7.58
0.15
18.79
13.76
27.30
9.60
13.16
6.09
31.01
2.89
6.31
21.00
224.00
60.55
34.58
22.66
0.13
56.36
493283
324.42
18.31
53.92
62.30
Bark
B&G Foods
BBB Foods
BCE
BEST
BGSF
BHP Group
BILL
BitMining
BJ'sWholesale
BP
BP Prudhoe
BRC
BRF
BRT Apartments
BW LPG
BWX Tech
Babcock&Wilcox
BadgerMeter
Bakkt
Ball
Bally's
BancCalifornia
BancoBBVA
BBVA
BancoBradesco
BancodeChile
Bladex
BancoMacro
BancSanBrasil
BcoSantChile
BancoSantander
BanColombia
BankofAmerica
BankofButterfield
BankofHawaii
BankMontreal
BankNY Mellon
BankNovaScotia
BankUnited
Barclays
BaringsBDC
Barnes&NobleEduc
BarnesGroup
BarrickGold
Bath&BodyWks
BatteryFutureA
Bausch+Lomb
BauschHealth
BaxterIntl
BaytexEnergy
Beachbody
BeazerHomes
BectonDicknsn
Belden
BellRing
BenchmarkElec
BensonHill
Berkley
BerkHathwy A
BerkHathwy B
BerkshireHills
BerryGlobal
BestBuy
BARK ...
BGS 8.0
TBBB ...
BCE 8.2
BEST ...
BGSF .0
BHP 5.1
BILL ...
BTCM ...
BJ
...
BP 4.6
BPT ...
BRCC ...
BRFS ...
BRT 5.7
BWLP 4.6
BWXT 1.0
BW
...
BMI .6
BKKT ...
BALL 1.2
BALY ...
BANC 2.9
BBAR .0
BBVA 4.4
BBDO 6.9
BCH 5.2
BLX 6.7
BMA .0
BSBR 4.6
BSAC 3.0
SAN 2.5
CIB 3.1
BAC 2.4
NTB 5.2
BOH 4.8
BMO 3.8
BK 2.8
BNS 6.6
BKU 4.0
BCS 3.4
BBDC10.3
BNED ...
B
1.7
GOLD 2.3
BBWI 1.5
BFAC ...
BLCO ...
BHC ...
BAX 3.4
BTE 1.8
BODI ...
BZH ...
BDX 1.6
BDC .2
BRBR ...
BHE 1.5
BHIL ...
WRB .5
BRK.A ...
BRK.B ...
BHLB 3.2
BERY 1.8
BBY 4.4
dd
dd
...
24
dd
14
21
dd
dd
23
12
...
dd
dd
cc
6
33
dd
56
dd
dd
dd
dd
5
7
9
8
6
3
...
14
7
11
14
8
15
15
15
11
12
...
8
dd
cc
21
13
29
dd
dd
dd
dd
dd
6
51
19
40
23
dd
14
12
12
45
14
15
1.30
9.54
27.24
34.21
2.00
6.95
59.53
52.05
2.60
88.07
37.57
2.35
5.80
3.63
17.50
21.93
92.13
1.17
192.96
17.60
69.43
12.15
13.86
11.29
10.91
2.22
23.68
30.01
66.29
5.31
18.88
5.24
35.46
39.99
34.07
57.74
89.11
59.61
47.33
28.69
11.35
10.05
.45
38.49
17.09
51.94
11.04
15.34
6.56
34.09
3.68
8.75
28.72
231.97
95.69
58.17
43.07
.19
81.03
627400
414.40
22.23
59.88
84.82
+0.14 ...
+0.07 .19
–1.00 ...
+0.64.7405
–0.05 ...
+0.47 .15
–0.10 1.44
–0.11 ...
–0.20 ...
–0.07 ...
+0.85.4312
... ...
+0.09 ...
–0.10 ...
+0.24 .25
+3.76 1.00
+3.12 .24
–0.01 ...
–7.68 .27
+0.21 ...
+0.55 .20
+0.05 ...
+0.14 .10
+1.45.064
+0.06.1695
–0.08.0033
–0.461.6924
–0.23 .50
+7.99.4262
–0.11.0792
–1.03.7557
+0.13.1027
+0.16.9062
+0.29 .24
–0.40 .44
+0.88 .70
–6.361.1367
+0.52 .42
–0.45.7774
+0.17 .29
+0.27.2671
+0.10 .26
–0.13 ...
–2.37 .16
+0.07 .10
+3.66 .20
+0.07 ...
+0.32 ...
+0.20 ...
+0.19 .29
+0.23.0164
+0.41 ...
+1.19 ...
+3.18 .95
–1.90 .05
–0.19 ...
–0.42 .165
–0.01 ...
+1.74 .11
+11500 ...
+6.99 ...
–0.14 .18
+0.46 .275
+13.32 .94
B
1.64
15.15
28.84
46.58
2.94
11.70
69.11
139.50
6.95
88.35
40.84
8.17
6.30
3.89
20.69
22.31
107.18
6.64
202.81
68.75
71.32
16.96
16.08
11.87
12.20
3.21
24.79
31.62
67.43
6.66
21.81
5.27
37.85
40.08
36.06
75.19
100.12
59.70
51.98
34.22
11.36
10.07
2.26
43.66
18.95
52.07
11.55
21.95
11.46
50.21
4.65
28.50
35.93
287.32
99.13
62.76
44.85
1.58
89.19
647039
430.00
25.79
69.94
86.11
42
44
27
Contact Us
For queries, email us at
memberservices@dowjones.com
-
NEW HIGHS
1.01
6.17
23.81
82.21
123.81
2303.93
160.45
27.46
17.24
16.63
161.12
27.73
30.53
25.03
32.05
5.16
Name
Week In Stocks
Weekly Bond Statistics
Winners & Losers Stocks
NEW LOWS
–52-Week–
High
Low
39.27
11.06
4.80
1077.20
219.00
62.21
431.79
58.67
64.47
5.75
845.00
2.37
133.56
23.82
3.41
54.21
87.52
18.76
16.87
19.87
132.67
267.54
154.67
119.56
164.43
47.05
9.01
395.52
20.81
73.97
76.25
27.21
15.47
31.94
73.00
68.80
4.37
5.67
6.00
12.67
42.73
13.07
119.21
3.23
23.63
8.01
14.42
103.50
70.69
66.46
0.14
38.28
34.28
24.47
210.24
17.59
7.62
43.00
25.58
45.11
48.23
37.32
45.11
44.95
35.59
91.70
72.65
71.27
99.68
48.15
18.84
32.47
214.70
116.59
17.70
243.64
2.71
24.52
13.71
3.13
1.16
700.00
137.01
16.45
261.59
35.83
46.43
2.46
596.18
1.04
83.43
16.73
0.85
30.18
38.85
8.41
12.99
10.24
67.76
159.70
72.65
65.77
100.96
29.51
5.19
254.40
13.33
48.97
48.35
22.14
8.85
23.29
49.34
46.77
1.79
3.62
4.59
6.30
26.08
6.18
71.65
0.81
15.23
5.20
6.58
63.79
28.23
39.91
0.02
23.58
28.25
19.46
148.94
13.68
3.42
28.35
14.00
28.84
25.48
21.03
29.00
32.75
21.35
62.84
44.08
43.55
66.47
30.31
6.81
19.37
105.24
86.10
11.78
115.66
0.67
17.66
Name
Beyond
BigLots
BigBear.ai
BiglariA
BiglariB
Biohaven
Bio-RadLab A
Birkenstock
BlackHills
BlackBerry
BlackRock
BlackSkyTech
Blackstone
BlackstoneMtg
BlendLabs
BlockHR
Block
BloomEnergy
BlueOwlCapital
BlueOwlCapital
BlueLinx
Boeing
BoiseCascade
BootBarn
BoozAllen
BorgWarner
BorrDrilling
BostonBeer
BostonOmaha
BostonProps
BostonSci
Bowhead
Bowlero
Box
BoydGaming
Brady
BraemarHtls
BrandywineRealty
BrasilAgro
Braskem
BreadFinancial
BridgeInvt
BrightHorizons
BrightScholar
BrightSphere
BrightSpire
BrightView
Brink's
BrinkerIntl
BristolMyers
BristolMyersRt
Bristow
BritishAmTob
BrixmorProp
BroadridgeFinl
Broadstone
BrookdaleSrLiving
BrookfieldAsset
BrookfieldBus
Brookfield
BrookfieldInfr
BrookfieldInfr
BrookfieldReinsur
BrookfieldReinsA1
BrookfieldRenew
Brown&Brown
Brown-Forman A
Brown-Forman B
Brunswick
Buckle
Buenaventura
Build-A-Bear
BuildersFirst
BungeGlobal
BurfordCapital
BurlingtonStrs
ButterflyNtwk
BylineBancorp
Tick
Sym Yld P/E
BYON ...
BIG
...
BBAI ...
BH.A ...
BH
...
BHVN ...
BIO
...
BIRK ...
BKH 4.6
BB
...
BLK 2.6
BKSY ...
BX 2.8
BXMT14.2
BLND ...
HRB 2.6
SQ
...
BE
...
OBDC 8.8
OWL 4.0
BXC ...
BA
...
BCC .6
BOOT ...
BAH 1.3
BWA ...
BORR .0
SAM ...
BOC ...
BXP 6.5
BSX ...
BOW ...
BOWL 1.8
BOX ...
BYD 1.3
BRC 1.4
BHR 7.2
BDN 13.0
LND 13.2
BAK ...
BFH 2.0
BRDG 6.2
BFAM ...
BEDU ...
BSIG .2
BRSP13.2
BV
...
BCO .9
EAT ...
BMY 5.8
CELG.RT .0
VTOL ...
BTI 9.4
BRX 4.8
BR 1.6
BNL 7.6
BKD ...
BAM 3.6
BBUC 1.2
BN
.7
BIPC 4.7
BIP 5.6
BNRE .0
BNRE.A .0
BEPC 4.5
BRO .6
BF.A 1.9
BF.B 1.9
BC 2.0
BKE 3.6
BVN ...
BBW 3.0
BLDR ...
BG 2.5
BUR 1.7
BURL ...
BFLY ...
BY 1.6
dd
dd
dd
48
49
dd
dd
98
14
dd
20
dd
42
cc
dd
11
83
dd
8
cc
19
dd
11
25
33
13
43
39
dd
50
63
...
23
37
10
17
dd
dd
10
dd
5
dd
74
...
14
dd
64
39
21
dd
...
cc
dd
24
34
16
dd
36
4
72
13
91
...
...
8
28
23
23
15
9
cc
8
14
9
10
40
dd
8
Last
Div
Chg. Amt.
15.13
3.48
1.50
980.00
198.99
35.10
286.86
57.00
56.45
2.79
772.03
1.09
120.50
17.44
2.75
49.64
64.08
16.32
16.86
17.99
102.89
177.61
137.29
118.93
152.21
35.66
6.89
313.67
14.61
60.67
75.57
26.80
12.45
27.25
53.32
68.27
2.79
4.61
4.80
7.19
41.76
7.74
105.12
2.30
22.17
6.05
13.81
103.24
70.63
41.09
.05
35.91
31.03
22.51
200.77
15.35
6.71
39.24
20.55
43.49
34.45
28.89
43.46
42.55
31.54
89.51
45.80
45.86
82.53
38.54
17.90
27.07
160.79
107.59
14.44
240.05
.99
23.10
–0.83 ...
+0.13 ...
–0.07 ...
–4.00 ...
+4.28 ...
–1.62 ...
–0.35 ...
+8.89 ...
+1.59 .65
–0.09 ...
–9.87 5.10
–0.04 ...
–3.14 .83
+0.10 .62
–0.32 ...
–1.01 .32
–2.26 ...
+0.03 ...
+0.26 .05
–1.28 .18
–1.56 ...
+3.09 ...
–3.82 .20
+5.68 ...
–6.30 .51
–0.03 ...
+0.05 .10
+52.92 ...
–0.23 ...
+1.36 .98
–0.06 ...
+1.10 ...
+0.31 .055
+1.98 ...
+1.56 .17
+0.08 .235
+0.01 .05
–0.01 .15
–0.11 .621
–0.19 ...
–0.12 .21
–0.16 .12
–2.50 ...
+0.29 ...
–0.39 .01
–0.05 .20
–0.41 ...
+1.93.2425
+4.31 ...
–0.15 .60
....0199
–0.28 ...
+0.41.7431
+0.76.2725
+0.23 .80
+0.25 .29
–0.04 ...
–0.98 .38
–0.07.0625
–1.29 .08
–1.09.405
–1.21.405
–1.19 .08
–2.21 .08
–0.83 .355
+0.15 .13
–0.09.2178
+0.10.2178
+3.06 .42
+1.81 .35
+0.03 ...
–3.27 .20
–10.31 ...
+3.82 .68
+0.19.0625
+39.68 ...
–0.02 ...
–0.18 .09
C
432.03 300.99 CACI Intl
96.93 29.05 CAVA
CACI ... 25 424.48 –4.54
CAVA ... cc 92.55 +9.62
...
...
30
BARRON’S
D ATA
For personal non-commercial use only. Do not edit or alter. Reproductions not permitted.
To reprint or license content, please contact Barron's reprints department at 800-843-0008 or www.djreprints.com
–52-Week–
High
Low
80.42
25.28
98.65
87.90
118.89
7.20
63.76
47.37
15.74
29.09
26.35
114.30
26.80
88.00
10.77
18.03
54.37
48.87
39.36
94.38
83.25
749.00
103.49
57.00
25.26
31.45
39.81
25.04
41.94
58.44
58.30
53.90
114.04
56.24
52.12
32.88
18.63
51.14
134.02
82.58
91.58
1.88
22.99
149.94
54.52
116.04
26.43
430.21
88.22
19.74
17.95
112.75
35.59
66.50
22.84
88.03
129.00
60.20
382.01
8.78
45.76
172.16
61.06
6.64
9.27
246.75
21.90
81.42
31.44
7.51
71.36
9.11
22.00
11.60
27.91
97.92
10.10
275.00
184.65
11.32
6.49
13.11
654.62
39.05
183.46
62.34
5.21
132.91
171.70
40.78
19.47
4.00
12.50
3260.00
136.02
275.41
41.11
108.68
63.24
365.71
20.40
64.98
49.15
19.90
64.63
60.94
93.07
3.34
49.87
37.19
9.77
22.06
15.72
56.03
22.20
47.38
5.07
15.63
35.50
20.23
24.15
60.50
52.77
332.94
63.73
32.91
16.29
18.80
19.13
17.40
17.99
38.49
43.50
26.76
82.81
29.17
37.94
16.18
9.80
34.35
103.96
52.66
68.92
0.92
15.93
88.23
32.95
83.07
19.05
218.76
59.66
10.84
9.77
46.65
18.06
41.98
14.82
62.08
14.32
31.80
214.01
4.56
34.04
105.15
12.22
4.65
5.67
171.65
14.69
60.83
25.42
4.47
46.74
6.45
14.70
5.30
22.90
58.01
1.21
161.65
109.48
8.23
1.64
3.51
492.84
15.10
141.05
43.64
2.77
83.80
139.62
14.69
11.42
1.61
7.83
1768.64
108.91
183.71
35.45
82.25
39.94
253.51
13.19
38.17
Name
CBIZ
CBL&Assoc
CBRE Group
CF Industries
CGI A
CI&T
CMS Energy
CNA Fin
CNH Indl
CNO Financial
CNX Resources
CONSOL Energy
COPTDefenseProp
CRH
CS Disco
CTO Realty
CTS
C3.ai
CVR Energy
CVR Partners
CVS Health
CableOne
Cabot
Cactus
Cadeler
CadenceBank
Cadre
CAE
Caleres
CaliforniaRscs
CalWtrSvc
Calix
CamdenProperty
Cameco
CampbellSoup
CampingWorld
CanadaGoose
CIBC
CanNtlRlwy
CanadianNatRscs
CdnPacKC
Cango
Cannae
CapitalOne
Capri
CardinalHealth
CareTrustREIT
Carlisle
CarMax
Carnival
Carnival
CarpenterTech
CarriageSvcs
CarrierGlobal
Cars.com
Carter's
Carvana
Catalent
Caterpillar
Cato
CedarFairRec
Celanese
Celestica
CementosPacasm
Cemex
Cencora
CenovusEnergy
Centene
CenterPointEner
CenterraGold
Centerspace
CentraisElBras
CentralPacFin
CentralPuerto
Centuri
CenturyComm
ChargePoint
CharlesRiverLabs
ChartIndustries
ChathamLodging
CheetahMobile
Chegg
Chemed
Chemours
CheniereEnergy
CheniereEnerPtrs
CherryHillMtg
ChesapeakeUtil
Chevron
Chewy
ChimeraInvt
ChinaGreenAg
ChinaYuchai
Chipotle
ChoiceHotels
Chubb
ChunghwaTel
Church&Dwight
Ciena
Cigna
Cinemark
Citigroup
June 3, 2024
NEW YORK STOCK EXCHANGE COMPOSITE LIST
Tick
Sym Yld P/E
CBZ ...
CBL 7.2
CBRE ...
CF 2.5
GIB
...
CINT ...
CMS 3.3
CNA 3.8
CNH 4.5
CNO 2.2
CNX ...
CEIX ...
CDP 4.8
CRH 1.7
LAW ...
CTO 8.6
CTS .3
AI
...
CVI 7.2
UAN 11.4
CVS 4.5
CABO 3.1
CBT 1.7
WHD .9
CDLR ...
CADE 3.5
CDRE 1.1
CAE ...
CAL .8
CRC 2.6
CWT 2.2
CALX ...
CPT 4.0
CCJ
...
CPB 3.3
CWH 2.5
GOOS ...
CM 5.1
CNI 1.9
CNQ 3.8
CP
.7
CANG ...
CNNE 2.6
COF 1.7
CPRI ...
CAH 2.0
CTRE 4.5
CSL .8
KMX ...
CCL ...
CUK ...
CRS .7
CSV 1.7
CARR 1.2
CARS ...
CRI 4.7
CVNA ...
CTLT ...
CAT 1.5
CATO11.3
FUN 2.8
CE 1.8
CLS ...
CPAC ...
CX
...
COR .9
CVE 1.5
CNC ...
CNP 2.6
CGAU 3.0
CSR 4.4
EBR .9
CPF 5.1
CEPU ...
CTRI ...
CCS 1.2
CHPT ...
CRL ...
GTLS ...
CLDT 3.3
CMCM ...
CHGG ...
CHE .3
CC 4.0
LNG 1.1
CQP 6.4
CHMI16.6
CPK 2.3
CVX 4.0
CHWY ...
CIM 11.1
CGA ...
CYD 3.3
CMG ...
CHH 1.0
CB 1.3
CHT 2.9
CHD 1.1
CIEN ...
CI
1.6
CNK ...
C
3.4
31
cc
27
13
19
24
19
10
6
8
5
6
dd
...
dd
36
31
dd
4
10
10
9
13
20
98
9
32
dd
7
14
20
cc
25
cc
17
dd
34
10
19
15
26
dd
dd
11
dd
44
50
27
23
59
53
42
13
44
13
11
40
dd
15
dd
18
8
21
10
52
25
12
14
21
27
dd
17
10
4
...
9
dd
24
cc
dd
dd
dd
30
dd
8
13
dd
24
15
cc
8
dd
8
67
24
12
26
34
31
28
12
18
Last
Div
Chg. Amt.
75.82
22.10
88.07
79.73
99.00
4.52
62.93
45.94
10.56
28.69
26.30
103.67
24.67
81.76
5.85
17.76
52.95
29.57
27.86
81.79
59.60
385.91
102.30
51.35
25.04
28.55
32.84
18.78
34.68
47.35
49.89
35.70
102.65
55.51
44.38
20.10
14.46
49.54
127.33
76.83
79.36
1.49
18.18
137.63
34.55
99.27
25.57
418.29
70.26
15.08
13.69
110.87
26.89
63.19
20.23
68.40
99.98
53.79
338.52
6.00
43.43
152.04
55.92
5.65
7.53
226.57
20.82
71.59
30.51
6.89
68.26
6.68
20.28
9.94
27.45
84.41
1.68
208.44
157.03
8.46
6.01
3.83
554.37
24.82
157.79
48.17
3.62
112.01
162.30
21.21
11.90
2.94
8.38
3129.52
113.19
270.82
39.61
107.01
48.17
344.62
17.27
62.31
–3.17 ...
+0.52 .40
+0.57 ...
+2.22 .50
–5.19 ...
–0.03 ...
+1.50 .515
+1.89 .44
–0.11 .47
+0.27 .16
+1.47 ...
+6.66 ...
+0.61 .295
–0.18 .35
–0.41 ...
+0.31 .38
+0.09 .04
+5.53 ...
–1.92 .50
–0.21 1.92
+4.06 .665
+32.78 2.95
+0.17 .43
+0.60 .12
+1.38 ...
+0.28 .25
–0.35.0875
+0.13 ...
–2.92 .07
+0.14 .31
–0.40 .28
+2.95 ...
–0.95 1.03
+2.52 ...
–0.96 .37
+0.90 .125
+0.48 ...
+1.00.6565
+0.42.6182
+0.22.3897
–0.47 .139
+0.02 ...
–0.96 .12
+0.01 .60
–0.08 ...
+2.88.5056
+0.19 .29
–9.63 .85
+0.38 ...
–0.05 ...
+0.02 ...
+1.28 .20
+0.17.1125
–2.46 .19
+1.58 ...
+2.49 .80
–9.17 ...
–1.03 ...
–10.38 1.30
–0.02 .17
–0.40 .30
–0.83 .70
–2.88 ...
+0.20 ...
–0.08 ...
+7.68 .51
+0.51 .131
–3.04 ...
+1.00 .20
–0.13.0522
+0.52 .75
–0.36.0783
–0.38 .26
+0.46 ...
+1.05 ...
+0.52 .26
–0.10 ...
–8.77 ...
+6.21 ...
–0.06 .07
+0.19 ...
+0.14 ...
–1.00 .40
–1.75 .25
+0.81 .435
–0.95 .035
–0.06 .15
+3.65 .64
+4.55 1.63
+4.64 ...
+0.20 .33
+0.15 ...
+0.10 .28
–22.11 ...
–2.23.2875
+6.06 .91
+0.281.4779
+0.54.2837
–1.17 ...
+12.01 1.40
–0.61 ...
–1.27 .53
–52-Week–
High
Low
37.30
3.69
6.71
28.01
86.58
10.03
15.25
218.72
2.06
27.75
21.89
53.74
29.63
30.83
22.97
6.86
169.14
116.00
4.10
63.76
104.38
6.05
78.58
67.94
95.59
10.48
57.39
352.45
59.81
55.64
5.20
36.72
17.14
3.38
2.12
8.91
8.25
4.03
17.74
25.07
4.68
39.78
13.39
35.60
1.60
138.47
135.18
98.85
274.87
23.20
3.71
15.05
14.50
22.74
121.20
62.15
27.95
34.66
27.16
16.24
37.28
41.44
319.94
18.89
58.81
17.51
16.06
29.89
13.46
23.77
21.26
25.19
150.01
63.89
13.68
13.51
180.21
14.22
26.10
119.50
96.35
47.81
120.31
5.99
304.25
286.24
11.83
7.53
60.09
Last
Div
Chg. Amt.
22.77
1.78
3.46
17.98
60.38
5.52
6.80
132.92
1.04
15.28
15.28
29.22
17.47
18.59
13.84
3.64
114.69
53.88
1.39
51.55
69.33
2.00
50.05
28.47
67.62
9.16
37.40
149.62
39.85
35.38
2.01
22.03
10.56
1.99
1.62
5.96
6.00
2.11
10.82
16.88
1.82
11.85
7.07
25.16
0.38
61.05
99.35
80.46
227.50
14.12
0.65
5.52
10.34
11.12
78.12
26.65
13.82
16.13
10.02
8.57
25.26
28.96
220.39
10.41
43.22
10.38
8.06
23.25
9.02
13.51
7.49
17.40
73.92
48.42
7.55
7.37
116.42
9.44
12.50
84.72
69.61
33.17
82.25
4.20
209.00
163.62
6.24
3.61
24.17
CitizensFin
Citizens
CityOfficeREIT
Civeo
CivitasRscs
Clarivate
ClarosMtg
CleanHarbors
ClearChannelOutdr
ClearSecure
ClearwaterAnalytic
ClearwaterPaper
ClearwayEnergyA
ClearwayEnergyC
Cleveland-Cliffs
ClipperRealty
Clorox
Cloudflare
CN Finance
Coca-Cola
Coca-Cola Femsa
CoeurMining
Cohen&Steers
Coherent
ColgatePalm
ColombierAcqnIIA
Comerica
ComfortSystems
CommercialMetals
CommunityFinSys
CommunityHlthSys
CommunityHlthcr
SABESP
EngGr-Cmg C
EngGr-Cmg
COPEL
COPEL
CiaSiderurgica
CerveceriasUnid
CompassDiversif
Compass
CompassMinerals
ComstockRscs
ConagraBrands
ConcordMed
Conmed
ConocoPhillips
ConEd
ConstBrands A
Constellium
ContainerStore
Volaris
Cool
Cooper-Standard
Copa
Core&Main
CoreLabs
CorebridgeFin
CoreCard
CoreCivic
Corning
Vesta
Corpay
CorpAmAirports
Corteva
Cosan
Costamare
CoterraEnergy
Coty
Coupang
Coursera
CousinsProperties
Crane
CraneNXT
CrawfordA
Crawford B
Credicorp
CrescentEnergy
CrossTimbers
CrownCastle
Crown Holdings
CubeSmart
Cullen/Frost
Culp
Cummins
Curtiss-Wright
Cushman&Wkfd
CustomTruck
CustomersBancorp
CFG 4.8
CIA
...
CIO 8.1
CVEO 4.1
CIVI 2.7
CLVT .0
CMTG14.2
CLH ...
CCO ...
YOU 2.4
CWAN ...
CLW ...
CWEN.A 5.0
CWEN 5.4
CLF
...
CLPR 9.7
CLX 3.6
NET ...
CNF ...
KO 3.1
KOF 2.4
CDE ...
CNS 3.4
COHR ...
CL 2.2
CLBR ...
CMA 5.5
FIX
.4
CMC 1.3
CBU 4.0
CYH ...
CHCT 7.8
SBS 1.6
CIG.C 8.1
CIG 10.0
ELP 4.0
ELPC .5
SID
...
CCU 1.8
CODI 4.4
COMP ...
CMP 4.6
CRK 4.3
CAG 4.7
CCM ...
CNMD 1.0
COP 2.0
ED 3.5
STZ 1.6
CSTM ...
TCS ...
VLRS ...
CLCO13.2
CPS ...
CPA 6.6
CNM ...
CLB .2
CRBG 3.2
CCRD ...
CXW ...
GLW 3.0
VTMX 1.7
CPAY ...
CAAP ...
CTVA 1.1
CSAN ...
CMRE 2.9
CTRA 2.8
COTY ...
CPNG ...
COUR ...
CUZ 5.5
CR
.5
CXT 1.0
CRD.A 3.1
CRD.B 3.3
BAP ...
CRGY 3.8
CRT 10.2
CCI 6.1
CCK 1.2
CUBE 4.8
CFR 3.6
CULP ...
CMI 2.4
CW
.3
CWK ...
CTOS ...
CUBI ...
13
6
dd
12
9
dd
dd
31
dd
30
dd
9
39
43
23
dd
68
dd
5
25
16
dd
27
dd
29
...
10
32
10
14
dd
38
13
7
6
2
10
cc
21
dd
dd
dd
53
15
dd
29
13
18
27
24
dd
8
5
dd
...
27
21
8
46
28
52
7
20
7
71
13
6
17
46
32
dd
48
40
20
20
19
10
dd
9
32
24
23
12
dd
21
29
cc
52
6
35.29
2.85
4.93
24.37
73.56
5.70
7.89
216.59
1.44
16.89
18.98
53.14
25.68
28.00
17.28
3.90
131.56
67.69
1.55
62.93
93.66
5.75
70.29
57.06
92.96
10.33
51.24
327.34
56.32
45.46
3.96
23.46
14.15
2.30
1.86
6.94
6.03
2.49
12.51
22.76
3.75
12.96
11.71
29.88
.50
76.44
116.48
94.55
250.23
21.67
.67
7.97
12.39
13.20
97.23
57.56
18.74
29.17
13.96
16.05
37.26
34.84
267.67
18.34
55.94
10.48
16.01
28.52
10.36
22.74
7.60
23.13
149.08
63.22
9.08
8.58
165.32
12.60
14.28
102.50
84.19
42.31
101.58
4.44
281.73
282.82
11.11
4.77
45.30
–0.06 .42
+0.02 ...
+0.16 .10
+0.19 .25
+1.65 1.00
–0.14 .00
+0.62 .25
–1.26 ...
+0.01 ...
+0.34 .10
–0.12 ...
+0.82 ...
+0.99.4102
+1.15.4102
+0.37 ...
+0.07 .095
+0.03 1.20
–6.50 ...
+0.05 ...
+0.93 .485
–1.441.6528
+0.31 ...
–0.85 .59
–2.61 ...
–0.34 .50
... ...
+0.47 .71
–14.98 .30
+0.48 .18
–1.01 .45
+0.38 ...
+0.79 .46
–0.44.2808
–0.16.0935
–0.11.7692
–0.27.1588
–0.36.0285
–0.11 ...
–0.36.1023
+0.67 .25
–0.33 ...
+0.44 .15
+0.90 .125
–0.40 .35
–0.17 ...
+2.37 .20
–0.77 .20
+0.12 .83
+1.72 1.01
+0.02 ...
–0.06 ...
+0.12 ...
–0.74 .41
–0.30 ...
–3.42 1.61
–2.59 ...
+0.82 .01
–1.45 .23
+0.67 ...
+0.51 ...
+0.98 .28
–1.01.1444
–0.26 ...
+0.44 ...
+0.43 .16
–0.31 ...
+0.94 .115
+1.39 .21
–0.19 ...
+0.39 ...
–0.09 ...
+0.22 .32
+2.01 .205
+1.64 .16
–0.43 .07
–1.00 .07
+0.19 ...
+0.23 .12
+0.56.0583
+4.381.565
+0.52 .25
+0.21 .51
–0.73 .92
... ...
–3.18 1.68
+2.11 .21
+0.32 ...
+0.18 ...
+0.13 ...
1.95
7.60
9.24
6.48
90.14
46.36
0.57
14.79
11.10
182.09
60.06
DHI Group
DHT
DNOW
DRDGOLD
DTE Energy
DT Midstream
D-WaveQuantum
DXC Tech
Dana
Danaher
Danaos
DHX ...
DHT 8.7
DNOW ...
DRD 4.0
DTE 3.5
DTM 4.2
QBTS ...
DXC ...
DAN 2.8
DHR .4
DAC 3.3
61
12
7
10
19
16
dd
43
cc
44
3
2.07
12.10
14.59
8.47
116.53
67.08
1.35
15.55
14.06
256.80
96.77
–0.08 ...
–0.11 .29
+0.41 ...
–0.33.1058
+3.57 1.02
+0.71 .735
+0.13 ...
–0.08 ...
+0.06 .10
–5.98 .27
+6.18 .80
Name
Tick
Sym Yld P/E
D
4.22
12.80
15.58
12.75
117.45
67.38
3.20
28.89
19.75
268.98
96.92
–52-Week–
High
Low
3.49
43.66
176.84
71.60
147.93
75.53
1095.48
450.00
58.81
33.60
179.70
53.86
24.00
13.44
2.30
15.63
105.00
17.95
55.09
179.78
17.32
9.99
4.16
229.56
45.15
154.18
20.99
51.69
476.48
65.49
3.37
131.65
123.74
26.00
91.02
14.01
173.47
9.44
54.74
542.75
75.98
66.21
51.66
43.00
35.39
3.16
16.12
188.64
60.69
36.29
77.72
44.38
30.93
14.46
60.00
104.60
12.62
82.63
38.41
186.47
4.24
61.41
13.56
0.60
17.30
133.36
38.97
71.51
49.05
472.48
353.15
36.50
21.68
45.16
30.60
15.79
6.30
0.46
6.09
8.25
9.82
40.47
131.43
11.02
7.33
2.81
100.98
16.50
100.30
12.33
19.39
286.39
37.19
1.07
79.04
78.73
10.54
75.87
10.55
101.09
3.86
39.18
291.28
57.05
41.98
22.62
17.74
21.35
1.04
10.76
127.25
47.26
19.71
56.04
18.29
17.80
7.49
41.94
83.06
8.68
61.14
22.67
78.42
2.27
43.29
9.57
Name
DanimerScientific
DaqoNewEnergy
Darden
DarlingIngred
DaVita
Dayforce
DeckersOutdoor
Deere
DelekLogistics
DelekUS
DellTechC
DeltaAir
Deluxe
DesignerBrands
DesktopMetal
Despegar.com
DestinyTech100
DeutscheBank
DevonEnergy
Diageo
DiamondOffshore
Diamondrock
DianaShipping
Dick's
DieboldNixdorf
DigitalRealty
DigitalBridge
DigitalOcean
Dillard's
DineBrands
Dingdong
DiscoverFinSvcs
Disney
DiversifiedEnergy
DolbyLab
Dole
DollarGeneral
Doma
DominionEner
Domino's
Donaldson
DonnelleyFin
DorianLPG
DoubleVerify
DouglasDynamics
DouglasElliman
DouglasEmmett
Dover
Dow
Doximity
DrReddy'sLab
DreamFinders
Dril-Quip
DuckhornPtf
Ducommun
DukeEnergy
Dun&Bradstreet
DuPont
DutchBros
DycomInds
DynagasLNG
Dynatrace
DynexCapital
Tick
Sym Yld P/E
DNMR ...
DQ
...
DRI 3.5
DAR ...
DVA ...
DAY ...
DECK ...
DE 1.6
DKL 10.8
DK 3.9
DELL ...
DAL .8
DLX 5.3
DBI 2.0
DM
...
DESP ...
DXYZ ...
DB 1.9
DVN 4.2
DEO 3.0
DO
...
DRH 1.4
DSX 10.0
DKS 1.9
DBD ...
DLR 3.4
DBRG .3
DOCN ...
DDS .2
DIN 5.2
DDL ...
DFS 2.3
DIS
.7
DEC 12.8
DLB 1.5
DOLE 2.6
DG 1.7
DOMA ...
D
5.0
DPZ 1.2
DCI 1.4
DFIN ...
LPG .0
DV
...
PLOW 4.7
DOUG ...
DEI 5.4
DOV 1.1
DOW 4.9
DOCS ...
RDY .6
DFH ...
DRQ ...
NAPA ...
DCO ...
DUK 4.0
DNB 2.1
DD 1.9
BROS ...
DY
...
DLNG ...
DT
...
DX 12.7
dd
11
18
12
17
cc
37
11
14
dd
29
7
29
27
dd
cc
dd
7
9
19
dd
24
13
19
1
41
8
72
10
7
dd
14
cc
1
41
6
20
dd
28
33
24
19
7
48
21
dd
dd
18
34
38
17
10
dd
14
49
25
dd
cc
cc
23
4
88
11
Last
Div
Chg. Amt.
.78
22.52
150.39
40.40
147.12
49.46
1093.92
374.76
39.62
25.46
139.56
51.02
22.73
10.05
.56
15.10
14.87
16.68
49.08
135.09
15.18
8.47
2.99
227.64
43.75
145.34
13.64
37.05
447.35
39.45
2.08
122.66
103.91
15.18
81.01
12.37
136.91
5.87
53.92
508.58
73.68
60.96
50.61
18.20
24.86
1.14
13.95
183.82
57.63
27.73
68.68
28.41
19.34
8.07
58.18
103.57
9.59
82.16
35.39
179.96
4.08
45.73
12.25
+0.10 ...
+2.13 ...
+2.79 1.31
–0.40 ...
+8.58 ...
–6.70 ...
+61.02 ...
–0.20 1.47
–0.13 1.07
–1.99 .25
–20.62 ...
–0.82 .10
+0.30 .30
+0.38 .05
... ...
+0.10 ...
–0.21 ...
–0.37 .486
+0.93 .13
–1.72 1.62
+0.70 ...
–0.01 .03
–0.16 .075
+37.67 1.10
–0.85 ...
+2.57 1.22
+0.68 .01
+0.86 ...
+0.65 .25
+0.25 .51
–0.05 ...
–0.56 .70
+2.15 .45
+0.91 .29
+1.30 .30
+0.06 .08
–8.32 .59
–0.16 ...
+1.13.6675
+6.42 1.51
–0.51 .25
–0.67 ...
+2.54 1.00
–0.56 ...
–0.40 .295
–0.06 ...
+0.58 .19
–0.36 .51
–0.13 .70
–0.10 ...
–0.85.4877
+0.16 ...
+1.21 ...
+0.02 ...
–0.29 ...
+1.401.025
–0.44 .05
+1.04 .38
+1.29 ...
+0.23 ...
+0.10 ...
–1.20 ...
+0.05 .13
Last
Div
Chg. Amt.
6.01
35.43
9.71
31.03
57.55
26.62
17.65
1.42
2.68
3.94
26.92
12.46
1.05
24.58
83.27
7.52
7.12
18.88
35.30
43.04
10.30
103.52
87.10
25.61
1.33
33.12
5.64
17.64
0.25
0.99
159.95
24.44
24.65
8.45
21.79
17.93
59.82
52.57
1.32
10.12
11.35
44.21
20.49
32.07
203.85
102.22
25.33
14.10
4.72
4.83
109.83
10.61
331.08
6.37
52.03
31.56
20.54
13.38
107.03
14.33
101.19
95.77
EmpireStateRealty
EmployersHldgs
EmpresaDisCom
Enbridge
EncompassHealth
Endava
Endeavor
EndeavourSilver
EnelChile
Enerflex
Energizer
EnergyTransfer
EnergyVault
EnerpacTool
EnerSys
Enfusion
Enhabit
Ennis
EnovaIntl
Enovis
EnphysAcqnA
Enpro
Entergy
EnterpriseProd
Entravision
Envestnet
Enviri
Envista
Enviva
EnzoBiochem
Equifax
Equinor
Equitable
EquitransMdstm
EquityBcshs
EquityCommnwlth
EquityLife
EquityResdntl
EquusTotReturn
ErmenegildoZegna
EroCopper
EssentGroup
EssentialProp
EssentialUtil
EssexProp
EsteeLauder
EthanAllen
Euronav
EveHolding
Eventbrite
EvercoreA
EverestConsolA
Everest
Everi
EversourceEner
Evertec
EvolentHealth
ExcelerateEner
ExpeditorsIntl
Expro
ExtraSpaceSt
ExxonMobil
ESRT 1.5
EIG 2.8
EDN ...
ENB 7.5
EHC .7
DAVA ...
EDR .9
EXK ...
ENIC 7.9
EFXT 1.4
ENR 4.2
ET 8.1
NRGV ...
EPAC .1
ENS .8
ENFN ...
EHAB ...
EBF 4.8
ENVA ...
ENOV ...
NFYS ...
NPO .8
ETR 4.0
EPD 7.2
EVC 9.3
ENV ...
NVRI ...
NVST ...
EVA ...
ENZ ...
EFX .7
EQNR 3.5
EQH 2.3
ETRN 4.2
EQBK 1.4
EQC ...
ELS 3.0
EQR 4.2
EQS ...
ZGN .9
ERO ...
ESNT 2.0
EPRT 4.3
WTRG 3.3
ESS 3.8
EL
2.1
ETD 5.4
EURN 6.4
EVEX ...
EB
...
EVR 1.6
MNTN ...
EG 2.0
EVRI ...
ES 4.8
EVTC .6
EVH ...
EE
.6
EXPD 1.2
XPRO ...
EXR 4.5
XOM 3.2
32
9
dd
19
23
30
42
dd
6
dd
24
14
dd
31
17
cc
dd
13
11
dd
32
dd
11
11
dd
dd
dd
dd
dd
dd
52
9
13
16
56
25
34
27
2
24
33
9
22
18
32
69
11
3
dd
dd
32
dd
6
11
dd
35
dd
24
26
dd
33
14
9.53
42.18
18.16
36.58
86.39
26.94
26.83
3.97
2.94
5.20
28.62
15.67
1.31
39.32
107.84
9.41
9.19
21.03
61.65
50.27
10.92
153.26
112.49
28.50
2.16
65.51
8.85
19.36
.57
1.19
231.39
29.14
41.49
14.28
33.70
19.31
62.77
65.03
1.44
12.32
21.30
56.70
26.78
37.73
259.79
123.36
29.11
16.91
4.93
4.98
202.94
11.26
390.93
7.23
59.23
34.97
21.19
17.81
120.90
21.95
144.77
117.26
+0.50 .035
+0.86 .30
+2.09 ...
+0.34.6731
+1.90 .15
–3.09 ...
+0.06 .06
+0.21 ...
–0.09.2093
+0.10.0184
–0.20 .30
+0.23.3175
+0.14 ...
+1.08 .04
+0.66 .225
+0.02 ...
+0.35 ...
+0.20 .25
+1.75 ...
+0.03 ...
+0.01 ...
+5.31 .30
+3.35 1.13
+0.29 .515
+0.06 .05
–3.58 ...
+0.33 ...
+1.11 ...
–0.03 ...
+0.12 ...
–8.63 .39
+0.80 .35
+0.50 .24
+0.32 .15
–0.15 .12
+0.06 ...
+0.92.4775
–0.67 .675
–0.06 ...
–0.30 .109
–1.48 ...
+0.51 .28
–0.16 .285
+0.50.3071
+0.39 2.45
–2.70 .66
+0.42 .39
+0.72 .57
–0.85 ...
–0.01 ...
–1.48 .80
–0.01 ...
–0.852.00
+0.56 ...
+1.70 .715
–0.31 .05
–2.09 ...
+0.65 .025
+2.94 .73
+0.28 ...
+2.19 1.62
+3.84 .95
20.41
26.71
4.37
49.49
10.24
1.21
18.31
171.81
108.54
385.28
745.45
9.96
7.82
137.17
85.59
55.48
30.23
218.32
143.89
285.02
11.55
33.61
46.91
0.45
4.00
49.55
11.69
22.96
11.16
3.69
10.08
40.44
4.17
32.18
0.65
109.12
2.13
F&GAnnuities
FB Financial
Figs
FMC
FNB
FreyrBattery
FS KKR Cap
FTI Consulting
Fabrinet
FactSet
FairIsaac
FarmlandPtrs
Fastly
FedAgriMtg C
FederalRealty
FederalSignal
FederatedHermes
FedEx
Ferguson
Ferrari
FidelisInsurance
FidNatlFinl
FidNatlInfo
FinanceofAm
FinVolution
FirstAmerFin
FirstBanCorp
FirstBancshares
FirstCmwlthFin
FirstFoundation
FirstHorizon
FirstIndRlty
FirstMajSilver
FirstEnergy
FiscalNote
Fiserv
FivePoint
FG 2.1
FBK 1.8
FIGS ...
FMC 3.8
FNB 3.5
FREY ...
FSK 12.5
FCN ...
FN
...
FDS 1.0
FICO ...
FPI 2.2
FSLY ...
AGM 3.2
FRT 4.3
FSS .5
FHI 3.7
FDX 2.0
FERG 1.5
RACE ...
FIHL 2.4
FNF 3.8
FIS 1.9
FOA ...
FINV ...
FAF 3.8
FBP 3.6
FBMS 3.9
FCF 3.8
FFWM .7
FHN 3.8
FR
3.1
AG
.2
FE 4.2
NOTE ...
FI
...
FPH ...
21
16
44
7
11
dd
9
25
32
32
68
24
dd
11
36
31
9
17
24
52
4
17
dd
dd
4
27
10
10
8
dd
11
22
dd
22
dd
28
7
40.41
37.00
5.30
60.95
13.77
2.40
20.50
214.80
239.53
404.26
1289.93
10.86
7.84
174.67
100.95
92.02
33.17
253.96
205.74
411.00
16.58
50.36
75.88
.58
4.78
55.58
17.73
25.35
13.51
5.92
15.84
47.12
7.16
40.26
1.28
149.76
3.26
–0.24 .21
–0.34 .17
+0.10 ...
–0.81 .58
–0.02 .12
–0.18 ...
+0.39 .05
–5.98 ...
–6.54 ...
–31.78 1.04
–94.71 ...
–0.07 .06
–0.64 ...
–1.09 1.40
+2.89 1.09
+5.27 .12
+0.63 1.00
+6.37 1.26
–2.54 .79
–5.16 ...
+0.34 .10
–0.39 .48
–1.91 .36
–0.07 ...
–0.02 ...
+0.68 .53
–0.25 .16
+0.33 .25
–0.09 .13
... .01
+0.03 .15
+0.97 .37
–0.01.0037
+1.29 .425
–0.14 ...
–0.58 ...
+0.09 ...
Name
Tick
Sym Yld P/E
F
E
221.83
401.98
34.30
139.67
317.50
49.10
45.23
114.77
118.60
2.12
6.90
276.61
15.21
188.85
102.71
6.34
345.19
236.00
13.14
12.35
43.90
77.02
96.12
17.84
136.06
16.70
25.81
550.34
14.21
17.19
14.91
19.61
31.12
7.05
4.28
9.96
116.76
–52-Week–
High
Low
10.32
46.78
21.80
38.37
87.94
81.06
27.01
4.20
3.90
8.36
37.32
16.40
3.55
39.46
113.34
11.56
14.59
23.17
65.00
66.14
11.04
170.64
114.28
29.99
4.91
73.04
10.01
36.14
14.17
2.27
275.10
34.73
41.64
14.60
34.99
21.49
74.04
69.45
1.95
16.36
24.38
59.90
27.70
43.26
269.23
204.41
36.20
21.26
11.05
11.91
206.32
11.91
417.92
16.08
74.81
42.21
35.00
22.42
131.17
25.04
164.99
123.75
B A R R ON S .C OM / D ATA
88.47
166.33
27.48
106.34
174.22
39.66
32.07
61.09
91.24
0.61
2.15
145.03
10.27
154.75
68.89
3.33
181.30
156.72
9.57
8.26
33.71
58.82
60.57
8.52
57.38
8.30
17.57
412.00
10.88
12.44
8.63
11.49
12.48
3.65
1.54
1.42
80.69
elfBeauty
EMCOR
ENI
EOG Rscs
EPAM Systems
EPR Prop
EQT
ESAB
ESCO Tech
ESSTech
E2open
EagleMaterials
EasterlyGovtProp
EastGroup
EastmanChem
EastmanKodak
Eaton
Ecolab
Ecopetrol
Ecovyst
EdgewellPersonal
EdisonIntl
EdwardsLife
ElancoAnimal
Elastic
EldoradoGold
ElementSolns
ElevanceHealth
EllingtonFin
ElmeComms
EmbotellAndinaA
EmbotellAndinaB
Embraer
EmeraldHldg
Emeren
EmergentBiosol
EmersonElec
ELF
...
EME .3
E
...
EOG 2.9
EPAM ...
EPR 8.3
EQT 1.5
ESAB .3
ESE .3
GWH ...
ETWO ...
EXP .4
DEA 9.0
EGP 3.1
EMN 3.2
KODK ...
ETN 1.1
ECL 1.0
EC 24.8
ECVT ...
EPC 1.6
EIX 4.1
EW
...
ELAN ...
ESTC ...
EGO ...
ESI 1.3
ELV 1.2
EFC 12.9
ELME 4.7
AKO.A 4.5
AKO.B 3.7
ERJ ...
EEX ...
SOL ...
EBS ...
EMR 1.9
84
26
13
10
24
20
30
27
29
dd
dd
17
61
36
13
9
39
43
6
15
16
34
37
dd
cc
28
45
20
19
dd
10
13
19
dd
dd
dd
cc
186.91
388.66
31.53
124.55
177.93
41.04
41.09
102.82
109.13
.75
4.66
232.39
11.84
165.18
101.33
5.34
332.85
232.20
12.30
9.30
38.58
76.85
86.89
17.68
104.05
16.17
24.03
538.48
12.12
15.41
14.55
19.43
27.79
5.70
1.71
5.70
112.16
–4.51 ...
–10.03 .25
+0.38 ...
+1.28 .91
–2.18 ...
+0.42 .285
+0.94.1575
–0.87 .08
–0.69 .08
–0.02 ...
–0.22 ...
–5.88 .25
+0.17 .265
+4.68 1.27
+1.10 .81
+0.21 ...
–8.04 .94
–2.11 .57
+0.38.1479
... ...
–0.37 .15
+2.28 .78
–1.09 ...
+0.89 ...
–0.90 ...
+0.58 ...
–0.32 .08
+17.07 1.63
+0.11 .13
–0.30 .18
+0.50.1302
+0.94.1433
–1.33 ...
–0.29 ...
–0.24 ...
+0.94 ...
–1.26 .525
48.71
41.00
8.84
111.95
14.39
10.10
20.99
232.15
250.38
488.64
1451.78
13.27
25.87
199.40
107.61
92.03
38.93
291.27
224.86
442.80
20.53
53.96
78.73
2.09
6.05
65.55
18.62
32.06
15.90
11.47
16.28
55.23
8.44
40.65
4.51
159.99
3.74
–52-Week–
High
Low
34.49
33.33
135.67
5.70
26.33
50.49
43.43
226.40
143.43
35.60
15.42
40.92
4.02
43.84
87.10
6.36
84.92
28.73
27.60
11.82
151.63
14.70
48.76
30.32
55.24
27.72
28.55
29.39
3.87
9.68
84.31
10.31
Last
Div
Chg. Amt.
18.83
24.16
76.30
2.64
19.64
33.67
27.03
148.00
99.24
14.84
9.63
20.35
1.52
36.30
63.05
2.58
54.10
17.45
20.51
7.49
102.29
11.99
32.19
21.88
32.83
16.37
21.41
13.35
1.20
5.70
62.62
4.26
FiverrIntl
FlexLNG
Floor&Decor
FlotekIndustries
FlowersFoods
Flowserve
Fluor
FlutterEnt
FomentoEconMex
FootLocker
FordMotor
Forestar
ForgeGlobal
Fortis
Fortive
FortunaSilver
FortuneBrands
ForumEnergyTech
FourCornersProp
FourSeasonsEduc
Franco-Nevada
FrankBSPRealty
FranklinCovey
FranklinRscs
FreeportMcM
FreseniusMedCare
FreshDelMonte
Frontline
fuboTV
FullTruck
FullerHB
FutureFuel
FVRR ...
FLNG10.4
FND ...
FTK ...
FLO 4.1
FLS 1.7
FLR ...
FLUT ...
FMX 1.4
FL
.0
F
4.9
FOR ...
FRGE ...
FTS 4.4
FTV .4
FSM ...
FBIN 1.4
FET ...
FCPT 5.7
FEDU ...
FNV 1.2
FBRT 11.1
FC
...
BEN 5.3
FCX 1.1
FMS 2.1
FDP 3.9
FRO 7.4
FUBO ...
YMM 1.4
FUL 1.1
FF 5.6
cc
11
56
86
39
28
26
...
34
dd
13
8
dd
17
29
dd
21
dd
23
dd
dd
10
30
14
46
24
dd
10
dd
28
29
9
25.23
28.74
116.86
4.26
23.22
49.70
43.40
192.09
114.62
27.73
12.13
34.01
1.58
39.99
74.44
6.24
70.06
18.24
24.41
10.64
123.80
12.74
37.00
23.60
52.73
21.27
23.36
28.32
1.25
8.84
79.63
4.28
+0.57 ...
–0.69 .75
+2.82 ...
+0.66 ...
–0.21 .24
+0.19 .21
+1.44 ...
–12.02 ...
–2.13.4657
+5.66 .40
–0.03 .15
+0.38 ...
–0.13 ...
+0.09.4382
–1.45 .08
+0.16 ...
–0.17 .24
–0.10 ...
+0.30 .345
–0.16 ...
+1.79 .36
+0.10 .355
–0.45 ...
+0.27 .31
+1.20 .075
+0.02.6342
+0.10 .25
–0.23 .62
... ...
–0.11.1264
+0.23.2225
–0.37 .06
97.21
3.80
81.86
6.94
115.00
26.87
56.58
33.67
48.09
202.35
9.95
1.66
2.22
8.20
99.61
323.61
10.68
3.51
12.65
79.86
206.33
60.33
26.30
17.31
8.05
12.95
4.62
29.41
126.35
4.83
8.05
3.40
0.14
3.39
25.90
26.99
0.51
26.84
1.25
58.88
4.01
4.49
26.25
25.70
7.98
6.52
27.07
95.12
16.80
157.57
38.95
43.39
69.18
10.31
13.20
289.36
24.33
69.78
1.18
11.16
551.36
654.65
33.74
2.86
5.20
20.07
5.44
5.90
GATX
GCT Semiconductor
GE Aerospace
GEO Group
GE Vernova
GFLEnvironmental
GMS
GSK
GXO Logistics
Gallagher
GameStop
Gannett
GaotuTechedu
Gap
Garmin
Gartner
GatesIndustrial
GatosSilver
GencoShipping
Generac
GeneralDynamics
GeneralMills
GeneralMotors
Genesco
GenesisEnergy
GenieEnergy
GeniusSports
Genpact
GenuineParts
GenworthFin
GeoPark
Gerdau
Getaround
GettyImages
GettyRealty
Gildan
GinkgoBioworks
GlacierBancorp
Glatfelter
Glaukos
GlobalBlue
GlblBusTravel
GlobalIndemnity
GlobalIndl
GlobalMedREIT
GlobalNetLease
GlobalPtrs
GlobalPayments
GlobalShipLease
Globant
GlobeLife
GlobusMedical
GoDaddy
GoldFields
GoldmanSachsBDC
GoldmanSachs
Gorman-Rupp
Graco
GrafTechIntl
Graham
GrahamHoldings
Grainger
GraniteConstr
GranitePointMtg
GraniteRidge
GraphicPkg
GrayTelevision
GrayTelevision A
GATX 1.7
GCTS ...
GE
.7
GEO ...
GEV ...
GFL .2
GMS ...
GSK 3.1
GXO ...
AJG .9
GME ...
GCI
...
GOTU ...
GPS 2.1
GRMN 1.8
IT
...
GTES ...
GATO ...
GNK 7.5
GNRC ...
GD 1.9
GIS 3.4
GM
.9
GCO ...
GEL 4.8
GNE 2.0
GENI ...
G
1.8
GPC 2.8
GNW ...
GPRK 5.6
GGB .7
GETR ...
GETY ...
GTY 6.5
GIL 2.1
DNA ...
GBCI 3.5
GLT ...
GKOS ...
GB
...
GBTG ...
GBLI 4.4
GIC 2.9
GMRE 9.0
GNL 14.7
GLP 5.9
GPN 1.0
GSL 5.0
GLOB ...
GL 1.2
GMED ...
GDDY ...
GFI 2.0
GSBD11.7
GS 2.4
GRC 2.1
GGG 1.3
EAF ...
GHM ...
GHC .9
GWW .9
GVA .8
GPMT23.8
GRNT 6.7
GPK 1.4
GTN 5.1
GTN.A 4.0
20
dd
54
22
...
cc
13
16
36
51
cc
dd
dd
16
23
42
19
59
cc
41
24
16
6
dd
36
30
dd
9
16
34
5
6
dd
51
24
13
dd
21
dd
dd
39
dd
13
19
41
dd
18
20
3
42
8
cc
12
20
8
18
25
28
dd
cc
12
25
cc
dd
14
13
dd
dd
137.96
4.54
165.14
14.54
175.90
31.47
93.96
44.77
50.23
253.33
23.14
3.76
5.70
28.96
163.85
419.67
17.42
12.40
22.52
147.21
299.77
68.75
44.99
28.50
12.52
15.26
5.24
33.06
144.14
6.29
10.44
3.46
.17
3.59
27.61
38.27
.53
37.38
1.62
112.72
4.70
6.07
31.89
34.61
9.29
7.48
48.33
101.85
29.91
161.12
82.76
67.11
139.63
15.75
15.38
456.52
34.54
80.75
1.65
27.05
752.43
921.46
62.29
3.15
6.55
28.32
6.24
7.97
+1.40 .58
–1.26 ...
–2.19 .08
+0.62 ...
–1.53 ...
+0.41 .014
–1.30 ...
–0.35.3762
+0.96 ...
+1.27 .60
+4.14 ...
+0.05 ...
–0.53 ...
+7.98 .15
+0.04 .75
–19.37 ...
–0.26 ...
+0.52 ...
+0.41 .42
–1.45 ...
+0.15 1.42
+0.45 .59
+0.88 .12
+1.97 ...
–0.18 .15
–0.25 .075
+0.01 ...
–0.45.1525
–1.08 1.00
+0.02 ...
+0.49 .147
–0.14 .055
–0.01 ...
+0.18 ...
+0.29 .45
+0.65 .205
–0.13 ...
–0.34 .33
–0.19 ...
+3.83 ...
–0.20 ...
+0.24 ...
+0.05 .35
–0.85 .25
+0.39 .21
+0.05 .275
+4.23 .71
–0.91 .25
+1.27 .375
–5.37 ...
+1.02 .24
+1.29 ...
–0.51 ...
–0.30.1717
+0.19 .45
–4.66 2.75
+1.26 .18
–0.73 .255
–0.13 ...
–2.39 ...
+4.37 1.72
–44.94 2.05
–0.14 .13
+0.08 .15
–0.02 .11
+0.33 .10
+0.60 .08
+0.23 .08
Name
Tick
Sym Yld P/E
G
141.24
56.00
170.80
16.31
182.78
39.06
101.04
45.93
67.57
259.35
64.83
3.93
8.44
29.08
171.64
486.54
17.99
13.30
23.43
156.95
301.48
85.84
46.17
37.89
13.42
30.90
8.45
39.75
170.57
6.93
10.95
5.13
0.70
7.35
35.56
38.87
2.55
44.06
3.71
115.10
6.35
8.05
37.00
46.97
11.59
11.58
49.50
141.78
30.00
251.50
132.00
67.52
141.27
18.97
15.94
471.48
40.00
94.77
5.32
34.73
778.84
1034.18
64.33
6.41
8.14
29.50
10.69
11.00
June 3, 2024
BARRON’S
NEW YORK STOCK EXCHANGE COMPOSITE LIST
D ATA
–52-Week–
High
Low
7.20
61.62
21.37
58.00
12.49
6.78
82.27
76.00
17.48
77.99
11.13
323.95
3.81
197.31
357.90
2.71
7.84
5.41
35.00
33.50
125.35
16.00
165.19
3.11
37.31
7.30
28.33
4.68
2.63
61.10
59.84
14.49
32.49
4.49
222.08
1.37
107.25
165.00
2.10
1.76
2.10
24.58
17.92
68.45
9.59
93.67
Name
GreatAjax
GreenBrickPtrs
GreenDot
Greenbrier
GreenfireResources
GreenTree
Greif B
Greif A
GreystoneHousing
Griffon
Grindr
Group1Auto
GroveCollab
GpoAeroportuar
GpoAeroportSur
GpoAvalAcc
GpoSupervielle
GrupoTelevisa
GuarantyBcshrs
Guess
Guidewire
GuildHldgs
GulfportEnergy
Tick
Sym Yld P/E
AJX 7.1
GRBK ...
GDOT ...
GBX 2.2
GFR ...
GHG ...
GEF.B 4.8
GEF 3.2
GHI 9.8
GFF .9
GRND ...
GPI
.6
GROV ...
PAC 4.0
ASR 1.7
AVAL 5.5
SUPV ...
TV
...
GNTY 3.3
GES 5.2
GWRE ...
GHLD .0
GPOR ...
dd
8
dd
16
dd
...
8
11
8
18
dd
7
dd
17
16
27
5
dd
12
7
dd
36
4
Last
Div
Chg. Amt.
3.39
54.60
9.91
55.25
6.01
2.63
65.25
64.94
15.10
67.54
9.50
310.98
1.61
188.66
335.59
2.37
7.24
3.33
29.16
23.27
113.92
14.53
161.81
+0.06 .06
–0.44 ...
–0.12 ...
+3.73 .30
+0.03 ...
–0.22 ...
+0.27 .78
+0.39 .52
+0.11 .07
+0.06 .15
+0.13 ...
+2.90 .47
+0.02 ...
–4.001.943
–1.455.727
–0.08.0084
+0.76 ...
+0.19 ...
–0.31 .24
–1.09 .30
–7.00 ...
+0.28 .50
+3.59 ...
–52-Week–
High
Low
NYSE Cumulative Daily Breadth vs DJIA
On the Rise: NYSE Composite breadth rose for the fifth time in six
weeks even as the S&P 500 fell 0.5% last week amid weakness in the
tech sector. Winning stocks narrowly outpaced losers.
Breadth
For personal non-commercial use only. Do not edit or alter. Reproductions not permitted.
To reprint or license content, please contact Barron's reprints department at 800-843-0008 or www.djreprints.com
DJIA
615,000
40,150
Breadth 612,532
607,600
37,050
592,800
35,500
585,400
33,950
578,000
32,400
J
215.96
48.84
52.16
42.00
25.57
25.22
35.30
2.15
70.74
4.50
7.52
7.70
30.04
9.21
12.44
3.54
13.22
103.83
25.43
3.41
68.82
25.14
26.10
8.74
10.16
9.80
12.77
15.24
3.33
155.42
124.33
37.50
6.60
31.92
6.68
100.17
14.05
3.73
178.82
129.05
27.57
14.47
58.81
17.06
37.19
26.78
33.14
136.76
4.30
5.65
6.65
8.69
2.99
19.61
274.26
29.05
27.81
28.51
100.08
87.90
65.22
59.00
42.94
248.37
407.23
3.94
4.05
298.61
199.11
22.14
96.77
0.52
38.50
HCA Healthcare
HCI Group
HDFC Bank
HF Sinclair
HNI
HP
HSBC
HUYA
Haemonetics
Hafnia
Hagerty
Haleon
Halliburton
HamiltonBeach
HamiltonIns
Hanesbrands
HannonArmstrong
HanoverIns
HarleyDavidson
HarmonyGold
HartfordFinl
HavertyFurn
HavertyFurn A
HawaiianElec
HaymakerAcqnCorp.4
Hayward
HealthcareRealty
HealthpeakProp
HeclaMining
Heico
Heico A
HeliosTech
HelixEnergy
Helm&Payne
Herbalife
HercHoldings
HerculesCapital
HeritageInsurance
Hershey
Hess
HessMidstream
HewlettPackard
Hexcel
HighwoodsProp
Hillenbrand
Hilltop
HiltonGrandVac
Hilton
HimalayaShipping
Hims&HersHealth
Hippo
HireRight
Holley
HomeBancShares
HomeDepot
HondaMotor
HoraceMann
HormelFoods
DR Horton
HoulihanLokey
Hovnanian
HowardHughes
HowmetAerospace
Hubbell
HubSpot
HudbayMinerals
HudsonPacProp
Humana
HuntingIngalls
Huntsman
HyattHotels
Hyliion
HysterYaleMatls
HCA .8
HCI 1.7
HDB 1.0
DINO 3.6
HNI 2.8
HPQ 3.0
HSBC 6.8
HUYA .0
HAE ...
HAFN15.4
HGTY ...
HLN 1.8
HAL 1.9
HBB 2.4
HG
...
HBI
...
HASI 5.0
THG 2.6
HOG 1.9
HMY 1.0
HIG 1.8
HVT 4.5
HVT.A 4.3
HE
.0
HYAC ...
HAYW ...
HR 7.6
DOC 6.0
HL
.3
HEI
.1
HEI.A .1
HLIO .7
HLX ...
HP 2.6
HLF ...
HRI 1.8
HTGC 8.1
HRTG ...
HSY 2.8
HES 1.1
HESM 7.3
HPE 2.9
HXL .9
HIW 7.7
HI
1.9
HTH 2.2
HGV ...
HLT .3
HSHP .0
HIMS ...
HIPO ...
HRT ...
HLLY ...
HOMB 3.1
HD 2.7
HMC 2.0
HMN 4.0
HRL 3.6
DHI .8
HLI 1.7
HOV ...
HHH ...
HWM .2
HUBB 1.3
HUBS ...
HBM .2
HPP 4.1
HUM 1.0
HII 2.1
HUN 4.0
H
.4
HYLN ...
HY 1.9
17
10
18
7
35
12
8
dd
37
6
cc
30
13
9
5
dd
16
30
8
12
12
10
10
6
41
39
dd
57
dd
70
55
50
dd
11
8
12
9
5
20
24
16
12
59
21
40
18
19
44
cc
dd
dd
dd
24
12
22
7
22
22
10
33
5
dd
41
29
dd
43
dd
22
14
dd
23
dd
8
339.75
95.88
57.89
55.23
47.05
36.50
44.65
5.08
84.08
8.95
9.62
8.44
36.70
19.15
17.25
5.12
33.29
131.93
35.88
9.10
103.45
28.41
28.05
10.99
10.53
14.49
16.23
19.90
5.89
221.77
175.66
50.08
11.51
38.06
10.30
145.07
19.74
8.50
197.83
154.10
34.75
17.65
68.87
25.97
46.49
30.59
41.33
200.60
9.53
19.42
17.64
14.30
3.84
23.52
334.87
33.92
34.17
30.98
147.80
135.35
143.78
66.30
84.65
388.89
611.05
9.76
4.91
358.12
253.10
24.80
147.47
1.48
72.59
+21.05 .66
–0.94 .40
–0.11.7008
–0.88 .50
+1.83 .33
+3.75.2756
+0.27 1.05
–0.34 .64
–4.26 ...
+0.45.3443
+0.65 ...
+0.06.1064
+0.59 .17
+0.51 .115
+0.55 ...
... ...
–0.04 .415
–0.46 .85
+0.67.1725
–0.15.0779
+2.17 .47
+0.78 .32
–1.48 .30
+0.36 .36
+0.06 ...
–0.10 ...
+0.58 .31
+0.80 .30
+0.26.0025
+4.46 .10
+0.42 .10
+0.21 .09
+0.31 ...
+0.91 .17
–0.45 ...
–2.63 .665
+0.33 .08
+0.37 ...
+0.83 1.37
+2.71.4375
–0.73.6516
–0.76 .13
–1.66 .15
+0.46 .50
+2.02.2225
–0.61 .17
+0.02 ...
–2.64 .15
+0.89 .04
+2.54 ...
–0.56 ...
–0.04 ...
+0.20 ...
–0.22 .18
+9.77 2.25
+0.68.5503
+0.41 .34
–4.13.2825
+3.18 .30
–0.37 .57
+4.26 ...
+0.61 ...
–0.07 .05
–24.11 1.22
+20.89 ...
+0.13.0074
+0.21 .05
+8.82 .885
–3.10 1.30
–0.20 .25
–0.60 .15
–0.03 ...
–2.89 .35
I
27.80 21.89 ICICI Bank
IBN
.4 18 26.74 –0.58.1736
38,600
600,200
H
339.97
121.57
71.39
64.16
47.60
39.52
45.46
6.84
97.97
8.99
9.81
8.96
43.85
25.24
17.62
5.86
33.99
138.30
44.16
10.25
103.64
37.05
40.00
40.16
10.99
16.04
20.25
22.38
6.29
225.61
180.08
67.31
12.14
46.55
19.48
171.00
20.01
11.23
263.29
167.75
36.84
20.07
79.08
28.45
53.76
35.66
49.02
215.79
9.65
21.44
25.49
14.39
8.06
25.80
396.87
37.90
39.25
41.73
165.75
137.92
184.42
86.72
85.52
429.61
693.85
10.49
9.86
530.54
299.50
29.90
161.50
2.29
79.66
31
A
S
O
N
D
J
F
M
A
M
In generating this chart, we subtract each day's NYSE composite declines from that day's advances. The resultant total is
added to the next day's total, and so on. When all five days' numbers are added together, this produces the weekly figure we
plot. Dec. 31, 1985 =1000.
–52-Week–
High
Low
6.73
106.69
41.58
10.13
18.04
2.05
18.71
261.73
11.67
140.20
4.60
117.59
246.36
3.80
271.15
20.70
3.45
18.77
11.62
39.80
20.74
96.67
66.18
122.18
115.75
2.58
128.91
330.00
263.76
39.38
28.50
123.99
12.42
140.43
112.08
30.59
199.18
99.91
33.99
46.10
65.94
40.95
28.30
27.25
12.37
36.53
21.60
83.00
7.27
Last
Div
Chg. Amt.
4.30
86.43
21.64
2.18
12.45
0.53
12.48
167.42
5.78
79.64
1.99
93.15
183.77
1.68
217.50
13.20
1.29
11.61
10.72
17.44
15.12
58.68
36.66
89.54
66.32
0.89
90.80
123.27
106.02
26.87
18.98
69.40
10.62
104.49
67.09
17.94
129.18
62.11
18.90
29.55
34.77
27.20
17.52
22.06
6.34
28.49
6.98
53.41
5.12
ICL Group
IDACORP
IDT
IHS Holding
ING Groep
INNOVATE
Invesco
IQVIA
IRSA
ITT
IamGold
Ibotta
IDEX
iHuman
IllinoisToolWks
Imax
IndContractDrill
IndepRealty
InFinTAcqnA
Informatica
Infosys
IngersollRand
Ingevity
Ingredion
InnovativeIndProp
Innovid
Insperity
InspireMedical
InstalledBldg
InsteelInds
Instructure
IntegerHoldings
IntegratedWellA
ICE
InterContinentl
IntercorpFinSvcs
IBM
IntlFlavors
IntlGameTech
IntlPaper
IntlSeaways
Interpublic
IntrepidPotash
InvenTrust
InvescoMtg
InvitatHomes
IonQ
IronMountain
ItauUnibanco
ICL 3.3
IDA 3.5
IDT
...
IHS
...
ING 5.7
VATE ...
IVZ 5.2
IQV ...
IRS .0
ITT 1.0
IAG ...
IBTA ...
IEX 1.3
IH
.0
ITW 2.3
IMAX ...
ICD
...
IRT 3.8
IFIN ...
INFA ...
INFY 1.4
IR
.1
NGVT ...
INGR 2.7
IIPR 6.8
CTV ...
NSP 2.5
INSP ...
IBP
.7
IIIN .4
INST ...
ITGR ...
WEL ...
ICE 1.3
IHG 1.5
IFS 4.2
IBM 4.0
IFF 1.7
IGT 4.1
IP
4.1
INSW .7
IPG 4.2
IPI
...
IVT 3.7
IVR 17.2
INVH 3.2
IONQ ...
IRM 3.2
ITUB ...
13
19
28
dd
...
dd
dd
30
dd
26
14
56
27
4
24
35
dd
dd
58
dd
22
46
dd
12
19
dd
23
dd
24
27
dd
42
81
31
23
11
19
dd
19
85
6
11
dd
cc
dd
63
dd
cc
9
4.73
95.47
40.53
3.65
17.89
.61
15.71
219.09
11.54
132.88
3.95
97.13
208.64
2.02
242.75
16.44
1.45
16.70
11.52
28.85
16.75
93.05
48.85
117.58
107.78
2.20
94.72
158.79
211.84
32.87
22.15
121.24
11.52
133.90
101.55
24.07
166.85
96.18
19.74
45.09
64.42
31.37
26.83
24.77
9.29
34.79
8.15
80.69
5.99
–0.14.0457
–0.14 .83
–0.81 ...
+0.31 ...
+0.15.8205
–0.04 ...
+0.08 .205
–10.51 ...
+1.25.6302
–4.69 .319
–0.05 ...
–8.43 ...
–6.51 .69
... .10
+2.68 1.40
–0.46 ...
+0.03 ...
+0.19 .16
–0.07 ...
–1.05 ...
–0.61.0959
–2.45 .02
+1.11 ...
–0.12 .78
–1.50 1.82
+0.13 ...
–5.46 .60
+0.07 ...
–0.45 .35
+0.83 .03
+0.37 ...
–1.39 ...
+0.03 ...
–2.44 .45
–0.67 1.04
+1.48 1.00
–4.04 1.67
+0.04 .40
+0.07 .20
–0.37.4625
–0.71 1.63
–0.33 .33
–0.80 ...
+0.56.2155
+0.14 .40
+0.31 .28
–0.28 ...
+0.46 .65
–0.18 ...
12.63
11.02
18.85
135.19
90.07
28.57
111.94
24.28
22.18
8.96
30.54
21.06
4.50
88.03
143.13
47.90
119.46
2.23
24.87
JBG SMITH Prop
JELD-WEN
J.Jill
JPMorganChase
Jabil
JacksonFinl
JacobsSolns
JamesHardie
JanusHenderson
JanusIntl
JefferiesFinl
JinkoSolar
JobyAviation
JohnBeanTech
J&J
JohnsonControls
JonesLang
JumiaTech
JuniperNetworks
JBGS 4.9
JELD ...
JILL .8
JPM 2.3
JBL .3
JXN 3.7
J
.8
JHX ...
JHG 4.7
JBI
...
JEF 2.6
JKS 5.0
JOBY ...
JBT .4
JNJ 3.4
JCI 2.1
JLL
...
JMIA ...
JNPR 2.5
dd
45
13
12
10
2
27
27
13
15
38
4
dd
5
21
29
32
dd
52
14.40
15.51
33.70
202.63
118.90
76.01
139.34
31.02
33.50
13.88
46.52
29.74
4.87
95.53
146.67
71.91
202.07
7.09
35.67
+0.42 .175
–0.05 ...
+1.69 .07
+1.92 1.15
–0.70 .08
–1.99 .70
–1.16 .29
–0.22 ...
–0.88 .39
–0.60 ...
+0.05 .30
+1.93 1.50
–0.04 ...
+2.09 .10
–0.30 1.24
–1.99 .37
+3.07 ...
+0.93 ...
+0.98 .22
Name
Tick
Sym Yld P/E
J
18.17
21.75
34.74
205.88
156.94
81.52
154.50
41.98
34.96
15.86
47.87
47.85
11.98
125.88
175.97
74.23
209.79
8.10
38.04
–52-Week–
High
Low
Name
Tick
Sym Yld P/E
Last
Div
Chg. Amt.
K
60.14
74.66
68.68
20.48
108.00
14.12
1.59
15.35
354.02
64.45
64.69
30.60
17.43
28.99
11.34
11.08
26.74
15.86
172.72
74.79
43.37
139.75
22.84
19.93
41.77
9.48
8.28
548.47
124.21
24.26
39.47
83.78
60.99
7.00
18.48
29.43
29.65
28.47
73.79
58.23
9.55
69.69
8.28
58.34
14.50
4.07
28.60
35.20
42.11
49.37
12.44
52.95
9.09
0.32
11.04
194.93
47.63
38.32
22.08
7.85
17.64
10.35
10.47
17.82
9.10
118.57
53.75
26.78
116.32
16.34
15.89
31.31
6.25
4.32
320.57
72.11
19.58
21.51
34.76
45.55
4.74
12.78
15.05
17.68
17.16
37.10
29.71
5.93
44.45
5.23
42.10
6.16
0.42
11.92
KB Financial
KB Home
KBR
KE Holdings
KKR
KKR RealEstFin
KoreGroup
KT
Kadant
Kellanova
Kemper
Kennametal
Kennedy-Wilson
KenonHoldings
KensingtonCapAcqnV
KensingtonCapV A
Kenvue
KeyCorp
KeysightTech
Kforce
KilroyRealty
KimberlyClark
KimcoRealty
KinderMorgan
Kinetik
KingswayFin
KinrossGold
KinsaleCapital
Kirby
KiteRealty
Klaviyo
KnifeRiver
Knight-Swift
KnotOffshore
Knowles
KodiakGasSvcs
Kohl's
Philips
KontoorBrands
Koppers
KoreaElecPwr
KornFerry
KosmosEnergy
Kroger
KronosWorldwide
KukeMusic
Kyndryl
KB 3.5
KBH 1.4
KBR .9
BEKE 1.8
KKR .7
KREF10.6
KORE ...
KT 4.4
KAI .4
K
3.7
KMPR 2.1
KMT 3.1
KW 4.7
KEN 14.9
KCGI.UT ...
KCGI ...
KVUE 4.1
KEY 5.7
KEYS ...
KFRC 2.5
KRC 6.4
KMB 3.7
KIM 5.0
KMI 5.9
KNTK 7.3
KFS ...
KGC 1.5
KNSL .2
KEX ...
KRG 4.5
KVYO ...
KNF ...
KNX 1.3
KNOP 1.7
KN
...
KGS 5.5
KSS 8.9
PHG .0
KTB 2.7
KOP .6
KEP ...
KFY 2.0
KOS ...
KR 2.2
KRO 5.3
KUKE ...
KD
...
7
10
dd
41
23
dd
dd
8
30
23
dd
19
dd
dd
...
18
25
18
30
22
19
24
37
18
17
dd
23
25
29
86
dd
23
71
dd
20
31
9
dd
19
12
18
23
13
18
dd
dd
dd
57.54
70.60
65.66
16.97
102.84
9.46
.63
13.52
286.01
60.34
59.84
25.75
10.22
25.42
11.02
11.08
19.30
14.37
138.48
61.81
33.53
133.30
19.36
19.49
40.99
8.02
8.13
383.62
124.17
21.92
22.64
70.71
48.25
6.30
17.52
27.55
22.39
27.14
73.34
44.33
7.22
65.94
6.10
52.37
14.21
3.05
26.61
+0.74.5727
+0.10 .25
–0.71 .15
+0.31.3089
–3.59 .175
–0.09 .25
–0.07 ...
+0.14.1821
+12.79 .32
–0.70 .60
+1.37 .31
+0.48 .20
+0.22 .12
+1.03 3.80
+0.07 ...
+0.05 ...
–0.05 .20
–0.11 .205
–5.57 ...
+0.34 .38
+1.03 .54
+1.36 1.22
+0.89 .24
+0.42.2875
+0.89 .75
+0.02 ...
+0.06 .03
–8.37 .15
+1.78 ...
+0.90 .25
–0.88 ...
–1.51 ...
+0.55 .16
+0.22 .026
+0.08 ...
+0.83 .38
–4.10 .50
+0.16.9154
+0.79 .50
+1.46 .07
–0.10 ...
–0.59 .33
+0.30 ...
–0.62 .29
+1.30 .19
+0.41 ...
–0.75 ...
102.39
3.45
1.46
6.74
30.30
160.25
7.75
25.12
183.65
9.08
77.41
1.27
43.75
25.82
120.40
10.40
10.11
79.03
10.27
LCI Inds
LG Display
LL Flooring
LSB Inds
LTC Properties
L3HarrisTech
LXP Industrial
La-Z-Boy
Labcorp
LadderCapital
LambWeston
Lanvin
LasVegasSands
Lazard
Lear
LearnCWInvtA
Leggett&Platt
Leidos
Lemonade
LCII 3.8
LPL
...
LL
...
LXU ...
LTC 6.6
LHX 2.1
LXP 6.1
LZB 2.1
LH
...
LADR 8.2
LW 1.6
LANV ...
LVS 1.8
LAZ 5.0
LEA 2.5
LCW ...
LEG 1.7
LDOS 1.0
LMND ...
30
dd
dd
42
18
36
cc
14
39
15
12
dd
22
dd
14
dd
dd
63
dd
109.88
3.51
1.70
9.81
34.40
224.83
8.50
37.52
194.91
11.18
88.29
1.55
45.03
40.23
125.35
10.89
11.60
147.05
16.51
+2.73 1.05
–0.12 ...
... ...
+0.11 ...
+0.07 .19
+1.58 1.16
–0.01 .13
+1.67 .20
–4.74 ...
+0.15 .23
–0.92 .36
+0.02 ...
+0.15 .20
–1.37 .50
–0.36 .77
+0.04 ...
+0.96 .05
–4.10 .38
+0.20 ...
L
137.07
6.69
4.97
11.69
35.72
225.90
10.75
39.87
234.09
12.00
117.38
6.00
61.25
42.24
157.91
11.54
32.86
151.32
24.81
10.92
172.59
159.02
513.78
24.24
6.16
24.75
22.41
19.92
1.50
21.71
826.21
33.05
137.31
2.68
11.43
10.71
331.96
8.14
12.38
107.24
47.22
42.66
12.50
2.87
3.71
61.00
6.33
479.50
78.55
7.87
92.41
262.49
7.64
2.36
2.59
16.58
107.02
B A R R ON S .C OM / D ATA
Last
Div
Chg. Amt.
4.73
102.90
94.51
284.62
12.42
0.35
12.38
11.10
4.52
0.43
12.23
432.34
20.85
106.46
0.88
6.93
6.63
231.36
3.84
3.30
76.48
22.75
24.67
5.71
1.88
1.14
42.57
1.17
393.77
56.59
5.64
49.47
181.85
2.11
0.78
1.81
7.55
86.65
LendingClub
Lennar A
Lennar B
LennoxIntl
LeviStrauss
Li-Cycle
LibertyEnergy
LifeTime
LifezoneMetals
LightInTheBox
Lightspeed
EliLilly
LincolnNational
Lindsay
LionElectric
LionsGate A
LionsGate B
LithiaMotors
LithiumAmArg
LithiumAmericas
LiveNationEnt
LiveOakBcshs
LiveRamp
LiveWire
LloydsBanking
loanDepot
Loar
LocalBounti
LockheedMartin
Loews
LomaNegra
LouisianaPacific
Lowe's
LufaxHolding
LumenTech
LumentFinance
Luxfer
LyondellBasell
LC
...
LEN 1.2
LEN.B 1.4
LII
.9
LEVI 2.0
LICY ...
LBRT 1.1
LTH ...
LZM ...
LITB ...
LSPD ...
LLY .6
LNC 5.5
LNN 1.2
LEV ...
LGF.A ...
LGF.B ...
LAD .8
LAAC ...
LAC ...
LYV ...
LOB .3
RAMP ...
LVWR ...
LYG 4.8
LDI
...
LOAR ...
LOCL ...
LMT 2.7
L
.3
LOMA16.5
LPX 1.1
LOW 2.0
LU 5.6
LUMN ...
LFT 11.2
LXFR 4.2
LYB 5.4
26
11
10
29
78
dd
9
46
dd
dd
dd
cc
5
18
dd
dd
dd
7
1
dd
90
15
cc
dd
8
dd
cc
dd
17
11
12
25
18
dd
dd
8
cc
15
8.92
160.35
146.26
502.60
24.01
.51
24.69
16.78
9.02
.59
14.54
820.34
32.99
114.82
1.08
8.31
7.72
253.14
4.54
3.39
93.74
34.48
31.29
6.49
2.82
1.81
56.97
2.91
470.34
76.80
7.46
91.68
221.29
4.48
1.29
2.50
12.32
99.42
–0.10 ...
+3.97 .50
+1.54 .50
–0.82 1.15
+1.87 .12
–0.07 ...
+1.10 .07
+0.53 ...
+1.20 ...
–0.10 ...
–0.61 ...
+12.91 1.30
+0.33 .45
+0.85 .35
+0.04 ...
–0.88 ...
–0.78 ...
–3.20 .53
–0.18 ...
–0.52 ...
–2.25 ...
+0.31 .03
–0.70 ...
–0.14 ...
+0.07.046
–0.13 ...
+1.76 ...
–0.08 ...
+2.99 3.15
+2.05.0625
+0.53.4648
+1.80 .26
+6.08 1.10
+0.20 .156
+0.02 ...
+0.02 .07
+0.17 .13
+0.88 1.34
108.53
5.21
18.04
8.41
15.02
34.12
71.50
15.39
1.41
33.12
12.68
8.15
139.01
439.95
83.77
8.85
2.05
9.21
14.40
10.54
27.55
164.79
43.96
4.70
19.16
37.70
13.50
11.16
67.35
17.07
21.81
106.76
26.81
10.49
0.16
9.18
22.51
1295.65
0.40
72.78
174.26
389.90
47.66
44.65
10.38
359.77
45.71
92.23
10.78
70.34
11.58
72.39
9.72
59.12
59.13
245.73
5.92
383.82
7.62
2.92
22.35
M&T Bank
MBIA
MDU Rscs
MFA Financial
MGIC Investment
MGM Resorts
M/I Homes
MinisoGroup
MOGU
MPLX
MP Materials
MRC Global
MSA Safety
MSCI
MSC Industrial
MV Oil
Mytheresa
Macerich
MachNaturalRscs
Macy's
MSG Ent
MSG Sports
MagnaIntl
Magnachip
MagnoliaOil
MainStreetCap
ManchesterUnited
Manitowoc
Manpower
ManulifeFinl
MarathonOil
MarathonPetrol
Marcus&Millichap
Marcus
MariaDB
MarineProducts
MarineMax
Markel
Markforged
MarriottVacations
Marsh&McLen
MartinMarietta
Masco
MasTec
MasterBrand
Mastercard
MatadorRscs
Materion
Mativ
Matson
MauiLand
Maximus
MayvilleEngg
McCormickVtg
McCormick
McDonald's
McEwenMining
McKesson
MediaAlpha
MedicalProp
Medifast
MTB 3.6
MBI .0
MDU 2.0
MFA 13.1
MTG 2.2
MGM ...
MHO ...
MNSO 1.7
MOGU ...
MPLX 8.4
MP
...
MRC ...
MSA 1.1
MSCI 1.3
MSM 3.9
MVO16.5
MYTE ...
MAC 4.5
MNR 17.7
M
3.6
MSGE ...
MSGS ...
MGA 4.2
MX
...
MGY 1.9
MAIN 6.0
MANU ...
MTW ...
MAN 4.1
MFC 3.4
MRO 1.5
MPC 1.9
MMI 1.5
MCS 2.6
MRDB ...
MPX 5.5
HZO ...
MKL ...
MKFG ...
VAC 3.4
MMC 1.4
MLM .5
MAS 1.7
MTZ ...
MBC ...
MA
.6
MTDR 1.3
MTRN .5
MATV 2.2
MATX 1.0
MLP ...
MMS 1.4
MEC ...
MKC.V 2.3
MKC 2.3
MCD 2.6
MUX ...
MCK .4
MAX ...
MPW11.2
MED 25.6
10
dd
11
dd
8
15
7
19
dd
10
dd
16
27
34
15
6
dd
dd
...
cc
30
cc
13
dd
13
9
dd
16
77
15
12
9
dd
52
dd
10
10
9
dd
17
26
17
17
dd
12
36
9
29
dd
15
dd
23
39
28
28
22
8
25
dd
dd
4
151.60
5.65
25.24
10.70
21.00
40.17
124.92
22.49
2.38
40.68
16.22
13.29
180.00
495.18
85.90
9.11
5.37
15.12
19.23
19.48
35.54
184.65
45.21
5.03
25.95
49.00
16.88
12.43
74.62
25.96
28.96
176.61
32.33
10.65
.53
10.24
28.48
1641.59
.42
90.27
207.58
572.08
69.92
112.25
16.71
447.07
63.45
114.38
17.97
128.20
20.64
86.10
16.02
72.27
72.22
258.89
11.91
569.59
17.78
5.36
25.74
+0.94 1.35
+0.068.00
+0.02.2225
+0.01 .35
+0.45 .115
+0.45 ...
+0.12 ...
–0.02 .29
+0.16 ...
+0.47 .85
–0.92 ...
+0.16 ...
–7.63 .51
+2.18 1.60
–2.45 .83
–0.24 .33
+0.08 ...
+0.16 .17
–0.07 .75
–0.70.1737
+0.01 ...
+0.35 ...
–0.14 .475
+0.08 ...
+1.04 .13
+0.45 .245
+0.08 ...
+0.22 ...
–0.04 1.54
–0.58.2694
+3.40 .11
–1.19 .825
–0.61 .25
–0.25 .07
... ...
–0.08 .70
+1.42 ...
+23.30 ...
... ...
–2.97 .76
–0.31 .71
–7.08 .74
+0.82 .29
+0.04 ...
+0.46 ...
–4.11 .66
+2.86 .20
–0.75 .135
–0.75 .10
+7.55 .32
–0.36 ...
+0.14 .30
+0.63 ...
–1.34 .42
+0.01 .42
+0.78 1.67
+0.56 ...
+8.86 .62
–0.48 ...
+0.32 .15
+2.91 1.65
Name
Tick
Sym Yld P/E
M
156.65
14.37
25.99
11.90
22.43
51.35
140.73
29.92
2.92
42.90
26.53
14.02
196.02
617.39
105.77
13.95
5.54
17.69
21.19
22.10
41.58
215.79
65.27
11.68
27.33
51.10
26.64
19.81
88.91
26.81
30.06
221.11
44.24
16.75
1.15
17.81
42.88
1670.24
2.30
134.09
211.53
626.67
78.94
123.33
19.07
490.00
71.08
145.08
19.34
129.46
23.49
90.65
16.54
94.97
94.39
302.39
12.50
570.59
25.78
10.74
109.52
–52-Week–
High
Low
91.00
133.10
59.89
25.88
189.96
25.90
22.39
1.70
24.31
15.26
46.58
74.68
57.15
1535.86
158.46
61.87
87.19
11.50
10.07
9.85
11.22
4.32
35.96
109.53
17.65
58.67
131.19
423.92
72.25
70.90
106.82
49.97
417.75
181.77
175.05
103.25
42.81
372.01
31.44
60.31
19.43
2.29
49.14
449.37
23.63
Last
Div
Chg. Amt.
68.84
99.14
27.27
14.89
109.23
7.98
16.08
0.45
17.60
9.08
10.83
50.83
28.58
928.50
115.56
32.83
48.61
6.70
4.80
4.96
6.85
2.93
20.90
27.44
10.88
38.58
76.02
269.67
57.29
52.60
10.11
21.96
298.86
97.53
100.00
69.42
27.83
269.65
23.94
34.96
12.11
0.51
36.00
275.27
15.20
Medtronic
Merck
MercuryGeneral
MeridianLink
MeritageHomes
MesaRoyalty
MesabiTrust
MetaData
Metallus
MetalsAcqn
MethodeElec
MetLife
MetropolitanBk
Mettler-Toledo
MidAmApt
MillerIndustries
MineralsTechs
MirionTech
MisterCarWash
MistrasGroup
MitsubishiUFJ
MizuhoFin
ModelN
ModineMfg
ModivIndl
Moelis
MohawkInds
MolinaHealthcare
MolsonCoorsA
MolsonCoorsB
MoneyLion
MontroseEnvl
Moody's
Moog A
Moog B
MorganStanley
Mosaic
MotorolaSol
Movado
MuellerIndustries
MuellerWater
MultiPlan
MurphyOil
MurphyUSA
MyersIndustries
MDT 3.4
MRK 2.5
MCY 2.3
MLNK ...
MTH 1.2
MTR 5.9
MSB 7.6
AIU ...
MTUS ...
MTAL ...
MEI 4.8
MET 3.0
MCB ...
MTD ...
MAA 4.4
MLR 1.3
MTX .5
MIR ...
MCW ...
MG
...
MUFG 1.9
MFG 2.3
MODN ...
MOD ...
MDV 7.6
MC 4.2
MHK ...
MOH ...
TAP.A 2.9
TAP 3.2
ML
...
MEG ...
MCO .9
MOG.A .7
MOG.B .7
MS 3.5
MOS 2.7
MSI 1.1
MOV 5.3
MLI 1.4
MWA 1.4
MPLN ...
MUR 2.8
MUSA .4
MYE 3.4
30
cc
14
dd
8
8
12
0
14
dd
dd
25
7
39
28
11
30
dd
31
dd
12
11
cc
33
dd
dd
dd
17
12
11
dd
dd
43
29
29
18
13
45
15
12
29
dd
12
18
15
81.37
125.54
55.83
18.57
176.35
9.00
17.72
.60
24.01
14.85
11.78
72.37
42.05
1404.09
133.71
60.80
86.75
10.86
7.03
8.55
10.64
4.10
29.89
100.92
15.17
56.61
121.93
314.58
60.38
54.81
98.50
47.01
396.99
169.43
170.00
97.84
30.93
364.91
26.50
58.91
18.56
.54
42.79
438.75
15.80
–0.92 .70
–3.95 .77
–1.28.3175
–0.59 ...
+1.73 .75
–0.50.0546
+0.40 .29
+0.06 ...
+0.65 ...
+1.10 ...
+0.03 .14
–0.17 .545
–1.40 ...
–75.44 ...
+0.51 1.47
+1.45 .19
+1.51 .10
+0.13 ...
+0.23 ...
–0.06 ...
+0.58.1221
+0.05.0678
+0.05 ...
–2.83 ...
–0.40.0958
–1.27 .60
+5.50 ...
–17.55 ...
–0.08 .44
+1.31 .44
+4.66 ...
–1.55 ...
–13.61 .85
–4.45 .28
–2.97 .28
–1.13 .85
–0.05 .21
+0.31 .98
–0.38 .35
–0.19 .20
–0.23.064
–0.15 ...
+0.80 .30
–5.70 .44
+0.45 .135
27.26
11.50
18.00
10.99
7.55
3.41
3.61
4.46
34.38
14.85
31.68
5210.49
70.25
28.38
45.32
56.41
48.51
70.24
27.86
9.55
10.50
45.91
4.77
4.30
12.33
81.67
1.66
9.50
13.49
4.94
8.93
38.92
36.22
1.70
36.17
396.07
29.42
3.75
4.14
4.22
12.63
26.21
1.32
47.15
63.55
88.66
1.59
22.86
9.90
36.20
2.94
13.56
3.63
3.44
NACCO Inds
N-able
NCR Atleos
NCR Voyix
NetPower
NGL Energy
NIO
NL Industries
NNN REIT
NOV
NRG Energy
NVR
NaborsIndustries
NatlBankHoldings
NationalFuelGas
NationalGrid
NatlHealthInv
NatlPrestoInds
NatlStorage
NaturalGasSvcs
NaturalGrocers
NaturalResPtrs
Natuzzi
NatWest
Navigator
Nelnet
NerdyA
NetLeaseOffice
Netstreit
NeueHealth
Nevro
NewJerseyRscs
NewOrientalEduc
NY CmntyBcp
NYTimes A
NewMarket
Newmont
NewparkResources
NexaResources
NexGenEnergy
NexPointRealEst
NexPointResidentl
Nextdoor
NextEraEnergy
NicoletBankshares
Nike
NineEnergy
NiSource
NoahHoldings
Noble
Nokia
NomadFoods
Nomura
NordicAmTankers
NC 2.7
NABL ...
NATL ...
VYX ...
NPWR ...
NGL ...
NIO ...
NL 4.4
NNN 5.4
NOV 1.2
NRG 2.0
NVR ...
NBR ...
NBHC 3.1
NFG 3.5
NGG 6.3
NHI 5.4
NPK 1.3
NSA 6.1
NGS ...
NGVC 1.9
NRP 3.3
NTZ ...
NWG ...
NVGS 1.1
NNI 1.1
NRDY ...
NLOP 1.4
NTST 4.7
NEUE ...
NVRO ...
NJR 3.9
EDU ...
NYCB 1.2
NYT 1.0
NEU 1.9
NEM 2.4
NR
...
NEXA ...
NXE ...
NREF14.1
NXRT 5.0
KIND ...
NEE 2.6
NIC 1.3
NKE 1.6
NINE ...
NI
3.6
NOAH 3.5
NE 3.4
NOK 3.3
NOMD 3.4
NMR 2.0
NAT 10.4
dd
91
dd
dd
dd
dd
dd
dd
19
8
11
16
dd
10
11
16
22
16
19
29
17
7
dd
7
15
29
dd
dd
cc
dd
dd
17
43
dd
34
13
dd
46
dd
cc
dd
13
dd
22
12
28
dd
19
1
14
24
15
17
13
33.28
13.35
27.83
13.18
10.51
5.68
5.39
7.35
41.77
18.82
81.00
7680.73
74.76
36.47
57.16
57.86
66.08
74.48
36.58
21.76
21.58
90.35
5.20
8.26
17.49
103.66
1.71
23.74
17.35
6.00
9.35
43.46
79.93
3.29
51.20
535.07
41.94
8.48
7.85
7.78
14.22
36.67
2.42
80.02
80.53
95.05
1.69
29.06
10.32
46.46
3.90
17.56
6.08
4.14
+1.80.2275
+0.86 ...
–0.50 ...
–0.27 ...
–0.25 ...
... ...
+0.56 ...
–0.34 .08
+0.47 .565
+0.58 .075
–5.00.4075
+264.41 ...
+1.79 ...
–0.51 .28
+1.75 .495
–2.832.4939
+1.11 .90
–0.61 3.50
+0.69 .56
–0.07 ...
+0.56 .10
+0.78 .75
–0.25 ...
+0.25 ...
+0.17 .05
–2.02 .28
–0.10 ...
+0.03 .34
+0.11 .205
+0.05 ...
–0.04 ...
+0.86 .42
+1.81 ...
–0.04 .01
+1.31 .13
–7.95 2.50
–0.04 .25
+0.77 ...
–0.05 ...
+0.01 ...
+0.24 .50
+0.13.4624
–0.06 ...
+3.41 .515
–0.48 .28
+3.30 .37
+0.03 ...
+1.02 .265
–3.51 .38
+1.09 .40
+0.05.0326
–0.80 .15
+0.10.0543
–0.14 .12
Name
Tick
Sym Yld P/E
N
38.66
14.99
28.82
19.01
17.62
6.20
16.18
8.93
44.87
21.91
87.58
8211.40
141.47
38.71
57.60
73.40
67.45
86.08
42.54
25.24
21.70
102.00
7.60
8.48
17.82
110.70
5.37
50.00
18.97
22.00
28.42
50.72
98.20
14.22
51.22
650.00
45.92
8.52
8.03
8.88
17.84
49.87
3.42
80.47
86.86
123.39
5.59
29.44
17.39
55.34
4.36
20.05
6.62
4.83
32
BARRON’S
D ATA
–52-Week–
High
Low
23.53
263.66
26.30
16.36
43.75
496.89
44.90
22.75
3.44
108.78
138.28
12.50
35.66
203.00
11.21
69.12
4.16
86.57
NEW YORK STOCK EXCHANGE COMPOSITE LIST
Last
Div
Chg. Amt.
12.88
183.09
18.20
4.77
30.47
414.56
34.95
12.71
1.85
88.86
75.56
6.61
11.73
137.90
1.81
47.90
0.95
44.75
Nordstrom
NorfolkSouthern
NorthAmConstr
NoEuroOil
NorthernOil&Gas
NorthropGrum
NorthwestNat
NorwegCruise
NouveauMonde
Novartis
NovoNordisk
NuHoldings
NuSkinEnts
Nucor
NuScalePower
Nutrien
NuvationBio
nVentElectric
JWN 3.4
NSC 2.4
NOA 1.4
NRT 6.6
NOG 3.9
NOC 1.8
NWN 5.2
NCLH ...
NMG ...
NVS 3.1
NVO .7
NU
...
NUS 1.8
NUE 1.3
SMR ...
NTR 3.7
NUVB ...
NVT .9
12
36
16
5
7
32
17
25
dd
14
47
46
dd
10
dd
34
dd
24
22.10
224.80
21.25
6.98
40.93
450.77
37.42
16.60
2.20
103.13
135.28
11.88
13.35
168.85
8.73
58.61
3.10
81.38
+0.58 .19
–2.06 1.35
+1.36.0732
–0.41 .20
+1.38 .40
–15.66 2.06
+1.19.4875
+0.60 ...
+0.14 ...
+2.603.7772
–0.76.9293
+0.15 ...
+0.11 .06
–2.42 .54
+0.95 ...
–0.25 .54
+0.02 ...
–4.05 .19
25.04
31.25
12.09
55.50
57.25
5.73
12.86
55.12
16.53
21.15
4.50
37.86
3.95
20.22
7.05
24.17
41.71
4.25
27.53
72.20
23.41
17.55
1.75
35.00
103.00
6.50
32.82
1.91
99.26
10.97
5.90
10.84
26.68
2.41
3.01
19.32
86.05
58.73
4.72
78.00
1.70
11.24
73.32
3.67
8.18
3.75
34.50
13.64
109.59
2.52
82.33
OFGBancorp
OGE Energy
O-I Glass
ONE Gas
ONEOK
ON24
Openlane
OccidentalPetrol
OceaneeringIntl
OcwenFinancial
Offerpad
Oil-Dri
OilStatesIntl
OkeanisEcoTankers
Oklo
OldRepublic
Olin
Olo
OmegaHealthcare
Omnicom
OnHolding
OneLiberty
OneConnectFin
OneMain
OntoInnovation
Ooma
Oppenheimer A
OppFi
Oracle
Orange
OrchidIsland
Organon
OriginBancorp
OrionGroup
OrionOffice
Orion
Orix
OrmatTech
OscarHealth
Oshkosh
OsiskoDevelopment
OsiskoGold
OtisWorldwide
Ouster
OutfrontMedia
OverseasShip
Ovintiv
Owens&Minor
OwensCorning
Owlet
OxfordIndustries
OFG 2.7
OGE 4.6
OI
...
OGS 4.3
OKE 4.9
ONTF ...
KAR ...
OXY 1.4
OII
...
OCN ...
OPAD ...
ODC 1.4
OIS
...
ECO .0
OKLO ...
ORI 3.3
OLN 1.5
OLO ...
OHI 8.3
OMC 3.0
ONON ...
OLP 7.7
OCFT ...
OMF 8.5
ONTO ...
OOMA ...
OPY 1.3
OPFI .0
ORCL 1.4
ORAN 5.1
ORC 16.9
OGN 5.3
OBK 1.9
ORN ...
ONL 10.7
OEC .3
IX
2.3
ORA .6
OSCR ...
OSK 1.6
ODV ...
OR 1.1
OTIS 1.6
OUST ...
OUT 8.3
OSG 2.8
OVV 2.3
OMI ...
OC 1.3
OWLT ...
OXM 2.4
10
18
dd
15
19
dd
dd
17
22
43
dd
15
dd
7
54
12
19
dd
29
13
96
17
dd
10
77
dd
12
52
31
13
dd
5
12
dd
dd
17
10
34
dd
11
dd
dd
29
dd
dd
10
7
dd
15
dd
30
37.16
36.30
12.69
61.63
81.00
5.94
17.25
62.50
23.68
24.51
4.85
83.56
4.47
36.14
10.07
31.78
53.76
4.58
32.33
92.96
42.54
23.47
1.95
49.12
216.70
8.64
45.68
3.23
117.19
11.75
8.50
21.33
31.27
10.78
3.75
24.87
109.43
75.40
19.96
113.73
2.02
16.65
99.20
11.70
14.45
8.45
51.67
17.43
181.07
3.69
110.69
+0.27 .25
+0.65.4182
+0.13 ...
+1.51 .66
+0.15 .99
–0.23 ...
+0.17 ...
+0.55 .22
+0.42 ...
–0.17 ...
–0.15 ...
+1.82 .29
–0.09 ...
+0.10 1.10
–0.08 ...
+0.28 .265
–0.64 .20
–0.03 ...
+0.86 .67
–2.15 .70
+2.31 ...
+0.36 .45
–0.11 ...
+0.77 1.04
–16.44 ...
+1.03 ...
+0.31 .15
–0.10 .12
–5.72 .40
+0.14.4523
–0.07 .12
+0.34 .28
+0.03 .15
+2.00 ...
+0.22 .10
+0.35.0207
+2.751.4781
+1.85 .12
–0.60 ...
–1.73 .46
–0.02 ...
+0.41.0474
+1.63 .39
+0.20 ...
+0.18 .30
... .06
+3.38 .30
–0.10 ...
–0.28 .60
+0.04 ...
+4.69 .67
22.61
35.83
14.71
23.46
2.78
67.06
19.02
109.40
34.63
66.70
120.33
22.20
26.39
27.59
3.29
7.08
69.27
125.86
17.92
6.93
13.56
32.91
12.16
21.62
28.21
7.25
4.06
13.14
PACS Group
PBF Energy
PG&E
PHINIA
PHX Minerals
PJT Partners
PLDT
PNC Finl
PNM Resources
POSCO
PPG Ind
PPL
ProgHoldings
PROS
PSQ
P10
PVH
PackagingCpAm
PagerDuty
PagSeguroDig
PalantirTech
PampaEnergia
PanAmerSilver
ParPacific
ParTechnology
Paragon28
ParamountGroup
ParkAerospace
PACS ...
PBF 2.1
PCG .2
PHIN 2.2
PHX 3.7
PJT .9
PHI 4.8
PNC 3.9
PNM 4.0
PKX 1.6
PPG 2.0
PPL 3.5
PRG 1.3
PRO ...
PSQH ...
PX 1.6
PVH .1
PKG 2.7
PD
...
PAGS ...
PLTR ...
PAM ...
PAAS 1.8
PARR ...
PAR ...
FNA ...
PGRE 3.1
PKE 3.6
...
3
16
19
28
29
11
13
43
19
22
28
15
dd
dd
dd
11
23
dd
11
cc
6
dd
3
dd
dd
dd
38
30.40
46.33
18.54
44.76
3.25
106.67
25.25
157.39
38.34
67.41
131.41
29.33
37.79
29.48
3.36
8.08
120.01
183.49
18.97
12.25
21.68
49.35
22.00
27.14
44.62
7.69
4.55
13.94
+0.37 ...
–2.45 .25
+0.08 .01
–0.59 .25
–0.05 .03
–0.35 .25
+1.10.8233
+3.13 1.55
+1.11.3875
–3.15.4726
–0.01 .65
+0.65.2575
+2.29 .12
–1.69 ...
–0.30 ...
–0.11 .035
+4.67.0375
–0.28 1.25
–0.80 ...
–0.02 ...
+0.67 ...
+3.63 ...
+0.96 .10
–0.14 ...
–3.72 ...
–0.13 ...
+0.08 .035
–0.22 .125
Name
Tick
Sym Yld P/E
For personal non-commercial use only. Do not edit or alter. Reproductions not permitted.
To reprint or license content, please contact Barron's reprints department at 800-843-0008 or www.djreprints.com
O
39.04
37.30
23.57
83.89
83.31
9.09
18.41
71.19
27.46
35.79
15.20
84.80
9.02
36.46
18.80
32.26
60.60
8.84
34.77
99.23
43.54
24.30
6.00
53.65
238.13
15.66
46.75
5.34
132.77
12.41
11.27
24.08
36.91
10.84
7.07
28.48
113.43
88.26
23.44
127.98
4.81
16.81
100.35
14.17
17.02
8.46
55.95
28.35
183.33
7.50
113.88
PQ
30.86
62.88
18.95
46.08
3.89
108.71
30.39
162.24
46.94
133.09
152.89
29.89
44.81
40.99
35.57
13.41
141.15
191.27
26.70
14.98
27.50
52.17
22.75
40.70
50.00
19.00
5.92
16.96
June 3, 2024
–52-Week–
High
Low
18.05
570.15
85.44
374.04
25.21
19.83
27.24
39.91
13.18
16.65
15.02
37.48
7.51
94.80
15.89
180.84
85.84
348.67
11.89
5.10
78.54
8.18
25.62
18.28
3.16
6.99
40.28
17.91
17.32
40.37
101.52
174.08
2.93
34.98
8.05
86.03
16.00
43.12
216.50
5.78
75.86
5.00
11.71
25.55
138.49
50.18
108.17
15.70
25.16
77.21
75.31
256.56
23.11
56.62
19.38
83.35
168.54
217.77
137.52
4.94
11.37
68.88
41.87
19.62
121.40
29.26
75.82
312.25
122.72
68.75
11.41
64.17
49.18
6.75
221.94
39.31
286.87
13.86
2.60
145.62
Last
Div
Chg. Amt.
11.05
329.42
45.04
143.88
9.33
9.25
18.51
11.81
10.05
11.39
7.12
28.15
5.50
62.15
10.52
137.95
56.74
180.93
10.61
1.90
52.92
2.79
10.95
9.51
1.31
3.65
25.77
12.17
10.94
25.20
87.23
89.74
1.10
12.05
4.91
65.20
2.54
23.36
124.46
2.80
44.13
1.67
5.10
19.21
79.61
38.01
78.85
12.98
16.15
44.52
52.90
183.10
12.27
27.02
11.76
48.11
141.45
111.41
96.64
3.15
6.99
49.60
23.01
13.21
81.23
17.12
53.71
233.18
67.48
31.00
0.04
27.18
35.81
3.40
138.67
23.99
153.74
4.92
1.38
119.59
ParkHotels
ParkerHannifin
Parsons
PaycomSoftware
Paymentus
Paysafe
PeabodyEnergy
PeakstoneRealty
Pearson
PebblebrookHotel
PediatrixMedical
PembinaPipeline
PennantPark
PennyMacFin
PennyMacMtg
PenskeAuto
Pentair
Penumbra
PerceptionCapIV
Perfect
PerformanceFood
PerimeterSolns
PermianBasin
PermianRscs
PermianvilleRT
PermRock
Perrigo
PetroleoBrasil
PetroleoBrasilA
Pfizer
PhilipMorris
Phillips66
PhoenixNewMedia
Phreesia
PiedmontOfficeA
PinnacleWest
Pinstripes
Pinterest
PiperSandler
PitneyBowes
PlanetFitness
PlanetLabs
PlayAGS
PlymouthIndREIT
Polaris
PortlandGenElec
PostHoldings
PostalRealty
PowerSchool
PrecisionDrilling
PrestigeCnsHlth
Primerica
PrimoWater
PrimorisSvcs
ProAssurance
ProcoreTech
Procter&Gamble
Progressive
Prologis
PropertyGuru
ProPetro
ProsperityBcshs
ProtoLabs
ProvidentFinSvcs
PrudentialFinl
Prudential
PublicServiceEnt
PublicStorage
PulteGroup
PureStorage
PyrophyteAcqn
Q2
Qiagen
QuadGraphics
QuakerHoughton
QuanexBldg
QuantaServices
QuantumScape
Qudian
QuestDiag
PK 5.0
PH 1.2
PSN ...
PAYC 1.0
PAY ...
PSFE ...
BTU 1.2
PKST 7.3
PSO 2.3
PEB .3
MD
...
PBA 5.4
PNNT12.8
PFSI .9
PMT 11.7
PAG 2.2
PNR 1.1
PEN ...
RCFA ...
PERF ...
PFGC ...
PRM ...
PBT 5.6
PR 1.5
PVL 12.2
PRT 11.2
PRGO 4.0
PBR 15.6
PBR.A16.4
PFE 5.9
PM 5.1
PSX 3.2
FENG ...
PHR ...
PDM 6.9
PNW 4.5
PNST ...
PINS ...
PIPR 1.1
PBI 3.7
PLNT ...
PL
...
AGS ...
PLYM 4.6
PII 3.2
POR 4.5
POST ...
PSTL 7.2
PWSC ...
PDS ...
PBH ...
PRI 1.3
PRMW 1.6
PRIM .4
PRA ...
PCOR ...
PG 2.4
PGR .2
PLD 3.5
PGRU ...
PUMP ...
PB 3.6
PRLB ...
PFS 6.7
PRU 4.3
PUK ...
PEG 3.2
PSA 4.4
PHM .7
PSTG ...
PHYT ...
QTWO ...
QGEN .0
QUAD 4.2
KWR 1.0
NX 1.0
PWR .1
QS
...
QD
...
DGX 2.1
36
25
cc
18
82
dd
7
dd
18
dd
dd
16
8
31
9
11
22
80
cc
42
26
dd
20
15
5
9
dd
5
4
dd
20
11
dd
dd
dd
17
dd
cc
36
dd
36
dd
89
49
12
17
21
cc
dd
7
15
14
39
21
dd
dd
27
22
33
dd
14
14
40
9
20
16
21
25
9
cc
83
dd
29
dd
28
13
54
dd
90
19
15.86
531.52
76.15
145.32
18.71
18.18
24.78
12.40
12.07
14.15
7.31
37.13
7.49
90.65
13.68
152.10
81.38
189.47
11.29
1.96
69.60
7.60
12.19
16.39
1.37
3.79
27.53
15.55
14.81
28.66
101.38
142.11
2.86
18.92
7.29
78.86
2.77
41.49
211.78
5.42
63.64
1.86
11.55
20.86
83.60
44.56
106.57
13.38
21.44
74.56
64.31
225.89
22.56
54.76
14.37
67.13
164.54
211.18
110.49
4.34
9.58
62.30
30.97
14.40
120.35
19.30
75.76
273.83
117.32
60.29
11.40
60.82
43.26
4.72
181.35
32.96
275.94
5.91
1.71
141.97
–0.19 .25
+1.69 1.63
–3.10 ...
–25.36 .375
–0.36 ...
–0.32 ...
+1.25 .075
–0.28 .225
+0.04 .09
–0.04 .01
–0.15 ...
+0.61.5039
+0.09 .08
–0.64 .20
+0.11 .40
–0.59 .96
–1.37 .23
–4.19 ...
+0.04 ...
–0.17 ...
–0.07 ...
+0.02 ...
–0.35.0201
+0.56 .14
–0.02.0772
–0.02.0403
–0.35 .276
+0.73.2034
+0.68 .193
–0.22 .42
+1.45 1.30
–0.57 1.15
+1.02 ...
–3.71 ...
+0.16 .125
+2.04 .88
+0.10 ...
+0.05 ...
–1.62 .60
+0.17 .05
+0.10 ...
–0.04 ...
+0.02 ...
+0.49 .24
+1.22 .66
+0.84 .50
+0.14 ...
+0.04 .24
+0.48 ...
+3.77 ...
+0.34 ...
–1.66 .75
–0.09 .09
+0.09 .06
–0.30 ...
–1.62 ...
–0.791.0065
+7.27 .10
+5.74 .96
–0.37 ...
–0.05 ...
+0.21 .56
+0.08 ...
–0.61 .24
+0.99 1.30
–0.35 ...
+0.72 .60
+1.443.00
+3.02 .20
–0.76 ...
+0.03 ...
–1.45 ...
–0.47 1.28
–0.24 .05
–2.70 .455
+0.46 .08
–7.49 .09
+0.11 ...
+0.02 ...
+0.69 .75
200.62
52.48
31.38
6.94
10.47
207.26
124.59
9.07
1.39
6.34
80.86
68.56
16.94
24.34
1.44
107.68
25.89
9.27
2.63
91.67
RBC Bearings
RB Global
RELX
RE/MAX
REV
RH
RLI
RLJ Lodging
RLX Tech
RPC
RPM
RTX
RXO
RadianGroup
Rafael
RalphLauren
RangeResources
RangerEnergySvcs
Ranpak
RaymondJames
RBC ...
RBA 1.5
RELX 1.7
RMAX11.4
REVG .7
RH
...
RLI
.8
RLJ 4.0
RLX .4
RES 2.3
RPM 1.6
RTX 2.3
RXO ...
RDN 3.1
RFL ...
RL 1.8
RRC .9
RNGR 1.9
PACK ...
RJF 1.5
46
44
38
dd
7
49
20
35
25
10
26
42
dd
8
18
19
19
16
dd
15
295.28
72.68
43.96
8.09
27.41
271.93
145.98
9.98
1.89
6.83
112.10
107.81
20.41
31.24
1.53
186.88
36.91
10.55
6.24
122.75
+3.76 ...
–3.48 .27
–0.73.2195
–0.13 .23
+0.21 .05
+17.22 ...
+0.10 .29
–0.09 .10
–0.02.008
+0.05 .04
–0.92 .46
+1.54 .63
+0.08 ...
–0.06 .245
–0.06 ...
+13.43 .825
+1.13 .08
+0.17 .05
–0.23 ...
–3.11 .45
Name
Tick
Sym Yld P/E
R
298.50
80.67
44.96
20.48
27.49
406.38
149.20
12.39
2.40
9.41
120.74
107.88
24.33
33.69
2.52
192.03
39.33
14.64
8.29
131.19
–52-Week–
High
Low
5.76
35.29
11.97
64.18
74.90
5.30
8.30
183.85
34.60
21.08
213.21
342.20
239.42
34.85
41.55
17.96
196.76
23.21
229.97
83.29
23.19
131.96
60.79
58.02
11.40
43.28
75.09
6.31
11.60
88.39
47.20
15.60
348.52
48.19
173.16
47.69
109.47
150.90
13.84
40.00
9.07
56.52
128.85
44.70
122.91
Last
Div
Chg. Amt.
2.66
24.84
7.93
45.04
37.35
2.35
5.46
97.18
20.50
13.72
135.07
234.56
174.22
22.99
23.39
8.00
140.23
14.20
132.24
61.77
12.25
79.50
32.43
41.56
10.65
25.08
58.27
3.48
8.38
63.68
24.88
7.17
252.11
36.55
105.48
32.19
77.90
78.35
0.19
29.24
2.90
41.34
78.87
21.52
79.86
RayonierAdvMatls
Rayonier
ReadyCapital
RealtyIncome
Reddit
Redwire
RedwoodTrust
RegalRexnord
RegionalMgmt
RegionsFinl
ReinsGrp
Reliance
RenaissanceRe
Renasant
RentokilInit
ReposiTrak
RepublicSvcs
ResideoTech
ResMed
RestaurantBrands
Revolve
Revvity
RexAmerRscs
RexfordIndlRealty
RigelResourceA
RingCentral
RioTinto
Riskified
RithmCapital
RobertHalf
Roblox
RocketCos.
Rockwell
RogersComm B
Rogers
Rollins
RoyalBkCanada
RoyalCaribbean
RubiconTech
Rubrik
RushStreetInt
RyanSpecialty
RyderSystem
RyersonHolding
RymanHospitality
RYAM ...
RYN 3.8
RC 14.5
O
5.9
RDDT ...
RDW ...
RWT 10.1
RRX .9
RM 4.4
RF 5.0
RGA 1.6
RS 1.5
RNR .7
RNST 2.9
RTO 1.8
TRAK .4
RSG 1.2
REZI ...
RMD .9
QSR 3.4
RVLV ...
RVTY .3
REX ...
REXR 3.7
RRAC ...
RNG ...
RIO 6.2
RSKD ...
RITM 8.9
RHI 3.3
RBLX ...
RKT ...
ROK 1.9
RCI 3.7
ROG ...
ROL 1.3
RY 3.8
RCL ...
RBT ...
RBRK ...
RSI
...
RYAN .8
R
2.3
RYI 3.2
RHP 4.1
dd
27
5
49
dd
dd
94
dd
12
10
16
14
5
12
29
59
33
16
32
18
56
77
13
41
83
dd
11
dd
7
19
dd
cc
25
49
32
51
14
19
dd
dd
dd
cc
16
9
22
5.65
30.02
8.30
53.06
54.24
5.14
6.34
149.54
27.50
19.35
209.80
300.78
227.86
30.12
26.98
16.35
185.19
21.60
206.33
68.58
19.08
109.26
49.99
45.36
11.29
34.20
70.10
6.09
11.21
64.23
33.62
13.90
257.53
40.40
118.00
45.69
109.27
147.68
.22
30.48
8.95
55.53
121.47
23.75
105.07
–0.04 ...
+0.53 .285
–0.05 .30
+0.88.2625
–0.48 ...
+0.11 ...
+0.06 .16
+0.01 .35
+0.32 .30
+0.23 .24
+0.57 .85
–3.02 1.10
–0.81 .39
–0.17 .22
+0.51.3784
–0.57.0165
–1.62 .535
–0.15 ...
–6.93 .48
+1.05 .58
–0.28 ...
–4.01 .07
–6.03 ...
+1.68.4175
+0.01 ...
–0.34 ...
–1.75 2.58
–0.17 ...
+0.19 .25
–2.32 .53
+0.95 ...
+0.06 ...
–6.65 1.25
+1.12.3658
+1.32 ...
–0.50 .15
+3.971.0358
–0.75 ...
... ...
–3.08 ...
+0.27 ...
+0.57 .11
–0.13 .71
–0.74.1875
+0.32 1.10
126.75
340.49
10.39
8.58
1.15
8.79
10.88
51.37
18.52
23.12
26.53
0.82
76.61
31.69
55.60
10.11
2.97
15.00
193.68
7.21
21.48
3.85
11.51
3.96
22.35
6.65
33.56
10.16
45.33
20.50
48.66
40.34
43.67
3.71
34.35
9.31
35.26
28.50
21.28
6.78
1.03
63.75
7.25
10.60
30.56
52.90
12.43
0.34
5.16
52.89
526.11
39.27
52.79
25.84
SAP
S&P Global
SDCLEDGEAcqn
SeacorMarine
SES AI
SFL
SITE Centers
SJW Group
SK Telecom
SLGreenRealty
SM Energy
SOS
SPX Tech
STAG Indl
SabineRoyalty
SableOffshoreA
SafeBulkers
Safehold
Salesforce
SallyBeauty
Samsara
SanJuanBasin
SandRidgeEnergy
SandstormGold
SaratogaInvt
Sasol
SaulCenters
SaversValue
Schlumberger
SchneiderNatl
SchwabC
ScorpioTankers
ScottsMiracleGro
ScullyRoyalty
Sea
SeabridgeGold
Seadrill
SealedAir
SelectMedical
SelectWater
SelectQuote
Sempra
Semrush
SendasDistrib
SensataTech
SensientTech
SentinelOne
SequansComms
SeritageGrowth
ServiceIntl
ServiceNow
ServisFirst
ShakeShack
SharkNinja
SAP .9
SPGI .9
SEDA ...
SMHI ...
SES ...
SFL 7.5
SITC 3.6
SJW 2.9
SKM 5.6
SLG 5.7
SM 1.4
SOS ...
SPXC ...
STAG 4.2
SBR 8.8
SOC ...
SB 3.5
SAFE 3.7
CRM .7
SBH ...
IOT
...
SJT 8.5
SD 3.0
SAND 1.0
SAR 12.2
SSL 7.4
BFS 6.5
SVV ...
SLB 2.4
SNDR 1.7
SCHW 1.4
STNG 1.9
SMG 3.8
SRL ...
SE
...
SA
...
SDRL ...
SEE 2.1
SEM 1.4
WTTR 2.1
SLQT ...
SRE 3.2
SEMR ...
ASAI ...
ST 1.2
SXT 2.1
S
...
SQNS ...
SRG ...
SCI 1.7
NOW ...
SFBS 1.9
SHAK ...
SN
.0
cc
48
dd
dd
dd
...
14
21
9
dd
8
dd
42
35
11
dd
8
dd
42
8
dd
10
11
79
33
29
21
33
15
25
31
8
dd
94
cc
dd
13
16
16
17
dd
17
cc
22
dd
36
dd
...
dd
21
70
17
cc
57
182.44
427.51
11.08
13.16
1.25
14.31
14.42
54.71
20.68
52.97
50.43
.91
139.42
35.06
65.72
15.39
5.67
19.28
234.44
12.18
33.93
4.04
13.96
5.68
23.74
6.82
36.39
13.56
45.89
22.48
73.28
82.07
69.69
6.54
67.52
15.85
51.87
38.87
34.55
10.93
3.12
77.03
15.26
11.66
41.32
77.67
16.83
.78
5.26
71.66
656.93
61.80
94.89
76.62
–12.942.3852
–10.73 .91
... ...
–0.28 ...
... ...
+0.16 .27
+0.21 .13
–0.64 .40
–0.53.3482
+2.29 .25
+2.37 .18
–0.06 ...
–4.92 ...
–0.05.1233
+2.48.5977
+0.76 ...
+0.27 .05
–0.05 .177
–37.85 .40
+0.98 ...
–5.44 ...
–0.10.0229
+0.32 .11
–0.12.0149
+0.06 .74
–0.40.5248
+0.14 .59
+0.66 ...
–0.35 .275
+0.20 .095
+1.01 .25
+0.68 .40
+4.18 .66
+0.48 ...
–4.46 ...
+1.09 ...
+1.30 ...
+1.64 .20
+1.62 .125
+0.33 .06
+0.11 ...
+1.19 .62
–0.60 ...
–0.95 ...
–0.53 .12
+2.21 .41
–4.79 ...
+0.10 ...
–0.36 ...
–0.18 .30
–81.58 ...
–0.89 .30
–2.62 ...
–0.26 1.08
Name
Tick
Sym Yld P/E
S
199.29
461.16
11.54
15.24
3.21
14.62
14.71
76.78
22.71
57.34
53.26
9.50
145.65
39.61
72.50
15.50
5.68
26.82
318.71
13.91
42.28
8.59
17.19
6.07
28.87
14.49
41.04
26.88
62.12
31.74
79.49
83.33
77.95
8.23
74.33
16.71
53.58
47.12
35.08
10.98
3.22
78.83
16.42
15.25
47.41
78.70
30.76
2.97
9.92
75.97
815.32
70.84
111.29
78.90
–52-Week–
High
Low
74.61
348.37
92.30
38.65
91.57
58.42
7.78
109.53
49.72
43.95
11.32
9.76
157.82
218.38
13.50
188.01
27.61
28.99
71.52
5.74
35.40
14.78
86.71
25.98
4.12
52.81
89.96
32.28
32.82
156.03
17.90
298.49
237.72
81.50
8.48
11.33
13.43
6.67
96.05
64.68
34.26
63.74
100.94
87.77
80.23
129.79
39.53
78.47
7.80
96.74
51.83
19.40
68.04
36.34
19.69
319.30
17.14
47.30
8.40
44.29
65.99
41.71
184.18
104.21
87.53
22.29
79.90
48.00
14.54
29.51
29.04
7.79
100.47
254.00
36.30
66.66
84.23
55.85
24.51
73.33
361.41
9.11
56.20
22.33
13.12
7.26
44.89
36.00
141.52
55.46
11.48
41.50
12.55
24.56
64.89
11.59
4.00
4.57
5.00
12.98
34.45
72.36
56.31
232.06
42.91
24.99
45.50
33.80
3.85
57.10
38.11
24.65
10.08
4.58
102.11
120.93
8.47
116.81
19.95
18.29
45.58
3.05
5.09
3.96
52.12
19.00
2.20
35.52
64.14
21.53
23.26
106.32
8.28
249.84
133.59
38.50
4.35
6.59
8.83
1.74
56.72
41.19
6.89
49.98
75.11
63.36
61.56
67.64
21.91
56.17
4.80
65.27
23.24
2.80
53.77
14.65
3.18
129.23
10.93
28.04
3.09
26.70
44.13
29.42
130.04
76.26
59.11
17.07
62.78
33.12
6.65
15.59
20.32
1.16
63.60
195.47
18.85
38.40
54.81
37.21
14.63
35.61
249.98
4.22
42.00
14.42
8.16
5.31
29.98
13.00
102.74
44.57
6.98
28.07
3.10
3.37
42.96
8.61
2.63
2.49
0.30
8.90
8.64
37.59
Name
Shell
SherwinWilliams
Shift4Paymts
ShinhanFin
Shopify
Shutterstock
Sibanye-Stillwater
SignetJewelers
SilganHoldings
SilverBowRscs
SilverBoxIIIA
Similarweb
SimonProperty
SimpsonMfg
SiriusPoint
SiteOneLandscape
SitioRoyalties
SixFlags
SkechersUSA
SkeenaRscs
Skillsoft
Skillz
SkylineChamp
SmartFinancial
SmartRent
Smartsheet
SmithAO
Smith&Nephew
SmithDouglas
Smucker
Snap
Snap-On
Snowflake
SOQUIMICH
SohoHouse
SolarisOilfield
SolarWinds
SoloBrands
Solventum
SonicAutomotive
SonidaSrLiving
SonocoProducts
Sony
SouthState
Southern
SoCopper
SouthwestAir
SouthwestGas
SouthwesternEner
SpectrumBrands
SphereEnt
SpireGlobal
Spire
SpiritAeroSys
SpiritAirlines
Spotify
Sprinklr
Sprott
SprucePower
Squarespace
St.Joe
StandardMotor
StandexIntl
StanleyBlackDck
Stantec
StarwoodProp
StateStreet
SteelPartners
Steelcase
Stellantis
StellarBancorp
Stem
Stepan
Steris
Stevanato
StewartInfo
StifelFinancial
STMicroelec
Stoneridge
Stride
Stryker
StudioCity
SturmRuger
SuburbanPropane
SumitomoMits
SummitHotelProp
SummitMaterials
SummitMidstream
SunComms
SunLifeFinancial
SunCokeEnergy
SuncorEnergy
SunlandsTech
SunnovaEnergy
Sunoco
SunstoneHotel
SuperGroup
SuperiorIndsIntl
SurfAirMobility
Suzano
Sweetgreen
Sylvamo
B A R R ON S .C OM / D ATA
Tick
Sym Yld P/E
SHEL 3.7
SHW .9
FOUR ...
SHG 3.6
SHOP ...
SSTK 3.0
SBSW 3.5
SIG 1.1
SLGN 1.6
SBOW ...
SBXC ...
SMWB ...
SPG 5.3
SSD .7
SPNT ...
SITE ...
STR 7.7
SIX
...
SKX ...
SKE ...
SKIL ...
SKLZ ...
SKY ...
SMBK 1.4
SMRT ...
SMAR ...
AOS 1.5
SNN 2.9
SDHC ...
SJM 3.8
SNAP ...
SNA 2.7
SNOW ...
SQM 2.9
SHCO ...
SOI 5.2
SWI ...
DTC ...
SOLV ...
SAH 2.1
SNDA ...
SON 3.4
SONY .5
SSB 2.7
SO 3.6
SCCO 3.2
LUV 2.7
SWX 3.2
SWN ...
SPB 1.9
SPHR ...
SPIR ...
SR 4.9
SPR ...
SAVE .0
SPOT ...
CXM ...
SII 2.2
SPRU ...
SQSP ...
JOE .8
SMP 3.8
SXI
.7
SWK 3.7
STN .8
STWD 9.9
STT 3.7
SPLP ...
SCS 2.9
STLA ...
STEL 2.3
STEM ...
SCL 1.7
STE .9
STVN .3
STC 3.0
SF
2.1
STM .7
SRI
...
LRN ...
SYK .9
MSC ...
RGR 2.1
SPH 6.4
SMFG 2.2
INN 5.2
SUM ...
SMLP ...
SUI 3.2
SLF 4.6
SXC 3.8
SU 3.9
STG ...
NOVA ...
SUN 6.9
SHO 2.9
SGHC ...
SUP ...
SRFM ...
SUZ 1.9
SG
...
SLVM 2.5
13
32
45
6
dd
16
dd
7
17
5
41
dd
19
21
8
45
dd
81
19
dd
dd
dd
27
15
dd
dd
22
42
...
dd
dd
14
dd
34
dd
13
cc
dd
...
12
dd
16
15
13
21
39
44
29
dd
2
3
dd
15
dd
dd
dd
61
26
dd
dd
41
11
27
dd
35
14
14
6
20
3
10
dd
53
59
37
42
18
11
dd
16
39
dd
19
12
13
dd
17
5
cc
13
15
9
1
dd
11
11
...
dd
dd
7
dd
15
Last
Div
Chg. Amt.
72.78
303.80
67.28
34.40
59.15
40.63
5.07
109.49
47.25
39.20
10.57
7.69
151.31
165.92
13.15
154.82
23.43
25.45
71.42
4.44
9.66
6.83
69.61
23.14
2.36
37.00
83.64
25.33
25.79
111.64
15.02
272.86
136.18
46.70
5.12
9.16
11.58
1.95
59.34
56.67
27.64
61.37
82.34
77.31
80.14
118.63
26.84
77.59
7.53
89.74
36.50
9.15
61.29
30.32
3.65
296.78
11.21
44.88
3.41
44.00
56.60
30.71
168.21
87.17
80.68
19.44
75.59
39.00
13.66
22.27
22.59
1.33
87.17
222.88
20.32
63.31
80.95
41.97
15.87
68.66
341.09
7.75
44.44
20.33
13.11
6.12
38.64
32.53
117.99
50.13
10.55
40.82
7.17
5.22
51.00
10.28
3.63
3.53
.34
9.35
30.75
71.32
+1.96 .688
–1.04 .715
–1.01 ...
–0.60.3021
+2.18 ...
+3.44 .30
–0.15.1102
+6.75 .29
+0.53 .19
+0.85 ...
+0.02 ...
–0.40 ...
+3.432.00
–7.09 .28
+0.18 ...
+0.50 ...
+0.67 .41
–0.72 ...
+3.13 ...
–0.09 ...
+0.41 ...
+0.51 ...
–2.07 ...
–0.06 .08
–0.20 ...
–2.68 ...
–1.14 .32
+0.46 .462
–0.47 ...
+1.87 1.06
–0.20 ...
+1.97 1.86
–19.98 ...
–2.75.5035
–0.22 ...
+0.24 .12
–0.39 ...
+0.09 ...
–1.11 ...
+0.07 .30
–3.11 ...
+0.76 .52
+2.05.2715
+0.12 .52
+2.39 .72
+1.12 .80
... .18
+1.40 .62
+0.14 ...
–2.59 .42
+1.03 ...
+0.15 ...
+1.61 .755
–0.76 ...
–0.08 .10
–11.38 ...
–0.85 ...
–0.99 .25
–0.10 ...
+0.47 ...
+0.31 .12
+0.36 .29
–1.00 .30
+1.04 .81
–0.97.1531
+0.50 .48
+0.20 .69
–0.50 ...
+0.48 .10
–0.04 ...
–0.30 .13
+0.03 ...
+0.44 .375
–6.29 .52
+0.35.0578
–1.21 .475
–0.12 .42
+0.08 .09
–0.17 ...
–2.25 ...
+5.55 .80
–0.27 ...
+0.89 .16
+1.20 .325
+0.55 .182
+0.10 .08
–0.82 ...
+0.24 ...
+0.84 .94
–0.92.5771
–0.08 .10
+0.52.3984
–2.23 ...
+0.91 ...
+1.02.8756
–0.04 .09
–0.21 ...
–0.16 ...
+0.01 ...
–0.16.3429
–1.77 ...
–0.82 .45
–52-Week–
High
Low
Name
46.72 27.30 SynchronyFinl
40.92 24.40 SynovusFinl
82.89 62.24 Sysco
4.86 1.04 System1
Tick
Sym Yld P/E
Last
Div
Chg. Amt.
SYF 2.3 6 43.80 +0.47 .25
SNV 3.8 14 39.69 +0.45 .38
SYY 2.8 18 72.82 –0.13 .51
SST ... dd 1.28 –0.19 ...
T
15.52
41.85
10.42
131.09
152.79
17.37
19.66
16.69
45.58
162.13
19.14
104.98
118.04
8.96
23.56
160.78
16.39
17.59
29.98
48.80
119.68
181.86
45.76
62.64
11.25
27.30
55.13
59.76
9.95
74.20
18.98
30.41
9.97
448.19
262.97
11.43
4.62
28.26
21.75
57.13
40.73
15.77
135.75
124.11
57.73
65.89
1.84
66.63
6.77
17.13
666.67
97.34
603.82
35.93
176.03
129.31
11.09
106.04
111.42
9.50
95.08
15.33
27.90
135.37
37.95
452.87
20.75
106.68
66.15
6.86
11.43
74.97
13.57
255.23
6.70
338.09
10.40
43.40
1363.66
8.88
20.59
82.75
49.02
232.75
7.81
54.52
101.91
40.98
134.67
31.59
18.63
18.08
12.70
11.15
17.27
19.98
5.54
32.52
4.22
87.68
115.00
13.18
15.35
5.54
35.22
102.94
13.81
77.20
72.33
4.64
17.20
84.02
12.77
11.30
20.34
25.99
69.44
102.93
32.67
37.23
5.05
14.12
34.38
28.21
5.64
35.00
14.80
11.00
4.50
355.41
177.63
8.13
3.72
17.38
6.44
35.46
26.25
5.70
51.04
72.81
31.48
43.70
0.62
50.42
2.67
7.12
422.07
62.89
415.60
22.82
117.46
79.13
3.32
71.35
42.62
5.35
65.71
8.01
13.77
68.08
28.22
209.60
9.84
77.15
54.12
1.21
10.30
54.94
8.00
145.00
1.97
168.84
5.94
27.19
779.34
4.45
9.50
42.09
32.10
157.33
3.98
33.28
53.59
24.18
90.55
20.04
2.59
11.75
8.88
10.41
7.00
10.08
TAL Education
TC Energy
TDCX
TD Synnex
TE Connectivity
Tegna
Telus
TelusIntl
Ternium
TFI Intl
TIM
TJX
TKO
TPG RE Fin
TXO Partners
TaiwanSemi
TakedaPharm
TalosEnergy
Tanger
Tapestry
TargaResources
Target
TaroPharm
TaylorMorrison
Team
TechnipFMC
TeckResourcesB
Tecnoglass
Teekay
TeekayTankers
TejonRanch
TeladocHealth
TelecomArgentina
TeledyneTech
Teleflex
TelefonicaBras
Telefonica
TelekmIndonesia
Telephone&Data
TempurSealy
Tenaris
TencentMusic
TenetHealthcare
Tennant
Teradata
Terex
TerranOrbital
TerrenoRealty
TetraTech
TevaPharm
TexasPacLand
Textron
ThermoFisher
Thermon
ThomsonReuters
ThorIndustries
3D Systems
3M
Tidewater
Tilly's
Timken
TItanIntl
Toast
TollBros
TootsieRoll
TopBuild
TopgolfCallaway
Toro
TorontoDomBk
Torrid
TortoiseEcoIII A
TotalEnergies
TownsquareMedia
ToyotaMotor
Traeger
TraneTech
Transalta
TrancntlRlty
TransDigm
Transocean
TransportadGas
TransUnion
Travel+Leisure
Travelers
Tredegar
TreeHouseFoods
Trex
TriPointe
TriNet
TrinityIndustries
Trinseo
TripleFlagPrecMtl
TriplePtVent
TristarAcqnI
TriumphGroup
Tronox
TAL ...
TRP 7.3
TDCX ...
SNX 1.2
TEL 1.7
TGNA 3.4
TU 6.6
TIXT ...
TX 5.1
TFII 1.2
TIMB 7.0
TJX 1.5
TKO .4
TRTX11.2
TXO 12.1
TSM 1.1
TAK 4.1
TALO ...
SKT 4.0
TPR 3.2
TRGP 2.5
TGT 2.8
TARO ...
TMHC ...
TISI ...
FTI
.8
TECK .7
TGLS .8
TK
...
TNK 1.4
TRC ...
TDOC ...
TEO ...
TDY ...
TFX .7
VIV 5.2
TEF 5.2
TLK 9.4
TDS 3.8
TPX 1.0
TS
.0
TME .8
THC ...
TNC 1.1
TDC ...
TEX 1.1
LLAP ...
TRNO 3.2
TTI
...
TEVA ...
TPL .8
TXT .1
TMO .3
THR ...
TRI 1.3
THO 1.9
DDD ...
MMM 2.8
TDW ...
TLYS ...
TKR 1.6
TWI ...
TOST ...
TOL .8
TR 1.2
BLD ...
MODG ...
TTC 1.8
TD 5.3
CURV ...
TRTL ...
TTE ...
TSQ 7.2
TM 2.0
COOK ...
TT 1.0
TAC 2.3
TCI
...
TDG .0
RIG
...
TGS ...
TRU .6
TNL 4.6
TRV 1.9
TG
.0
THS ...
TREX ...
TPH ...
TNET 1.0
TRN 3.6
TSE 1.0
TFPM 1.3
TPVG17.1
TRIS ...
TGI
...
TROX 2.5
...
20
11
19
14
5
43
28
13
24
13
26
dd
dd
dd
29
42
cc
31
12
24
18
30
8
dd
55
23
15
6
5
cc
dd
26
21
34
13
dd
11
dd
25
5
31
5
17
79
8
dd
30
23
dd
33
19
36
22
33
20
dd
dd
41
dd
17
9
dd
8
22
21
44
29
13
60
44
8
dd
9
dd
35
5
51
53
dd
36
dd
8
16
dd
92
37
10
17
21
dd
90
dd
42
2
dd
11.36
38.56
7.08
130.84
149.70
14.91
16.45
5.73
43.18
132.28
15.23
103.10
109.07
8.58
21.48
151.04
13.35
12.01
27.75
43.49
118.23
156.16
42.82
57.83
8.57
26.19
52.05
52.61
9.79
72.83
18.23
11.24
8.76
396.95
209.07
8.37
4.62
17.97
19.89
51.36
32.97
14.45
135.22
102.66
32.61
59.67
.92
56.58
3.71
16.93
614.31
87.61
567.98
33.76
172.11
99.24
3.52
100.14
103.33
5.77
86.89
8.27
24.23
121.64
29.26
417.95
15.65
80.19
55.92
6.71
10.90
73.12
11.01
217.51
2.59
327.46
7.20
29.21
1343.23
6.20
19.64
71.92
43.94
215.70
5.45
36.31
86.48
38.73
103.97
31.45
3.83
16.51
9.37
11.09
14.11
19.81
–0.07 ...
+0.17.7003
–0.01 ...
+0.59 .40
–1.17 .65
+0.57 .125
+0.17.2836
–0.09 ...
–0.06 2.20
–1.20 .40
–0.74.0821
+0.96 .375
+1.58 3.86
+0.20 .24
+0.29 .65
–8.96.4865
+0.23.3005
+0.60 ...
+0.38 .275
+1.19 .35
+3.95 .75
+10.93 1.10
+0.13 ...
+0.14 ...
+0.81 ...
+0.35 .05
+0.69.0911
–3.34 .11
... ...
+0.332.00
–0.23 ...
–0.24 ...
+0.53 ...
–5.54 ...
+2.72 .34
–0.49.0373
+0.17.1628
–0.341.1296
+1.12 .04
+1.51 .13
–0.63 .80
–0.35 .137
+4.09 ...
+0.14 .28
+0.76 ...
–1.30 .17
–0.03 ...
+0.62 .45
+0.04 ...
+0.33 ...
+3.05 1.17
–1.02 .02
–16.07 .39
–1.92 ...
–3.68 .54
+3.60 .48
+0.02 ...
+0.47 1.51
+0.53 ...
–0.06 ...
–0.19 .34
–0.09 ...
–1.23 ...
–1.27 .23
–0.75 .09
+8.37 ...
+0.67 ...
–3.04 .36
–0.64 .746
+0.60 ...
–0.01 ...
+1.60 ...
–0.10.1975
+0.672.8605
+0.33 ...
–10.46 .84
+0.10.0438
+1.20 ...
–7.0835.00
+0.43 ...
+1.66 ...
–4.37 .105
–0.21 .50
+2.37 1.05
... .13
+1.11 ...
–1.82 ...
+0.41 ...
–3.57 .25
+1.03 .28
+0.50 .01
–1.20.0525
–0.10 .40
–0.03 ...
+0.13 ...
+0.82 .125
June 3, 2024
D ATA
–52-Week–
High
Low
19.06
40.51
31.34
5.91
7.80
34.71
23.19
2.50
78.16
14.59
500.49
62.04
10.15
26.57
16.45
0.61
3.52
19.67
5.86
1.40
49.86
9.83
361.16
44.94
Name
TrueBlue
TruistFinl
TsakosEnergy
Tupperware
TurkcellIletism
TurningPoint
TutorPerini
Tuya
Twilio
TwoHarbors
TylerTech
TysonFoods
BARRON’S
NYSE
Tick
Sym Yld P/E
TBI
...
TFC 5.5
TNP 1.9
TUP ...
TKC 2.2
TPB .9
TPC ...
TUYA ...
TWLO ...
TWO14.0
TYL ...
TSN 3.4
dd
dd
3
dd
14
15
dd
dd
dd
8
cc
dd
Last
Div
Chg. Amt.
10.80
37.75
31.20
1.74
7.67
32.81
22.06
2.02
57.40
12.85
480.36
57.25
+0.03 ...
–0.65 .52
+0.31 .30
–0.12 ...
+0.63.2216
–0.05 .07
+0.39 ...
+0.03 ...
–1.65 ...
+0.28 .45
–11.69 ...
–2.46 .49
For personal non-commercial use only. Do not edit or alter. Reproductions not permitted.
To reprint or license content, please contact Barron's reprints department at 800-843-0008 or www.djreprints.com
U
32.13
44.02
29.76
73.03
71.52
43.85
16.85
55.26
28.47
69.60
56.97
55.98
124.11
16.03
7.75
82.14
189.52
27.87
6.35
9.50
8.99
8.97
187.22
54.98
258.66
8.12
8.97
27.76
192.98
61.30
732.37
45.85
50.20
554.70
50.08
67.80
49.64
189.95
22.38
17.09
54.57
18.79
20.04
19.26
30.95
20.19
48.07
45.05
33.15
13.26
41.43
18.89
41.45
13.79
35.66
78.08
10.09
4.49
38.61
103.00
11.71
3.40
6.18
5.86
5.41
150.50
46.16
194.13
2.60
6.71
8.58
133.58
40.87
347.23
30.47
20.90
436.38
18.03
44.40
32.27
119.90
11.16
6.26
41.75
13.47
11.17
UBS Group
UDR
UGI
U-Haul
U-Haul N
UL Solutions
UMH Prop
Unitil
USA Compression
UsanaHealth
US Cellular
US Foods
US PhysTherapy
US Silica
UWM
Uber
Ubiquiti
UiPath
UltraparPart
UnderArmour A
UnderArmour C
Unifi
Unifirst
Unilever
UnionPacific
Unisys
UnitedMicro
UnitedNatFoods
UPS B
UtdParks&Resorts
UnitedRentals
US Bancorp
US Steel
UnitedHealth
UnitySoftware
Universal
UniversalHealth
UniversalHealthB
UnivInsurance
UnvlTechInst
UnumGroup
UrbanEdgeProp
UtzBrands
UBS 2.2
UDR 4.4
UGI 5.9
UHAL ...
UHAL.B .3
ULS 1.3
UMH 5.7
UTL 3.2
USAC 8.6
USNA ...
USM ...
USFD ...
USPH 1.7
SLCA ...
UWMC 5.4
UBER ...
UI
1.7
PATH ...
UGP 2.7
UAA ...
UA
...
UFI
...
UNF .8
UL 3.3
UNP 2.2
UIS
...
UMC 5.2
UNFI ...
UPS 4.7
PRKS ...
URI .9
USB 4.8
X
.5
UNH 1.5
U
...
UVV 6.8
UHT 7.7
UHS .4
UVE 3.2
UTI
...
UNM 2.7
UE 3.8
UTZ 1.3
4
28
dd
21
20
30
dd
18
61
15
80
26
83
11
dd
cc
25
dd
9
14
14
dd
26
20
22
dd
12
dd
20
14
18
13
11
30
dd
10
32
16
8
44
8
8
dd
31.88
38.62
25.46
63.23
60.79
38.57
15.12
53.49
24.50
47.60
55.46
52.83
102.57
15.49
7.37
64.56
143.16
12.26
4.43
7.19
6.96
6.55
158.60
54.75
232.82
4.29
8.50
12.01
138.93
52.29
669.41
40.55
38.35
495.37
18.27
47.96
37.58
189.80
19.71
15.81
53.86
17.73
18.54
+1.01 .70
–0.34 .425
+1.40 .375
–0.99 ...
–0.92 .05
–3.42 .125
+0.10 .215
+2.00 .425
+0.64 .525
+0.89 ...
+12.48 ...
–0.51 ...
+0.74 .44
–0.02 ...
+0.11 .10
+0.30 ...
–2.39 .60
–6.72 ...
–0.22.0723
+0.54 ...
+0.46 ...
–0.06 ...
–3.91 .33
+0.19.4556
+0.77 1.30
–0.17 ...
–0.06 .586
+0.19 ...
+0.27 1.63
+1.82 ...
–4.14 1.63
+0.02 .49
+2.44 .05
–12.80 1.88
–1.13 ...
+1.96 .81
+0.24 .725
+13.43 .20
+0.14 .16
+0.46 ...
+1.19 .365
+0.77 .17
+0.44 .059
11.00
26.63
4.82
4.94
3.93
37.04
3.55
182.63
55.53
11.52
1.91
105.75
10.80
188.63
29.15
9.28
162.72
0.15
8.96
39.33
65.51
6.03
13.07
30.14
9.82
0.51
19.36
8.92
22.72
0.20
13.62
25.71
1.00
13.90
0.70
3.50
168.78
221.02
20.83
27.94
21.57
23.33
VF
VICI Prop
Vizio
VOC Energy
VTEX
V2X
VaalcoEnergy
VailResorts
Valaris
Vale
ValensSemicon
ValeroEnergy
Valhi
ValmontInds
Valvoline
VectorGroup
VeevaSystems
Velo3D
VelocityFinl
Ventas
Veralto
Veren
VerisResidential
Verizon
VermilionEnergy
VerticalAerospace
Vertiv
Vestis
Viad
VicariousSurgical
Victoria'sSecret
Viking
VinceHolding
Vipshop
VirginGalactic
VirnetX
VirtusInvtPtrs
Visa
Vishay
VishayPrecision
VistaEnergy
VistaOutdoor
VFC 2.7
VICI 5.8
VZIO ...
VOC 15.4
VTEX ...
VVX ...
EGY 3.9
MTN 4.7
VAL ...
VALE10.9
VLN ...
VLO 2.7
VHI 1.6
VMI 1.0
VVV ...
VGR 7.3
VEEV ...
VLD ...
VEL ...
VTR 3.6
VLTO .4
VRN 3.4
VRE 1.6
VZ 6.5
VET 2.1
EVTL ...
VRT .0
VSTS 1.1
VVI
...
RBOT ...
VSCO ...
VIK
...
VNCE ...
VIPS 2.6
SPCE ...
VHC ...
VRTS 3.3
V
.8
VSH 1.7
VPG ...
VIST ...
VSTO ...
dd
11
cc
6
...
dd
11
32
7
7
dd
8
cc
32
32
9
51
dd
11
dd
30
dd
dd
15
dd
dd
94
...
dd
dd
17
...
1
7
dd
dd
14
31
14
19
14
dd
13.28
28.71
10.74
5.22
6.86
48.11
6.38
188.72
77.40
12.05
2.69
157.14
19.45
251.40
40.60
10.97
174.25
.15
18.50
50.26
98.58
8.71
15.29
41.15
12.38
.70
98.07
12.32
34.95
.32
22.79
31.41
2.00
16.07
.86
4.12
228.59
272.46
23.63
33.77
48.45
34.88
+0.94 .09
+0.41 .415
+0.12 ...
–0.25 .18
–0.15 ...
+2.06 ...
+0.43.0625
–3.28 2.22
+4.41 ...
–0.55.1541
–0.03 ...
–5.28 1.07
+0.44 .08
–1.39 .60
+0.07 ...
+0.13 .20
–29.64 ...
–0.05 ...
+0.31 ...
+2.76 .45
–3.61 .09
+0.30.0854
+0.33 .06
+1.41 .665
+0.43.0872
–0.01 ...
–8.10 .025
+0.31 .035
+0.90 ...
–0.04 ...
+2.03 ...
+1.73 ...
+0.29 ...
+0.13 .41
+0.01 ...
–0.01 ...
–4.05 1.90
–2.03 .52
–0.37 .10
+0.87 ...
+4.13 ...
–0.02 ...
V
21.17
33.40
11.28
10.65
9.59
56.75
7.51
258.13
78.92
16.08
2.80
184.79
20.00
303.57
45.37
13.43
236.90
2.50
19.08
50.99
102.58
9.28
18.98
43.42
15.98
2.09
109.27
22.37
39.98
2.37
30.80
32.49
5.20
20.19
6.17
13.60
263.39
290.96
30.10
38.56
49.58
36.37
33
NASDAQ ISSUES
–52-Week–
High
Low
107.24
62.87
27.39
45.62
32.21
77.00
276.58
Last
Div
Chg. Amt.
24.46
40.00
19.63
28.85
13.65
63.02
190.51
Vistra
VitalEnergy
VitesseEnergy
Vontier
VornadoRealty
VoyaFinancial
VulcanMatls
VST
VTLE
VTS
VNT
VNO
VOYA
VMC
.9
...
7.9
.3
.0
2.1
.7
64
2
33
14
cc
11
37
99.08
48.85
25.52
39.98
24.52
75.82
255.77
–3.02.2175
+0.94 ...
+0.54 .525
–0.41 .025
+1.08 .30
+1.73 .40
–3.48 .46
2.11
75.13
161.95
9.65
39.85
50.28
41.13
20.09
94.38
62.51
1.21
49.03
9.83
34.15
126.12
149.71
0.94
231.90
328.97
162.95
38.37
6.67
36.22
58.87
38.39
75.22
122.30
64.11
310.42
34.45
25.47
10.92
107.34
27.12
8.91
28.24
38.37
0.98
84.18
1350.00
8.84
2.31
28.84
28.35
29.37
114.80
55.88
4.48
6.06
20.63
7.21
17.37
24.94
75.22
17.69
35.38
21.00
65.54
W&T Offshore
WEC Energy
WEX
WKKellogg
WNS
W.P.Carey
WPP
WabashNational
Wabtec
Walker&Dunlop
Wallbox
Walmart
WarbyParker
WarriorMetCoal
WasteConnections
WasteMgt
Waterdrop
Waters
Watsco
WattsWater
Wayfair
WeaveComms
WebsterFin
WeisMarkets
WellsFargo
Welltower
WescoIntl
WestFraserTimber
WestPharmSvcs
WestAllianceBcp
WesternMidstrm
WesternUnion
Westlake
WestRock
Westwood
Weyerhaeuser
WheatonPrecMtls
WheelsUp
Whirlpool
WhiteMtnIns
WhitestoneREIT
WideOpenWest
Wiley A
Wiley B
Williams
Williams-Sonoma
Winnebago
Wipro
WisdomTree
Wolfspeed
WolverineWwide
WoodsideEnergy
WooriFinl
Workiva
WorldKinect
WorthingtonEnts
WorthingtonSteel
WyndhamHtls
WTI 1.8
WEC 4.1
WEX ...
KLG 3.4
WNS ...
WPC 6.1
WPP 4.7
WNC 1.4
WAB .5
WD 2.7
WBX ...
WMT 1.3
WRBY ...
HCC .5
WCN .7
WM 1.4
WDH .0
WAT ...
WSO 2.3
WTS .9
W
...
WEAV ...
WBS 3.6
WMK 2.1
WFC 2.3
WELL 2.4
WCC .9
WFG 1.5
WST .2
WAL 2.3
WES 9.4
WU 7.3
WLK 1.2
WRK 2.3
WHG 4.9
WY 2.7
WPM 1.1
UP
...
WHR 7.5
WTM .1
WSR 3.8
WOW ...
WLY 3.8
WLYB 3.9
WMB 4.6
WSM 1.5
WGO 2.0
WIT .4
WT 1.2
WOLF ...
WWW 2.9
WDS 7.4
WF 6.8
WK
...
WKC 2.6
WOR 1.1
WS 1.9
WH 2.1
dd
18
30
14
18
21
84
5
33
35
dd
28
dd
8
53
34
23
30
37
25
dd
dd
9
17
13
cc
15
dd
44
9
11
8
81
45
8
27
42
dd
13
8
27
dd
dd
dd
18
18
19
21
17
dd
dd
21
4
dd
28
10
...
25
2.23
81.03
187.32
18.99
50.21
56.40
52.34
22.61
169.23
95.99
1.53
65.76
17.71
68.43
164.32
210.73
1.38
308.90
474.90
199.13
59.49
8.65
44.22
65.55
59.92
103.67
179.49
80.01
331.41
63.03
37.32
12.80
160.56
53.64
12.14
30.03
55.11
2.69
93.03
1807.00
13.04
5.03
36.45
36.10
41.51
293.22
62.05
5.15
9.97
25.70
13.62
18.50
31.11
76.97
26.34
57.03
32.99
70.76
–0.02 .01
+0.33 .835
–0.44 ...
–0.52 .16
–0.77 ...
–0.38 .865
–0.21 1.54
+0.30 .08
–0.47 .20
+0.76 .65
+0.02 ...
+0.38.2075
+0.46 ...
+2.15 .08
–1.15 .285
+1.92 .75
–0.08 .032
–27.56 ...
–14.64 2.70
–9.37 .43
–1.69 ...
–0.20 ...
–0.11 .40
–0.12 .34
–0.29 .35
+2.80 .61
–11.69.4125
–1.79 .30
–0.25 .20
+0.07 .37
–0.04 .875
–0.05 .235
+2.00 .50
–0.49.3025
–0.49 .15
–0.17 .20
–1.30 .155
+0.05 ...
+6.51 1.75
+76.87 1.00
+0.29.0413
+0.33 ...
–1.45 .35
–2.10 .35
+1.38 .475
+5.41 1.13
+2.19 .31
–0.30.0107
+0.08 .03
–0.57 ...
+0.17 .10
–0.11 .60
–1.091.1918
–2.53 ...
+1.37 .17
+0.04 .32
–0.18 .16
+0.41 .38
3.41
47.35
10.90
1.92
6.55
7.91
7.40
87.59
33.88
9.57
4.07
1.99
33.35
4.84
2.10
2.94
115.53
33.55
22.26
6.39
8.70
15.90
10.19
0.70
7.24
0.78
3.12
102.00
9.07
144.80
7.05
23.47
XFinancial
XPO
XeniaHotels
XinyuanRealEst
XPeng
Xperi
XponentialFit
Xylem
Yeti
YPF
Yalla
YatsenHolding
Yelp
Yext
YirenDigital
Youdao
Yum!Brands
YumChina
Zeekr
ZimIntShipping
ZKH
ZTO Express
ZalatorisAcqn
ZeppHealth
ZetaGlobal
ZeviaPBC
Zhihu
ZimmerBiomet
ZipRecruiter
Zoetis
Zuora
ZurnElkayWater
XYF 3.9
XPO ...
XHR 3.0
XIN ...
XPEV ...
XPER ...
XPOF ...
XYL 1.0
YETI ...
YPF ...
YALA ...
YSG ...
YELP ...
YEXT ...
YRD ...
DAO ...
YUM 2.0
YUMC 1.8
ZK
...
ZIM 1.0
ZKH ...
ZTO 2.7
TCOA ...
ZEPP ...
ZETA ...
ZVIA ...
ZH
...
ZBH .8
ZIP
...
ZTS 1.0
ZUO ...
ZWS 1.0
1
53
73
dd
dd
dd
cc
50
20
dd
7
dd
24
dd
1
dd
24
18
dd
dd
dd
16
64
dd
dd
dd
dd
25
28
33
dd
44
4.15
106.98
14.49
3.09
8.31
8.81
9.06
141.02
40.74
23.21
4.70
3.40
36.97
5.05
4.84
3.73
137.43
35.76
25.20
22.54
9.46
22.79
11.03
.76
16.33
.85
3.26
115.15
10.11
169.56
10.15
31.31
+0.38 .30
–1.39 ...
+0.28 .12
–0.30 ...
+0.11 ...
–0.35 ...
–0.04 ...
–3.23 .36
+2.53 ...
+2.20 ...
–0.15 ...
... ...
+0.59 ...
–0.11 ...
+0.15 ...
+0.06 ...
–0.22 .67
+0.02 .16
+1.82 ...
+1.50 .23
+0.18 ...
–1.29 .37
... ...
–0.01 ...
–0.92 ...
–0.10 ...
–0.23 ...
–1.26 .24
+0.23 ...
–0.51 .432
+0.18 ...
–0.64 .08
Name
Tick
Sym Yld P/E
W
4.51
93.37
244.04
24.63
78.32
71.84
57.30
30.07
170.83
113.67
5.10
65.90
17.95
71.91
173.03
214.54
2.58
367.21
491.90
219.52
90.71
13.80
53.39
71.42
62.55
104.05
195.43
90.17
415.73
70.23
38.79
14.19
162.64
54.37
14.20
36.27
57.87
6.08
160.62
1899.21
13.12
9.06
40.23
39.59
41.89
348.51
75.42
6.45
10.01
70.42
15.81
25.84
36.17
116.00
26.83
69.96
40.15
81.73
XYZ
5.00
130.51
15.84
4.33
23.62
13.62
29.16
146.08
54.16
24.77
6.44
6.65
48.99
14.35
5.80
5.64
143.20
61.99
32.24
23.53
21.91
28.13
11.05
2.10
18.58
4.80
7.50
147.50
19.29
201.92
12.12
34.58
52-Week
High
Low
Name
Tick
Sym Yld P/E
Last
Div
Chg. Amt.
75.05
15.10
4.12
36.01
4.65
21.60
17.85
9.55
5.55
11.75
9.59
10.63
17.34
43.83
37.94
64.90
317.45
1.99
30.53
14.74
8.88
960.35
11.20
8.28
.95
1.57
24.34
1.48
3.81
3.92
14.00
4.21
5.58
57.69
68.89
7.08
1.77
.92
1.03
7.72
2.94
2.80
1.13
3.45
114.81
11.83
1.45
7.26
444.76
107.43
166.90
3.44
3.45
17.45
202.15
11.33
4.35
29.27
.38
16.65
95.47
36.34
2.46
10.26
10.32
13.50
144.93
4.11
4.17
92.24
18.82
2.15
65.41
10.67
4.92
7.66
26.77
257.21
7.88
3.05
27.43
23.40
1.25
.59
53.20
30.14
24.64
51.49
27.10
2.50
2.14
.75
148.43
29.31
.11
–3.21 .08
–0.10 ...
–0.01 ...
+0.59 ...
+1.11 ...
–0.96 ...
–1.24 ...
–0.01 ...
+0.28 .09
–0.74 .48
–0.05 .12
–2.54 ...
+0.91 ...
–0.76 .37
–0.06 .20
+3.58 ...
–13.66 ...
–0.03 ...
+1.17 .25
–0.85.1875
–0.10 ...
+4.131.6144
+0.04 ...
+3.54 ...
+0.10 ...
–0.04 ...
+0.80 .24
–0.03 ...
+0.35 ...
+0.07 ...
+0.14 ...
... ...
+0.03 ...
+4.41 .11
+5.31 ...
–0.29 ...
+0.26 ...
+0.01 ...
–0.08 ...
–0.23 ...
–0.46 ...
+0.22 ...
+0.08 ...
+0.01 ...
+3.20 ...
+0.03 .05
–0.04 ...
–3.24 ...
–30.67 ...
–2.03 .10
+0.54 ...
–0.02 ...
–0.17 ...
+0.36 ...
+2.38 ...
–0.07 ...
+0.16 ...
–0.76 ...
... ...
–1.68 ...
–8.58 ...
+4.84 ...
–0.12 ...
+0.01 ...
+0.01 ...
+0.01 ...
+0.46 ...
+0.60 ...
+0.19 ...
–1.90 ...
+0.50 ...
+0.19 ...
–1.70 ...
+0.01 ...
–0.07 ...
–0.25 .05
+1.55 .05
+1.59 ...
+0.72 ...
+0.10 ...
+0.03 ...
–0.62 ...
–0.17 ...
–0.04 ...
+5.10 .60
–0.47 ...
+1.33 .70
+1.54 .48
+0.40 .03
–0.02 ...
–0.06 ...
... ...
+0.67 ...
+0.97 ...
–0.02 ...
A
96.34
33.99
29.88
37.85
5.14
34.40
19.62
9.78
11.02
14.60
10.64
17.83
20.97
56.54
42.48
70.81
364.31
22.22
46.15
18.75
11.27
1056.34
12.02
9.40
1.65
2.85
41.03
1.65
5.64
8.05
17.02
6.72
5.73
75.73
87.77
15.36
4.30
1.76
11.12
14.03
11.31
4.38
2.05
9.08
115.10
13.39
5.81
19.30
638.25
126.38
227.30
4.95
8.99
32.42
205.28
12.43
8.95
52.48
11.39
22.48
105.00
39.70
3.50
10.27
10.34
24.96
170.10
9.94
14.32
129.17
58.38
8.80
77.29
11.85
9.07
10.25
31.00
413.20
9.20
4.38
29.28
32.88
5.64
1.83
130.93
53.05
24.85
56.26
40.59
6.05
3.34
6.12
218.88
35.40
0.49
52.24
14.60
3.91
19.56
1.90
9.36
12.84
3.06
4.34
10.41
6.81
3.94
9.87
43.13
23.14
46.13
258.01
1.92
28.73
10.27
2.55
564.00
10.48
1.97
0.78
1.02
18.20
0.88
1.89
3.58
8.00
1.11
3.43
42.83
62.04
6.33
1.46
0.74
0.59
3.19
1.81
1.10
0.42
2.28
78.35
8.11
1.10
6.75
417.74
81.86
93.12
1.83
2.75
9.41
89.14
10.49
2.24
12.81
0.29
11.95
63.08
19.80
2.32
10.05
10.15
11.62
112.32
3.21
1.34
86.94
11.25
1.88
48.01
10.17
3.66
6.35
23.22
176.34
4.46
2.46
14.11
20.46
0.98
0.54
46.90
23.64
17.40
45.15
25.12
2.23
1.19
0.58
141.98
19.38
0.01
AAON
AcadiaPharm
ACELYRIN
ACI Worldwide
AC Immune
ACM Research
ACV Auctions
ADMA Biologics
Adtran
AFC Gamma
AGNC Invt
AlxOncology
AMC Networks
Amerisafe
A-MarkPrecMet
ANI Pharm
Ansys
AN2 Therap
APA
ARKRestaurants
ARS Pharm
ASML
A SPAC II
AST Space
ATA Creativity
ATAI Life
ATN Intl
AVROBIO
AXT
AbCelleraBio
Abivax
Absci
AcaciaResearch
AcademySports
AcadiaHlthcr
Accolade
Accuray
AchillesTherap
AclarisTherap
AcrivonTherap
AcumenPharm
Adagene
Adaptimmune
AdaptiveBiotech
AddusHomeCare
Adeia
AdicetBio
AdlaiNortye
Adobe
AdvEnergyInds
AdvMicroDevices
AdvantageSolns
Aemetis
AerovateTherap
AeroVironment
AetheriumAcqnA
Affimed
AffirmA
AfricanAgriculture
Afya
Agilysys
AgiosPharm
Agora
Agric&NatSolnsA
AimeiHlthTech
AirTransportSvcs
Airbnb
AirSculptTech
AirshipAI
AkamaiTech
AkeroTherap
Akoya
Alarm.com
AlchemyInv1 A
Alector
AlgomaSteel
Alico
AlignTech
AlignmentHlthcr
AlimeraSciences
AlkamiTech
Alkermes
Allakos
Allbirds
AllegiantTravel
AllegroMicro
AllianceResource
AlliantEnergy
Allient
AllogeneTherap
Allot
AlloVir
AlnylamPharm
Alpha&Omega
AlphaStarRt
AAON .4
ACAD ...
SLRN ...
ACIW ...
ACIU ...
ACMR ...
ACVA ...
ADMA ...
ADTN 6.5
AFCG16.3
AGNC15.0
ALXO ...
AMCX ...
AMSF 3.4
AMRK 2.1
ANIP ...
ANSS ...
ANTX ...
APA 3.3
ARKR 5.1
SPRY ...
ASML .6
ASCB ...
ASTS ...
AACG ...
ATAI ...
ATNI 3.9
AVRO ...
AXTI ...
ABCL ...
ABVX ...
ABSI ...
ACTG ...
ASO .7
ACHC ...
ACCD ...
ARAY ...
ACHL ...
ACRS ...
ACRV ...
ABOS ...
ADAG ...
ADAP ...
ADPT ...
ADUS ...
ADEA 1.7
ACET ...
ANL ...
ADBE ...
AEIS .4
AMD ...
ADV ...
AMTX ...
AVTE ...
AVAV ...
GMFI ...
AFMD ...
AFRM ...
AAGR ...
AFYA ...
AGYS ...
AGIO ...
API
...
ANSC ...
AFJK ...
ATSG ...
ABNB ...
AIRS ...
AISP ...
AKAM ...
AKRO ...
AKYA ...
ALRM ...
ALCY ...
ALEC ...
ASTL 2.6
ALCO .7
ALGN ...
ALHC ...
ALIM ...
ALKT ...
ALKS ...
ALLK ...
BIRD ...
ALGT 4.5
ALGM ...
ARLP11.4
LNT 3.7
ALNT .4
ALLO ...
ALLT ...
ALVR ...
ALNY ...
AOSL ...
ALSAR ...
35
dd
dd
27
dd
16
dd
dd
dd
23
11
dd
5
14
12
38
64
dd
3
dd
dd
49
57
dd
dd
dd
dd
2
dd
dd
dd
dd
19
9
dd
dd
dd
dd
dd
dd
dd
dd
dd
dd
29
34
dd
...
42
40
cc
dd
dd
dd
dd
...
dd
dd
dd
16
30
dd
...
81
cc
21
19
cc
6
23
dd
dd
39
34
dd
83
5
42
dd
dd
dd
9
dd
dd
17
38
5
19
18
dd
dd
dd
dd
dd
...
Nasdaq Issues includes stocks traded on the Nasdaq
Global Select and Nasdaq Global Market tiers. They are
eligible for inclusion on the basis of SEC-approved
market value of publicly-held shares, trading volume,
price and number of market-makers.
B A R R ON S .C OM / D ATA
Five-Day Nasdaq Composite
Wanting Nvidia: Demand for AI servers is mostly for those powered
by Nvidia, said Dell Tech. The Nasdaq Composite Index closed Friday at
16,735—down 1% on the week. But it gained 6.9% in the month of May.
Monday
Tuesday
Wednesday
Thursday
Friday
17,060
H
(Prev Fri)
O
L
I
D
A
Y
10 12 2
52-Week
High
Low
4.27
178.77
179.95
19.14
11.86
0.30
11.07
0.20
93.69
12.28
14.84
6.79
18.00
27.77
1.49
191.70
89.19
99.75
97.36
19.08
93.44
10.35
21.04
13.72
20.69
104.28
127.96
53.99
3.40
329.72
14.57
37.00
6.98
67.66
11.98
26.44
241.88
27.50
10.45
61.46
3.49
4.18
11.38
28.67
8.40
94.75
67.92
72.29
6.45
256.73
54.26
199.62
11.62
225.07
24.75
9.39
88.50
11.55
7.97
6.23
3.44
153.60
75.10
103.79
43.81
13.17
10.13
21.59
550.76
4.45
18.81
1.66
115.35
115.83
8.66
10.34
0.08
10.31
0.04
57.59
10.27
2.09
1.38
6.70
14.77
0.65
118.35
40.31
77.42
77.36
10.86
69.38
7.19
3.76
9.38
5.25
60.78
55.00
32.05
2.25
212.02
9.02
17.58
2.29
38.43
3.37
1.65
154.99
13.36
3.25
39.82
0.63
1.55
5.26
16.54
1.57
19.83
38.08
14.19
0.23
145.37
27.81
164.08
2.36
129.21
2.16
1.18
21.04
9.86
1.21
1.25
1.69
82.18
30.74
69.49
17.52
1.76
3.16
18.01
327.73
0.92
6.91
16,905
16,750
16,595
+99.09
4
10 12 2
Name
AlphaTeknova
Alphabet A
Alphabet C
Alphatec
AlphaTimeAcqn
AlphaTimeRt
AlphaVestAcqn
AlphaVestAcqnRt
AltairEngg
AltEnergyA
Altimmune
AltisourcePortf
Alvotech
AmalgamFin
Amarin
Amazon.com
Ambarella
Amdocs
Amedisys
AmerAirlines
AEP
AmOutdoorBrands
AmerPubEduc
AmerSoftware
AmerSupercond
AmericanWoodmark
AmerCarMart
AmerisBancorp
AmeriServFin
Amgen
AmicusTherap
AmkorTech
AmnealPharm
AmphastarPharm
AmtechSystems
AmylyxPharm
AnalogDevices
AnaptysBio
AnavexLifeSci
Andersons
Anghami
Angi
AngioDynamics
AnikaTherap
Annexon
ApellisPharm
ApogeeEnt
ApogeeTherap
ApollomicsA
AppFolio
Appian
Apple
AppliedDigital
ApplMaterials
AppliedOptoelec
AppliedTherap
AppLovin
APxAcqnI A
ApyxMedical
AquestiveTherap
ArbutusBiopharma
ArcBest
Arcellx
ArchCapital
ArcturusTherap
ArcutisBiotherap
Ardelyx
AresCapital
argenx
ArgoBlockchain
Arhaus
-99.30
4
Tick
Sym Yld P/E
TKNO ...
GOOGL .5
GOOG .5
ATEC ...
ATMC ...
ATMCR ...
ATMV ...
ATMVR ...
ALTR ...
AEAE ...
ALT ...
ASPS ...
ALVO ...
AMAL 1.9
AMRN ...
AMZN ...
AMBA ...
DOX 2.4
AMED ...
AAL ...
AEP 3.9
AOUT ...
APEI ...
AMSWA 4.3
AMSC ...
AMWD ...
CRMT ...
ABCB 1.2
ASRV 5.0
AMGN 2.9
FOLD ...
AMKR 1.0
AMRX ...
AMPH ...
ASYS ...
AMLX ...
ADI 1.6
ANAB ...
AVXL ...
ANDE 1.5
ANGH ...
ANGI ...
ANGO ...
ANIK ...
ANNX ...
APLS ...
APOG 1.5
APGE ...
APLM ...
APPF ...
APPN ...
AAPL .5
APLD ...
AMAT .7
AAOI ...
APLT ...
APP ...
APXI ...
APYX ...
AQST ...
ABUS ...
ARCB .5
ACLX ...
ACGL ...
ARCT ...
ARQT ...
ARDX ...
ARCC 8.9
ARGX ...
ARBK ...
ARHS .0
dd
26
27
dd
41
...
34
...
cc
dd
dd
dd
dd
8
dd
50
dd
18
dd
19
17
dd
dd
35
dd
12
dd
12
dd
44
dd
22
dd
15
dd
dd
55
dd
dd
15
dd
dd
dd
dd
dd
dd
14
dd
dd
cc
dd
30
dd
25
dd
dd
48
25
dd
dd
dd
22
dd
8
dd
dd
dd
7
dd
dd
25
10 12 2
Last
Div
Chg. Amt.
1.76
172.50
173.96
9.71
11.06
.12
11.02
.12
87.33
11.85
7.51
1.88
13.88
25.28
.87
176.44
58.26
79.00
91.15
11.50
90.25
8.16
17.40
10.26
19.18
86.11
60.27
49.95
2.38
305.85
9.80
32.59
6.68
42.33
6.42
1.72
234.49
23.94
4.06
52.34
1.11
2.02
6.31
25.65
4.83
39.25
64.97
45.64
.30
228.32
28.39
192.25
4.23
215.08
10.49
4.28
81.48
11.55
1.65
2.88
3.36
105.52
52.00
102.63
38.81
8.36
6.86
21.57
371.02
1.38
18.81
–0.07 ...
–2.49 .20
–2.37 .20
–0.41 ...
+0.02 ...
... ...
–0.03 ...
–0.01 ...
–5.57 ...
+0.54 ...
+0.18 ...
+0.17 ...
–0.31 ...
–0.02 .12
+0.02 ...
–4.31 ...
+8.14 ...
–0.91 .479
–5.08 ...
–2.34 ...
+1.28 .88
+0.07 ...
–0.23 ...
–0.44 .11
+3.12 ...
–2.93 ...
–0.77 ...
+1.93 .15
–0.30 .03
+0.01 2.25
+0.14 ...
–0.51.0787
+0.23 ...
–0.93 ...
+1.07 ...
–0.01 ...
+1.98 .92
+0.03 ...
+0.06 ...
+0.37 .19
–0.01 ...
–0.16 ...
+0.14 ...
+1.08 ...
–0.13 ...
–1.36 ...
–2.06 .25
–2.39 ...
+0.05 ...
–2.08 ...
–2.66 ...
+2.27 .25
–0.38 ...
–5.81 .40
–2.05 ...
+0.20 ...
–0.67 ...
+0.05 ...
+0.05 ...
–0.18 ...
+0.07 ...
–0.68 .12
+0.10 ...
–0.73 ...
+8.40 ...
–0.80 ...
+0.11 ...
+0.22 .48
+3.95 ...
+0.01 ...
+2.01 .50
-183.50
4
10 12 2
52-Week
High
Low
164.00
12.53
6.26
11.67
8.26
26.64
25.95
29.66
39.83
9.54
50.43
53.08
161.00
11.19
224.77
20.04
56.33
95.21
79.36
16.90
22.44
18.83
2.54
4.60
4.30
50.15
54.94
3.00
25.22
43.70
258.69
23.00
59.61
602.59
23.20
14.45
13.50
11.64
12.43
4.81
11.96
279.53
7.45
256.84
19.09
3.07
9.60
38.85
30.84
13.56
244.95
55.46
2.20
201.00
329.87
69.68
98.40
69.16
-2.06
4
10 12 2
16,440
4
Last
Div
Chg. Amt.
46.50
10.20
4.14
10.47
1.17
10.60
14.35
16.38
20.67
4.20
33.34
13.57
85.08
7.20
161.32
7.69
28.97
50.61
60.47
4.26
14.11
11.79
0.20
2.77
1.33
33.95
36.78
1.49
16.35
23.10
154.02
14.80
20.19
274.98
16.61
7.14
5.99
10.55
4.71
1.41
1.00
192.01
2.01
205.53
9.50
0.85
5.46
25.08
4.83
6.88
93.53
42.67
1.05
93.77
175.37
47.70
55.02
42.90
Arm
ArmadaAcqnI
Armlogi
ArogoCapA
Arq
ArrayTech
ArriVentBio
ArrowFinancial
ArrowheadPharm
Arteris
ArtesianRscs A
Arvinas
AscendisPharma
AscentIndustries
AspenTech
AssemblyBiosci
AstecIndustries
AsteraLabs
AstraZeneca
AstriaTherap
Astronics
AstroNova
AtaraBiotherap
AteaPharm
AthiraPharma
AtlantaBravesC
AtlantaBravesA
AtlanticAmerican
AtlanticaSust
Atlanticus
Atlassian
AtourLifestyle
AtriCure
Atrion
AuburnNatlBncp
AudioCodes
AuraBiosciences
AuraFatProjectsA
AuriniaPharm
AuroraInnov
AustralianOilseeds
Autodesk
AutolusTherap
ADP
AvadelPharm
AveannaHealth
AvePoint
AviatNetworks
AvidityBio
AvidXchange
AvisBudget
Avnet
Aware
AxcelisTechs
AxonEnterprise
Axonics
AxsomeTherap
Azenta
ARM
AACI
BTOC
AOGO
ARQ
ARRY
AVBP
AROW
ARWR
AIP
ARTNA
ARVN
ASND
ACNT
AZPN
ASMB
ASTE
ALAB
AZN
ATXS
ATRO
ALOT
ATRA
AVIR
ATHA
BATRK
BATRA
AAME
AY
ATLC
TEAM
ATAT
ATRC
ATRI
AUBN
AUDC
AURA
AFAR
AUPH
AUR
COOT
ADSK
AUTL
ADP
AVDL
AVAH
AVPT
AVNW
RNA
AVDX
CAR
AVT
AWRE
ACLS
AXON
AXNX
AXSM
AZTA
...
...
...
...
...
...
...
4.3
...
...
3.3
...
...
...
...
...
1.6
...
1.8
...
...
...
...
...
...
...
...
1.2
8.1
...
...
.7
...
1.9
5.9
3.6
...
...
...
...
...
...
...
2.3
...
...
...
...
...
...
.0
2.3
...
...
...
...
...
...
cc
dd
...
21
dd
38
dd
15
dd
dd
21
dd
dd
dd
dd
dd
30
dd
38
dd
dd
29
dd
dd
dd
dd
dd
dd
54
6
dd
18
dd
43
80
28
dd
70
dd
dd
dd
48
dd
27
dd
dd
dd
28
dd
dd
4
9
dd
15
82
dd
dd
dd
120.52
11.55
5.06
10.90
6.96
14.18
19.41
25.11
22.95
8.17
35.87
33.14
135.10
10.33
210.65
15.15
32.49
64.54
78.02
9.47
20.56
17.91
.56
3.67
2.62
39.97
42.03
1.67
21.98
25.70
156.86
17.81
22.54
460.25
18.31
9.99
7.35
11.31
5.42
2.39
1.00
201.60
4.19
244.92
15.95
2.61
9.02
30.91
26.86
10.59
113.73
54.60
1.82
112.49
281.67
67.09
73.43
50.51
+5.88 ...
+0.09 ...
+0.26 ...
–0.01 ...
–0.21 ...
+0.59 ...
+0.17 ...
+0.55 .27
–1.93 ...
+0.04 ...
–2.64.2955
–2.09 ...
+4.69 ...
+0.09 ...
–10.31 ...
+0.07 ...
–0.74 .13
–7.45 ...
–0.52 .985
+0.45 ...
–0.36 ...
+0.30 ...
–0.06 ...
+0.01 ...
–0.02 ...
+1.04 ...
+0.83 ...
+0.02 .02
–1.44.445
+0.22 ...
–12.00 ...
+0.22 .15
–0.65 ...
–2.68 2.20
–0.56 .27
–0.05 .18
+0.32 ...
+0.02 ...
+0.21 ...
–0.07 ...
–0.14 ...
–13.29 ...
+0.27 ...
–3.98 1.40
+0.20 ...
–0.19 ...
–0.14 ...
+0.61 ...
–0.59 ...
–0.20 ...
+1.8210.00
–0.35 .31
–0.02 ...
+1.12 ...
–3.96 ...
–0.13 ...
–1.76 ...
–0.43 ...
9.19
4.07
21.64
62.42
57.15
14.46
3.50
94.25
0.59
28.32
110.74
17.33
BCB Bancorp
BGC
BJsRestaurants
BOK Fin
BRP
B RileyFin
Backblaze
Baidu
Baijiayun
BakerHughes
Balchem
BaldwinInsurance
BCBP 6.4
BGC .9
BJRI ...
BOKF 2.4
DOOO 1.0
RILY 8.3
BLZE ...
BIDU ...
RTC ...
BKR 2.5
BCPC .5
BWIN ...
6
72
35
13
11
dd
dd
13
dd
19
43
dd
10.00
8.67
35.04
90.62
62.50
23.96
6.11
97.20
.90
33.48
153.60
33.68
–0.24 .16
+0.01 .02
+0.01 ...
–1.43 .55
–4.35.1334
–6.74 .50
–0.56 ...
–3.08 ...
–0.11 ...
+1.11 .21
+0.58 .79
... ...
Name
Tick
Sym Yld P/E
B
13.90
9.06
38.77
96.41
92.74
60.72
12.65
156.98
8.83
37.58
159.52
35.46
34
BARRON’S
D ATA
For personal non-commercial use only. Do not edit or alter. Reproductions not permitted.
To reprint or license content, please contact Barron's reprints department at 800-843-0008 or www.djreprints.com
52-Week
High
Low
5.68
104.00
25.02
52.36
30.63
11.12
30.83
55.66
16.57
5.35
5.10
132.90
17.89
24.31
10.33
103.75
49.50
229.57
85.91
74.75
57.19
8.94
19.25
28.91
9.99
12.75
19.15
13.50
89.91
4.02
14.20
8.96
2.21
319.76
99.56
43.69
6.41
125.83
6.70
8.22
7.01
3.91
7.66
10.20
10.93
4.20
88.56
69.31
13.00
11.88
30.13
57.42
10.80
11.42
15.61
0.31
5.53
111.02
1.81
3918.00
15.24
10.61
0.22
42.90
7.00
7.62
61.53
44.32
9.19
12.78
4.56
56.25
12.14
4.29
1445.40
11.52
94.86
21.06
2.06
26.20
11.24
25.57
12.12
NASDAQ ISSUES
Last
Div
Chg. Amt.
2.42
79.99
9.34
34.76
19.53
7.57
22.47
39.31
0.16
1.90
1.64
82.44
13.02
15.96
10.01
65.27
16.95
126.97
38.82
39.13
44.76
6.22
5.58
12.54
3.00
5.62
8.80
9.22
51.79
1.24
10.10
4.03
1.03
189.44
73.68
8.13
0.83
85.21
0.48
3.65
2.59
0.92
1.62
10.09
10.13
0.75
64.32
47.26
9.90
10.46
20.53
17.59
7.08
10.50
7.44
0.02
0.85
43.89
0.73
2568.48
8.25
10.10
0.08
25.52
2.92
1.71
31.80
13.73
3.80
10.02
1.55
41.73
7.85
2.04
776.38
7.93
53.79
9.83
0.34
5.72
10.25
14.39
10.52
BallardPower
BancFirst
Bandwidth
BankOZK
Bank7
BankFinancial
BankwellFinl
Banner
BanzaiIntl
Baozun
BarinthusBio
BarrettBus
BassettFurniture
BayCom
BayviewAcqnA
BeaconRoofing
BeamTherap
BeiGene
BelFuse A
BelFuse B
BentleySystems
Berry(bry)
BeyondMeat
BicycleTherap
Big5SportingGds
BigCommerce
Bilibili
BinahCapital
Bio-Techne
BioAtla
BioceresCrop
BioCryst
Biodesix
Biogen
BioMarinPharm
BiomeaFusion
Bionomics
BioNTech
BioraTherap
Biote
Bioventus
Bitfarms
BlackDiamond
BlackHawkAcqn
BlackHawkAcqn
BlackHawkAcqnRt
Blackbaud
BlackLine
BlkRkTCPCap
BlockchainCoinIA
Bloomin'Brands
BlueBird
BlueFoundryBncp
BlueOceanA
BlueWorldA
BlueWorldRt
bluebirdbio
BlueprintMed
BoltBiotherap
Booking
BoundlessBio
BowenAcqn
BowenAcqnRt
BowmanConsult
BraggGaming
Brainsway
Braze
BridgeBioPharma
BridgerAerospace
BridgfordFoods
Brightcove
BrighthouseFin
BrightSpring
BrilliantEarthA
Broadcom
BrooklineBncp
Bruker
Bumble
BurgerFiIntl
BurningRockBio
BurTechAcqnA
BusFirstBcshs
byNordicAcqnA
BLDP ...
BANF 2.0
BAND ...
OZK 3.7
BSVN 2.8
BFIN 4.0
BWFG 3.2
BANR 4.1
BNZI ...
BZUN ...
BRNS ...
BBSI .9
BSET 4.8
BCML 2.0
BAYA ...
BECN ...
BEAM ...
BGNE ...
BELFA .3
BELFB .4
BSY .5
BRY 6.9
BYND ...
BCYC ...
BGFV 5.8
BIGC ...
BILI ...
BCG ...
TECH .4
BCAB ...
BIOX ...
BCRX ...
BDSX ...
BIIB ...
BMRN ...
BMEA ...
BNOX ...
BNTX ...
BIOR ...
BTMD ...
BVS ...
BITF ...
BDTX ...
BKHA ...
BKHAU ...
BKHAR ...
BLKB ...
BL
...
TCPC12.3
BCSA ...
BLMN 4.4
BLBD ...
BLFY ...
BOCN ...
BWAQ ...
BWAQR ...
BLUE ...
BPMC ...
BOLT ...
BKNG .9
BOLD ...
BOWN ...
BOWNR ...
BWMN ...
BRAG ...
BWAY ...
BRZE ...
BBIO ...
BAER ...
BRID ...
BCOV ...
BHF ...
BTSG ...
BRLT ...
AVGO 1.6
BRKL 6.2
BRKR .3
BMBL ...
BFI
...
BNR ...
BRKH ...
BFST 2.6
BYNO ...
dd
14
dd
7
9
15
6
10
dd
dd
dd
18
dd
9
...
dd
dd
dd
17
11
47
cc
dd
dd
dd
dd
dd
dd
61
dd
cc
dd
dd
28
70
dd
dd
cc
dd
cc
dd
dd
dd
...
...
...
cc
46
31
11
34
23
dd
68
61
...
dd
dd
dd
28
dd
42
...
dd
dd
dd
dd
dd
dd
24
dd
dd
...
cc
49
9
24
cc
dd
dd
cc
8
84
3.09
86.15
20.13
41.88
30.25
10.11
24.74
46.83
.21
2.67
1.91
132.34
15.01
20.18
10.23
97.06
23.82
148.85
85.91
68.20
50.24
6.97
7.59
22.19
3.47
8.24
14.52
10.84
77.19
1.51
11.78
6.46
1.43
224.94
75.07
10.52
.84
100.60
.64
6.66
6.69
2.24
4.78
10.14
10.32
1.12
77.94
47.72
11.08
11.16
21.80
57.01
9.19
11.14
11.18
.21
.90
105.56
.76
3776.35
9.12
10.54
.13
32.27
6.56
6.29
37.65
28.01
4.22
10.10
2.09
44.51
11.25
2.41
1328.55
8.65
65.51
11.70
.34
7.15
11.17
21.45
11.28
... ...
–0.50 .43
–0.77 ...
–4.62 .39
+0.41 .21
–0.04 .10
+0.47 .20
+0.99 .48
+0.01 ...
–0.04 ...
–0.30 ...
+7.66 .30
+0.86 .18
–0.18 .10
+0.03 ...
–0.16 ...
–0.50 ...
–3.86 ...
+8.86 .06
–0.52 .07
–3.05 .06
+0.11 .12
+0.42 ...
–0.84 ...
+0.25 .05
–0.02 ...
+0.58 ...
–2.46 ...
–3.60 .08
–0.20 ...
+0.83 ...
+0.33 ...
–0.02 ...
+7.13 ...
–0.45 ...
–0.48 ...
–0.17 ...
+3.65 ...
+0.05 ...
+0.31 ...
+0.32 ...
+0.22 ...
–0.11 ...
... ...
–0.03 ...
–0.08 ...
–1.38 ...
–1.92 ...
+0.25 .34
... ...
+0.90 .24
+2.47 ...
–0.13 ...
–0.03 ...
+2.45 ...
–0.04 ...
–0.06 ...
+2.75 ...
–0.03 ...
–19.00 8.75
–2.19 ...
+0.01 ...
+0.02 ...
–0.83 ...
+0.56 ...
+0.89 ...
–3.64 ...
+0.07 ...
+0.19 ...
–0.04 ...
–0.04 ...
+1.21 ...
–0.07 ...
+0.14 ...
–79.29 5.25
–0.07 .135
–11.74 .05
+0.23 ...
–0.04 ...
–0.40 ...
+0.05 ...
+0.44 .14
+0.09 ...
2.12
13.14
33.51
18.68
10.32
167.73
16.38
9.73
1.06
25.77
65.00
0.88
177.04
17.18
5.01
12.65
81.29
Cadiz
CARGOTherapeutics
C&F Fin
CB FinSvcs
CCC Intelligent
CDW
CEVA
CFAcqnVII A
C4 Therap
CG Oncology
CH Robinson
CLPS
CME Group
CNB Fin PA
CompassPath
CPI Card
CRA Intl
CDZI ...
CRGX ...
CFFI 4.0
CBFV 4.5
CCCS ...
CDW 1.1
CEVA ...
CFFS ...
CCCC ...
CGON ...
CHRW 2.8
CLPS .0
CME 2.3
CCNE 3.6
CMPS ...
PMTS ...
CRAI 1.0
dd
...
7
5
dd
28
dd
dd
dd
...
34
dd
23
8
dd
17
29
3.03
19.00
43.94
22.38
11.18
223.62
19.92
11.01
5.00
32.58
86.37
.92
202.98
19.40
7.38
26.19
175.97
–0.10
–1.86
–0.71
–0.18
–0.80
–7.44
+0.25
+0.05
–0.48
–0.13
–0.35
–0.02
–11.94
–0.36
–0.10
+0.27
+4.13
Name
Tick
Sym Yld P/E
C
5.31
33.92
72.00
27.02
13.41
263.37
27.65
11.52
11.88
50.23
100.88
1.42
223.80
23.40
12.75
29.94
178.52
June 3, 2024
...
...
.44
.25
...
.62
...
...
...
...
.61
.10
1.15
.175
...
...
.42
52-Week
High
Low
91.10
69.35
29.93
263.91
40.12
21.77
26.35
12.90
327.36
60.27
6.81
64.76
50.14
38.97
27.82
40.00
19.91
18.09
39.70
109.49
3.50
41.51
14.30
19.20
8.29
30.25
25.00
34.16
18.85
27.22
11.77
6.88
12.00
4.45
197.99
20.52
3.58
17.03
126.00
24.98
8.59
9.77
48.52
18.20
5.16
16.74
11.92
42.60
100.74
344.61
50.25
25.91
45.72
400.99
26.80
12.50
3.77
12.45
1.98
47.48
41.03
19.88
5.51
3.38
36.79
12.80
22.65
3.08
39.95
458.30
168.82
41.25
39.77
51.36
11.76
93.58
17.65
1.48
8.36
38.03
1.57
32.19
190.23
10.85
142.90
43.17
100.01
124.35
705.74
5.75
117.12
58.19
32.90
12.61
115.89
9.58
5.25
50.82
2.12
12.35
0.14
73.25
37.55
41.27
4.91
146.28
29.03
12.47
9.55
10.58
217.77
31.74
3.50
42.25
2.29
21.42
14.01
15.25
11.91
2.93
26.52
28.21
0.75
14.11
0.66
2.76
5.75
14.27
15.00
25.57
12.70
18.56
10.46
4.22
1.15
0.50
6.30
4.96
0.68
4.80
2.24
16.70
2.78
1.24
27.13
13.32
0.99
10.43
10.61
11.67
72.97
212.50
35.50
9.26
30.43
233.84
11.46
5.51
0.96
4.30
0.35
28.63
27.30
5.70
1.28
1.56
3.16
0.87
11.81
1.21
25.46
236.08
122.11
28.58
17.29
36.10
10.62
72.84
13.86
0.13
0.24
6.58
0.88
21.58
143.69
10.18
106.45
25.44
48.33
95.01
474.25
2.15
65.02
45.85
14.84
8.47
86.56
4.77
2.17
22.91
0.65
10.59
0.05
37.67
Name
CrisprTherap
CSG Systems
CSP
CSW Industrials
CSX
CVB Fin
CabalettaBio
CactusAcqn1 A
CadenceDesign
CaesarsEnt
Caesarstone
Cal-MaineFoods
CalAmp
CalavoGrowers
CaliforniaBncp
CalliditasTherap
CalumetSpecialty
CambiumNtwks
CamdenNational
Camtek
Canaan
CanadianSolar
CandelTherap
CanopyGrowth
Cantaloupe
CanterburyPark
CapitalBancorp
CapitalCityBank
CapitalProduct
CapitalSouthwest
CapitalworksEMA
CapitolFedFin
Captivision
CaraTherap
CarbonRevolution
Cardlytics
Carecloud
CareDx
CareMax
CarGurus
CaribouBio
CarismaTherap
Carlyle
CarlyleSecured
CarParts.com
CarterBkshrs
CartesianGrwIIA
CartesianTherap
CasellaWaste
CaseysGenStores
CassInfoSys
CastleBiosci
CathayGenBncp
CavcoIndustries
CecoEnvl
CellebriteDI
Cellectis
CentessaPharm
Centogene
CentralGarden
CentralGardenA
CenturyAluminum
CenturyTherap
Ceragon
Cerence
CERoTherap
Certara
Cerus
ChampionX
CharterComms
CheckPoint
Cheesecake
ChefsWarehouse
ChemungFinl
ChengheAcqnIA
ChesapeakeEner
ChicagoAtlRealEst
ChickenSoupA
ChijetMotor
Children'sPlace
Chimerix
ChipMOSTechs
ChordEnergy
ChurchillVII A
ChurchillDowns
Chuy's
Cimpress
CincinnatiFinl
Cintas
CipherMining
CirrusLogic
CiscoSystems
CitiTrends
CtznCmntyBcp
CityHolding
Clarus
CleanEnerFuels
Clearfield
ClearsideBiomed
ClimateRockA
ClimateRockRt
ClimbGlbl
B A R R ON S .C OM / D ATA
Tick
Sym Yld P/E
CRSP ...
CSGS 2.8
CSPI .8
CSWI .3
CSX 1.4
CVBF 4.8
CABA ...
CCTS ...
CDNS ...
CZR ...
CSTE ...
CALM 6.5
CAMP ...
CVGW 1.5
CALB ...
CALT ...
CLMT ...
CMBM ...
CAC 5.2
CAMT .0
CAN ...
CSIQ ...
CADL ...
CGC ...
CTLP ...
CPHC 1.3
CBNK 1.6
CCBG 3.1
CPLP 3.4
CSWC 8.9
CMCA ...
CFFN 6.6
CAPT ...
CARA ...
CREV ...
CDLX ...
CCLD ...
CDNA ...
CMAX ...
CARG ...
CRBU ...
CARM ...
CG 3.3
CGBD 8.9
PRTS ...
CARE ...
RENE ...
RNAC ...
CWST ...
CASY .5
CASS 2.8
CSTL ...
CATY 3.7
CVCO ...
CECO ...
CLBT ...
CLLS ...
CNTA ...
CNTG ...
CENT ...
CENTA ...
CENX ...
IPSC ...
CRNT ...
CRNC ...
CERO ...
CERT ...
CERS ...
CHX 1.2
CHTR ...
CHKP ...
CAKE 2.8
CHEF ...
CHMG 2.9
LATG ...
CHK 2.5
REFI 12.0
CSSE ...
CJET ...
PLCE ...
CMRX ...
IMOS 4.2
CHRD 2.7
CVII ...
CHDN .3
CHUY ...
CMPR ...
CINF 2.8
CTAS .8
CIFR ...
CRUS ...
CSCO 3.4
CTRN ...
CZWI 2.7
CHCO 2.8
CLAR 1.4
CLNE ...
CLFD ...
CLSD ...
CLRC ...
CLRCR ...
CLMB 1.2
dd
20
27
39
19
11
dd
cc
75
10
dd
11
dd
dd
9
dd
dd
dd
11
58
dd
7
dd
dd
44
13
9
9
8
12
52
dd
26
dd
...
dd
dd
dd
dd
76
dd
dd
dd
11
dd
22
28
dd
cc
26
19
dd
8
19
71
dd
dd
dd
dd
17
17
8
dd
48
dd
dd
dd
dd
18
9
21
18
49
8
dd
12
8
dd
dd
dd
dd
15
9
cc
29
16
25
8
47
77
23
16
dd
9
13
27
dd
dd
dd
dd
...
22
Last
Div
Chg. Amt.
53.74
43.15
14.79
254.26
33.75
16.54
10.19
11.45
286.31
35.56
5.98
61.67
2.67
26.97
21.90
39.99
16.28
3.21
32.42
102.41
1.01
19.64
8.90
8.53
7.16
22.36
20.15
27.16
17.88
25.58
11.04
5.17
4.72
.65
9.00
8.76
2.58
13.01
2.93
24.21
2.88
1.33
42.96
17.92
1.18
12.75
11.25
34.72
100.59
331.78
42.34
23.26
36.84
357.20
25.03
10.65
2.71
8.63
.37
43.45
37.35
18.33
2.97
2.63
3.44
.93
16.95
1.79
32.62
287.12
150.50
38.48
39.42
43.40
11.42
90.93
15.70
.30
.44
12.25
.97
27.21
185.41
10.74
129.50
26.71
82.51
117.58
677.97
3.71
114.70
46.50
24.43
11.64
102.22
7.00
3.13
38.26
1.40
11.45
.12
57.57
–1.50 ...
+0.93 .30
... .03
–7.43 .21
–0.03 .12
+0.24 .20
–0.73 ...
+0.20 ...
–7.97 ...
+1.93 ...
+0.14 ...
+1.32 .997
–0.70 ...
+0.99 .10
–0.35 ...
+17.57 ...
+0.31 ...
–0.04 ...
+0.10 .42
–3.44 1.33
–0.04 ...
+1.44 ...
+1.10 ...
–0.65 ...
+0.44 ...
–0.58 .07
–0.25 .08
+0.21 .21
+0.35 .15
–0.23 .06
–0.01 ...
+0.03 .085
–0.37 ...
–0.02 ...
–2.11 ...
–0.64 ...
+0.04 ...
–2.93 ...
+0.19 ...
+0.28 ...
–0.09 ...
–0.02 ...
–1.59 .35
+0.01 .07
+0.10 ...
–0.18 ...
+0.03 ...
+10.15 ...
+0.84 ...
–11.36 .43
–1.14 .30
–1.11 ...
+0.60 .34
+9.32 ...
–0.91 ...
–0.45 ...
–0.11 ...
+0.36 ...
... ...
–1.90 ...
–1.74 ...
+0.38 ...
–0.07 ...
–0.07 ...
+0.23 ...
+0.01 ...
+0.22 ...
–0.05 ...
–0.03 .095
+15.66 ...
–3.92 ...
+1.00 .27
+1.22 ...
–0.40 .31
+0.05 ...
+1.21 .14
+0.02 .47
–0.01 ...
–0.09 ...
–1.09 ...
+0.03 ...
–0.281.5007
+5.65 1.69
... ...
–3.49 .382
+0.70 ...
–0.55 ...
–0.10 .81
–4.84 1.35
–0.38 ...
+0.24 ...
+0.08 .40
+1.11 ...
+0.34 .32
–0.28 .715
+0.23 .025
+0.44 ...
+1.17 ...
+0.05 ...
+0.01 ...
... ...
+1.98 .17
52-Week
High
Low
1.63
48.50
1030.00
75.44
4.91
25.88
13.50
86.00
59.51
3.49
80.09
8.53
5.63
43.99
283.48
38.40
40.95
131.05
8.90
13.58
28.12
20.46
86.73
45.84
47.46
57.48
11.96
6.65
45.74
113.37
12.00
16.00
8.16
20.97
13.04
106.10
4.08
25.00
41.22
2.84
24.44
5.26
36.80
4.65
38.29
236.30
62.35
13.75
9.90
16.46
104.07
58.58
6.10
7.00
20.10
281.41
4.19
100.38
819.50
32.00
57.57
102.89
5.32
616.66
26.20
18.20
10.75
17.89
53.70
39.97
22.50
158.00
3.14
28.75
15.07
365.00
30.19
2.36
6.59
12.36
21.41
33.14
283.00
9.87
110.25
5.85
Last
Div
Chg. Amt.
0.61
35.67
614.22
56.28
1.45
17.62
3.67
57.11
34.28
0.90
61.12
4.00
1.43
28.57
46.43
0.37
20.83
83.38
4.22
9.03
17.08
14.30
66.01
30.29
36.43
40.91
4.89
0.86
33.48
63.70
10.31
0.20
4.61
9.60
1.53
53.89
2.40
0.95
14.69
0.53
14.03
2.55
11.62
2.93
19.07
87.14
27.96
7.03
3.55
13.27
75.94
42.41
2.61
2.57
10.31
187.92
1.05
67.35
509.40
13.97
38.25
43.38
2.84
379.77
13.38
13.60
6.10
4.43
15.76
22.10
5.32
74.00
1.64
14.06
9.71
139.37
7.64
1.42
2.26
2.22
1.28
6.66
142.92
3.80
25.98
1.04
CloverHealth
CoastalFinl
CocaColaCon
Coca-ColaEuro
Codexis
CodorusValleyBncp
CogentBio
CogentComm
Cognex
CognitionTherap
CognizantTech
CognyteSoftware
CoherusBioSci
Cohu
CoinbaseGlbl
CollectiveAudience
CollegiumPharm
ColliersIntl
Collplant
ColonyBankcorp
ColumbiaBanking
ColumbiaFinl
ColumbiaSportswr
ColumbusMcKinn
Comcast A
CommerceBcshrs
CommVehicle
CommScope
CmntyTrBcp
CommvaultSys
CompassDigitalAcqn
CompleteSolaria
CompoSecure
comScore
ComtechTel
Concentrix
Conduent
ConduitPharm
Confluent
ConnectBiopharma
ConnectOneBncp
Conn's
ConsensusCloud
ConsldComm
ConsldWater
ConstellationEner
ConstructionPtrs
ConsumerPtf
ContextLogic
ContineumTherap
Cooper
Copart
CoreScientific
CorMedix
CorsairGaming
Corvel
CorvusPharm
CoStar
Costco
Couchbase
CovenantLogist
CrackerBarrel
CreativeMedia
CreditAcceptance
CredoTech
CrescentCapBDC
Cresud
Cricut
CrineticsPharm
Criteo
CriticalMetals
Crocs
Cronos
CrossCtyHlthcr
CrossFirstBkshs
CrowdStrike
CullinanTherap
CumberlandPharm
CumulusMedia
CureVac
Cutera
CVRx
CyberArkSoftware
CytekBiosci
Cytokinetics
CytomXTherap
CLOV ...
CCB ...
COKE .2
CCEP 2.7
CDXS ...
CVLY 3.1
COGT ...
CCOI 6.5
CGNX .7
CGTX ...
CTSH 1.8
CGNT ...
CHRS ...
COHU ...
COIN ...
CAUD ...
COLL ...
CIGI .3
CLGN ...
CBAN 3.7
COLB 7.5
CLBK ...
COLM 1.4
CMCO .7
CMCSA 3.1
CBSH 1.9
CVGI ...
COMM ...
CTBI 4.4
CVLT ...
CDAQ ...
CSLR ...
CMPO .0
SCOR ...
CMTL ...
CNXC 1.9
CNDT ...
CDT ...
CFLT ...
CNTB ...
CNOB 3.9
CONN ...
CCSI ...
CNSL ...
CWCO 1.4
CEG .6
ROAD ...
CPSS ...
LOGC ...
CTNM ...
COO .0
CPRT ...
CORZ ...
CRMD ...
CRSR ...
CRVL ...
CRVS ...
CSGP ...
COST .6
BASE ...
CVLG .9
CBRL 8.5
CMCT11.8
CACC ...
CRDO ...
CCAP 9.1
CRESY .0
CRCT 1.6
CRNX ...
CRTO ...
CRML ...
CROX ...
CRON ...
CCRN ...
CFB ...
CRWD ...
CGEM ...
CPIX ...
CMLS ...
CVAC ...
CUTR ...
CVRX ...
CYBR ...
CTKB ...
CYTK ...
CTMX ...
dd
16
22
19
dd
10
dd
2
79
dd
16
dd
dd
dd
45
dd
14
55
dd
10
8
91
21
24
11
15
4
dd
10
29
cc
dd
7
dd
dd
13
dd
dd
dd
...
10
dd
4
dd
13
29
50
6
dd
...
55
37
45
dd
dd
55
dd
cc
50
dd
15
18
dd
25
dd
6
13
21
dd
32
dd
12
dd
12
10
cc
dd
dd
dd
dd
dd
dd
dd
dd
dd
9
1.10
44.34
981.04
73.71
3.38
22.00
8.01
59.22
45.52
1.95
66.15
7.60
1.82
32.24
225.92
.42
33.14
112.16
5.61
12.08
19.28
14.50
85.62
39.10
40.03
55.64
5.41
1.44
42.11
107.59
10.82
1.75
6.35
13.73
2.49
61.33
3.50
3.04
25.97
1.79
18.64
3.58
18.87
4.40
27.10
217.25
58.21
8.28
5.46
15.32
94.31
53.06
4.75
5.27
11.59
239.85
2.16
78.17
809.89
22.67
47.53
48.78
2.88
490.83
26.07
18.14
9.90
6.23
44.41
39.02
10.75
155.64
2.59
15.12
13.09
313.67
23.50
1.48
2.33
3.89
2.15
6.95
229.25
5.63
48.51
1.70
+0.10 ...
–0.02 ...
–11.61 .50
+0.63 .79
+0.21 ...
–0.30 .17
–0.21 ...
+0.08 .975
–2.15 .075
–0.60 ...
–2.17 .30
–0.04 ...
–0.09 ...
+0.58 ...
–11.73 ...
–0.03 ...
–1.11 ...
+0.55 .15
–0.16 ...
+0.23.1125
+0.46 .36
–0.96 ...
+1.59 .30
–5.80 .07
+1.49 .31
+0.58 .27
+0.35 ...
+0.28 ...
–0.47 .46
–3.02 ...
... ...
+0.16 ...
–0.21 .30
+0.25 ...
+0.28 ...
–0.44.3025
+0.05 ...
+0.20 ...
–4.18 ...
+0.03 ...
–1.58 .18
+0.07 ...
–0.99 ...
+0.08 ...
–0.77 .095
–13.38.3525
–3.23 ...
+0.14 ...
+0.17 ...
–0.44 ...
–0.58.0075
–0.96 ...
–0.07 ...
+0.15 ...
+0.29 ...
–36.75 ...
+0.10 ...
–7.76 ...
+0.16 1.16
–3.87 ...
+0.13 .11
+3.16 .25
–0.09 .085
+9.54 ...
+6.10 ...
+0.15 .42
+0.55 .305
+0.17 .40
–3.06 ...
+0.02 ...
+0.81 ...
+6.72 ...
–0.05 ...
+0.62 ...
... ...
–37.80 ...
–0.63 ...
–0.07 ...
–0.28 ...
+0.20 ...
+0.09 ...
–0.50 ...
–12.28 ...
–0.33 ...
+0.21 ...
–0.05 ...
0.42
0.72
12.75
1.01
10.07
28.70
1.36
5.94
3.44
77.81
31.81
4.72
1.27
9.67
DBV Tech
DIH US
DMC Global
D-MarketElec
DTCloudAcqn
DXP Ents
DadaNexus
Daktronics
DallasNews
Datadog
Dave&Buster's
Dave
DawsonGeophys
DayOneBiopharm
DBVT ...
DHAI ...
BOOM ...
HEPS ...
DYCQ ...
DXPE ...
DADA ...
DAKT ...
DALN16.5
DDOG ...
PLAY ...
DAVE ...
DWSN ...
DAWN ...
dd
...
12
cc
...
14
dd
10
dd
cc
18
dd
dd
dd
.56
1.53
12.99
2.01
10.19
49.68
1.66
11.16
3.88
110.18
51.09
45.06
1.94
13.27
–0.05 ...
–0.07 ...
–0.19 ...
+0.33 ...
+0.02 ...
+0.08 ...
–0.13 ...
–0.14 ...
–0.02 .16
–13.42 ...
+1.28 ...
+2.89 ...
–0.06 ...
–0.50 ...
Name
Tick
Sym Yld P/E
D
2.26
3.29
27.16
2.01
10.30
57.38
6.94
12.42
5.13
138.61
69.82
63.50
2.65
18.07
52-Week
High
Low
25.56
12.46
14.10
33.31
41.65
100.69
8.31
5.36
2.88
142.00
188.28
211.96
42.95
43.43
27.91
96.69
77.60
12.35
37.31
3.96
24.22
56.41
64.76
154.96
18.19
15.76
16.00
143.34
35.74
98.55
15.96
12.20
49.57
4.45
27.68
33.43
7.88
251.30
15.15
35.98
Last
Div
Chg. Amt.
9.90
4.38
4.05
14.56
26.27
69.59
1.94
3.01
2.12
74.75
144.35
123.41
21.25
21.00
16.48
60.00
25.60
10.28
22.91
1.60
9.06
33.81
38.11
102.77
6.11
12.80
11.59
67.00
27.16
60.01
6.95
6.29
23.97
0.43
10.59
22.04
3.66
121.89
10.48
6.40
DecipheraPharm
DefinitiveHlthcr
DenaliCapAcqnA
DenaliTherap
DentsplySirona
DescartesSystems
DesignTherap
DestinationXL
Deswell
DexCom
DiamondHillInvt
DiamondbkEner
DigiIntl
Digimarc
DimeCommBcshs
Diodes
DiscMedicine
DistokenAcqn
DistributionSoln
DiversifiedHlthcr
dLocal
Docebo
DocuSign
DollarTree
Domo
DonegalGroup A
DonegalGroup B
DoorDash
DorchesterMnls
DormanProducts
DoubleDown
DouYuIntl
DraftKings
DragonflyEnergy
DrivenBrands
Dropbox
DuluthHoldings
Duolingo
DynavaxTechs
DyneTherap
DCPH ...
DH
...
DECA ...
DNLI ...
XRAY 2.3
DSGX ...
DSGN ...
DXLG ...
DSWL 8.1
DXCM ...
DHIL 4.0
FANG 1.8
DGII ...
DMRC ...
DCOM 5.4
DIOD ...
IRON ...
DIST ...
DSGR ...
DHC 1.6
DLO ...
DCBO ...
DOCU ...
DLTR ...
DOMO ...
DGICA 5.2
DGICB 4.8
DASH ...
DMLP10.7
DORM ...
DDI
...
DOYU ...
DKNG ...
DFLI ...
DRVN ...
DBX ...
DLTH ...
DUOL ...
DVAX ...
DYN ...
dd
dd
31
dd
dd
66
dd
9
6
77
10
11
64
dd
10
20
dd
73
dd
dd
19
cc
cc
dd
dd
84
90
dd
13
19
6
65
dd
dd
dd
15
dd
cc
cc
dd
25.54
5.32
6.06
18.56
28.01
92.33
4.05
3.55
2.46
118.77
150.04
199.26
24.36
26.84
18.47
74.13
33.95
10.75
33.38
2.43
9.15
34.39
54.74
117.95
6.66
13.24
12.79
110.11
32.99
91.97
12.00
10.14
35.13
.97
11.49
22.53
3.95
191.40
11.99
31.88
+0.03 ...
–0.30 ...
–0.40 ...
–0.65 ...
+0.55 .16
–7.90 ...
–0.31 ...
–0.09 ...
+0.05 .10
–8.60 ...
–2.54 1.50
+5.80 1.07
–0.51 ...
–0.18 ...
–0.30 .25
+0.56 ...
–0.33 ...
... ...
–2.94 ...
+0.14 .01
–0.41 ...
–1.39 ...
–2.19 ...
+2.58 ...
–0.31 ...
+0.23.1725
–0.16 .155
–2.72 ...
+1.19.7818
–0.03 ...
–1.00 ...
+0.17 ...
–5.68 ...
+0.03 ...
+0.34 ...
–0.36 ...
–0.54 ...
+13.00 ...
+0.60 ...
+0.66 ...
1.07
0.77
3.60
10.05
13.91
11.26
3.21
48.65
10.65
16.10
6.13
37.17
9.53
5.12
4.91
0.80
9.51
4.28
2.12
6.58
8.11
183.80
117.47
0.36
2.96
2.34
9.93
10.52
0.10
24.26
8.08
34.74
150.51
12.45
12.11
9.80
5.70
73.49
88.79
229.57
84.13
23.01
32.97
10.75
49.12
4.70
677.80
1.51
199.49
11.82
0.70
2.42
56.60
73.84
10.23
18.50
6.22
10.65
46.92
5.36
ECARX
ECDAutoDesign
EDAP TMS
ESH Acqn A
ESSA Bancorp
EagleBncpMT
EaglePharm
EastWestBncp
EasternBankshares
Eastern
EbangIntl
eBay
EchoStar
EdgewiseTherap
EditasMedicine
EducDev
EHang
eHealth
8x8
89bio
ElPolloLoco
ElbitSystems
ElectronicArts
ElevationOnc
ElicioTherap
EliemTherap
Embecta
EmbraceChange
EmbraceChangeRt
Enact
EnantaPharma
EncoreCapital
EncoreWire
EnergyRecovery
EnlightRenewableEn
EnlivenTherap
Enovix
EnphaseEnergy
EnsignGroup
Enstar
Entegris
EnterpriseBncp
EnterpriseFinSvcs
EntradaTherap
ePlus
EpsilonEnergy
Equinix
Erasca
ErieIndemnity
Escalade
EsperionTherap
EtonPharm
Etsy
EuronetWorldwide
EuropeanWax
Everbridge
EverCommerce
EvergreenA
Evergy
EverQuote
ECX ...
ECDA ...
EDAP ...
ESHA ...
ESSA 3.5
EBMT 4.2
EGRX ...
EWBC 3.0
EBC 3.2
EML 1.6
EBON ...
EBAY 2.0
SATS ...
EWTX ...
EDIT ...
EDUC ...
EH
...
EHTH ...
EGHT ...
ETNB ...
LOCO ...
ESLT 1.0
EA
.6
ELEV ...
ELTX ...
ELYM ...
EMBC 4.9
EMCG ...
EMCGR ...
ACT 2.4
ENTA ...
ECPG ...
WIRE .0
ERII ...
ENLT ...
ELVN ...
ENVX ...
ENPH ...
ENSG .2
ESGR ...
ENTG .3
EBTC 3.8
EFSC 2.7
TRDA ...
PLUS ...
EPSN 4.7
EQIX 2.2
ERAS ...
ERIE 1.4
ESCA 4.4
ESPR ...
ETON ...
ETSY ...
EEFT ...
EWCZ ...
EVBG ...
EVCM ...
EVGR ...
EVRG 4.7
EVER ...
dd
dd
dd
49
9
12
4
9
5
17
dd
11
dd
dd
dd
28
dd
dd
dd
dd
13
38
28
dd
dd
dd
10
45
...
8
dd
dd
15
40
35
dd
dd
66
32
6
61
9
8
25
17
24
77
dd
39
15
dd
cc
29
21
46
dd
dd
39
18
dd
1.20
1.13
5.95
10.42
17.22
13.25
3.47
74.19
13.70
27.08
8.64
54.22
19.20
17.13
5.20
1.87
16.97
5.92
2.73
7.90
10.68
192.85
132.88
4.02
7.90
7.71
12.37
11.23
.18
30.71
12.47
44.24
288.73
13.50
17.57
22.57
10.62
127.90
121.24
313.14
126.35
25.15
38.69
15.47
74.84
5.37
762.98
2.52
362.43
13.78
2.16
3.55
63.47
116.58
11.32
34.76
9.59
11.43
54.66
23.89
+0.05 ...
–0.02 ...
–0.17 ...
+0.02 ...
–0.50 .15
+0.08 .14
–0.27 ...
+0.40 .55
+0.13 .11
–1.16 .11
+0.15 ...
–0.19 .27
+0.71 ...
+0.02 ...
–0.43 ...
–0.02 ...
+0.95 ...
+0.36 ...
–0.08 ...
–0.24 ...
+0.28 ...
–5.73 .50
–2.18 .19
+0.18 ...
–0.51 ...
+0.30 ...
–0.76 .15
+0.01 ...
+0.03 ...
–0.19 .185
+0.44 ...
+0.50 ...
+10.04 .02
–0.08 ...
+0.06 ...
–1.37 ...
–0.19 ...
+2.72 ...
+1.08 .06
+2.49 ...
–5.94 .10
–0.05 .24
–0.02 .26
+0.34 ...
–3.34 ...
–0.06.0625
–3.14 4.26
–0.11 ...
–26.531.275
+0.24 .15
+0.03 ...
–0.03 ...
+2.85 ...
+1.56 ...
+0.54 ...
+0.01 ...
–0.47 ...
... ...
+1.23.6425
–0.17 ...
Name
Tick
Sym Yld P/E
E
9.34
17.00
10.32
10.47
20.87
17.65
23.52
79.54
15.07
35.78
18.94
55.15
24.80
21.60
11.91
2.95
25.78
10.31
4.88
22.93
11.99
225.64
144.53
5.83
24.39
11.55
28.36
12.33
1.73
31.85
26.91
54.73
295.90
30.76
20.44
26.00
23.90
192.22
127.58
318.63
146.91
34.10
46.17
18.44
83.57
6.35
914.93
3.38
420.34
22.01
3.40
5.81
102.81
121.06
20.00
36.31
12.47
11.45
61.84
25.69
52-Week
High
Low
10.50
5.95
15.43
13.49
3.47
24.34
43.53
33.40
25.39
160.05
8.25
102.72
9.12
32.73
30.99
11.52
Last
Div
Chg. Amt.
5.79
1.65
7.07
4.50
1.30
18.64
33.35
25.17
8.91
92.48
1.40
64.61
3.86
10.50
5.67
7.70
EverspinTech
EVgo
Evolus
Evotec
Exagen
Exelixis
Exelon
ExlService
eXpWorld
Expedia
Expensify
Exponent
Exscientia
ExtremeNetworks
EyePointPharm
Ezcorp
MRAM ...
EVGO ...
EOLS ...
EVO ...
XGN ...
EXEL ...
EXC 4.0
EXLS ...
EXPI 1.8
EXPE ...
EXFY ...
EXPO 1.2
EXAI ...
EXTR ...
EYPT ...
EZPW ...
16
dd
dd
dd
dd
34
16
27
dd
21
dd
48
dd
dd
dd
10
5.96
2.03
12.93
4.68
1.95
21.69
37.55
29.86
11.21
112.86
1.51
95.12
5.30
11.15
10.71
10.49
–0.09 ...
–0.11 ...
+0.42 ...
–0.09 ...
+0.09 ...
+1.12 ...
+0.86 .38
–1.11 ...
–0.03 .05
+2.55 ...
–0.20 ...
–1.16 .28
+0.61 ...
... ...
–0.45 ...
+0.29 ...
12.34
142.16
26.60
10.31
27.83
2.84
7.02
0.35
3.10
1.75
52.86
1.63
29.50
10.44
0.01
6.53
0.33
38.16
22.49
15.22
10.55
7.78
12.46
26.00
21.77
10.09
17.51
27.04
1181.71
27.13
17.23
22.84
31.55
10.09
9.24
17.13
12.45
20.81
25.70
23.54
10.03
129.22
40.96
13.16
15.77
12.84
88.05
134.77
128.64
1.03
45.49
18.50
16.83
15.67
13.03
10.74
15.77
10.50
10.28
0.21
2.70
29.50
55.97
17.26
44.12
24.18
11.21
0.75
13.23
9.44
28.29
25.82
37.98
5.75
82.61
2.25
6.22
54.60
12.69
28.26
11.65
3.19
0.64
2.87
FARO Tech
F5
FRP Holdings
FTACEmeraldA
FTAI Aviation
FTAI Infra
Falcon'sBeyondGlbl
FangddNetwork
Fanhua
FarmerBros
Fastenal
FateTherap
Ferrovial
FeutuneLightA
FeutuneLightRt
FibroBiologics
FibroGen
FidelityD&D
FifthThirdBncp
FinInstitutions
FinnovateAcqnA
FinWiseBancorp
FirstAdvantage
FirstBancorpNC
FirstBancorp
FirstBank
FirstBusey
FirstBusFinSvcs
FirstCitizBcshA
FirstCommBkshs
FirstFinBncpOH
FirstFinBkshs
FirstFinIN
FirstFinNW
FirstGuarBcshs
FirstHawaiian
FirstInternetBncp
FirstInterBanc
FirstMerchants
FirstMidBcshs
FirstNWBncp
FirstSolar
1stSource
FirstUnited
FirstWatchRest
FirstWesternFin
FirstCash
FirstService
FiveBelow
5EAdvMatls
Five9
FiveStarBncp
Flex
Flexsteel
FluenceEnergy
FlushingFinl
Flywire
FocusImpact
FocusImpactBH3A
FocusUniversal
FoghornTherap
FormFactor
FormulaSys
ForresterRes
Fortinet
Fortrea
ForwardAir
Fossil
FosterLB
4D Molecular
FoxA
FoxB
FoxFactory
FractylHealth
FranklinElec
FreightCarAmer
FrequencyElec
Freshpet
Freshworks
Frontdoor
FrontierComms
Frontier
FuelCell
FulcrumTherap
FARO ...
FFIV ...
FRPH ...
EMLD ...
FTAI ...
FIP 1.4
FBYD ...
DUO ...
FANH ...
FARM ...
FAST 2.4
FATE ...
FER .0
FLFV ...
FLFVR ...
FBLG ...
FGEN ...
FDBC 3.3
FITB 3.7
FISI 6.8
FNVT ...
FINW ...
FA
.0
FBNC 2.8
FNLC 5.8
FRBA 2.0
BUSE 4.2
FBIZ 2.9
FCNCA .4
FCBC 3.3
FFBC 4.1
FFIN 2.4
THFF 4.9
FFNW 2.4
FGBI 6.3
FHB 5.1
INBK .8
FIBK 7.1
FRME 4.2
FMBH 2.9
FNWB 2.6
FSLR ...
SRCE 2.6
FUNC 4.0
FWRG ...
MYFW ...
FCFS 1.2
FSV .7
FIVE ...
FEAM ...
FIVN ...
FSBC 3.5
FLEX ...
FLXS 1.7
FLNC ...
FFIC 6.9
FLYW ...
FIAC ...
BHAC ...
FCUV ...
FHTX ...
FORM ...
FORTY 1.2
FORR ...
FTNT ...
FTRE ...
FWRD 5.7
FOSL ...
FSTR ...
FDMT ...
FOXA 1.5
FOX 1.6
FOXF ...
GUTS ...
FELE 1.0
RAIL ...
FEIM ...
FRPT ...
FRSH ...
FTDR ...
FYBR ...
ULCC ...
FCEL ...
FULC ...
dd
20
96
cc
38
dd
...
dd
4
dd
33
dd
59
cc
...
dd
dd
16
12
7
cc
8
72
11
10
11
11
8
9
13
9
21
8
63
21
12
16
11
10
10
dd
28
10
9
52
22
23
73
25
dd
dd
9
14
12
dd
13
dd
dd
23
dd
dd
42
19
cc
39
dd
dd
dd
37
dd
11
10
26
dd
25
dd
26
cc
dd
16
cc
dd
dd
dd
18.73
168.97
30.60
10.90
84.32
8.55
10.00
.74
3.20
2.88
65.98
3.68
40.49
11.10
.18
12.18
1.20
46.23
37.42
17.61
11.34
10.42
16.06
31.55
24.16
12.17
22.61
34.01
1698.43
34.74
22.30
29.98
37.04
21.25
10.23
20.33
29.46
26.54
33.05
31.74
10.87
271.76
51.42
20.04
19.68
16.88
117.92
147.12
138.13
1.44
46.76
22.92
33.13
35.80
25.13
12.72
17.15
11.10
10.59
.23
5.83
54.72
78.75
17.99
59.32
25.39
16.80
1.20
27.43
23.97
34.43
31.94
46.62
6.74
99.48
3.72
9.00
131.17
12.88
35.37
26.66
5.47
.90
7.85
+0.07 ...
–0.93 ...
+0.06 ...
+0.20 ...
–0.15 ...
–0.39 .03
–0.65 ...
–0.38 ...
+0.10 ...
–0.10 ...
–0.04 .39
+0.16 ...
+0.28.3299
+0.04 ...
–0.02 ...
+0.70 ...
–0.10 ...
+0.38 .38
+0.17 .35
–0.38 .30
+0.01 ...
–0.10 ...
–0.42 1.50
–0.20 .22
–0.34 .35
–0.04 .06
–0.30 .24
–0.74 .25
–82.82 1.64
+0.05 .29
–0.29 .23
–0.03 .18
–0.27 .45
+0.11 .13
–0.82 .16
–0.24 .26
–1.16 .06
–0.57 .47
–0.28 .35
–0.15 .23
–0.20 .07
–4.98 ...
+0.87 .34
–1.47 .20
–0.12 ...
–1.12 ...
–0.76 .35
+3.47 .25
+5.14 ...
–0.39 ...
–3.28 ...
–0.34 .20
–0.04 ...
+1.65 .15
+1.88 ...
–0.44 .22
–1.18 ...
+0.01 ...
+0.02 ...
–0.04 ...
+0.19 ...
–3.68 ...
+0.17.6215
–0.05 ...
–2.03 ...
–0.16 ...
+4.47 .24
–0.11 ...
–0.92 ...
–1.18 ...
+0.82 .26
+0.81 .26
+1.93 ...
–0.72 ...
+1.53 .25
+0.09 ...
–0.44 ...
+0.48 ...
–0.36 ...
+0.18 ...
+1.08 ...
–0.24 ...
+0.02 ...
+0.64 ...
Name
Tick
Sym Yld P/E
F
24.80
199.49
32.50
11.05
86.31
9.25
44.00
19.65
8.58
4.04
79.04
8.83
48.29
12.01
0.34
55.00
19.47
60.85
39.14
23.11
11.50
14.98
17.49
38.51
29.16
15.17
25.80
41.03
1810.03
39.23
24.99
33.15
44.91
22.17
15.25
23.22
35.72
32.54
38.16
35.83
16.12
286.60
56.59
24.29
25.98
22.00
133.64
171.94
216.18
4.60
92.40
28.25
34.12
41.64
31.32
18.00
35.80
11.91
12.09
2.38
9.97
60.78
86.06
32.79
81.24
41.02
121.38
2.92
30.77
36.25
35.41
33.24
117.68
14.50
107.89
4.26
11.41
132.29
24.98
38.97
27.41
10.57
2.94
13.70
June 3, 2024
D ATA
52-Week
High
Low
44.09
17.68
1.90
13.42
4.65
21.60
81.86
12.20
NASDAQ ISSUES
Last
Div
Chg. Amt.
19.88
11.47
1.00
5.27
0.50
2.31
37.95
10.60
FulgentGenetics
FultonFin
FundamentalGlbl
Funko
FusionFuelGreen
FusionPharm
Futu
FutureTechIIA
FLGT ...
FULT 4.0
FGF ...
FNKO ...
HTOO ...
FUSN ...
FUTU ...
FTII ...
dd
10
6
dd
...
dd
20
55
20.65
16.84
1.23
9.04
1.23
21.52
75.14
11.09
–0.74 ...
+0.08 .17
–0.04 ...
+0.67 ...
+0.05 ...
+0.04 ...
+0.50 ...
+0.03 ...
6.56
1.90
5.01
62.35
5.61
5.05
16.23
1.08
55.04
0.59
1.88
2.11
2.00
26.89
0.09
7.60
41.80
6.43
16.38
1.16
10.43
0.86
2.89
26.32
26.64
38.21
6.60
24.85
1.64
53.80
6.60
4.95
62.07
33.09
18.40
11.40
12.14
12.31
10.37
0.01
27.30
10.04
0.15
10.41
0.02
9.34
45.52
0.26
7.53
1.21
19.62
28.20
6.89
8.80
0.14
13.03
4.14
11.26
50.47
1.47
10.16
0.45
2.90
99.65
3.40
7.51
1.59
6.12
45.66
16.74
1.55
9.56
5.30
7.35
0.67
19.73
4.18
50.23
15.81
2.95
0.85
GCM Grosvenor
GDEV
GDS Holdings
GE HealthCare
GEN Restaurant
GH Research
G-IIIApparel
G1Therapeutics
GRAVITY
GRIID Infr
GSI Tech
Gaia
GainTherap
Galapagos
GaleraTherap
Gambling.com
Gaming&Leisure
GarrettMotion
GenDigital
GeneDx
GenAsia I A
GenerationBio
Genfit
Genmab
Gentex
Gentherm
GeospaceTech
GermanAmBncp
Geron
GibraltarInds
GigaCloudTech
GilatSatellite
GileadSciences
GitLab
GladstoneCap
GladstoneComm
GladstoneInvt
GladstoneLand
GlblBlockchain
GlbBlockchainRt
Global-EOnline
GlobalLightsAcqn
GlobalLightsAcqnRt
GlobalStarA
GlobalStarRt
GlobalWaterRscs
GlobalFoundries
GlycoMimetics
Gogo
Gogoro
GolarLNG
GoldenEnt
GoldenOcean
GoldenStarAcqn
GoldenStarAcqnRt
GolubCapital
GoodRx
Goodyear
GooseheadIns
GoPro
GoresIX A
GossamerBio
Grab
GrandCanyonEduc
GraphjetTech
GreatElmCap
GreatElm
GreatLakesDredge
GreatSouthernBncp
GreenPlains
GreenidgeGen
GreenlightCapRe
Grifols
GrindrodShipping
Gritstone
GroceryOutlet
Groupon
GrAeroportuario
GuardantHealth
GulfIslandFab
GulfResources
GCMG 4.4
GDEV ...
GDS ...
GEHC .2
GENK ...
GHRS ...
GIII
...
GTHX ...
GRVY ...
GRDI ...
GSIT ...
GAIA ...
GANX ...
GLPG ...
GRTX ...
GAMB ...
GLPI 6.8
GTX ...
GEN 2.0
WGS ...
GAQ ...
GBIO ...
GNFT ...
GMAB ...
GNTX 1.4
THRM ...
GEOS ...
GABC 3.4
GERN ...
ROCK ...
GCT ...
GILT ...
GILD 4.8
GTLB ...
GLAD 8.8
GOOD 8.3
GAIN 6.8
LAND 4.1
GBBK ...
GBBKR ...
GLBE ...
GLAC ...
GLACR ...
GLST ...
GLSTR ...
GWRS 2.3
GFS ...
GLYC ...
GOGO ...
GGR ...
GLNG 3.8
GDEN 3.3
GOGL 5.6
GODN ...
GODNR ...
GBDC 9.4
GDRX ...
GT
...
GSHD ...
GPRO ...
GHIX ...
GOSS ...
GRAB ...
LOPE ...
GTI
...
GECC13.7
GEG ...
GLDD ...
GSBC 3.0
GPRE ...
GREE ...
GLRE ...
GRFS ...
GRIN .9
GRTS ...
GO
...
GRPN ...
OMAB ...
GH
...
GIFI ...
GURE ...
dd
8
dd
23
46
dd
8
dd
6
...
dd
dd
dd
dd
dd
16
17
dd
26
dd
41
dd
dd
23
19
37
8
11
dd
20
12
14
cc
dd
7
dd
6
cc
75
...
dd
dd
...
cc
...
50
30
dd
9
dd
25
3
15
52
...
8
dd
dd
cc
dd
dd
dd
dd
20
cc
5
dd
16
10
dd
dd
4
29
dd
dd
34
dd
14
dd
dd
dd
10.05
2.13
8.02
78.00
11.13
14.09
30.06
3.30
75.40
.69
2.60
4.69
2.55
27.82
.22
7.73
44.90
9.08
24.83
19.61
11.24
3.18
5.18
28.20
35.00
53.94
9.86
31.65
3.55
75.46
31.14
5.52
64.27
47.19
22.40
14.39
14.03
13.50
11.76
.09
31.22
10.28
.17
11.07
.15
12.92
49.00
.27
10.59
1.46
26.29
30.27
14.39
10.79
.35
16.57
7.87
12.31
64.50
1.52
10.55
.59
3.67
142.46
5.91
10.22
1.75
9.15
52.49
17.17
2.62
13.29
7.16
13.63
.77
21.99
15.83
81.81
27.10
6.76
1.73
+0.04 .11
+0.06 ...
+0.28 ...
–1.85 .03
–0.45 ...
+0.39 ...
+1.24 ...
–0.79 ...
+2.87 ...
–0.07 ...
–0.19 ...
+0.16 ...
+0.13 ...
+0.55 ...
+0.02 ...
–0.23 ...
+0.25 .76
+0.07 ...
–0.06 .125
–0.99 ...
+0.12 ...
+0.11 ...
+0.65 ...
+0.20 ...
+0.64 .12
+4.73 ...
–0.30 ...
–1.11 .27
+0.07 ...
+1.98 ...
–1.41 ...
+0.23 ...
–1.41 .77
–7.98 ...
+0.12 .165
+0.22 .10
+0.16 .08
+0.18.0466
+0.75 ...
+0.01 ...
+1.80 ...
+0.02 ...
–0.03 ...
... ...
... ...
+0.45.0251
–1.75 ...
... ...
+0.15 ...
+0.04 ...
–0.59 .25
+1.56 .25
–0.11 .30
–0.02 ...
–0.05 ...
+0.32 .06
+0.73 ...
–0.03 ...
+0.14 ...
–0.02 ...
–0.08 ...
–0.03 ...
+0.01 ...
–3.00 ...
–0.22 ...
–0.05 .35
–0.08 ...
–0.05 ...
+0.45 .40
–1.10 ...
–0.31 ...
–0.17 ...
–0.04 ...
–0.101.016
–0.03 ...
–0.63 ...
–0.61 ...
+0.68 ...
+1.58 ...
–0.32 ...
+0.19 ...
37.20
17.42
0.91
17.60
10.68
0.75
30.20
19.37
5.69
32.50
H&E Equipment
HBT Finl
HCW Biologics
HMN Fin
Hutchmed
HWH Intl
H World
HackettGroup
HainCelestial
HalozymeTherap
HEES 2.3
HBT 3.9
HCWB ...
HMNF 1.5
HCM ...
HWH ...
HTHT 1.6
HCKT 2.0
HAIN ...
HALO ...
10
9
dd
17
32
17
23
18
dd
18
47.37
19.50
1.09
22.19
18.53
1.08
37.23
22.31
7.66
44.29
–1.10 .275
–0.10 .19
–0.02 ...
–0.16 .10
–0.20 ...
–0.10 ...
+0.80 .31
+0.78 .11
+0.74 ...
+0.47 ...
Name
Tick
Sym Yld P/E
For personal non-commercial use only. Do not edit or alter. Reproductions not permitted.
To reprint or license content, please contact Barron's reprints department at 800-843-0008 or www.djreprints.com
G
10.20
7.40
14.24
94.50
20.50
14.64
35.68
6.14
82.48
9.66
9.80
4.74
5.33
44.25
3.59
14.83
50.59
10.16
25.47
24.40
11.24
6.98
6.05
42.72
37.58
66.54
17.09
34.96
4.30
87.40
45.18
7.16
87.87
78.53
22.56
15.04
14.96
17.48
12.00
0.28
45.72
10.33
0.42
11.87
0.18
13.43
68.57
3.53
17.94
3.55
27.37
47.50
15.77
11.21
1.00
17.72
9.37
16.51
92.76
4.45
11.10
1.88
3.92
156.56
14.00
11.82
2.24
9.78
61.94
36.02
9.26
13.61
12.15
14.90
3.33
36.54
19.56
100.21
41.06
7.93
2.80
H
66.18
21.87
2.32
24.95
21.92
15.04
48.84
26.69
13.24
46.16
35
BARRON’S
52-Week
High
Low
130.97
49.65
20.31
18.86
12.44
18.43
39.27
22.63
8.00
6.20
73.58
36.39
14.89
89.83
26.00
60.86
14.37
15.14
84.49
29.12
17.08
45.99
36.36
143.68
11.12
7.68
11.47
82.63
10.22
22.55
19.36
13.98
87.13
10.06
18.42
20.22
10.85
7.70
230.77
21.50
27.26
82.45
44.00
15.82
30.99
4.89
210.87
27.15
12.51
14.71
10.97
0.32
13.73
21.31
9.40
47.59
15.80
2.50
24.00
1.41
9.97
219.51
14.30
28.20
113.31
22.75
1.64
3.28
7.50
2.17
B A R R ON S .C OM / D ATA
Last
Div
Chg. Amt.
70.08
32.16
13.87
13.62
8.50
8.80
18.61
7.60
5.00
3.09
42.66
18.91
3.70
45.37
15.02
41.15
5.45
8.75
56.02
20.47
9.63
26.44
22.52
87.50
4.79
6.33
10.21
60.01
7.65
15.50
4.22
3.28
34.96
1.96
10.44
9.94
6.02
4.80
147.01
1.26
15.70
64.02
31.30
4.20
19.37
1.06
174.88
15.51
8.12
9.14
10.32
0.04
10.75
14.92
0.68
31.73
10.30
0.10
13.38
0.43
1.96
154.10
9.25
17.04
77.99
6.18
0.67
0.76
0.32
0.50
HamiltonLane
HancockWhitney
HanmiFinancial
HanoverBancorp
HarborOneBncp
Harmonic
HarmonyBio
Harrow
Harte-Hanks
HarvardBioSci
Hasbro
HashiCorp
HawaiianHoldings
Hawkins
HawthornBcsh
HaynesIntl
HealthCatalyst
HealthcareSvcs
HealthEquity
HealthStream
HeartlandExp
HeartlandFinUSA
Heidrick&Strug
HelenofTroy
HelloGroup
HennessyAdvsrs
HennessyCapVI
HenrySchein
HeritageCommerce
HeritageFin
HertzGlobal
Hesai
Hibbett
HighestPerf
HighPeakEner
HilleVax
HillmanSolns
HimaxTechs
HinghamSvg
HoldcoNuvo
HollysysAuto
Hologic
HomeBancorp
HomeStreet
HomeTrustBcshs
Honest
Honeywell
HookerFurnishings
HopeBancorp
HorizonBancorp
HorizonSpaceI
HorizonSpaceI Rt
HorizonTechFin
HostHotels
HubCyberSecurity
HubGroup
HudsonAcqnI
HudsonAcqnIRt
HudsonGlobal
HuizeHolding
Humacyte
JBHunt
HuntingtonBcshs
Hurco
HuronConsulting
Hut8
Hydrofarm
Hyperfine
Hywin
HyzonMotors
HLNE 1.6
HWC 3.4
HAFC 6.3
HNVR 2.4
HONE 3.1
HLIT ...
HRMY ...
HROW ...
HHS ...
HBIO ...
HAS 4.7
HCP ...
HA
...
HWKN .7
HWBK 4.0
HAYN 1.5
HCAT ...
HCSG ...
HQY ...
HSTM .5
HTLD .7
HTLF 2.7
HSII 1.8
HELE ...
MOMO .0
HNNA 7.7
HCVI ...
HSIC ...
HTBK 6.4
HFWA 5.1
HTZ ...
HSAI ...
HIBB 1.2
HPH ...
HPK 1.0
HLVX ...
HLMN ...
HIMX 4.3
HIFS 1.5
NUVO ...
HOLI ...
HOLX ...
HBCP 2.8
HMST 4.4
HTBI 1.6
HNST ...
HON 2.1
HOFT 5.3
HOPE 5.3
HBNC 5.2
HSPO ...
HSPOR ...
HRZN11.4
HST 4.5
HUBC ...
HUBG 1.2
HUDA ...
HUDAR ...
HSON ...
HUIZ ...
HUMA ...
JBHT 1.1
HBAN 4.5
HURC 3.6
HURN ...
HUT ...
HYFM ...
HYPR ...
HYW ...
HYZN ...
35
11
7
8
28
20
13
dd
dd
dd
dd
dd
dd
24
63
20
dd
19
cc
47
dd
27
13
15
5
11
dd
23
9
14
7
dd
11
dd
13
dd
dd
24
15
dd
17
38
8
dd
8
dd
23
20
11
23
32
...
dd
18
...
13
dd
...
dd
5
dd
25
13
85
25
5
dd
dd
1
dd
125.49
46.73
15.76
16.46
10.41
12.23
29.40
17.95
7.33
3.17
59.78
33.58
13.66
87.32
19.20
58.82
6.63
10.78
81.68
27.29
11.32
43.96
34.28
106.88
5.64
7.15
10.55
69.34
8.15
18.13
4.36
4.86
86.58
8.63
15.78
12.14
9.19
6.50
170.90
1.31
21.17
73.78
36.17
9.13
27.61
2.69
202.19
17.38
10.53
12.22
10.97
.10
11.60
17.94
.80
43.15
10.96
.25
15.26
.77
7.48
160.75
13.92
17.84
88.31
8.69
.79
.84
.35
.53
–1.46 .49
+0.38 .40
+0.20 .25
–0.04 .10
–0.08 .08
+0.32 ...
–0.55 ...
+0.06 ...
–0.06 ...
+0.01 ...
–0.88 .70
+0.19 ...
–0.14 ...
–2.14 .16
+0.19 .19
–0.08 .22
–0.10 ...
–0.02 ...
+2.41 ...
+0.21.028
–0.20 .02
+0.20 .30
–1.28 .15
+2.10 ...
+0.12 .52
–0.10.1375
+0.03 ...
–2.38 ...
... .13
–0.16 .23
–0.42 ...
+0.22 ...
+0.32 .25
–0.67 ...
+0.86 .04
–0.75 ...
–0.16 ...
+0.05 .29
–0.36 .63
–0.23 ...
–1.05 ...
–0.02 ...
–0.62 .25
–0.22 .10
–0.59 .11
–0.06 ...
+2.50 1.08
+0.29 .23
+0.14 .14
–0.02 .16
+0.01 ...
+0.01 ...
–0.08 .11
–0.36 .20
–0.10 ...
–0.06 .125
+0.01 ...
–0.06 ...
–0.98 ...
–0.06 ...
+0.33 ...
+3.13 .43
+0.18 .155
+0.46 .16
+1.14 ...
–0.59 ...
... ...
–0.04 ...
–0.17 ...
+0.02 ...
41.39
0.06
11.45
113.89
78.28
20.90
372.50
48.33
3.81
1.16
0.65
0.82
80.33
17.54
10.47
15.00
22.26
1.03
215.88
0.81
1.02
89.00
5.94
1.34
0.95
1.25
41.01
0.94
18.16
1.58
IAC
IB Acqn Rt
IBEX
ICF Intl
ICU Medical
IDEAYA Bio
IdexxLab
IES Holdings
IGM Biosci
I-Mab
IN8bio
IO Biotech
IPG Photonics
i3Verticals
IXAcqnA
IcahnEnterprises
Ichor
iClickInteract
Icon
iHeartMedia
IkenaOncology
Illumina
Immersion
Immuneering
Immunic
ImmunityBio
Immunocore
ImmunoPrecise
Immunovant
Immutep
IAC
...
IBACR ...
IBEX ...
ICFI .4
ICUI ...
IDYA ...
IDXX ...
IESC ...
IGMS ...
IMAB ...
INAB ...
IOBT ...
IPGP ...
IIIV
...
IXAQ ...
IEP 24.2
ICHR ...
ICLK ...
ICLR ...
IHRT ...
IKNA ...
ILMN ...
IMMR 1.7
IMRX ...
IMUX ...
IBRX ...
IMCR ...
IPA
...
IMVT ...
IMMP ...
dd
...
10
29
dd
dd
48
22
dd
dd
dd
dd
22
cc
39
dd
dd
...
39
dd
dd
dd
7
dd
dd
dd
dd
dd
dd
dd
49.79
.09
15.65
142.75
106.34
36.55
496.95
152.45
8.33
1.66
1.19
1.18
86.73
19.48
11.35
16.51
37.99
1.27
324.82
.93
1.77
104.28
9.99
1.39
1.24
6.42
48.98
1.11
25.39
2.98
–0.01 ...
... ...
–0.25 ...
–1.40 .14
+4.66 ...
–1.16 ...
–19.55 ...
–8.05 ...
–1.22 ...
–0.09 ...
+0.18 ...
–0.09 ...
+1.10 ...
+0.54 ...
... ...
–0.19 1.00
–0.75 ...
+0.02 ...
+4.10 ...
+0.06 ...
+0.44 ...
–2.20 ...
+0.25.045
... ...
–0.01 ...
–0.10 ...
+2.93 ...
... ...
–3.56 ...
+0.14 ...
Name
Tick
Sym Yld P/E
I
69.85
0.11
23.49
158.00
196.57
47.74
583.39
184.38
17.70
3.38
3.16
2.22
141.85
25.70
12.15
36.00
46.43
4.01
344.77
4.74
7.38
213.12
10.17
11.92
3.11
10.53
76.98
3.36
45.58
3.34
52-Week
High
Low
175.41
71.85
12.68
67.36
68.75
27.39
53.25
26.50
4.88
6.62
4.70
11.00
5.87
89.59
48.25
3.57
15.36
133.71
8.05
9.00
16.86
11.98
7.80
11.50
11.75
212.44
58.82
25.00
298.95
50.46
46.75
20.88
51.28
47.48
4.25
6.78
156.75
129.19
3.72
119.86
18.47
61.46
4.74
84.89
676.62
13.25
412.29
5.05
17.99
4.50
12.16
11.31
192.84
5.20
54.44
18.33
6.47
124.12
3.65
65.12
9.69
51.49
10.08
0.30
15.70
11.51
18.75
111.00
31.01
Last
Div
Chg. Amt.
48.39
36.73
0.80
50.27
44.08
16.45
34.30
14.38
1.79
2.82
1.14
10.07
2.93
69.62
16.72
1.81
5.46
94.14
3.52
4.91
12.22
4.13
2.69
1.62
10.29
131.59
18.77
3.15
125.82
30.36
22.36
7.98
29.70
19.37
1.56
2.85
114.71
72.60
0.99
74.65
7.06
41.96
3.07
45.50
419.30
2.09
254.85
3.05
9.07
2.98
10.61
10.62
127.71
0.98
35.95
3.21
3.06
70.24
1.31
24.14
2.79
6.48
9.97
0.18
5.76
10.33
8.20
56.11
22.36
Impinj
InariMedical
IncannexHealthcare
Incyte
IndependentBank
IndepBankMI
IndependentBank
Indivior
IndlLogistics
Infinera
InflaRx
InflectionPtIIA
InfoSvcs
InglesMarkets
InMode
InnatePharma
Innodata
Innospec
InnovAge
InnovSolSuprt
Innoviva
Inogen
InozymePharma
Inseego
InsightAcqnA
InsightEnt
Insmed
Inspirato
Insulet
Intapp
IntegraLifeSci
IntegralAd
Intel
IntelliaTherap
Intellicheck
Inter
InterParfums
InteractiveBrkrs
Intercure
InterDigital
Interface
IntlBcshs
Intevac
Intra-Cellular
Intuit
IntuitiveMachinesA
IntuitiveSurgical
Inventiva
Investar
InvestcpCredit
InvestcorpEur I A
InvestcorpIndiaA
InvestorsTitle
Invivyd
IonisPharm
IovanceBiotherap
iQIYI
iRhythmTechs
Iridex
IridiumComm
IrisEnergy
iRobot
IronHorseAcqns
IronHorseAcqnsRt
IronwoodPharm
IsraelAcqns
iTeosTherap
Itron
IturanLocation
PI
...
NARI ...
IXHL ...
INCY ...
INDB 4.5
IBCP 3.8
IBTX 3.3
INDV ...
ILPT 1.1
INFN ...
IFRX ...
IPXX ...
III
5.6
IMKTA .9
INMD ...
IPHA ...
INOD ...
IOSP 1.2
INNV ...
ISSC ...
INVA ...
INGN ...
INZY ...
INSG ...
INAQ ...
NSIT ...
INSM ...
ISPO ...
PODD ...
INTA ...
IART ...
IAS
...
INTC 1.6
NTLA ...
IDN ...
INTR .5
IPAR 2.5
IBKR .8
INCR ...
IDCC 1.4
TILE .2
IBOC 2.3
IVAC ...
ITCI ...
INTU .6
LUNR ...
ISRG ...
IVA ...
ISTR 2.5
ICMB15.1
IVCB ...
IVCA ...
ITIC 1.0
IVVD ...
IONS ...
IOVA ...
IQ
...
IRTC ...
IRIX ...
IRDM 1.8
IREN ...
IRBT ...
IROH ...
IROHR ...
IRWD ...
ISRL ...
ITOS ...
ITRI ...
ITRN 5.6
dd
dd
...
18
10
9
18
cc
dd
dd
dd
34
dd
8
9
dd
cc
22
dd
17
7
dd
dd
dd
dd
25
dd
dd
54
dd
61
cc
32
dd
dd
26
28
21
...
17
16
9
dd
dd
53
18
73
dd
9
dd
51
37
14
dd
dd
dd
17
dd
dd
cc
...
dd
...
...
dd
38
dd
31
11
163.67
50.00
2.83
57.79
50.79
25.06
46.04
18.32
3.77
5.72
1.43
10.55
3.19
73.14
19.13
2.74
12.62
130.80
4.44
6.27
15.79
8.30
4.82
9.66
11.44
195.50
55.05
4.05
177.19
35.90
30.90
9.26
30.85
21.38
3.18
6.08
119.78
125.72
2.95
113.87
16.11
56.83
3.83
67.24
576.44
5.01
402.12
3.67
15.85
3.17
11.34
11.29
184.10
1.84
37.57
8.88
4.63
88.21
2.43
30.11
7.79
9.61
10.08
.20
6.30
10.97
16.74
107.55
27.69
–2.63 ...
+0.05 ...
+0.05 ...
+0.48 ...
–0.12 .57
–0.33 .24
–0.22 .38
+0.95 ...
–0.02 .01
+0.26 ...
–0.01 ...
+0.03 ...
+0.03.045
+0.34 .165
+0.65 ...
–0.16 ...
–0.34 ...
+1.31 .76
–0.06 ...
–0.12 ...
+0.01 ...
–0.51 ...
+0.25 ...
+2.16 ...
–0.21 ...
–12.85 ...
+33.05 ...
+0.25 ...
–2.88 ...
–0.28 ...
+2.59 ...
–0.53 ...
+0.13 .125
–3.46 ...
+0.04 ...
–0.45 .03
+0.90 .75
–2.28 .25
–0.22 ...
+2.90 .40
+0.45 .01
–1.08 .66
–0.11 ...
+1.70 ...
–30.55 .90
–0.12 ...
–2.73 ...
+0.21 ...
–0.04 .10
–0.05 .03
... ...
+0.01 ...
+29.91 .46
–0.09 ...
+0.29 ...
–1.13 ...
–0.15 ...
–0.73 ...
–0.02 ...
+0.13 .14
–0.04 ...
–0.32 ...
+0.03 ...
... ...
+0.35 ...
–0.03 ...
–0.94 ...
–1.99 ...
+1.24 .39
15.30
133.23
20.82
0.57
27.69
136.57
52.01
6.35
14.83
5.65
103.01
0.63
3.42
21.38
1.54
4.45
34.42
JakksPacific
J&JSnackFoods
JD.com
J-Long
Joyy
JackHenry
JackintheBox
JamesRiver
JamfHolding
JanuxTherap
JazzPharm
Jet.AI
JetBlue
JFrog
JianzhiEduc
Jiayin
JohnsonOutdoors
JAKK ...
JJSF 1.8
JD 2.5
JL
.0
YY 4.1
JKHY 1.3
JACK 3.2
JRVR 2.6
JAMF ...
JANX ...
JAZZ ...
JTAI ...
JBLU ...
FROG ...
JZ
...
JFIN 11.7
JOUT 3.6
6
37
13
...
6
32
10
dd
dd
dd
23
dd
dd
dd
dd
2
78
18.57
162.71
29.62
.58
29.86
164.68
55.36
7.81
15.92
53.50
105.25
.63
5.59
32.17
2.09
6.52
36.39
–0.11 ...
+0.35 .735
–0.65 .76
–0.01 .19
–2.68 .20
–3.93 .55
+1.77 .44
+0.35 .05
–0.36 ...
+8.13 ...
–0.81 ...
–0.05 ...
+0.14 ...
–0.77 ...
–0.16 ...
+0.02 .40
+0.71 .33
440.15
4.80
4.30
53.67
1.00
7.21
4.08
2.00
12.57
15.70
0.62
78.00
8.26
KLA
KLX Energy
KVH Inds
KaiserAlum
Kaltura
KalVistaPharm
Kamada
KandiTech
Kanzhun
KaratPkg
KaryopharmTherap
Kaspi.kz
Katapult
KLAC
KLXE
KVHI
KALU
KLTR
KALV
KMDA
KNDI
BZ
KRT
KPTI
KSPI
KPLT
40
dd
dd
28
dd
dd
23
cc
52
19
dd
12
dd
759.53
5.11
5.18
97.80
1.05
11.67
5.27
2.07
21.25
28.54
.97
126.40
17.70
–19.53 1.45
+0.10 ...
+0.08 ...
+2.11 .77
–0.12 ...
+0.37 ...
–0.03 ...
–0.05 ...
+0.04 .18
–0.37 .35
–0.08 ...
+4.201.8954
–1.28 ...
Name
Tick
Sym Yld P/E
J
36.84
177.71
41.95
29.95
43.20
178.37
99.56
22.15
22.89
65.60
146.70
17.50
9.45
48.81
3.27
8.19
63.31
K
791.96
13.42
10.17
102.42
2.27
16.88
6.53
4.27
22.74
30.94
2.47
136.17
24.76
.8
...
...
3.1
...
...
...
...
.0
3.3
...
5.6
...
52-Week
High
Low
9.46
10.99
25.27
6.84
73.00
34.66
45.00
6.24
3.13
31.43
7.42
22.09
3.88
9.80
31.94
38.96
22.78
17.84
2.29
60.20
24.17
122.81
45.31
35.06
Last
Div
Chg. Amt.
5.28
10.14
16.62
3.31
27.02
27.66
14.56
3.72
0.67
19.62
2.34
13.56
1.40
1.37
13.29
30.68
13.13
9.99
0.69
40.20
7.41
51.02
9.60
11.75
KearnyFinancial
KeenVisionAcqn
KellyServices A
KY FirstFedBncp
KerosTherap
KeurigDrPepper
KewauneeSci
KeyTronic
KezarLifeSci
KimballElec
KingsoftCloud
KiniksaPharm
Kirkland's
KodiakSciences
KornitDigital
KraftHeinz
KratosDefense
KrispyKreme
KronosBio
Kulicke&Soffa
KuraOncology
KuraSushiUSA
KymeraTherap
KyvernaTherap
KRNY
KVAC
KELYA
KFFB
KROS
KDP
KEQU
KTCC
KZR
KE
KC
KNSA
KIRK
KOD
KRNT
KHC
KTOS
DNUT
KRON
KLIC
KURA
KRUS
KYMR
KYTX
7.8
...
1.4
.0
...
2.5
...
...
...
...
...
...
...
...
...
4.5
...
1.3
...
1.8
...
...
...
...
23
43
16
dd
dd
22
14
cc
dd
18
dd
cc
dd
dd
dd
15
dd
dd
dd
dd
dd
cc
dd
...
5.67
10.56
21.74
3.33
46.87
34.25
42.96
4.19
.69
22.92
2.83
19.01
2.47
3.18
14.22
35.37
21.74
10.46
.79
45.67
20.61
99.91
32.11
12.53
... .11
+0.02 ...
–0.44 .075
–0.06 .10
–1.61 ...
+0.06 .215
+2.05 ...
–0.05 ...
–0.01 ...
+0.51 ...
–0.03 ...
–0.04 ...
+0.62 ...
+0.11 ...
–0.19 ...
–0.48 .40
+0.20 ...
–0.69 .035
+0.03 ...
–1.48 .20
–0.56 ...
+3.82 ...
–1.94 ...
–0.47 ...
1.13
84.16
41.30
195.59
11.44
9.51
44.47
10.62
574.42
77.21
158.88
15.70
161.13
50.20
1.86
1.38
2.18
2.04
51.96
11.34
4.75
2.70
1.76
7.56
17.67
8.25
39.13
44.27
10.12
15.40
3.00
3.79
9.00
0.92
1.56
19.38
47.17
46.46
15.01
15.47
16.03
5.90
5.95
55.08
29.48
60.95
29.63
22.01
22.19
21.93
4.50
2.06
4.74
4.31
5.77
49.24
60.00
0.60
13.88
6.00
164.00
357.11
7.85
13.99
212.80
42.75
0.45
0.32
18.53
53.91
3.60
2.38
1.22
5.50
14.18
2.29
LavaTherap
LGI Homes
LKQ
LPL Financial
LSI Inds
LakeShoreBancorp
LakelandFin
LakelandInds
LamResearch
LamarAdv
LancasterColony
LandmarkBncp
LandstarSystem
Lantheus
LanzaTechGlobal
Largo
LarimarTherap
Latham
LatticeSemi
LaureateEduc
Lavoro
LeadRealEstate
LeddarTech
LeeEnterprises
LegacyHousing
LegalZoom
LegendBiotech
LeMaitreVascular
LendingTree
LeonardoDRS
LesakaTech
Leslie's
LexeoTherap
LexiconPharm
LexinFintech
LiAuto
LibertyBroadbandA
LibertyBroadbandC
LibertyGlobalA
LibertyGlobalB
LibertyGlobalC
LibertyLatAmA
LibertyLatAmC
LibertyFormOne A
LibertyLiveA
LibertyFormOne C
LibertyLiveC
LibertySirius A
LibertySirius B
LibertySirius C
LifecoreBiomed
LifeMD
LifeStanceHealth
LifetimeBrands
LifewayFoods
LigandPharm
Light&Wonder
Lilium
Limoneira
LincolnEduc
LincolnElectric
Linde
LionsgateStudios
LiquiditySvcs
Littelfuse
LivaNova
LivePerson
LixiangEduc
LoganRidgeFin
LogitechIntl
LongboardPharm
LoopIndustries
Lottery.com
LotusTech
Lovesac
Lucid
LVTX ...
LGIH ...
LKQ 2.8
LPLA .4
LYTS 1.3
LSBK .0
LKFN 3.1
LAKE .7
LRCX .9
LAMR 4.4
LANC 1.9
LARK 4.3
LSTR .7
LNTH ...
LNZA ...
LGO ...
LRMR ...
SWIM ...
LSCC ...
LAUR .0
LVRO ...
LRE ...
LDTC ...
LEE ...
LEGH ...
LZ
...
LEGN ...
LMAT .8
TREE ...
DRS ...
LSAK ...
LESL ...
LXEO ...
LXRX ...
LX 8.7
LI
...
LBRDA ...
LBRDK ...
LBTYA ...
LBTYB ...
LBTYK ...
LILA ...
LILAK ...
FWONA ...
LLYVA ...
FWONK ...
LLYVK ...
LSXMA ...
LSXMB ...
LSXMK ...
LFCR ...
LFMD ...
LFST ...
LCUT 1.6
LWAY ...
LGND ...
LNW ...
LILM ...
LMNR 1.5
LINC ...
LECO 1.4
LIN 1.3
LION ...
LQDT ...
LFUS 1.0
LIVN ...
LPSN ...
LXEH ...
LRFC 5.4
LOGI 1.2
LBPH ...
LOOP ...
LTRY ...
LOT ...
LOVE ...
LCID ...
dd
12
14
22
17
17
17
26
34
24
38
9
28
12
dd
dd
dd
cc
47
20
dd
20
dd
dd
11
81
dd
52
dd
34
dd
71
dd
dd
2
14
9
9
dd
dd
dd
dd
dd
52
...
57
...
12
12
12
...
dd
dd
dd
18
16
39
dd
dd
14
21
34
56
30
29
dd
dd
dd
dd
26
dd
dd
dd
dd
20
dd
2.26
96.00
43.03
286.21
15.88
12.14
62.03
18.43
932.44
118.11
185.50
19.47
182.03
81.83
2.65
2.21
8.00
3.86
74.24
15.66
5.98
4.97
2.16
12.70
23.23
8.78
40.01
78.88
42.99
23.55
4.46
5.72
16.63
1.70
1.84
20.25
54.24
54.09
16.67
16.61
17.07
9.07
9.07
68.41
36.63
74.14
38.07
22.73
23.25
22.66
5.84
8.25
5.57
10.77
15.36
85.05
95.48
.89
20.02
11.72
196.36
435.52
8.33
19.61
256.60
61.07
.69
.33
22.40
100.01
18.87
2.65
1.84
9.81
28.11
2.84
–0.38 ...
+1.10 ...
+0.11 .30
+1.81 .30
–0.09 .05
–0.61 .18
+0.95 .48
+1.03 .03
–38.132.00
–1.75 1.30
+1.03 .90
+0.02 .21
+1.95 .33
+3.61 ...
–0.29 ...
+0.16 ...
+0.92 ...
+0.14 ...
–2.33 ...
–0.36 .70
+0.17 ...
–0.01 ...
–0.04 ...
–0.53 ...
–0.38 ...
+0.19 ...
–1.40 ...
–0.87 .16
–2.07 ...
–0.37 ...
–0.42 ...
+0.61 ...
+1.17 ...
+0.08 ...
–0.03 .066
–0.06 ...
+2.64 ...
+2.73 ...
+0.43 ...
–0.29 ...
+0.42 ...
+0.53 ...
+0.52 ...
+2.72 ...
–1.34 ...
+2.94 ...
–1.32 ...
+0.25 ...
–0.31 ...
+0.20 ...
+0.22 ...
+0.41 ...
–0.13 ...
+0.30.0425
–0.12 ...
–1.35 ...
+0.74 ...
... ...
+0.19 .075
–0.12 ...
–6.11 .71
–0.05 1.39
–0.37 ...
+0.32 ...
–3.45 .65
+1.47 ...
–0.02 ...
–0.05 ...
–0.10 .33
+4.001.1805
+0.07 ...
–0.15 ...
+0.01 ...
–0.19 ...
+1.66 ...
+0.06 ...
Name
Tick
Sym Yld P/E
L
6.47
141.91
59.38
287.80
16.97
12.84
73.22
19.66
1007.39
122.22
215.31
21.78
208.62
94.47
8.70
4.76
13.68
4.77
98.30
16.60
9.00
7.35
9.99
15.89
26.50
15.68
77.32
81.68
52.76
24.84
5.33
11.16
22.33
3.73
3.01
47.33
95.61
95.68
20.56
21.77
21.83
9.85
9.74
69.48
43.24
78.58
44.16
31.69
31.53
31.67
11.46
12.88
9.59
11.68
28.61
94.57
108.90
1.90
22.00
13.05
261.13
477.71
12.84
21.10
309.94
64.47
6.41
6.51
23.63
100.06
28.15
4.70
13.00
17.99
29.81
8.37
52-Week
High
Low
Name
3.26 1.05 Lulu'sFashion
516.39 293.03 lululemon
65.16 35.35 Lumentum
8.32 1.21 LuminarTech
4.55 2.01 LumosPharma
3.97 1.32 LyellImmuno
20.82 8.85 Lyft
6.79 0.31 LyraTherap
Tick
Sym Yld P/E
LVLU
LULU
LITE
LAZR
LUMO
LYEL
LYFT
LYRA
...
...
...
...
...
...
...
...
Last
Div
Chg. Amt.
dd 1.78 –0.13
26 311.99 +8.99
dd 43.50 –2.78
dd 1.64 +0.05
dd 2.25 –0.20
dd 2.77
...
dd 15.61 –0.03
dd
.33
...
...
...
...
...
...
...
...
...
M
107.00
83.27
124.96
135.51
17.48
181.02
14.59
21.88
299.98
14.15
15.73
12.00
89.83
62.36
5.75
266.94
15.10
5.75
42.95
14.88
2.20
23.45
11.26
297.97
3.62
7.36
260.57
11.75
2.00
23.38
3.33
85.76
169.58
31.70
49.24
10.20
13.90
22.64
4.99
48.86
5.55
32.58
35.09
130.86
10.49
2.66
19.86
421.00
3.99
8.35
13.91
1825.00
42.82
11.20
43.84
14.24
85.62
9.62
61.61
145.46
10.24
531.49
12.74
11.42
0.20
56.43
26.23
100.57
133.30
433.60
1999.99
2.91
8.20
25.92
16.14
161.01
84.38
28.47
27.78
4.10
31.33
24.98
2.28
12.22
17.44
35.56
13.99
46.00
12.50
170.47
54.64
7.32
58.40
61.94
74.41
63.44
0.65
110.87
8.31
3.14
119.76
8.15
6.28
9.00
25.76
31.47
2.94
180.68
7.30
3.17
22.13
4.52
1.11
18.50
1.11
196.46
1.24
4.62
170.03
10.25
0.15
15.33
1.98
46.07
75.22
18.01
27.66
4.82
5.30
16.20
1.73
25.42
2.45
1.45
13.43
88.63
6.28
1.26
7.10
207.47
0.60
3.49
6.10
1063.02
26.42
7.01
25.31
8.26
62.58
0.80
19.81
82.86
1.61
258.88
5.50
10.52
0.06
38.18
16.23
68.75
60.50
309.45
266.00
0.30
1.09
18.63
11.79
109.59
45.42
19.54
19.19
1.33
13.75
14.46
1.82
2.41
5.85
23.14
8.19
23.49
1.17
62.55
19.64
3.32
Macom Tech
MGE Energy
MGP Ingredients
MKS Instrum
MSP Recovery
MYR Group
Macatawa
Macrogenics
MadrigalPharm
MagicSoftware
Magnite
MagyarBancorp
MakeMyTrip
MalibuBoats
MammothEnergy
ManhattanAssoc
Mannatech
MannKind
Maplebear
MaravaiLifeSci
Marchex
Marex
MarinusPharm
MarketAxess
MarketWise
Marqeta
Marriott
MarsAcqn
MarsAcqnRt
MartenTransport
MartinMidstream
MarvellTech
Masimo
MasterCraftBoat
MatchGroup
Materialise
MatrixService
Mattel
Matterport
MatthewsIntl
MaxCyte
MaxeonSolar
MaxLinear
McGrathRent
MedallionFinl
MediciNova
MediWound
Medpace
MeihuaIntlMed
MeiraGTx
MelcoResorts
MercadoLibre
MercantileBank
MercerIntl
MercurySystems
Meridian
MeritMedical
MersanaTherap
Merus
MesaLabs
Mesoblast
MetaPlatforms
Metagenomi
MetalSkyStar
MetalSkyStarRt
Methanex
MetroCityBkshs
MicrochipTech
MicronTech
Microsoft
MicroStrategy
Microvast
MicroVision
MidPennBancorp
MidCapFin
Middleby
MiddlesexWater
MidlandStBncp
MidWestOneFin
MilestonePharm
MillerKnoll
MillicomIntl
Mind CTI
MindMed
MineralysTherap
MirumPharm
MissionProduce
Mobileye
MobixLabs
Moderna
ModivCare
MolecularPtrs
MTSI ...
MGEE 2.1
MGPI .6
MKSI .7
LIFW ...
MYRG ...
MCBC 2.6
MGNX ...
MDGL ...
MGIC 3.8
MGNI ...
MGYR 1.6
MMYT ...
MBUU ...
TUSK ...
MANH ...
MTEX .0
MNKD ...
CART ...
MRVI ...
MCHX ...
MRX ...
MRNS ...
MKTX 1.5
MKTW 3.1
MQ
...
MAR 1.1
MARX ...
MARXR ...
MRTN 1.4
MMLP .6
MRVL .3
MASI ...
MCFT ...
MTCH ...
MTLS ...
MTRX ...
MAT ...
MTTR ...
MATW 3.4
MXCT ...
MAXN ...
MXL ...
MGRC 1.7
MFIN 4.8
MNOV ...
MDWD ...
MEDP ...
MHUA ...
MGTX ...
MLCO ...
MELI ...
MBWM 3.7
MERC 3.2
MRCY ...
MRBK 4.8
MMSI ...
MRSN ...
MRUS ...
MLAB .7
MESO ...
META .4
MGX ...
MSSA ...
MSSAR ...
MEOH 1.4
MCBS 3.2
MCHP 1.9
MU
.4
MSFT .7
MSTR ...
MVST ...
MVIS ...
MPB 3.7
MFIC 9.4
MIDD ...
MSEX 2.4
MSBI 5.5
MOFG 4.5
MIST ...
MLKN 2.7
TIGO ...
MNDO12.6
MNMD ...
MLYS ...
MIRM ...
AVO ...
MBLY ...
MOBX ...
MRNA ...
MODV ...
MOLN ...
cc
24
18
dd
dd
30
12
dd
dd
15
dd
9
41
dd
dd
72
dd
cc
dd
dd
dd
...
dd
29
25
dd
24
38
...
25
32
dd
85
10
13
41
dd
22
dd
27
dd
dd
dd
22
4
dd
dd
39
1
dd
dd
77
7
dd
dd
10
47
dd
dd
cc
...
27
...
44
...
22
12
28
dd
36
dd
dd
dd
9
9
18
27
9
15
dd
28
cc
8
dd
dd
dd
cc
dd
dd
dd
dd
dd
101.14
80.13
77.62
126.59
.72
155.06
14.06
4.09
236.16
10.63
12.34
10.90
75.59
38.46
3.71
219.54
7.75
4.67
30.48
8.67
1.38
20.22
1.42
198.93
1.30
5.32
231.17
10.80
.22
17.70
3.11
68.81
124.50
21.10
30.63
5.00
12.08
17.79
4.40
28.33
4.48
1.88
17.77
108.98
8.31
1.36
16.31
386.34
.65
4.90
7.84
1725.58
38.31
9.50
30.95
10.34
81.15
2.33
53.24
95.70
7.44
466.83
6.38
11.29
.08
53.68
24.65
97.23
125.00
415.13
1524.49
.37
1.18
21.40
16.11
128.91
53.88
22.72
21.41
1.50
27.58
24.90
1.90
8.80
12.77
24.03
11.85
25.66
2.08
142.55
27.32
3.60
–1.19 ...
+1.91.4275
+2.39 .12
–4.42 .22
+0.02 ...
–4.26 ...
... .09
–0.46 ...
+6.58 ...
–0.01.204
–0.23 ...
–0.17 .05
–3.65 ...
+2.36 ...
+0.26 ...
–8.59 ...
+0.09 .20
–0.11 ...
–1.89 ...
–2.18 ...
–0.04 ...
–0.28 ...
+0.04 ...
–17.96 .74
–0.14 .01
–0.06 ...
–5.42 .63
... ...
+0.03 ...
+0.05 .06
....005
–7.87 .06
–2.50 ...
–0.29 ...
+1.23 ...
–0.12 ...
+0.80 ...
+0.21 ...
–0.02 ...
–0.08 .24
–0.06 ...
–1.15 ...
–0.66 ...
–1.78 .475
+0.40 .10
+0.02 ...
–0.08 ...
–4.21 ...
+0.01 ...
–0.39 ...
–0.14 ...
+32.01 ...
+0.22 .35
–0.59 .075
–0.23 ...
+0.47 .125
–0.77 ...
–0.05 ...
–6.75 ...
–15.94 .16
–0.73 ...
–11.39 .50
–0.17 ...
+0.04 ...
... ...
+0.82 .185
–0.33 .20
–1.00 .452
–4.49 .115
–15.03 .75
–160.35 ...
+0.02 ...
+0.03 ...
–0.12 .20
+0.64 .38
+4.18 ...
+0.03 .325
–0.11 .31
+0.08.2425
–0.21 ...
+0.72.1875
+0.81 ...
+0.02 .24
+0.57 ...
+0.57 ...
–0.52 ...
–0.40 ...
... ...
–0.12 ...
–24.06 ...
–0.26 ...
–0.20 ...
36
BARRON’S
NASDAQ ISSUES
D ATA
52-Week
High
Low
75.40
249.00
13.20
77.20
10.43
509.62
778.15
44.11
61.23
8.84
11.33
0.30
316.06
63.08
19.50
10.40
17.00
7.58
25.95
Last
Div
Chg. Amt.
56.25
122.13
1.92
60.75
0.74
225.25
392.10
22.35
47.13
2.44
10.40
0.01
185.15
19.35
4.18
4.73
3.23
3.01
13.82
MonarchCasino
monday.com
Mondee
Mondelez
MoneyHero
MongoDB
MonolithicPower
Monro
MonsterBev
MonteRosaTherap
MontereyCapA
MontereyCapRt
Morningstar
Morphic
MorphoSys
MotorcarParts
MuralOncology
Mynaric
MyriadGenetics
MCRI
MNDY
MOND
MDLZ
MNY
MDB
MPWR
MNRO
MNST
GLUE
MCAC
MCACR
MORN
MORF
MOR
MPAA
MURA
MYNA
MYGN
1.8
...
...
2.5
...
...
.7
4.7
...
...
...
...
.6
...
...
...
...
...
...
16
cc
dd
22
dd
dd
88
21
33
dd
dd
...
58
dd
dd
dd
dd
dd
dd
66.97
225.91
2.16
68.53
2.07
236.06
735.63
23.65
51.92
4.12
11.26
.14
288.25
30.37
18.39
5.09
3.36
4.52
22.76
+0.75 .30
–17.59 ...
–0.14 ...
+0.23 .425
–0.09 ...
–113.68 ...
–17.75 1.25
+0.14 .28
–0.78 ...
–0.04 ...
–0.03 ...
–0.03 ...
–9.35.405
–0.43 ...
–0.15 ...
–0.29 ...
–0.23 ...
–0.26 ...
–0.40 ...
17.76
30.31
149.54
24.53
1.63
88.56
167.21
10.12
0.36
4.89
4.89
46.88
36.90
61.35
43.14
2.57
27.45
13.71
367.51
5.06
0.50
2.30
14.10
3.48
17.52
23.43
11.46
6.38
69.44
81.30
344.73
10.40
18.60
8.82
90.54
12.20
1.03
3.80
24.13
11.99
10.39
5.65
5.63
6.50
0.64
5.09
18.58
18.76
10.07
132.30
0.98
32.14
3.16
4.37
0.49
2.16
4.85
10.08
0.12
1.57
1.28
0.78
8.13
0.12
1.11
208.91
36.15
10.08
62.44
7.99
36.91
0.03
9.80
25.67
45.97
23.50
90.59
111.20
3.53
10.87
1.40
0.70
Napco Security
NBT Bancorp
NICE
NMI Holdings
NN
NV5Global
NXP Semicon
NaborsEnerIIA
NanoLabs
NanoXImaging
Nanobiotix
Nasdaq
Natera
Nathan's
NationalBeverage
NatlCineMedia
NatlResearch
NationalVision
NatlWesternLife
NaturalAlt
Nature'sMiracle
NautilusBiotech
Navient
NavitasSemi
Nayax
nCino
Neogen
NerdWallet
NetApp
NetEase
Netflix
Netgear
NetScout
NeumoraTherap
Neurocrine
Neurogene
Neuronetics
NeuroPace
NewFortressEner
NewMtnFin
NewProvidenceII A
NY Mortgage
NewAmstPharma
NewellBrands
NewGenIvf
Newmark
NewsCorp A
NewsCorp B
NewtekOne
NexstarMedia
NextCure
Nextracker
NexxenIntl
NicholasFin
Nikola
9F
908Devices
99Acqn
99AcqnRt
NiuTech
Nkarta
NKGenBiotech
nLIGHT
noco-noco
Noodles
Nordson
NortheastBank
NorthernTechsIntl
NorthernTrust
NorthfieldBanc
NorthrimBanCorp
NorthViewRt
NorthwestBcshs
NorthwestPipe
NorthWesternEner
NorwoodFin
Nova
Novanta
Novavax
Novocure
Novonix
Nukkleus
NSSC .8
NBTB 3.4
NICE ...
NMIH ...
NNBR ...
NVEE ...
NXPI 1.5
NETD ...
NA
...
NNOX ...
NBTX ...
NDAQ 1.6
NTRA ...
NATH 2.8
FIZZ ...
NCMI ...
NRC 1.7
EYE ...
NWLI .1
NAII ...
NMHI ...
NAUT ...
NAVI 4.2
NVTS ...
NYAX ...
NCNO ...
NEOG ...
NRDS ...
NTAP 1.7
NTES 2.9
NFLX ...
NTGR ...
NTCT ...
NMRA ...
NBIX ...
NGNE ...
STIM ...
NPCE ...
NFE 1.6
NMFC10.2
NPAB ...
NYMT13.4
NAMS ...
NWL 3.6
NIVF ...
NMRK 1.2
NWSA .7
NWS .7
NEWT 5.3
NXST 4.1
NXTC ...
NXT ...
NEXN ...
NICK ...
NKLA ...
JFU ...
MASS ...
NNAG ...
NNAGR ...
NIU ...
NKTX ...
NKGN ...
LASR ...
NCNC ...
NDLS ...
NDSN 1.2
NBN .1
NTIC 1.5
NTRS 3.6
NFBK 5.9
NRIM 4.1
NVACR ...
NWBI 7.3
NWPX ...
NWE 5.0
NWFL 4.7
NVMI ...
NOVT ...
NVAX ...
NVCR ...
NVX ...
NUKK ...
39
14
33
8
dd
37
25
35
...
dd
dd
31
dd
15
26
1
23
dd
11
dd
3
dd
10
dd
dd
dd
cc
dd
26
14
45
dd
dd
dd
37
dd
dd
dd
12
11
cc
dd
...
dd
dd
49
75
77
9
14
dd
18
dd
dd
dd
dd
dd
95
...
dd
dd
dd
dd
3
dd
28
8
39
19
12
11
...
11
15
16
13
48
84
dd
dd
dd
dd
49.65
37.18
183.57
33.18
3.25
93.98
272.10
10.54
.49
8.36
7.04
59.03
106.53
70.89
46.20
5.55
28.08
15.09
490.50
6.45
.72
2.74
15.07
3.91
25.97
30.53
13.15
13.95
120.43
89.03
641.62
13.81
20.54
9.90
135.41
37.60
1.92
6.91
25.35
12.60
11.26
5.95
18.75
7.72
1.37
10.41
27.19
27.88
13.75
165.69
1.54
55.17
6.60
6.57
.51
2.56
6.30
10.48
.25
2.05
6.79
1.67
13.15
.19
1.88
234.72
55.59
18.42
84.24
8.86
58.41
.07
10.95
35.49
51.96
25.31
208.65
162.16
15.03
22.01
1.91
.80
–0.61 .10
+0.18 .32
–6.09 ...
+0.48 ...
... ...
–2.02 ...
–5.071.014
+0.02 ...
–0.05 ...
–0.07 ...
+0.44 ...
–3.20 .24
–2.98 ...
+3.59 .50
+0.47 ...
+0.05 ...
–2.26 .12
+0.32 ...
+2.39 .36
–0.09 ...
+0.04 ...
+0.05 ...
–0.05 .16
+0.21 ...
+0.87 ...
–0.13 ...
–0.11 ...
+0.22 ...
+4.76 .50
–1.45 .495
–5.13 ...
+0.43 ...
–0.19 ...
+0.73 ...
–3.99 ...
+5.49 ...
–0.26 ...
–0.62 ...
+0.22 .10
+0.01 .02
–0.24 ...
+0.05 .20
–0.07 ...
–0.14 .07
+0.31 ...
... .03
+0.45 .10
+0.36 .10
+0.50 .19
+7.44 1.69
–0.01 ...
–1.60 ...
+0.42 ...
+0.02 ...
–0.01 ...
–0.22 ...
–0.18 ...
+0.04 ...
... ...
+0.04 ...
+0.35 ...
+0.25 ...
–0.03 ...
–0.02 ...
+0.03 ...
–3.22 .68
–3.82 .01
+0.08 .07
+0.93 .75
–0.14 .13
+4.57 .61
–0.07 ...
–0.14 .20
+0.42 ...
+0.94 .65
+0.82 .30
–4.96 ...
–2.30 ...
–0.47 ...
–1.14 ...
–0.23 ...
–0.10 ...
Name
Tick
Sym Yld P/E
For personal non-commercial use only. Do not edit or alter. Reproductions not permitted.
To reprint or license content, please contact Barron's reprints department at 800-843-0008 or www.djreprints.com
N
52.73
43.77
270.73
34.33
5.40
119.56
282.22
11.00
4.75
22.69
11.00
64.25
110.74
83.00
55.12
5.90
47.25
27.02
493.00
7.81
11.40
4.65
19.69
11.17
30.99
37.48
24.10
17.30
121.48
118.90
664.25
15.93
31.42
21.00
148.37
53.00
5.07
18.15
40.04
13.23
13.50
10.63
26.35
11.61
17.24
11.51
28.00
28.92
19.36
187.32
2.57
62.14
7.77
7.55
3.71
5.34
12.51
11.42
0.29
4.82
16.24
12.88
15.91
11.42
3.98
279.38
62.30
19.63
89.25
13.48
59.90
0.19
13.07
36.92
59.59
34.50
219.74
187.61
17.40
82.64
3.59
10.99
June 3, 2024
52-Week
High
Low
18.12
73.69
89.39
25.51
37.41
1158.19
20.00
B A R R ON S .C OM / D ATA
Last
Div
Chg. Amt.
4.22
26.47
38.78
24.99
13.32
373.56
4.00
NurixTherap
Nutanix
Nuvalent
NuvPfd&Incm
Nuvei
NVIDIA
Nyxoah
NRIX ...
NTNX ...
NUVL ...
NPFI 5.0
NVEI 1.2
NVDA .0
NYXH ...
dd
dd
dd
...
dd
64
dd
15.75
55.32
65.62
25.43
32.20
1096.33
9.41
+0.58 ...
–17.54 ...
–2.33 ...
+0.01.1266
+0.13 .10
+31.64 .01
+0.91 ...
24.12
37.61
59.34
7.98
0.85
860.10
103.04
18.41
0.44
12.01
2.00
9.05
1.81
21.67
65.04
1.19
149.00
12.36
12.11
5.54
14.10
53.61
42.80
58.02
1.30
0.92
4.17
25.69
5.98
3.72
0.97
3.45
0.42
20.07
4.57
28.19
1.80
10.30
2.05
1.60
2.26
0.80
26.17
4.38
4.22
0.97
5.07
9.57
23.10
68.96
3.34
1.92
2.57
4.41
2.60
OddityTech
ODP
ON Semi
OP Bancorp
OPKO Health
OReillyAuto
OSI Systems
OaktreeSpec
Oatly
OceanFirstFin
OcularTherapeutix
Oculis
OfficePropIncm
OhioValleyBanc
Okta
Olaplex
OldDomFreight
OldNatlBncp
Old2ndBcp
OlemaPharm
OlinkHolding
Ollie'sBargain
OlympicSteel
OmegaFlex
OmegaTherap
Omeros
OmniAb
Omnicell
1-800-FLOWERS
180DegreeCap
111
1stdibs.com
OneMedNet
OneWaterMarine
OpenLending
OpenText
OpendoorTech
Opera
OportunFin
Opthea
OpticalCable
Optinose
OptionCare
OraSureTechs
OrchestraBioMed
OrganiGram
OricPharm
OrthofixMed
OrthoPediatrics
OtterTail
Outbrain
OutsetMedical
OvidTherap
OxfordLane
OxfordSquare
ODD ...
ODP ...
ON
...
OPBK 4.9
OPK ...
ORLY ...
OSIS ...
OCSL11.3
OTLY ...
OCFC 5.3
OCUL ...
OCS ...
OPI 1.7
OVBC 3.8
OKTA ...
OLPX ...
ODFL .6
ONB 3.3
OSBC 1.4
OLMA ...
OLK ...
OLLI ...
ZEUS 1.2
OFLX 2.2
OMGA ...
OMER ...
OABI ...
OMCL ...
FLWS ...
TURN ...
YI
...
DIBS ...
ONMD ...
ONEW ...
LPRO ...
OTEX 3.4
OPEN ...
OPRA 5.6
OPRT ...
OPT ...
OCC ...
OPTN ...
OPCH ...
OSUR ...
OBIO ...
OGI ...
ORIC ...
OFIX ...
KIDS ...
OTTR 2.1
OB
...
OM
...
OVID ...
OXLC19.8
OXSQ13.6
cc
19
15
7
dd
24
20
15
dd
9
dd
dd
dd
10
dd
25
31
9
7
dd
dd
28
14
31
dd
dd
dd
dd
dd
dd
dd
dd
dd
dd
54
47
dd
7
dd
dd
dd
dd
20
16
dd
dd
dd
dd
dd
12
24
dd
dd
5
16
35.91
39.16
73.04
9.80
1.37
963.26
143.74
19.52
1.09
15.05
5.70
11.76
2.29
23.31
88.68
1.78
175.25
17.09
14.46
9.68
23.95
82.43
52.14
59.21
1.98
3.36
4.34
32.59
9.68
3.82
1.18
5.39
2.42
25.84
6.47
29.25
2.18
13.94
3.38
2.84
2.82
1.08
29.82
4.73
6.93
1.71
8.99
13.73
31.58
90.47
4.59
3.73
3.06
5.46
3.09
–0.77 ...
+0.11 ...
+0.48 ...
+0.18 .12
+0.01 ...
–23.70 ...
+0.90 ...
+0.34 .55
–0.01 ...
+0.05 .20
–0.09 ...
–0.09 ...
+0.06 .01
–0.19 .22
–8.48 ...
+0.21 ...
+2.19 .26
+0.20 .14
+0.07 .05
+0.62 ...
–0.02 ...
+4.05 ...
–1.26 .15
–5.70 .33
–0.15 ...
+0.01 ...
–0.05 ...
–0.04 ...
+0.26 ...
... ...
–0.02 ...
–0.15 ...
+0.12 ...
+0.15 ...
–0.03 ...
–0.82 .25
+0.05 ...
+0.02 .40
+0.02 ...
–0.36 ...
+0.01 ...
–0.03 ...
+0.78 ...
–0.12 ...
+1.63 ...
–0.11 ...
+0.44 ...
–1.16 ...
–0.96 ...
–0.43.4675
–0.22 ...
–0.14 ...
+0.06 ...
+0.07 .09
... .035
13.51
14.13
43.92
66.40
26.12
13.50
0.43
1.18
11.85
24.83
134.61
17.53
70.37
1.25
17.86
25.33
6.95
0.40
201.17
48.08
46.20
13.40
10.12
16.41
0.58
41.79
12.48
10.64
68.97
1.97
23.63
9.73
106.27
12.16
139.40
4.22
50.25
PAM Transport
PCB Bancorp
PCConnection
PDD
PDF Solutions
PENN Entmt
PLBY Group
PMV Pharm
PRA Group
ProceptBio
PTC
PTC Therap
Paccar
PacBiosciCA
PacificPremBncp
PaciraBioSci
PactivEvergreen
PalladyneAI
PaloAltoNtwks
Palomar
PapaJohn's
ParamountA
ParamountB
Park-Ohio
PassageBio
PathwardFinl
PatriaInvts
PatriaLatAm
PatrickIndustries
PatriotNatBncp
Patterson
PattersonUTIEn
Paychex
PaycorHCM
Paylocity
Payoneer
PayPal
PTSI ...
PCB 4.7
CNXN .5
PDD ...
PDFS ...
PENN ...
PLBY ...
PMVP ...
PRAA ...
PRCT ...
PTC ...
PTCT ...
PCAR 1.1
PACB ...
PPBI 5.9
PCRX ...
PTVE 3.2
PDYN ...
PANW ...
PLMR ...
PZZA 4.0
PARAA 1.0
PARA 1.7
PKOH 1.9
PASG ...
CASH .4
PAX 7.9
PLAO ...
PATK 1.9
PNBK ...
PDCO 4.2
PTEN 2.9
PAYX 3.3
PYCR ...
PCTY ...
PAYO ...
PYPL ...
27
9
22
20
cc
dd
dd
dd
dd
dd
74
dd
11
dd
cc
22
dd
dd
43
24
20
dd
dd
29
dd
8
16
28
17
dd
12
16
26
dd
41
20
16
16.62
15.22
67.64
149.78
35.02
17.50
.92
1.82
21.58
66.40
176.24
36.36
107.50
1.79
22.24
30.33
12.36
1.95
294.91
84.84
46.46
20.67
11.91
26.15
1.14
53.31
13.00
11.41
114.60
1.97
24.59
11.02
120.16
12.37
142.17
5.99
62.99
–0.32 ...
+0.04 .18
–0.54 .10
–7.79 ...
–0.41 ...
+1.47 ...
+0.02 ...
–0.22 ...
–0.16 ...
–0.50 ...
–6.76 ...
–0.84 ...
–1.93 .30
–0.08 ...
+0.10 .33
+0.64 ...
–0.19 .10
–0.01 ...
–26.69 ...
+3.10 ...
–1.16 .46
–0.17 .05
–0.05 .05
+0.13 .125
+0.01 ...
–1.94 .05
–0.01 .175
... ...
+1.61 .55
–0.28 ...
+0.65 .26
+0.22 .08
–4.07 .98
–0.64 ...
–11.47 ...
–0.04 ...
+1.35 ...
Name
Tick
Sym Yld P/E
O
56.00
58.98
111.35
11.49
2.24
1169.11
145.25
21.64
2.32
19.58
11.31
14.50
8.80
25.95
114.50
4.26
227.80
17.82
16.76
17.79
26.01
84.38
73.49
114.50
8.88
7.80
6.72
77.14
11.42
4.97
3.36
6.30
13.51
39.15
11.73
45.47
5.41
28.58
7.73
4.40
4.65
2.10
35.74
8.45
17.21
2.91
16.65
21.60
48.47
99.49
5.95
24.13
4.14
5.70
3.29
PQ
28.77
19.04
70.55
164.69
48.02
29.38
2.01
9.72
31.43
77.00
194.24
45.68
125.50
14.55
30.13
41.65
15.84
3.25
380.84
89.22
86.38
26.34
17.50
28.79
1.79
60.49
16.20
11.97
123.58
10.06
34.53
16.18
129.70
27.51
230.52
6.48
76.54
52-Week
High
Low
31.49
11.23
69.26
9.87
24.09
27.59
34.85
31.59
49.99
17.51
192.38
24.66
16.52
96.93
3.61
36.86
10.73
2.60
9.74
22.98
16.04
16.71
33.00
17.02
47.30
18.70
37.92
34.16
39.00
92.33
1.38
3.08
19.03
19.77
9.85
5.01
12.90
114.27
24.74
4.96
10.19
36.52
422.73
93.09
23.99
21.12
4.27
14.36
54.44
209.14
99.60
5.67
13.70
67.21
1.88
81.13
184.82
6.03
24.87
28.30
15.00
5.74
87.99
17.20
13.69
38.20
86.79
29.42
4.95
15.38
14.32
62.34
44.95
15.00
6.69
33.34
5.24
77.13
15.40
14.55
25.36
14.84
7.73
34.00
3.33
6.85
62.94
14.40
32.88
21.57
121.65
217.43
206.35
10.56
29.70
1.32
3.90
10.34
2.20
2.55
89.11
1.70
20.63
10.32
37.66
2.70
10.31
17.01
24.84
17.31
36.26
3.72
155.83
11.85
7.91
42.51
2.00
10.77
6.17
0.89
1.41
13.04
3.92
8.71
8.20
6.07
32.00
9.40
29.33
18.03
19.96
51.19
0.71
0.94
13.03
13.78
6.88
1.90
6.25
87.21
11.21
0.72
7.31
10.21
308.46
58.00
9.55
16.27
1.54
7.12
39.86
56.05
62.13
1.64
10.07
12.60
0.84
47.00
104.96
1.66
14.39
18.65
2.85
0.10
61.82
4.11
7.48
24.91
66.21
15.92
1.95
14.74
6.46
49.00
23.90
7.40
5.03
13.72
1.04
19.52
10.16
0.51
10.92
7.11
2.13
17.08
0.55
1.35
39.06
0.67
8.24
13.68
80.62
104.33
122.53
1.41
14.26
0.24
1.12
10.07
1.00
0.33
37.78
0.83
Name
PeapackGladFin
PearlHldgsAcqnA
Pegasystems
Peloton
Pennant
PennsWoodsBncp
PeoplesBncpOH
PeoplesBncpNC
PeoplesFinSvcs
PepGen
PepsiCo
PerdoceoEduc
PerellaWeinberg
Perficient
PerformantFin
PerionNetwork
Perma-PipeIntl
Personalis
PetcoHealth
PetIQ
PetMedExpress
Pharming
Pharvaris
PhathomPharm
Phenixfin
PhibroAnimal
PhillipsEdison
Photronics
Pilgrim'sPride
PinnacleFinPtrs
PintecTech
Pixelworks
PlainsAllAmPipe
PlainsGP
PlayaHotels
Playstudios
Playtika
Plexus
PliantTherap
PolestarAuto
PonceFinl
PonoCapTwoA
Pool
Popular
Portillo's
PortmanRidge
PoseidaTherap
Potbelly
PotlatchDelt
PowellIndustries
PowerIntegrations
PowerFleet
PowerUpAcqn
PraxisPrecision
Precigen
PreferredBkLA
PreformedLine
PreludeTherap
PremierFinl
Premier
Prenetics
PrestoAutomation
PriceSmart
PrimeMedicine
PrimisFinl
PrincetonBncp
PrincipalFinl
PriviaHealth
Procaps
ProficientAuto
ProFrac
ProgressSoftware
Progyny
ProjectEnReimag
ProspectCapital
ProtagonistTherap
ProtaraTherap
Prothena
ProvidentFin
PsyenceBiomed
PubMatic
Pulmonx
PumaBiotech
PureTechHealth
PurpleInnovation
PyxisOncology
QCR Holdings
QT Imaging
Q32Bio
QifuTechnology
Qorvo
Qualcomm
Qualys
QuantaSing
Quanterix
Quantum
Quantum-Si
QuettaAcqn
QuettaAcqnRt
Quhuo
QuidelOrtho
QuinceTherap
Tick
Sym Yld P/E
PGC .9
PRLH ...
PEGA .2
PTON ...
PNTG ...
PWOD 6.4
PEBO 5.5
PEBK 2.5
PFIS 4.2
PEPG ...
PEP 3.1
PRDO 2.0
PWP 1.8
PRFT ...
PFMT ...
PERI ...
PPIH ...
PSNL ...
WOOF ...
PETQ ...
PETS28.2
PHAR ...
PHVS ...
PHAT ...
PFX .0
PAHC 2.7
PECO 3.7
PLAB ...
PPC ...
PNFP 1.1
PT
...
PXLW ...
PAA 7.5
PAGP 7.1
PLYA ...
MYPS ...
PLTK 4.6
PLXS ...
PLRX ...
PSNY ...
PDLB ...
PTWO ...
POOL 1.3
BPOP 2.8
PTLO ...
PTMN13.9
PSTX ...
PBPB ...
PCH 4.2
POWL .6
POWI 1.1
PWFL ...
PWUP ...
PRAX ...
PGEN ...
PFBC 3.7
PLPC .6
PRLD ...
PFC 6.3
PINC 4.4
PRE ...
PRST ...
PSMT 1.4
PRME ...
FRST 3.8
BPRN 3.9
PFG 3.5
PRVA ...
PROC ...
PAL ...
ACDC ...
PRGS 1.4
PGNY ...
PEGR ...
PSEC12.8
PTGX ...
TARA ...
PRTA ...
PROV 4.4
PBM ...
PUBM ...
LUNG ...
PBYI ...
PRTC ...
PRPL ...
PYXS ...
QCRH .4
QTI
...
QTTB ...
QFIN 5.5
QRVO ...
QCOM 1.7
QLYS ...
QSG ...
QTRX ...
QMCO ...
QSI
...
QETA ...
QETAR ...
QH
...
QDEL ...
QNCX ...
10
48
70
dd
43
9
9
10
12
dd
26
10
dd
32
dd
6
7
dd
dd
cc
dd
dd
dd
dd
4
54
68
13
17
11
dd
dd
15
21
18
dd
16
30
dd
dd
38
dd
28
13
25
12
dd
74
75
21
83
dd
cc
dd
dd
7
13
dd
6
29
dd
dd
21
dd
24
8
16
cc
5
...
dd
33
44
80
26
11
dd
dd
12
dd
cc
dd
12
dd
dd
dd
8
dd
dd
5
dd
27
33
6
dd
dd
dd
80
...
7
dd
dd
Last
Div
Chg. Amt.
52-Week
High
Low
21.70
11.10
57.46
3.64
23.54
19.87
29.15
30.27
38.99
16.33
172.90
22.50
15.44
74.15
3.07
12.50
8.95
1.30
3.86
20.76
4.26
9.15
18.96
9.42
45.20
17.63
31.94
27.35
35.93
79.51
1.16
1.07
17.01
18.01
8.52
2.27
8.74
110.14
12.13
.78
9.36
15.12
363.55
89.01
10.02
19.89
2.99
8.95
42.73
179.86
76.01
5.31
11.25
47.46
1.40
74.72
134.34
3.85
19.71
18.92
5.99
.11
84.15
6.48
10.49
30.61
82.04
17.37
2.76
15.31
9.62
50.65
26.95
9.44
5.62
28.15
2.81
20.81
12.70
.75
21.90
7.25
3.85
32.98
1.25
3.74
56.67
.72
25.50
19.32
98.39
204.05
140.62
2.61
15.97
.46
1.52
10.31
1.25
.53
44.19
.83
–0.48 .05
+0.13 ...
–2.47 .03
+0.49 ...
+0.05 ...
–0.03 .32
–0.10 .40
+0.38 .19
–2.08 .41
+1.77 ...
–5.091.355
–0.84 .11
–0.49 .07
+0.34 ...
–0.02 ...
+0.74 ...
–0.05 ...
–0.04 ...
+0.28 ...
+0.96 ...
+0.14 .30
–0.16 ...
–1.22 ...
–1.08 ...
–0.05 1.31
–0.92 .12
+0.51.0975
+0.97 ...
–0.51 ...
+0.13 .22
+0.06 ...
+0.09 ...
–0.04.3175
–0.04.3175
+0.08 ...
–0.04 ...
+0.28 .10
–3.19 ...
–0.60 ...
... ...
+0.19 ...
+1.98 ...
+1.09 1.20
–0.21 .62
+0.04 ...
+0.22 .69
+0.02 ...
+0.30 ...
–0.02 .45
–21.41 .265
–1.18 .20
–0.01 ...
–0.50 ...
+3.38 ...
+0.04 ...
–1.93 .70
+2.96 .20
–0.24 ...
–0.50 .31
–0.07 .21
+0.23 ...
–0.04 ...
+0.35 .58
–0.44 ...
–0.21 .10
–0.07 .30
–0.18 .71
+0.06 ...
... ...
+0.33 ...
+0.43 ...
+0.34 .175
–0.05 ...
+0.45 ...
–0.07 .06
–2.26 ...
+0.01 ...
+0.77 ...
–0.04 .14
–0.08 ...
–1.85 ...
–0.82 ...
–0.15 ...
+3.73 ...
–0.03 ...
–0.07 ...
–1.35 .06
–0.13 ...
–0.50 ...
–0.67 .57
+0.10 ...
–6.31 .85
–5.86 ...
+0.34 ...
–0.45 ...
... ...
–0.10 ...
+0.02 ...
... ...
–0.05 ...
+1.79 ...
–0.02 ...
19.58 8.08 QuinStreet
9.15 3.66 QurateRetailB
1.80 0.40 QurateRetailA
Name
Tick
Sym Yld P/E
Last
Div
Chg. Amt.
QNST ... dd 17.61 –0.83
QRTEB ... dd 3.93 –0.08
QRTEA ... dd
.71 –0.02
...
...
...
R
27.35
20.22
79.46
32.15
28.80
11.70
0.21
5.08
22.53
18.70
3.10
36.64
60.21
20.94
9.14
22.70
19.80
76.38
8.75
1.19
61.88
5.21
4.64
16.75
58.00
15.76
63.29
17.68
13.10
0.30
68.47
998.33
28.00
13.32
7.22
27.95
4.04
9.45
7.79
58.00
13.85
211.13
24.81
57.54
9.21
17.24
15.17
32.45
40.63
30.54
52.57
3.65
19.58
1.77
5.32
6.57
28.06
17.00
22.34
32.53
40.14
5.99
13.24
108.84
86.57
565.00
151.12
11.93
134.56
34.65
53.78
53.35
66.54
150.73
3.88
10.67
41.79
14.40
11.83
10.39
0.01
2.51
15.36
8.87
1.15
16.57
25.11
13.53
1.23
6.13
8.50
48.13
1.82
0.74
35.22
0.21
1.26
4.97
44.42
5.56
37.82
4.26
4.98
0.07
56.29
684.81
4.28
5.70
2.36
12.90
0.24
0.98
4.78
4.46
2.98
110.45
4.92
41.35
5.19
10.59
10.99
2.59
15.44
24.80
15.50
1.78
8.08
0.71
2.01
3.37
8.26
2.70
7.91
14.89
11.78
2.80
8.24
55.01
4.72
447.95
100.99
10.22
100.55
25.92
34.68
38.75
20.66
87.18
RaptTherap
RBB Bancorp
RCI Hospitality
RCM Tech
REGENXBIO
RF Acqn A
RF Acqn Rt
RF Industries
RGC Resources
R1 RCM
RackspaceTech
RadiusRecycling
RadNet
Radware
Rallybio
RamacoRscsA
RamacoRscsB
Rambus
RaniTherap
RapidMicro
Rapid7
RealGoodFood
RealReal
RecursionPharm
RedRiverBcshs
RedRobin
RedRockResorts
Redfin
RedwoodsAcqn
RedwoodsAcqnRt
RegencyCtrs
RegenPharm
Regis
RelayTherap
RelmadaTherap
RemitlyGlobal
Renalytix
ReneoPharm
ReNewEnergy
RenttheRunway
RepareTherap
Repligen
Replimune
RepublicBcpKYA
ReservoirMedia
ResourcesConnect
RetailOppor
RevanceTherap
RevolutionMed
ReynoldsCnsmr
RhythmPharm
RibbonComms
RichardsonElec
RigelPharm
RiminiStreet
RiverviewBncp
Rivian
Roadzen
Robinhood
RocketPharm
RockyBrands
RockyMtnChoc
RoivantSciences
Roku
Root
RoperTech
RossStores
RothCHAcqnV
RoyalGold
RoyaltyPharma
RushEnt A
RushEnt B
RxSight
Ryanair
RAPT ...
RBB 3.5
RICK .5
RCMT ...
RGNX ...
RFAC ...
RFACR ...
RFIL ...
RGCO 3.9
RCM ...
RXT ...
RDUS 4.4
RDNT ...
RDWR ...
RLYB ...
METC ...
METCB 8.7
RMBS ...
RANI ...
RPID ...
RPD ...
RGF ...
REAL ...
RXRX ...
RRBI .8
RRGB ...
RRR 2.0
RDFN ...
RWOD ...
RWODR ...
REG 4.4
REGN ...
RGS ...
RLAY ...
RLMD ...
RELY ...
RNLX ...
RPHM ...
RNW ...
RENT ...
RPTX ...
RGEN ...
REPL ...
RBCAA 3.1
RSVR ...
RGP 4.9
ROIC 4.8
RVNC ...
RVMD ...
REYN 3.2
RYTM ...
RBBN ...
RELL 2.1
RIGL ...
RMNI ...
RVSB 5.6
RIVN ...
RDZN ...
HOOD ...
RCKT ...
RCKY 1.6
RMCF ...
ROIV ...
ROKU ...
ROOT ...
ROP .6
ROST 1.1
ROCL ...
RGLD 1.2
RPRX 3.1
RUSHA 1.5
RUSHB 1.6
RXST ...
RYAAY 1.5
dd
9
22
10
dd
dd
...
dd
16
dd
dd
dd
cc
dd
dd
12
18
17
dd
dd
dd
dd
dd
dd
10
dd
21
dd
cc
...
30
29
dd
dd
dd
dd
dd
dd
51
dd
dd
cc
dd
11
cc
17
43
dd
dd
18
dd
dd
63
dd
11
24
dd
55
cc
dd
22
dd
2
dd
dd
39
24
dd
38
15
10
9
dd
13
4.01
18.37
44.74
19.85
14.35
11.04
.10
3.21
20.70
12.86
1.96
17.11
58.64
20.29
1.67
14.15
10.89
55.26
5.50
.80
36.14
.52
4.31
8.28
45.86
8.10
51.25
6.44
6.42
.25
61.40
980.16
4.28
6.41
3.00
13.00
.41
1.66
5.99
24.00
3.48
149.09
5.27
51.79
8.04
11.45
12.52
2.84
38.33
28.44
35.68
3.14
11.19
.98
2.57
4.27
10.92
3.00
20.90
21.32
38.99
2.80
10.36
57.40
50.84
532.76
139.76
10.98
128.19
27.41
45.13
42.27
58.47
121.64
–0.17 ...
–0.30 .16
–2.51 .06
–1.78 ...
–0.57 ...
... ...
–0.01 ...
+0.02 ...
+0.52 .20
+0.38 ...
+0.03 ...
–0.49.1875
+0.10 ...
+0.16 ...
+0.11 ...
+0.02 ...
–0.43.2376
–0.44 ...
+1.06 ...
–0.02 ...
–1.88 ...
–0.02 ...
+0.17 ...
–0.88 ...
–0.34 .09
+1.31 ...
+1.54 .25
+0.43 ...
+0.34 ...
–0.05 ...
+2.11 .67
–4.86 ...
–0.66 ...
–0.41 ...
–0.05 ...
–0.71 ...
–0.01 ...
... ...
–0.08 ...
–5.19 ...
+0.36 ...
–9.07 ...
+0.05 ...
–0.62 .407
+0.19 ...
+0.29 .14
+0.43 .15
+0.13 ...
+0.38 ...
–0.07 .23
–1.08 ...
+0.03 ...
+0.37 .06
+0.07 ...
–0.02 ...
+0.41 .06
+0.48 ...
–0.74 ...
+0.39 ...
–0.10 ...
+3.11 .155
–0.19 ...
–0.62 ...
+0.64 ...
–4.66 ...
–11.90 .75
–2.37.3675
+0.01 ...
–0.32 .40
+0.79 .21
+0.58 .17
+0.77 .17
–2.68 ...
–1.00.9653
24.51
183.64
2.69
1.35
52.20
13.34
4.22
10.56
12.26
13.93
12.66
151.96
0.11
46.61
3.76
15.26
11.23
1.81
65.78
17.50
10.78
2.13
S&T Bancorp
SBA Comm
Schmid
SCYNEXIS
SEI Investments
SI-BONE
SIGA Tech
SKGrowthOppsA
SLM
SLR Invt
SMART Global
SPS Commerce
Srivaru
SS&C Tech
SSR Mining
SWK Holdings
SabraHealthcare
Sabre
SafetyInsurance
SagaComm
SageTherap
Sagimet
STBA 4.1
SBAC 2.0
SHMD ...
SCYX ...
SEIC 1.4
SIBN ...
SIGA .0
SKGR ...
SLM 2.1
SLRC10.0
SGH ...
SPSC ...
SVMH ...
SSNC 1.5
SSRM 5.2
SWKH ...
SBRA 8.2
SABR ...
SAFT 4.7
SGA 5.6
SAGE ...
SGMT ...
9
39
dd
1
19
dd
7
49
7
9
...
cc
50
25
dd
18
69
dd
22
15
dd
dd
31.91
196.68
4.70
2.42
67.71
14.05
7.48
11.11
21.46
16.44
20.58
188.09
.17
62.05
5.34
17.23
14.58
3.13
77.35
17.76
11.11
5.33
–0.97
+8.59
+0.38
+0.06
–0.48
+0.50
+0.02
+0.04
+0.48
+0.15
+0.04
–5.77
–0.04
+0.23
–0.09
+0.01
+0.16
+0.05
+0.68
–1.69
–0.67
+0.51
S
36.28
258.76
11.50
3.87
72.54
29.51
10.83
11.61
22.74
16.45
29.99
218.74
2.57
65.86
15.46
18.75
14.92
5.77
88.72
27.00
59.99
20.71
.33
.98
...
...
.46
...
.60
...
.11
.41
...
...
...
.24
.07
...
.30
...
.90
.25
...
...
52-Week
High
Low
628.34
12.00
27.90
127.26
1.67
6.40
69.80
55.72
35.33
146.68
5.70
50.95
21.17
45.98
59.24
145.17
11.75
11.02
29.98
101.26
8.41
9.75
5.65
109.58
42.61
63.37
1.94
1.79
12.36
6.26
9.39
5.75
5.53
1.80
11.76
25.51
7.99
28.34
334.90
38.67
14.51
27.36
23.21
9.67
27.72
40.70
166.94
95.33
34.13
21.59
11.66
23.20
20.82
52.69
17.59
7.95
141.99
19.41
38.64
79.56
115.69
39.98
2.48
18.05
12.06
2.34
11.70
12.72
4.05
8.00
303.31
15.88
15.05
3.20
13.85
16.60
19.76
7.37
19.40
2.50
10.25
30.22
39.36
55.45
30.74
34.40
11.35
24.51
15.40
1.89
18.14
15.57
6.34
11.13
0.24
53.92
82.96
5.95
47.97
59.24
8.59
3.16
288.72
2.75
19.27
90.02
0.29
2.18
43.41
42.63
24.39
55.25
2.60
26.99
5.77
32.50
20.76
99.34
3.24
2.44
19.04
57.06
5.40
6.50
1.46
92.06
13.13
32.50
0.51
1.08
1.52
0.54
5.23
1.41
1.02
0.48
1.33
11.87
1.47
6.29
157.00
19.63
9.66
9.81
16.22
1.04
4.84
13.75
74.56
49.50
6.08
17.20
7.29
13.93
13.36
32.69
9.39
2.70
72.39
1.44
21.94
31.54
85.06
9.00
1.50
10.38
6.70
0.83
6.41
7.80
0.63
4.00
46.86
3.50
1.81
1.10
0.37
2.33
9.78
2.13
10.71
1.13
1.49
21.96
23.65
37.20
19.61
25.38
10.07
18.57
0.28
0.99
10.46
8.08
2.74
10.50
0.02
18.00
32.12
0.67
2.66
26.66
3.83
1.57
Name
Saia
SanaBiotech
SandySpringBncp
Sanfilippo
SangamoTherap
SangomaTechs
Sanmina
Sanofi
SapiensIntl
SareptaTherap
Savara
ScanSource
ScholarRock
Scholastic
Schrodinger
ScienceApplicat
scPharm
ScrippsEW
SeacoastBkgFL
Seagate
SecureWorks
SecurityNatFin
Seer
SelectiveIns
Semtech
SenecaFoods A
SenseiBiotherap
SenstarTech
SeraPrognostics
SeresTherap
ServiceProperties
17Educ&Tech
Shapeways
Sharecare
ShattuckLabs
ShenandoahTel
Shimmick
ShoalsTech
ShockwaveMed
ShoeCarnival
ShoreBancshares
Shyft
SierraBancorp
SightSciences
SilenceTherap
Silicom
SiliconLabs
SiliconMotion
SilkRoadMed
Silvaco
SilverSpikeInvt
SilvercrestAsset
SimmonsFirstNat
SimulationsPlus
Sinclair
SiriusXM
SiTime
SkyeBioscience
SkywardSpecIns
SkyWest
Skyworks
SleepNumber
SmartSand
Smith&Wesson
SnapOne
SoYoungIntl
SoFiTech
Sohu.com
Sol-GelTech
SolarBank
SolarEdgeTech
SolarmaxTech
SolidBiosci
SolidPower
SolidionTech
Sonder
Sonos
SophiaGenetics
SoteraHealth
SotherlyHotels
SoundHoundAI
SouthPlainsFin
SouthernFirstBcsh
SoMO Bancorp
SouthernStBcsh
SouthsideBcshs
SparkIAcqnA
SpartanNash
Spectaire
SperoTherap
SpokHoldings
Sportradar
SportsmansWrhs
SpringValleyII A
SpringValleyII Rt
SpringWorks
SproutsFarmers
SpruceBio
SpyreTherapeutics
StaarSurgical
Stagwell
StdBioTools
Tick
Sym Yld P/E
SAIA ...
SANA ...
SASR 5.8
JBSS .8
SGMO ...
SANG ...
SANM ...
SNY ...
SPNS 1.6
SRPT ...
SVRA ...
SCSC ...
SRRK ...
SCHL 2.2
SDGR ...
SAIC 1.1
SCPH ...
SSP ...
SBCF 3.0
STX 3.0
SCWX ...
SNFCA ...
SEER ...
SIGI 1.4
SMTC ...
SENEA ...
SNSE ...
SNT ...
SERA ...
MCRB ...
SVC 14.9
YQ
...
SHPW ...
SHCR ...
STTK ...
SHEN .5
SHIM ...
SHLS ...
SWAV ...
SCVL 1.4
SHBI 4.2
SHYF 1.6
BSRR 4.4
SGHT ...
SLN ...
SILC ...
SLAB ...
SIMO 1.9
SILK ...
SVCO ...
SSIC 8.6
SAMG 5.0
SFNC 4.8
SLP .5
SBGI 7.0
SIRI 3.8
SITM ...
SKYE ...
SKWD ...
SKYW ...
SWKS 2.9
SNBR ...
SND ...
SWBI 2.9
SNPO ...
SY
.0
SOFI ...
SOHU ...
SLGL ...
SUUN ...
SEDG ...
SMXT ...
SLDB ...
SLDP ...
STI
...
SOND ...
SONO ...
SOPH ...
SHC ...
SOHO ...
SOUN ...
SPFI 2.1
SFST ...
SMBC 2.0
SSBK 1.4
SBSI 5.4
SPKL ...
SPTN 4.4
SPEC ...
SPRO ...
SPOK 8.2
SRAD ...
SPWH ...
SVII ...
SVIIR ...
SWTX ...
SFM ...
SPRB ...
SYRE ...
STAA ...
STGW ...
LAB ...
30
dd
11
18
dd
dd
16
21
29
cc
dd
15
dd
25
dd
15
dd
dd
17
dd
dd
9
dd
17
dd
13
dd
27
dd
dd
dd
dd
dd
dd
dd
cc
dd
44
78
14
20
...
9
dd
dd
dd
dd
45
dd
...
10
16
13
93
dd
8
dd
dd
14
27
17
dd
11
29
dd
62
dd
dd
dd
78
dd
dd
dd
dd
dd
dd
dd
dd
58
dd
dd
7
17
9
7
10
cc
13
2
3
18
cc
dd
30
...
dd
27
dd
dd
cc
dd
dd
Last
Div
Chg. Amt.
409.48
7.50
23.44
100.83
.56
5.78
68.54
49.03
33.52
129.86
4.09
47.43
9.39
36.28
21.52
134.65
3.91
2.72
23.67
93.24
5.83
8.04
1.80
97.61
38.89
59.12
.74
1.46
9.00
1.00
5.38
2.87
1.02
.81
7.38
18.81
1.96
7.87
334.75
37.75
11.31
12.67
21.02
6.56
20.99
15.90
126.17
78.09
21.74
18.27
11.35
15.28
17.38
48.24
14.20
2.82
121.82
11.61
37.32
74.67
92.66
15.12
2.25
16.77
10.72
1.06
6.90
12.40
.80
6.11
48.99
6.13
8.26
1.77
2.09
3.51
15.80
4.99
11.18
1.36
5.05
27.15
27.47
42.11
26.53
26.81
10.34
19.65
.35
1.42
15.21
10.19
3.81
11.10
.15
41.46
78.98
.74
34.95
41.53
6.93
2.48
+9.48 ...
–0.52 ...
+0.28 .34
+0.67 1.00
–0.03 ...
+0.73 ...
+0.85 ...
+0.49 ...
–0.58 .28
+6.40 ...
+0.01 ...
–2.20 ...
–1.28 ...
–0.74 .20
–0.46 ...
–2.98 .37
+0.40 ...
+0.27 ...
+0.46 .18
–0.95 .70
–0.32 ...
+0.20 ...
–0.14 ...
+1.01 .35
–1.36 ...
–1.20 ...
–0.05 ...
–0.02 ...
+0.35 ...
+0.08 ...
–0.19 .20
–0.03 ...
–0.21 ...
–0.01 ...
–0.11 ...
+0.99 .09
+0.38 ...
–0.18 ...
+0.60 ...
+0.68 .135
+0.02 .12
+0.14 .05
–0.49 .23
+0.99 ...
–0.92 ...
–0.14 ...
–1.63 ...
–0.60 .50
–0.19 ...
–0.69 ...
–0.02 .25
+0.20 .19
–0.27 .21
–1.59 .06
+1.88 .25
+0.07.0266
–3.36 ...
–0.45 ...
+0.96 ...
–0.38 ...
+0.50 .68
+1.63 ...
+0.07 ...
+0.66 .12
+0.02 ...
+0.02 .06
–0.02 ...
+0.29 ...
... ...
... ...
+0.97 ...
–3.91 ...
+0.47 ...
–0.01 ...
–0.33 ...
+0.12 ...
–0.44 ...
+0.26 ...
–0.02 ...
–0.05 ...
–0.01 ...
+0.04 .14
–0.32 ...
–0.12 .21
+0.81 .09
+0.22 .36
+0.06 ...
–0.78.2175
+0.06 ...
–0.05 ...
+0.01.3125
–0.26 ...
+0.49 ...
+0.02 ...
+0.03 ...
–0.92 ...
–3.80 ...
+0.04 ...
+1.97 ...
+0.37 ...
–0.14 ...
–0.06 ...
June 3, 2024
D ATA
52-Week
High
Low
27.47
1.59
16.15
107.66
8.84
151.34
44.78
57.06
16.68
137.63
45.63
5.20
53.15
16.66
19.46
80.00
21.72
123.62
30.34
29.99
11.56
75.02
18.67
11.25
23.80
7.59
12.18
23.85
30.00
1229.00
21.04
35.96
45.79
42.36
6.13
64.14
121.37
25.34
629.38
2.30
8.17
16.57
0.75
10.76
71.80
3.04
94.79
22.51
37.78
10.00
46.70
30.35
2.06
36.93
3.35
9.34
53.37
8.58
64.53
16.06
20.30
1.65
25.57
8.75
1.52
9.22
2.79
1.77
8.43
18.08
213.08
7.36
21.99
22.05
18.36
2.01
29.62
73.38
11.22
416.87
1.27
2.09
Name
StarBulkCarriers
StarEquity
Star
Starbucks
StealthGas
SteelDynamics
StepStone
Stericycle
SterlingCheck
SterlingInfr
StevenMadden
StitchFix
StockYardsBncp
StokeTherap
StoneCo
StoneX
Stratasys
StrategicEd
Strattec
StratusProp
StrongholdDig
StructureTherap
SummitStateBk
SummitTherap
SunCountryAir
SunOpta
SunPower
SunRun
SuperHiIntl
SuperMicroComp
SuperiorGroup
SupernusPharm
SurgeryPartners
Surmodics
SutroBioph
Symbotic
Synaptics
SyndaxPharm
Synopsys
SyprisSolutions
SyrosPharm
NASDAQ ISSUES
Tick
Sym Yld P/E
SBLK 6.7
STRR ...
STHO ...
SBUX 2.8
GASS ...
STLD 1.4
STEP 2.0
SRCL ...
STER ...
STRL ...
SHOO 1.9
SFIX ...
SYBT 2.6
STOK ...
STNE ...
SNEX ...
SSYS ...
STRA 2.1
STRT ...
STRS ...
SDIG ...
GPCR ...
SSBI 5.2
SMMT ...
SNCY ...
STKL ...
SPWR ...
RUN ...
HDL ...
SMCI ...
SGC 2.7
SUPN ...
SGRY ...
SRDX ...
STRO ...
SYM ...
SYNA ...
SNDX ...
SNPS ...
SYPR ...
SYRS ...
12
1
dd
22
6
9
47
dd
dd
26
18
dd
13
dd
13
10
dd
27
28
dd
dd
dd
8
dd
9
dd
dd
dd
48
44
28
dd
cc
44
dd
dd
dd
dd
61
dd
dd
Last
27.08
.86
12.87
80.22
8.48
133.87
42.94
51.54
15.38
122.87
44.45
2.47
46.85
14.62
13.84
75.07
8.66
113.42
27.80
23.85
2.80
34.20
9.27
8.69
10.59
6.01
3.34
14.46
20.30
784.51
20.49
27.12
27.60
42.06
4.22
39.57
93.71
19.27
560.80
1.52
5.10
Div
Chg. Amt.
+0.09
–0.04
+0.01
+1.35
+1.11
+0.53
+1.23
–0.11
–0.24
–3.60
+1.61
+0.14
+0.15
+0.21
–0.45
+0.13
–0.40
–1.38
+1.80
–0.33
–0.26
–2.86
–0.35
+5.31
+0.64
+0.81
+0.42
+1.07
+0.65
–99.37
+1.19
–0.39
+2.21
+7.68
+0.09
–1.34
+3.13
–1.01
–26.60
+0.08
+0.13
.75
...
...
.57
...
.46
.15
...
...
...
.21
...
.30
...
...
...
...
.60
...
...
...
...
.12
...
...
...
...
...
...
...
.14
...
...
...
...
...
...
...
...
...
...
For personal non-commercial use only. Do not edit or alter. Reproductions not permitted.
To reprint or license content, please contact Barron's reprints department at 800-843-0008 or www.djreprints.com
T
11.26
15.25
11.49
3.20
10.94
1.88
175.28
47.20
12.24
132.76
36.27
19.00
5.00
26.11
171.59
1.61
53.69
13.03
12.19
42.50
15.40
15.70
3.89
12.25
41.93
6.36
22.75
39.24
5.00
63.57
53.50
8.09
12.03
0.49
146.53
13.03
14.50
299.29
221.40
21.09
66.18
206.00
174.05
47.11
4.50
11.71
21.99
16.94
8.29
4.39
10.99
3.40
32.20
34.99
38.51
41.35
31.08
287.89
97.65
114.07
4.23
10.97
10.62
0.65
10.22
0.14
124.92
26.03
1.63
87.43
5.94
11.14
2.85
9.70
130.34
0.43
13.82
2.56
10.53
12.57
7.95
6.43
0.50
10.72
23.43
4.33
6.93
3.33
1.87
21.74
33.85
1.66
10.47
0.13
81.08
3.26
6.85
138.80
143.35
0.75
48.41
139.48
91.06
29.92
1.84
8.13
14.09
4.51
2.19
1.52
10.07
1.50
23.93
17.64
22.31
21.43
21.63
185.00
60.23
64.83
TelaBio
TFS Finl
TLGY Acqn A
TMCthemetals
TMT Acqn
TMT Acqn Rt
T-MobileUS
TPG
TPIComposites
T.RowePrice
TTEC
TTM Tech
Taboola
TactileSystems
TakeTwoSoftware
Talphera
TandemDiabetes
TangoTherap
TargetGlbl I A
TarsusPharm
TaskUs
TatTechnologies
TayshaGene
Tech&TelecomA
TechTarget
Ericsson
Telesat
TelesisBio
Telos
10xGenomics
Tenable
TenayaTherap
TenXKeaneAcqn
TenXKeaneAcqnRt
Teradyne
TernsPharm
TerritorialBncp
Tesla
TetraTech
TevogenBio
TexasCapBcshs
TexasInstruments
TexasRoadhouse
TheBancorp
TherapeuticsMD
TheravanceBio
ThirdCoastBcshs
ThirdHarmonic
Thoughtworks
ThredUp
ThunderBridgeIV A
TilrayBrands
TimberlandBncp
TitanMachinery
Torm
TowerSemi
TowneBank
TractorSupply
TradeDesk
Tradeweb
37
BARRON’S
TELA ...
TFSL 8.6
TLGY ...
TMC ...
TMTC ...
TMTCR ...
TMUS 1.5
TPG 3.7
TPIC ...
TROW 4.2
TTEC 9.2
TTMI ...
TBLA ...
TCMD ...
TTWO ...
TLPH ...
TNDM ...
TNGX ...
TGAA ...
TARS ...
TASK ...
TATT ...
TSHA ...
TETE ...
TTGT ...
ERIC 2.7
TSAT ...
TBIO ...
TLS ...
TXG ...
TENB ...
TNYA ...
TENK ...
TENKR ...
TER .3
TERN ...
TBNK .5
TSLA ...
TTEK .6
TVGN ...
TCBI ...
TXN 2.7
TXRH 1.4
TBBK ...
TXMD ...
TBPH ...
TCBX ...
THRD ...
TWKS ...
TDUP ...
THCP ...
TLRY ...
TSBK 3.9
TITN ...
TRMD15.7
TSEM ...
TOWN 3.7
TSCO 1.5
TTD ...
TW .4
dd
48
26
dd
42
...
24
dd
dd
14
dd
dd
dd
11
dd
dd
dd
dd
cc
dd
28
24
dd
dd
dd
dd
2
dd
dd
dd
dd
dd
41
...
54
dd
32
46
42
dd
18
30
35
9
dd
dd
12
dd
dd
dd
cc
dd
8
5
5
8
14
28
cc
58
5.53
13.18
11.39
1.47
10.94
.34
174.96
41.92
5.48
117.83
6.28
18.60
4.01
12.73
160.36
1.03
51.23
6.92
11.36
32.96
14.31
15.11
3.43
11.94
30.22
6.14
11.31
4.08
4.53
22.42
42.19
4.21
11.37
.28
140.94
6.01
8.03
178.08
209.49
.81
60.28
195.01
172.67
33.59
2.22
8.62
21.09
13.31
2.76
2.01
10.63
1.80
24.75
18.82
37.05
37.54
27.19
285.29
92.78
109.01
–0.32 ...
+0.24.2825
–0.10 ...
–0.08 ...
+0.07 ...
... ...
+8.96 .65
–2.31 .41
+0.74 ...
–0.37 1.24
–0.03 .06
–0.20 ...
–0.09 ...
–0.13 ...
+5.76 ...
... ...
–0.50 ...
+0.01 ...
+0.06 ...
–2.05 ...
–0.24 ...
–0.12 ...
+0.19 ...
+0.03 ...
+0.23 ...
+0.28.1275
+1.86 ...
+0.63 ...
+0.57 ...
–0.17 ...
–1.55 ...
–0.33 ...
+0.04 ...
+0.01 ...
–3.07 .12
+0.01 ...
–0.07 .01
–1.16 ...
–8.39 .29
–0.01 ...
+0.82 ...
–4.17 1.30
+3.92 .61
+0.74 ...
+0.08 ...
+0.28 ...
–0.29 ...
–0.68 ...
–0.16 ...
–0.08 ...
+0.06 ...
–0.05 ...
–1.18 .24
+0.16 ...
–0.72 1.50
–0.12 ...
+0.08 .25
+3.29 1.10
–1.97 ...
–3.24 .10
52-Week
High
Low
11.61
9.44
147.00
144.23
11.23
19.54
27.41
4.00
45.84
29.07
65.55
5.50
15.44
58.00
28.76
16.24
82.22
7.40
26.73
4.05
19.91
79.38
36.66
32.10
31.23
9.69
1.83
13.20
18.45
18.00
50.50
12.69
4.81
20.67
FOREIGN MARKETS
Last
Div
Chg. Amt.
10.12
3.32
81.26
36.42
4.77
5.12
3.92
0.97
29.38
22.59
39.57
1.49
12.34
31.55
14.15
3.32
53.86
2.04
7.55
1.76
1.06
12.40
18.45
23.78
18.96
1.93
0.59
1.63
7.97
10.89
14.42
1.54
0.23
10.38
TrailblazerI A
TransActTechs
Transcat
TransMedics
Travelzoo
TravereTherap
TreaceMed
TreviTherap
TriCoBancshares
TriMas
Trimble
TrinityBiotech
TrinityCapital
Trip.com
Tripadvisor
TriSalusLifeSci
TriumphFinl
trivago
TruBridge
TrueCar
TruGolf
TrumpMedia&Tech
Trupanion
TrustcoBank
Trustmark
TScanTherap
Tuniu
TurnstoneBiologics
TurtleBeach
TwinDisc
TwistBiosci
2seventybio
2U
TyraBiosciences
TBMC ...
TACT ...
TRNS ...
TMDX ...
TZOO ...
TVTX ...
TMCI ...
TRVI ...
TCBK 3.5
TRS .6
TRMB ...
TRIB ...
TRIN13.3
TCOM ...
TRIP ...
TLSI ...
TFIN ...
TRVG .0
TBRG ...
TRUE ...
TRUG ...
DJT ...
TRUP ...
TRST 5.2
TRMK 3.2
TCRX ...
TOUR ...
TSBX ...
HEAR ...
TWIN 1.1
TWST ...
TSVT ...
TWOU ...
TYRA ...
49
63
80
dd
9
dd
dd
dd
12
27
58
dd
9
23
cc
dd
56
dd
dd
dd
dd
dd
dd
10
11
dd
dd
dd
dd
16
dd
dd
dd
dd
10.80
3.55
127.40
136.40
7.90
7.42
5.88
2.57
38.08
26.62
55.68
1.65
14.91
51.51
18.35
7.16
74.30
2.34
9.41
2.95
1.11
49.09
29.87
27.80
29.15
8.55
1.07
2.61
16.58
14.17
41.90
4.23
.28
16.22
+0.01 ...
+0.12 ...
–7.11 ...
–3.89 ...
+0.01 ...
+1.26 ...
+0.72 ...
+0.07 ...
+0.37 .33
–0.48 .04
–1.12 ...
–0.04 ...
+0.13 .51
–1.24 ...
+0.46 ...
–0.40 ...
–0.19 ...
–0.01.5628
–0.63 ...
+0.11 ...
–0.03 ...
+3.28 ...
+0.92 ...
–0.36 .36
–0.39 .23
+0.14 ...
–0.02 ...
+0.01 ...
+0.23 ...
–0.07 .04
–0.33 ...
–0.28 ...
–0.01 ...
–1.10 ...
80.18
56.31
2.74
9.32
182.98
1.17
8.61
368.02
22.15
31.52
4.26
20.07
4.25
33.68
25.35
21.63
18.41
5.79
6.21
208.62
3.00
22.49
1.42
133.67
7.02
20.85
11.13
16.10
25.01
1.90
19.84
8.32
30.05
8.69
1.30
65.91
2.40
1.50
UFP Inds
UMB Fin
UPFintech
USCB Financial
US Lime&Min
uCloudlink
Udemy
UltaBeauty
UltraClean
UltragenyxPharm
Ultralife
UnionBankshares
uniQure
UnitedAirlines
UnitedBkshrsWV
UtdCmtyBks
UnitedFire
UnitedGuardian
UnitedSecBcshrs
UnitedTherap
Uniti
UnityBancorp
UnityBiotech
UnivDisplay
UnvlElectronics
UnivLogistics
UnvlStainless
UnivestFin
Upbound
UplandSoftware
Upstart
Upwork
UrbanOutfitters
UroGenPharma
Usio
UtahMedProducts
UTStarcom
Uxin
UFPI 1.1
UMBF 1.9
TIGR ...
USCB 1.7
USLM .3
UCL ...
UDMY ...
ULTA ...
UCTT ...
RARE ...
ULBI ...
UNB 6.5
QURE ...
UAL ...
UBSI 4.6
UCBI 3.6
UFCS 2.9
UG 5.4
UBFO 6.6
UTHR ...
UNIT19.0
UNTY 1.9
UBX ...
OLED .9
UEIC ...
ULH 1.0
USAP ...
UVSP 3.9
UPBD 4.5
UPLD ...
UPST ...
UPWK ...
URBN ...
URGN ...
USIO ...
UTMD 1.8
UTSI ...
UXIN ...
15
11
21
15
25
59
dd
15
dd
dd
18
9
dd
7
12
17
dd
16
7
13
57
7
dd
38
dd
10
33
9
dd
dd
dd
31
13
dd
dd
15
dd
dd
119.48
82.44
4.25
12.08
342.74
1.87
8.84
395.09
46.38
40.14
11.64
22.31
4.95
52.99
32.44
25.66
22.25
9.32
7.26
275.13
3.16
27.98
1.55
175.70
11.42
43.75
32.83
21.80
32.82
2.75
24.72
10.57
41.71
13.30
1.58
68.29
2.56
2.45
–0.66 .33
–0.36 .39
+0.13 ...
+0.08 .05
–7.45 .05
+0.26 ...
–0.45 ...
+13.31 ...
+1.28 ...
–0.20 ...
+0.34 ...
–1.44 .36
+0.19 ...
+1.26 ...
–0.27 .37
+0.09 .23
–0.33 .16
+0.45 .25
–0.04 .12
+2.25 ...
–0.08 .15
+0.10 .13
+0.07 ...
–0.89 .40
–0.90 ...
–1.96 .105
+0.65 ...
–0.61 .21
+1.89 .37
–0.19 ...
+1.37 ...
–0.57 ...
–0.04 ...
+0.06 ...
–0.01 ...
+1.28 .30
–0.32 ...
–0.01 ...
Name
Tick
Sym Yld P/E
U
128.65
87.36
5.80
12.97
378.78
3.76
16.01
574.76
49.25
54.98
13.39
32.00
20.84
58.23
38.74
30.75
25.55
9.49
8.74
279.98
6.71
30.70
3.82
194.84
14.20
50.52
34.75
23.10
36.17
5.28
72.58
16.36
47.29
24.13
2.28
100.59
4.15
18.90
V
3.88
13.23
86.26
16.80
11.22
17.05
11.85
6.76
23.90
52.88
14.00
4.55
82.04
42.00
40.58
8.35
50.78
30.52
53.05
40.28
227.34
254.14
24.46
7.76
23.07
11.41
12.19
1.39
3.60
47.65
3.82
6.75
6.58
10.62
3.30
14.55
24.66
1.63
3.11
44.20
23.63
1.87
4.86
7.73
18.61
30.18
18.41
167.05
215.32
15.93
1.48
11.39
2.86
6.95
VNET
VOXX Intl
VSE
Vacasa
ValleyNatlBncp
Valneva
ValuenceI A
VandaPharm
VarexImaging
VaronisSystems
VastRenewables
VastaPlatform
Vaxcyte
VeecoInstr
VentyxBiosciences
VeraBradley
VeraTherap
Veracyte
Vericel
VerintSystems
VeriSign
VeriskAnalytics
Veritex
Veritone
VeronaPharma
VerricaPharm
VersaBank
VNET
VOXX
VSEC
VCSA
VLY
VALN
VMCA
VNDA
VREX
VRNS
VSTE
VSTA
PCVX
VECO
VTYX
VRA
VERA
VCYT
VCEL
VRNT
VRSN
VRSK
VBTX
VERI
VRNA
VRCA
VBNK
...
...
.5
...
6.2
...
...
...
...
...
...
...
...
...
...
...
...
...
...
...
...
.6
3.9
...
...
...
.8
dd
dd
50
dd
8
dd
48
dd
19
dd
cc
dd
dd
dd
dd
33
dd
dd
dd
cc
21
47
12
dd
dd
dd
8
1.94
3.69
81.86
4.60
7.13
9.07
11.48
5.11
15.45
42.96
2.63
3.50
70.27
40.65
4.78
8.16
37.99
20.75
47.70
29.66
174.32
252.78
20.40
2.95
12.07
8.51
9.71
+0.15 ...
–0.15 ...
+3.61 .10
+0.01 ...
–0.23 .11
+0.55 ...
–0.01 ...
–0.12 ...
+0.66 ...
–2.11 ...
–0.14 ...
–0.07 ...
+1.51 ...
–0.88 ...
+0.41 ...
+0.32 ...
+0.88 ...
–0.05 ...
–0.53 ...
–0.97 ...
+3.15 ...
+1.20 .39
–0.20 .20
–0.12 ...
+0.03 ...
–0.05 ...
+0.07.0187
52-Week
High
Low
35.38
457.66
21.42
12.35
11.63
47.35
13.62
11.65
98.38
54.94
11.11
99.41
31.00
5.77
11.85
93.00
1.09
27.48
1.77
13.08
24.25
11.85
159.87
33.29
42.68
18.05
8.80
10.19
5.70
14.07
225.60
17.59
322.25
4.90
5.22
4.20
13.80
8.74
7.10
30.90
28.66
2.50
8.28
20.62
3.02
7.96
2.26
0.50
7.61
0.43
3.70
16.02
10.62
105.19
19.41
10.00
8.50
4.71
8.02
1.25
6.06
8.11
Tick
Sym Yld P/E
Name
Vertex
VertexPharm
VerveTherap
ViaRenewables
ViantTech
ViaSat
Viatris
ViaviSolutions
Vicor
VictoryCapital
VigilNeurosci
VikingTherap
VillageSuper A
Vimeo
VinciPartners
VinFastAuto
ViomiTech
VirBiotech
ViractaTherap
VircoMfg
VirtuFinancial
VisionSensingA
Visteon
VitaCoco
VitalFarms
Vitru
VividSeats
Vodafone
VorBiopharma
VoyagerTherap
Vroom
VERX ...
VRTX ...
VERV ...
VIA ...
DSP ...
VSAT ...
VTRS 4.5
VIAV ...
VICR ...
VCTR 2.6
VIGL ...
VKTX ...
VLGEA 3.3
VMEO ...
VINP 7.0
VFS ...
VIOT ...
VIR
...
VIRX ...
VIRC .7
VIRT 4.4
VSAC ...
VC
...
COCO ...
VITL ...
VTRU ...
SEAT ...
VOD 9.8
VOR ...
VYGR ...
VRM ...
cc
30
dd
3
dd
dd
dd
dd
57
16
dd
dd
8
23
17
dd
dd
dd
dd
9
15
dd
6
32
48
32
50
21
dd
dd
dd
Last
Div
Chg. Amt.
33.05
455.34
5.19
10.65
9.51
16.89
10.60
7.52
34.99
52.03
3.18
62.26
30.40
3.88
10.54
4.89
.79
10.27
.70
11.90
22.00
11.60
111.37
29.11
41.38
9.20
5.05
9.62
1.35
8.40
10.56
–0.65 ...
–1.61 ...
–0.09 ...
+0.12 ...
–0.11 ...
+0.86 ...
+0.19 .12
+0.13 ...
+0.27 ...
–2.12 .37
–0.45 ...
–0.49 ...
–0.39 .25
+0.08 ...
–0.59 .17
–0.01 ...
+0.03 ...
–0.28 ...
–0.04 ...
–0.17 .02
–1.02 .24
+0.05 ...
+1.53 ...
+2.87 ...
+0.85 ...
+0.01 ...
–0.20 ...
+0.29.4861
–0.21 ...
+0.17 ...
... ...
WXYZ
7.67 3.45 WaveLifeSci
WVE ... dd 6.18 –0.04 ...
278.78 182.53 WD-40
WDFC 1.6 45 224.69 –6.29 .88
47.97 33.12 WSFS Financial WSFS 1.4 10 44.06 +0.09 .15
52-Week
High
Low
13.31
34.07
2.65
32.89
11.00
14.76
38.05
33.96
15.56
129.70
16.02
11.68
22.91
8.19
47.27
32.20
22.39
57.96
77.66
9.25
12.00
11.91
33.70
34.81
67.50
278.86
1.87
400.99
451.30
105.29
5.75
174.09
187.16
311.28
160.07
112.25
Tick
Sym Yld P/E
Name
1.42
23.36
1.45
14.62
7.60
7.34
23.97
21.69
9.62
58.04
7.58
10.50
16.82
1.57
33.12
23.00
15.25
38.10
35.62
5.63
4.90
6.88
24.47
16.00
38.29
195.29
0.56
150.08
314.09
65.19
1.35
73.39
107.89
201.42
94.57
81.65
WW Intl
WaFd
Wag!
WalgreensBoots
WalkMe
WarnerBrosA
WarnerMusic
WashTrBcp
WaterstoneFinl
WeatherfordIntl
Weibo
WelsbachTech
Wendy's
WerewolfTherap
WernerEnterprises
WesBanco
WestBancorp
WestamericaBncp
WesternDigital
WestNewEngBncp
WestportFuelSys
WestrockCoffee
WeycoGroup
Willdan
WillisLease
WillisTowers
WiMiHologram
Wingstop
Winmark
WintrustFinl
WISeKey
Wix.com
Woodward
Workday
WorldAcceptance
WynnResorts
WW ...
WAFD 3.7
PET ...
WBA 6.2
WKME ...
WBD ...
WMG 2.3
WASH 8.5
WSBF 5.0
WFRD ...
WB .0
WTMA ...
WEN 5.7
HOWL ...
WERN 1.5
WSBC 5.2
WTBA 5.8
WABC 3.6
WDC ...
WNEB 4.2
WPRT ...
WEST ...
WEYS 3.4
WLDN ...
WLFC .0
WTW 1.4
WIMI ...
WING .2
WINA 1.0
WTFC 1.8
WKEY ...
WIX ...
WWD .5
WDAY ...
WRLD ...
WYNN 1.1
dd
11
dd
dd
dd
dd
29
10
23
19
7
cc
18
dd
29
12
13
8
dd
11
dd
dd
10
35
8
26
dd
cc
32
10
dd
cc
33
38
10
13
Last
Div
Chg. Amt.
1.66
28.01
1.57
16.22
9.10
8.24
29.78
26.25
12.10
120.34
8.85
11.09
17.45
5.17
37.57
27.60
17.32
48.82
75.29
6.71
5.39
10.38
30.57
32.48
65.13
255.29
.88
368.65
355.90
98.61
2.17
161.10
186.50
211.45
128.49
94.88
+0.14 ...
+0.52 .26
–0.03 ...
+0.19 .25
–0.12 ...
+0.52 ...
–0.68 .17
+0.02 .56
–0.25 .15
+5.19 ...
+0.08 .80
–0.01 ...
–0.32 .25
+0.29 ...
+0.40 .14
–0.12 .36
–0.28 .25
+0.59 .44
+0.48 ...
–0.09 .07
–0.39 ...
–0.32 ...
+0.62 .26
+0.64 ...
–0.33 1.00
+2.09 .88
+0.02 ...
–15.24 .22
+3.90 .90
+0.91 .45
+0.27 ...
–8.90 ...
+1.94 .25
–9.46 ...
+2.84 ...
+0.26 .25
52-Week
High
Low
47.40
10.39
27.00
27.71
9.96
65.62
23.60
27.70
50.99
3.26
19.78
3.25
38.74
28.58
2.09
20.90
45.61
15.49
37.92
18.50
64.60
328.70
30.53
7.28
75.58
59.23
61.13
20.91
46.15
75.91
14.75
30.16
259.61
21.49
13.14
13.77
Tick
Sym Yld P/E
Name
1.14
0.83
13.48
17.95
3.51
46.79
0.37
16.49
27.99
1.46
12.06
0.49
13.57
24.96
1.34
4.60
33.32
10.35
13.48
0.80
0.86
194.59
9.56
3.89
49.50
33.23
33.80
6.52
26.36
58.87
0.15
11.67
131.59
12.90
6.02
6.88
XBPEurope
XIAO-I
XOMA
XP
XBiotech
XcelEnergy
XChangeTEC.INC
Xencor
XenonPharm
XerisBiopharma
Xerox
XilioTherap
Xometry
XtrkRreefGlbNat
Xunlei
Y-mAbsTherap
YorkWater
YottaAcqn
ZaiLab
ZapataComputing
ZappEV
ZebraTech
ZentalisPharm
ZevraTherap
ZiffDavis
Zillow A
Zillow C
ZimVie
ZionsBancorp
ZoomVideo
Zoomcar
ZoomInfoTech
Zscaler
Zumiez
Zymeworks
Zynex
XBP ...
AIXI ...
XOMA ...
XP 13.8
XBIT ...
XEL 3.9
XHG ...
XNCR ...
XENE ...
XERS ...
XRX 7.1
XLO ...
XMTR ...
NRES .9
XNET ...
YMAB ...
YORW 2.3
YOTA ...
ZLAB ...
ZPTA ...
ZAPP ...
ZBRA ...
ZNTL ...
ZVRA ...
ZD
...
ZG
...
Z
...
ZIMV ...
ZION 3.8
ZM
...
ZCAR ...
ZI
...
ZS
...
ZUMZ ...
ZYME ...
ZYXI ...
dd
dd
dd
12
dd
17
...
dd
dd
dd
dd
dd
dd
...
7
dd
22
50
dd
dd
...
62
dd
dd
50
dd
dd
dd
11
23
0
63
dd
dd
dd
45
Last
Div
Chg. Amt.
1.63
.97
25.79
18.99
7.25
55.45
.90
23.76
38.07
2.26
14.06
1.08
15.34
28.18
1.81
12.10
37.04
10.99
17.78
.85
.99
312.34
11.88
4.65
57.61
40.15
40.95
16.65
43.19
61.34
.15
12.28
169.96
18.78
8.48
10.15
–0.18 ...
–0.05 ...
+0.88 ...
+0.31 .73
–1.06 ...
+1.73.5475
+0.15 ...
+0.16 ...
–0.30 ...
+0.33 ...
+0.20 .25
+0.03 ...
–0.51 ...
+0.18.0617
+0.06 ...
–0.12 ...
+0.72.2108
+0.24 ...
–0.14 ...
+0.02 ...
+0.01 ...
–14.66 ...
+0.61 ...
–0.01 ...
+2.04 ...
+1.01 ...
+1.28 ...
–0.14 ...
+0.10 .41
–1.67 ...
–0.03 ...
–0.67 ...
–1.68 ...
+0.38 ...
–0.24 ...
–0.37 ...
Europe
Asia
Cut?: Eurozone inflation rose to 2.6% in May, from April’s 2.4%.
Still, a rate cut’s expected when central bankers meet June 6.
Downtime: Factory output in China shrank in May. Domestic and Export demand is not strong.
S&P Europe BMI
-0.69%
Spain
Norway
-0.09
-0.51
-0.76
-0.89
-0.96
-1.02
-1.22
-1.35
-1.36
-1.83
-1.94
S&P Pan Asia BMI
Singapore
Japan
Malaysia
Thailand
Taiwan
New Zealand
Australia
China
South Korea
India
Hong Kong
Philippines
Indonesia
-1.24%
0.87
-0.35
0.15
-0.63
Italy
Switzerland
Denmark
U.K.
Netherlands
Finland
Germany
France
Sweden
Belgium
Greece
-0.82
-0.86
-1.04
-1.25
-1.32
-1.41
-1.65
-2.19
-2.34
-3.62
-4.08
Indexes based on S&P Global Broad Market Indices
Source: S&P DJ Indices
Key Foreign Stock Market Indexes
Most Recent
Close
Week’s
%Chg.
Year-to-Date
Chg.
% Chg.
Year-to-Date
Chg.
% Chg.
Most Recent
Close
Week’s
%Chg.
36703
+0.03
+4224.68
+13.01
Oslo Composite
1668.78
+1.03
+149.46
+9.84
–4.96
Paris CAC
7992.87
–1.26
+449.69
+5.96
+1721.05
+2.38
Santiago Selective
3595.89
–2.21
+128.35
+3.70
–1.31
+210.32
+5.67
Sao Paulo Bovespa
122098
–1.78
–12087
–9.01
1651417
+8.59
+721713
+77.63
Seoul Composite
2636.52
–1.90
–18.76
–0.71
Copenhagen OMX 20
2769.27
+0.07
+485.74
+21.27
Shanghai Composite
3086.81
–0.07
+111.88
+3.76
Dublin ISEQ
9964.27
–1.07
+1203.91
+13.74
Shenzhen B Share Idx
1137.24
+1.00
+56.24
+5.20
516.33
–1.04
+42.19
+8.90
Singapore FTSE STI
3336.59
+0.60
+96.32
+2.97
4983.67
–1.03
+462.02
+10.22
Stockholm OMXS
990.84
–0.85
+87.96
+9.74
4488.56
–0.18
+395.19
+9.65
518.17
–0.46
+39.18
+8.18
7701.70
–0.34
+110.88
+1.46
+18.09
Amsterdam AEX
903.61
–1.27
+116.79
+14.84
Milan FTSE All Share
Athens General
1431.84
–3.10
+138.70
+10.73
Bangkok SET
1345.66
–1.38
–70.19
Bombay Sensex
73961
–1.92
Brussels Bel-20
3918.09
Buenos Aires Merval
EURO STOXX SXXE
EURO STOXX 50 SXSE
Frankfurt DAX
18497
–1.05
+1746.30
+10.42
STOXX Europe 50 SXSP
Helsinki OMHX
10244
–0.73
+146.81
+1.45
STOXX Europe 600 SXXP
Hong Kong Hang Seng
18079
–2.84
+1032.22
+6.06
Sydney S&P/ASX 200
Istanbul IMKB
Jakarta Composite
Johannesburg All Share
10400
–2.59
+2930.30
+39.23
Taipel Weighted
21174
–1.81
+3243.41
6970.74
–3.48
–302.06
–4.15
Tel Aviv 125 Index
1993.43
+1.46
+106.35
+5.64
76704
–3.09
–188.89
–0.25
Tokyo Nikkei-225
38487
–0.41
+5023.73
+15.01
+6.25
Kuala Lumpur Composite
1596.68
–1.40
+142.02
+9.76
Toronto S&P/TSX
LISBON PSI
4738.06
+0.26
+5.78
+0.12
Vienna ATX
London FTSE - 100
8275.38
–0.51
+542.14
+7.01
Madrid IBEX 35
Manila Composite
Mexico City IPC
11322
+0.68
+1219.90
+12.08
6433.10
–2.82
–16.94
–0.26
55179
–0.42
–2207.01
–3.85
22269
–0.23
+1310.68
3688.37
–1.57
+253.40
+7.38
Wellington S&P/NZX 50
11867
+0.71
+96.80
+0.82
Zurich Swiss
12000
+0.58
+863.07
+7.75
Indexes are based on local currencies. Because of various holidays and other market closings, the most
recent close is not necessarily that of the week of publication.
38
BARRON’S
TOP 500 EXCHANGE-TRADED PORTFOLIOS
D ATA
NOTICE TO READERS: Listed are
the top 500 ETF’s based on weekly
volume.
Name
Tick
Sym
Yld
Last
Div
Chg. Amt.
For personal non-commercial use only. Do not edit or alter. Reproductions not permitted.
To reprint or license content, please contact Barron's reprints department at 800-843-0008 or www.djreprints.com
Bats
ARKGenomicRev
ARK21ShrsBitcoin
AlphaArch1-3M
BlkRkShDurBd
BlkRkUltShBd
DimenIntlCore2
DimenIntlHiProf
FTVestLadBuffer
FTVestRising
FTS&P500Div
FidBlueChipGr
FidelityHedgedEq
FidWiseBTC
FdnsDynGrowth
FdnsDynValue
GlbXUSInfrDevt
GS PhysGold
InnovS&P500PwrJun
InvscMSCIUSA
InvscRuss1000Dyn
iPathS&P500VIX
iShBrdUSDHYCpBd
iShCoreMSCIEAFE
iShCurrMSCIEAFE
iShIntlSelDiv
iShTransportAvg
iShUSHomeConstrn
iShEdgeMSCIMinEAFE
iShEdgeMSCIMinUSA
iShEdgeMSCIUSAMom
iShEdgeMSCIUSAQual
iShExpTechSftwr
iShFRBd
iShIntlAggBd
iShMSCIChileCap
iShMSCIEAFEGrw
iShMSCIEurozone
iShMSCIGlbMtls
iShMSCIIndia
iShMSCIIndiaSC
iShMSCIEAFEValue
iSh20+YTrBdBuy
iShUSTreasuryBd
JPMBetaJapan
JPMCorePlusBd
NeosS&P500Hi
-1xShVIXFutures
PacerUSCashCows
PacerUSSCCash100
ProShS&P500Arist
ProShShtVIXST
ProShUltVIXST
ProShVIXSTFut
T-Rex2XInvrNVIDIA
T-Rex2XLgNVIDIA
2xBitcoinStrategy
2xLongVIXFut
VanEckHYMuni
VanEckMstrWd
VanEckVietnam
VangdUltShrtBd
WT AI&InnovFd
ARKG
ARKB
BOXX
NEAR
ICSH
DFIC
DIHP
BUFR
RDVI
KNG
FBCG
FHEQ
FBTC
FDGR
FDVL
PAVE
AAAU
PJUN
PBUS
OMFL
VXX
USHY
IEFA
HEFA
IDV
IYT
ITB
EFAV
USMV
MTUM
QUAL
IGV
FLOT
IAGG
ECH
EFG
EZU
PICK
INDA
SMIN
EFV
TLTW
GOVT
BBJP
JCPB
SPYI
SVIX
COWZ
CALF
NOBL
SVXY
UVXY
VIXY
NVDQ
NVDX
BITX
UVIX
HYD
MOAT
VNM
VUSB
WTAI
...
...
...
5.0
5.1
2.3
2.0
...
8.3
9.5
.0
...
...
...
...
.6
...
...
1.2
1.4
...
6.7
3.0
2.7
6.3
1.3
.5
3.0
1.8
.8
1.1
.0
5.8
3.6
4.8
1.5
2.3
4.1
.2
.1
4.0
17.4
2.9
2.8
4.7
11.9
...
1.8
1.1
2.1
...
...
...
...
...
3.4
...
4.3
.8
5.3
4.9
.0
24.50
67.55
107.38
50.24
50.55
27.34
27.01
28.45
23.72
51.56
40.01
25.07
59.11
12.02
11.73
38.70
23.04
34.92
52.72
54.14
11.53
36.33
75.45
35.73
29.52
64.18
106.17
71.65
82.80
186.60
165.74
78.09
51.15
49.60
28.23
103.80
52.02
44.13
53.01
75.34
56.27
25.38
22.41
56.75
46.03
49.58
45.52
56.19
46.63
98.05
59.54
25.80
11.44
2.69
137.82
43.01
6.37
51.34
86.63
12.61
49.54
19.63
–1.13
–1.69
+0.05
+0.04
+0.04
+0.14
+0.05
–0.03
+0.10
+0.11
–0.30
–0.11
–1.46
–0.17
+0.04
–0.41
–0.07
...
–0.31
+0.51
+0.28
+0.05
+0.16
+0.01
+0.06
+0.28
+1.36
+0.36
–0.22
–3.99
–0.78
–4.81
+0.05
–0.06
–0.93
–0.58
–0.17
–0.30
–1.06
–1.15
+0.54
–0.21
–0.02
+0.44
...
+0.03
–1.43
+1.14
+0.29
+0.06
–0.80
+0.82
+0.30
–0.23
+7.40
–2.55
+0.30
–0.05
–1.51
+0.01
+0.09
–0.79
...
...
...
.1999
.2206
.0362
.0516
...
.174
.3829
.008
...
...
...
...
.156
...
...
.1687
.2461
...
.2103
.9678
.3963
.236
.1864
.1435
.8214
.3603
.1623
.375
.0051
.2486
1.7697
.1761
.6555
.3513
1.0214
.0801
.2437
.9574
.2466
.0596
1.6015
.2081
.4997
...
.2443
.0823
.3863
...
...
...
...
...
.9677
...
.2133
.7285
.6552
.2189
.0213
NASDAQ
DefNasdaq100Enh
DirexAAPLBull2X
DirexAmznBl2X
DirexNVDABear1X
DirexNVDABull2X
DirexTSLABr1x
DirexTSLABl2x
FT CapStrength
FT EnhShtMat
FT GlTactCommod
FT LowDurOpp
FT NasdCybersec
FT RisingDivAch
FT SMID CapRising
FT SrLoanFd
FT TCW Opp
GlbXAI&Tech
GlbXNasd100Cv
GlbX Robotics&AI
GrShr2xLongAMDDly
GrShr2xLongCOINDly
GrShr2xLgMeta
GrShr2xLgNVDA
GrShr2xLgTSLA
GrShr2xShNVDA
InvscActMgdETC
InvscBS25CpBd
InvscBS24CpBd
InvscBS26CpBd
InvscKBWBank
InvscNasd100
InvscQQQI
iShBiotech
iShBitcoin
June 3, 2024
QQQY 68.8
AAPU 2.3
AMZU 2.2
NVDD 4.2
NVDU .5
TSLS 3.5
TSLL 5.2
FTCS 1.3
FTSM 4.9
FTGC 3.1
LMBS 4.5
CIBR .5
RDVY 2.0
SDVY 1.7
FTSL 7.7
FIXD 4.4
AIQ .1
QYLD 11.8
BOTZ .2
AMDL ...
CONL .2
FBL 34.1
NVDL 17.0
TSLR ...
NVD ...
PDBC 4.0
BSCP 3.7
BSCO 3.1
BSCQ 3.7
KBWB 3.1
QQQM .6
QQQ .5
IBB .3
IBIT ...
15.15
27.77
31.68
9.12
90.48
23.66
7.65
83.59
59.60
24.09
47.97
53.34
55.25
34.37
46.03
42.81
33.36
17.51
30.78
17.73
48.80
23.15
56.73
11.51
2.95
14.05
20.45
21.04
19.17
54.02
185.87
450.71
133.88
38.55
–0.10
+0.65
–1.61
–0.31
+4.63
+0.18
–0.12
–0.14
–0.18
–0.33
+0.06
–2.37
+0.17
+0.11
+0.04
–0.01
–1.04
–0.07
–0.75
+0.07
–5.38
–1.21
+2.92
–0.17
–0.22
–0.16
+0.04
+0.02
+0.05
+0.12
–2.61
–7.24
–1.79
–0.91
.8587
.0842
.2117
.0311
.2606
.2399
.0788
.2247
.25
.164
.175
.0237
.2238
.1032
.2925
.155
.0193
.1628
.0041
...
.1086
8.0045
1.6852
...
...
.5601
.068
.0658
.0658
.4265
.3454
.5735
.126
...
Name
iShBrdUSDInvCpBd
iShCoreMSCITotInt
iShCore1-5YUSDBd
iShCoreS&PUSGrw
iShCoreS&PUSVal
iShCoreTotUSDBd
iShESGAwareEM
iShESGAwareUSA
iShFallAngelUSDBd
iSh5-10YIGCpBd
iShGlbCleanEner
iShiBdsDec25Trea
iShiBdsDec24Trea
iShiBdsDec27Trea
iShJPMUSDEmBd
iShMBS
iShMSCIACWI
iShMSCIACWIxUS
iShMSCIACxJpn
iShMSCIBrazilSC
iShMSCIChina
iShMSCIEAFESC
iShMSCIEMxChina
iShMSCIEurFinls
iSh1-5YIGCpBd
iSh1-3YTreaBd
iShPfd&Incm
iShSelectDiv
iShSemiconductor
iSh7-10YTreaBd
iShShortTreaBd
iSh3-7YTreaBd
iSh20+YTreaBd
JPMNasdEqPrem
ProShUltPrQQQ
ProShUltShQQQ
T-Rex2XInvrTesla
T-Rex2XLgTesla
Tradr1.25XNVDABr
TradrShInnovDly
TradrTSLABearDly
USTrea3mBill
VanEckGlFallAngHY
VanEckSemicon
VangdIntrCorpBd
VangdIntermTrea
VangdLTCorpBd
VangdLongTrea
VangdMBS
VangdRuss1000Grw
VangdRuss2000
VangdSTCpBd
VangdShtTmInfltn
VangdShortTrea
VangdTotalBd
VangdTotIntlBd
VangdTotIntlStk
WT CloudComp
WT USQltyDiv
Tick
Sym
Yld
USIG 4.2
IXUS 2.1
ISTB 3.3
IUSG .9
IUSV 1.8
IUSB 3.7
ESGE 2.3
ESGU 1.2
FALN 5.8
IGIB 4.1
ICLN 1.1
IBTF 4.2
IBTE 4.4
IBTH 3.8
EMB 4.8
MBB 3.7
ACWI 1.7
ACWX 2.2
AAXJ 1.4
EWZS 3.8
MCHI 1.8
SCZ 1.5
EMXC 2.1
EUFN 4.3
IGSB 3.5
SHY 3.4
PFF 6.3
DVY 3.6
SOXX .6
IEF 3.2
SHV 5.1
IEI 2.7
TLT 3.7
JEPQ 8.8
TQQQ 1.1
SQQQ 10.3
TSLZ ...
TSLT ...
NVDS 9.0
SARK 10.3
TSLQ 10.5
TBIL 5.2
ANGL 5.7
SMH ...
VCIT 4.1
VGIT 3.1
VCLT 5.0
VGLT 3.8
VMBS 3.7
VONG .7
VTWO 1.4
VCSH 3.4
VTIP 2.8
VGSH 3.8
BND 3.4
BNDX 4.7
VXUS 3.2
WCLD ...
DGRW 1.6
Last
50.16
68.92
47.28
119.86
89.21
45.01
32.74
115.52
26.43
51.09
14.97
23.19
23.97
22.00
89.05
91.01
111.08
54.15
70.15
12.90
43.82
64.53
56.90
24.20
51.14
81.47
31.75
124.47
234.01
92.80
110.51
114.69
90.45
54.19
62.53
10.02
30.99
10.46
47.51
31.54
35.69
50.05
28.54
240.48
79.65
57.83
75.94
56.94
44.97
88.06
83.16
77.13
48.28
57.87
71.64
48.46
61.27
30.44
75.91
Div
Chg. Amt.
+0.03
–0.46
+0.09
–1.33
+0.42
+0.01
–1.00
–0.81
–0.04
+0.04
+0.05
...
...
+0.05
+0.11
–0.05
–0.62
–0.40
–2.01
–0.45
–1.15
+0.47
–1.67
+0.19
+0.08
+0.10
+0.25
+1.29
–4.55
–0.08
+0.08
+0.18
–0.93
–0.19
–2.82
+0.42
+0.40
–0.16
–2.24
+1.40
+0.29
+0.03
–0.07
–3.78
+0.08
+0.05
–0.20
–0.44
–0.03
–1.00
+0.09
+0.15
+0.13
+0.09
–0.03
–0.13
–0.37
–1.65
–0.12
.1855
1.0484
.1462
.1667
.4397
.1498
.6208
.3842
.133
.1837
.1228
.0828
.0924
.0734
.3606
.2823
.9624
.7141
1.1081
.2451
.9941
.8304
.6371
.3201
.165
.2616
.1596
.9976
.2249
.2709
.4637
.2955
.3077
.4311
.2151
.164
...
...
21.3586
3.2644
3.7319
.2183
.1511
...
.2919
.1739
.323
.1932
.1479
.1547
.1742
.2492
.0267
.1969
.2138
.0892
.2235
...
.17
.1 23.70 –0.33
.013
NYSE
HarborLtGrowers
WINN
NYSE ARCA
ARK Innovation
abrdnPhysGold
abrdnPhysSilver
AdvShMSOS2xDly
AdvShPureUSCan
AlerianMLPETF
AmplifyAltHarvest
AmplifyJrSilver
AngelOakMtg
ArkFinInnov
AvantisEM
AvantisIntlSCVal
AvantisUSSCValue
BNYM CoreBd
BitwiseBitcoin
BlkRkFlexIncm
BlkRkUSEqRotat
CapGrpCore
CapGrpCorePlus
CapGrpDivVal
CapGrpGlbGrw
CapitalGrpGrw
CapGrpIntlFocus
CapGrpUSMult
ColumbiaResEnh
CommSvsSPDR
CnsmrDiscSel
ConsStaplesSPDR
DefR2000EnhOpt
DimenCoreFxIncm
DimenEmgCore
DimenEMCore2
DimenGlbRlEst
DimenIntlCore
DimenIntlValue
DimenShDurFix
DimenUSCore
DimenUSCoreEq2
DimenUSEquity
DimenUSHiProf
ARKK ...
SGOL ...
SIVR ...
MSOX ...
MSOS ...
AMLP 7.7
MJ 4.6
SILJ .0
MBS 4.9
ARKF ...
AVEM 2.9
AVDV 3.0
AVUV 1.6
BKAG 3.7
BITB ...
BINC 5.0
DYNF .7
CGUS 1.1
CGCP 5.3
CGDV 1.5
CGGO .7
CGGR .4
CGXU .9
CGMS 6.1
RECS .9
XLC .8
XLY .8
XLP 2.7
IWMY 92.5
DFCF 4.7
DFAE 2.3
DFEM 2.3
DFGR 2.8
DFAI 2.3
DFIV 3.4
DFSD 4.4
DFAU 1.1
DFAC 1.1
DFUS 1.2
DUHP 1.4
42.45
22.23
29.06
3.51
8.02
45.88
3.74
12.54
8.41
26.67
60.32
68.27
93.05
41.21
36.85
52.20
45.01
31.26
22.13
32.86
29.11
31.61
26.11
26.91
31.20
83.26
175.97
77.34
15.40
41.38
25.31
26.28
24.94
30.71
37.98
46.93
36.64
31.88
57.22
31.18
–1.93
–0.07
+0.04
–0.17
–0.15
+0.42
–0.06
+0.25
...
–0.97
–1.28
+0.78
+0.99
–0.02
–0.87
+0.01
–0.47
–0.36
–0.10
–0.23
–0.39
–0.48
–0.33
–0.10
–0.20
+0.31
+0.43
+0.24
–0.02
+0.04
–0.61
–0.54
+0.41
+0.11
+0.36
+0.05
–0.16
–0.07
–0.37
–0.08
...
...
...
...
...
.94
.0558
.0009
.0202
...
1.141
.8884
.3067
.1448
...
.2376
.0437
.0753
.1035
.0995
.1126
.0612
.0963
.1376
.2765
.214
.3872
.5522
1.41
.1859
.0302
.0331
.0496
.1718
.0859
.2108
.0771
.0651
.1179
.0766
Name
DimenUSLCVal
DimenUSSCValue
DimenWorldexUS
DirexCSIChinaInt
DirexDJBear3X
DirexDJBull3X
DirexEnerBr2x
DirexEnerBull2x
DirexChinaBr3
DirexChinaBl3
DirexFinlBear3
DirexFinlBull3
DirexGoldMinBr2
DirexGoldMinBl2
DirexJrGoldMinBr2
DirexJrGoldMnBl2
DirexRealEstBl3
DirexRegBksBl3x
DirexRetailBull3
DirexS&P500Br3
DirexS&PBiotBr3
DirexS&PBiotBl3
DirexS&P500Br1
DirexS&P500Bl3
DirexS&POilBr2
DirexS&POilBl2
DirexSemiBr3x
DirexSemiBl3
DirexScBear3
DirexSCBull3
DirexKRBull3
DirexTechBear3
DirexTechBull3
Direx20+TreaBr3
Direx20+YrTrBull
EnSelSectorSPDR
FidEnhLCCore
FidMSCIEn
FidMSCIHlthCr
FidTotalBd
FinSelSectorSPDR
FT EnergyAlpDx
FT InstPfdSecs
FT MstarDiv
FT PfdSecs
FT TCWUnPlBd
FT ValLineDiv
FlexGlbUpNatRsc
FrankFTSEJapan
FrankUSCoreBd
FrankUSTreaBd
GMO US Quality
GlbXCopperMiners
GlbXLithium
GlbXMSCIArgentina
GlbXRuss2000Cvr
Tick
Sym
Yld
DFLV 1.6
DFSV 1.2
DFAX 2.8
CWEB 2.7
WEBS 8.3
WEBL .0
ERY 5.2
ERX 2.7
YANG 4.9
YINN 3.0
FAZ 5.6
FAS 1.6
DUST 5.4
NUGT 1.7
JDST 7.1
JNUG 1.7
DRN 3.0
DPST 2.8
RETL 1.3
SPXS 6.4
LABD 5.2
LABU .6
SPDN 6.7
SPXL .9
DRIP 5.4
GUSH 4.2
SOXS 14.2
SOXL .3
TZA 4.8
TNA 1.3
KORU 3.1
TECS 7.1
TECL .3
TMV 3.5
TMF 3.8
XLE 3.1
FELC 1.1
FENY 2.9
FHLC 1.3
FBND 4.6
XLF ...
FXN 1.9
FPEI 5.6
FDL 4.3
FPE 5.7
UCON 5.1
FVD 2.2
GUNR 3.4
FLJP 2.8
FLCB 3.9
FLGV 3.8
QLTY .6
COPX 1.9
LIT 1.3
ARGT 1.3
RYLD 12.5
Last
29.41
29.73
26.02
35.87
7.41
15.43
22.49
67.87
8.26
24.55
10.35
105.34
7.30
41.65
3.48
43.99
8.43
69.46
10.14
8.72
8.48
103.29
12.26
133.30
8.99
38.88
27.54
48.59
18.01
38.64
7.16
7.47
79.05
38.15
47.11
93.20
29.50
25.66
67.56
44.70
41.64
18.89
18.31
38.66
17.25
24.37
41.78
42.55
30.00
21.01
20.16
29.62
48.19
43.46
62.76
16.27
Div
Chg. Amt.
+0.13
+0.26
–0.07
–1.67
+0.82
–1.96
–0.95
+2.53
+0.81
–2.77
–0.01
–0.02
–0.03
+0.10
–0.08
+1.23
+0.41
–0.68
+0.90
+0.12
–0.09
+0.59
+0.06
–1.93
–0.47
+1.75
+1.54
–2.85
–0.05
+0.03
–0.72
+0.52
–6.02
+1.11
–1.62
+1.83
–0.12
+0.51
–0.32
–0.19
+0.03
+0.43
+0.04
+0.52
+0.02
+0.04
+0.16
+0.17
+0.24
...
–0.03
–0.49
–0.47
–0.83
+3.28
+0.01
.0938
.0549
.0285
.1378
.0797
.0001
.3703
.5116
.1403
.0489
.1796
.3636
.1518
.1985
.0898
.3498
.0412
.5557
.0293
.1042
.0664
.1606
.2117
.3038
.177
.2234
.4133
.0632
.2356
.2184
.0264
.1227
.0709
.2699
.4973
.7339
.071
.174
.238
.179
...
.0812
.0888
.332
.087
.10
.1887
.1589
.4778
.1033
.0778
.0456
.3907
.3575
.526
.1654
Tick
Sym
Name
GlbXS&P500Cv
GlbXSilverMiners
GlbX US Pfd
GlbX Uranium
GSTreasury0-1Y
GrShrGold
GrayscaleBitcoin
HealthCrSelSect
HorizonKinInfltn
IndSelSectorSPDR
InvscDBComm
InvscDBAgriFd
InvscDBUSDBull
InvscEMSovDebt
InvscFTSEUS1000
InvscNatAMTFrMuni
InvscPreferred
InvscS&P500EW
InvscS&P500EWTech
InvscS&P500HiDiv
InvscS&P500LowVol
InvscS&P500Mom
InvscS&P500Qual
InvscS&P500Top50
InvscS&PMCQual
InvscSrLoan
InvscSolar
InvscUltShDur
InvscVarRtPfd
InvscWildClnEngy
iShAAA-ACpBd
iShChinaLC
iShCoreDivGrowth
iShCoreHiDiv
iShCoreMSCIEM
iShCoreMSCIEur
iShMSCIIntlDev
iShCoreS&P500
iShCoreS&P MC
iShCoreS&P SC
iShCoreS&PTotUS
iShCoreUSAggBd
iShUSMedDevices
iShExpTechSftwr
iShGlobalEnergy
iShGlobalREIT
iShGoldTr
iShGoldTrMicro
iShiBdsDec24Cp
iShiBdsDec27Cp
iShiBdsDec26Cp
iShiBoxx$HYCpBd
iShiBoxx$IGCpBd
iShLatinAmer40
iShMSCIAustralia
iShMSCIBrazil
Yld
XYLD
SIL
PFFD
URA
GBIL
BAR
GBTC
XLV
INFL
XLI
DBC
DBA
UUP
PCY
PRF
PZA
PGX
RSP
RSPT
SPHD
SPLV
SPMO
SPHQ
XLG
XMHQ
BKLN
TAN
GSY
VRP
PBW
QLTA
FXI
DGRO
HDV
IEMG
IEUR
IDEV
IVV
IJH
IJR
ITOT
AGG
IHI
IGM
IXC
REET
IAU
IAUM
IBDP
IBDS
IBDR
HYG
LQD
ILF
EWA
EWZ
9.6
.5
6.4
5.2
5.0
...
...
1.5
1.7
1.5
4.7
3.8
6.1
6.7
1.7
3.1
7.1
1.5
.5
4.2
2.3
1.0
1.3
.8
.6
8.8
...
5.5
6.3
3.4
3.8
2.3
2.3
3.3
2.8
2.9
2.9
1.3
1.3
1.3
1.3
3.4
.5
.2
3.1
3.3
...
...
3.3
4.0
3.7
5.9
4.3
4.9
3.7
6.7
B A R R ON S .C OM / D ATA
Last
40.05
34.69
19.77
32.24
100.12
23.00
60.09
143.70
33.29
123.51
23.27
25.13
28.67
20.23
38.16
23.41
11.56
165.78
34.87
45.13
65.24
81.42
61.46
43.27
106.12
21.12
48.28
49.90
23.85
22.99
46.76
26.63
57.59
110.06
52.59
60.00
68.21
529.96
59.68
109.65
115.63
96.52
55.53
87.39
43.50
23.09
43.99
23.23
25.11
23.71
23.79
77.13
106.89
27.06
24.65
29.60
Div
Chg. Amt.
–0.08
+0.30
+0.17
+0.24
+0.07
–0.07
–1.44
–0.72
+0.30
–0.95
–0.25
+0.46
+0.01
–0.03
+0.18
–0.06
+0.08
–0.16
–0.78
+0.82
+0.29
–0.90
–0.27
–0.26
–1.18
+0.03
+0.78
+0.05
–0.05
+0.26
–0.04
–0.95
–0.03
+1.08
–1.43
+0.14
+0.16
–2.19
+0.16
+0.83
–0.54
–0.06
–0.54
–2.05
+0.89
+0.29
–0.13
–0.05
+0.01
+0.05
+0.04
+0.04
–0.09
–0.43
–0.06
–0.83
.2819
.1374
.105
1.6816
.4576
...
...
.5229
.1581
.3763
1.0893
.9604
1.7455
.1096
.1614
.0636
.0554
.6802
.0423
.1363
.1103
.1266
.2055
.0899
.2036
.1568
...
.2283
.1021
.1487
.1606
.6074
.3107
.8355
.977
.5676
.8684
1.6653
.16
.3263
.3081
.2948
.0314
.038
.6362
.1333
...
...
.0836
.0854
.0812
.3998
.415
.8603
.4883
1.221
Selected ETF Leaders
iShares Core S&P
Small Cap (IJR)
iShares Core MSCI
EAFE (IEFA)
Vanguard FTSE
Developed Markets
(VEA)
-0.04
-0.29
-2.53
0.21
0.06
Vanguard Total Bond
Market (BND)
SPDR Gold Shares
(GLD)
-0.39
SPDR S&P 500 ETF
Trust (SPY)
-0.40
Vanguard Dividend
Appreciation (VIG)
-0.55
-1.58
0.76%
Vanguard Total Stock
Market (VTI)
Invesco QQQ Trust
(QQQ)
Vanguard FTSE
Emerging Markets
(VWO)
Source: Barron’s Statistics
Name
iShMSCICda
iShMSCI EAFE
iSh MSCI EM
iShMSCIGermany
iShMSCIHongKong
iShMSCIIndonesia
iShMSCIIntlQual
iShMSCIIntlValue
iShMSCIJapan
iShMSCIMalaysia
iShMSCIMexico
iShMSCISaudiArabia
iShMSCISingapore
iShMSCISthKorea
iShMSCISpain
iShMSCITaiwan
iShMSCIUK
iShMSCIWorldETF
iShNatlMuniBd
iShRuss2000Val
iShRussMC
iShRussMCGrw
iShRuss1000
iShRuss1000Grw
iShRuss1000Val
iShRussTop200Gr
iShRuss2000
iShRuss2000Gw
iShS&PMC400Growth
iShS&P500Grw
iShS&P500Value
iShS&PGSCIComm
iShShtNatlMuniBd
iShSilver
iShTIPSBond
iSh10-20YTreaBd
iSh10+YIGCpBd
iShTreaFRBd
iShUS Energy
iShUSRealEst
iShUSTech
iSh0-5YHYCpBd
iSh0-5YTIPSBd
iSh0-3MTreaBd
JanusHendersonAAA
JanusHendMtg
JanusHenShrtDur
JPM EqPrem
JPM IntlResearch
JPM USQualFactor
JPM UltShIncm
KraneCSICnInt
KraneCnInternet
MAXS&P5004X
MatlsSelSector
MicroFANG-3XInvr
MicroFang+3x
MicroGold3XInvr
MicroGold3xLvgd
NuvGrowthOpps
PGIMUltraShBd
Pimco25+YrZC
PimcoEnhShMat
ProShBitcoin
ProShShBitcoin
ProShShtDow30
ProShShrtQQQ
ProShShRuss2000
ProShShrtS&P500
ProShUltBitcoin
ProShUltBlmCrude
ProshUltBbgNtGas
ProShUltraQQQ
ProShUltRus2000
ProShUltraS&P
ProShUltSemi
ProShUltSilver
ProShUltDow30
ProShUltRus2000
ProShUltS&P500
ProShUltShDow30
ProShShtRus2000
ProShUltSh&P500
ProShUltShBbgCrd
ProShUltShBlmGas
ProShUltDow30
ProShUltShQQQ
ProShUltShRus2000
ProShUltShS&P500
ProShUltShSilver
ProShUltraSh20+
PutnamFocLCVal
QuadIntRtVol
RoboGlbAI
RealEstSectorSPDR
SPDRBlackSrLoan
SPDRBlmCvSecs
SPDRBlmEMLocBd
SPDR Blm HY Bd
SPDRBbgIntTrBd
SPDRBlmInvGrdFR
SPDRBbg1-3MTB
SPDRBlmSTHYBd
SPDR DJIA Tr
SPDREuroStx50
Tick
Sym
Yld
EWC 2.2
EFA 2.8
EEM 2.5
EWG 2.4
EWH 4.4
EIDO 3.3
IQLT 2.1
IVLU 4.3
EWJ 1.9
EWM 3.2
EWW 2.3
KSA 2.6
EWS 6.2
EWY 2.7
EWP 2.5
EWT 3.6
EWU 3.8
URTH 1.6
MUB 2.8
IWN 1.9
IWR 1.3
IWP .5
IWB 1.2
IWF .5
IWD 1.9
IWY .6
IWM 1.3
IWO .7
IJK .9
IVW .8
IVE 1.6
GSG ...
SUB 1.9
SLV ...
TIP 2.8
TLH 4.2
IGLB 4.9
TFLO 5.3
IYE 2.5
IYR 2.8
IYW .2
SHYG 6.5
STIP 2.8
SGOV 4.1
JAAA 6.3
JMBS 4.9
VNLA 4.4
JEPI 7.3
JIRE 2.5
JQUA 1.2
JPST 5.0
KWEB 1.6
KLIP 57.9
SPYU ...
XLB 1.9
FNGD ...
FNGU ...
GDXD ...
GDXU ...
NUGO .2
PULS 5.7
ZROZ 4.2
MINT 5.2
BITO 21.6
BITI 6.0
DOG 5.0
PSQ 6.7
RWM 5.4
SH 6.0
BITU .5
UCO ...
BOIL ...
QLD .2
UWM .5
SSO .4
USD .0
AGQ ...
UDOW .8
URTY .5
UPRO .6
SDOW 5.9
SRTY 5.8
SPXU 9.6
SCO ...
KOLD ...
DXD 2.1
QID 7.7
TWM 5.1
SDS 7.2
ZSL ...
TBT 4.3
PVAL 1.2
IVOL 3.9
THNQ ...
XLRE 3.5
SRLN 8.8
CWB 2.0
EBND 5.6
JNK 6.6
BWX 1.8
FLRN 5.8
BIL 5.2
SJNK 7.4
DIA 1.7
FEZ 2.4
Last
38.26
81.18
41.79
32.06
16.72
19.76
39.96
29.17
68.97
22.97
64.90
40.11
19.56
62.18
33.66
50.32
36.32
145.71
105.74
155.88
81.91
108.67
288.86
342.29
177.16
200.15
205.77
263.62
89.38
86.60
184.12
21.95
104.16
27.76
106.70
101.49
50.12
50.70
49.15
86.67
138.63
42.20
99.57
100.75
50.93
44.30
48.49
56.83
63.71
51.55
50.48
29.20
13.96
37.72
91.53
32.63
343.04
21.17
40.40
29.64
49.75
73.25
100.67
27.28
7.54
29.43
43.56
20.76
11.94
34.96
30.91
16.21
89.12
38.40
77.67
117.36
41.29
76.99
45.45
70.17
17.27
27.22
32.21
16.97
53.62
32.89
43.82
11.05
24.91
10.75
36.09
36.12
18.43
42.37
38.05
42.09
71.67
20.19
94.35
21.67
30.88
91.82
24.99
387.53
52.93
Div
Chg. Amt.
+0.03
+0.13
–1.23
–0.22
–0.38
–0.74
–0.08
+0.22
+0.51
–0.19
–1.02
–1.15
–0.04
–1.92
+0.48
–1.37
–0.02
–0.60
–0.02
+0.71
–0.54
–2.42
–1.56
–3.74
+0.62
–1.84
+0.33
–0.77
–0.38
–0.99
+0.70
–0.27
–0.09
+0.02
+0.26
–0.58
–0.09
+0.04
+0.99
+1.58
–2.91
...
+0.25
+0.07
+0.06
+0.02
+0.08
–0.09
–0.05
–0.50
+0.04
–0.68
–0.67
–0.82
+0.17
+2.20
–26.78
–0.72
+0.04
–0.74
+0.05
–1.27
+0.11
–0.79
+0.20
+0.29
+0.64
+0.01
+0.07
–1.80
–0.02
–2.81
–2.64
+0.07
–0.76
–0.07
–0.26
–2.15
+0.02
+1.80
+0.43
–0.08
+0.48
–0.05
+7.08
+0.58
+1.30
–0.03
+0.25
–0.13
+0.74
–0.07
+0.15
–1.66
+0.70
+0.02
–0.55
–0.16
+0.07
–0.11
+0.04
+0.05
...
–3.11
–0.27
.4859
.9307
.748
.0015
.4295
.1758
.3689
.6112
.8746
.3715
1.0273
.5432
.5344
1.651
.4748
5.527
.7471
1.0894
.2614
.5669
.218
.118
.8692
.4439
.7697
.2495
.5221
.3417
.1452
.0836
.8424
...
.1663
...
.0648
.359
.2061
.2709
.2963
.3365
.231
.2367
.6122
.4276
.2743
.1921
.1999
.3452
1.5991
.1928
.214
.4193
.5901
...
.3249
...
...
...
...
.0348
.2226
.77
.425
1.6814
.0202
.3158
.5405
.2585
.1418
.0152
...
...
.0554
.0607
.1777
.0269
...
.1314
.0847
.1228
.2517
.3738
.6351
...
...
.2504
.7882
.0859
.3439
...
.3606
.111
.0557
...
.2636
.3123
.0842
.096
.5392
.0343
.1475
.3875
.1599
.5941
.0989
Name
SPDRGoldMini
SPDR Gold
SPDRNuvBBHYMuni
SPDRNuveenMuniBd
SPDRPtfAggBd
SPDRPtfDevxUS
SPDRPtfEM
SPDR PtfHYBd
SPDRPtfIntermCpBd
SPDR PtfIntTrea
SPDRPtfLTCorpBd
SPDRPtfLtTrea
SPDRPtfMtgBkdBd
SPDRS&P500Value
SPDRPtfS&P1500
SPDRPtfS&P500
SPDRS&P500Growth
SPDRS&P500HiDiv
SPDRPtfS&P400MC
SPDRPtfS&P600SC
SPDRPtfSTCpBd
SPDRShtTermTrea
SPDR S&P400 MCG
SPDRS&PBank
SPDR S&P 500
SPDR S&P Home
SPDRS&PInsurance
SPDR S&P Metals
SPDRS&PRegBkg
SchwabEM Equity
SchwabFundEmgLrg
SchwabFundIntLrg
SchwabFundUSLrg
SchwabIntmUSTrsr
SchwabIntEquity
SchwabST USTr
SchwabUS AggrBd
SchwabUS BrdMkt
SchwabUS Div
SchwabUS LC
SchwabUS LC Grw
SchwabUS LC Val
SchwabUS REIT
SchwabUS SC
Schwab US TIPs
SimplifyVolPrem
SoFiSelect500
SPDR S&PMdCpTr
SPDR S&P Biotch
SPDR S&P Div
SPDRS&POil&Gas
SPDR S&P Retail
SprottUranium
TRoweCapAppr
TechSelectSector
TeucriumWheatFd
USGlobalJets
UtilitiesSelect
VanEckBDCIncm
VanEckGoldMin
VanEck IG FR
VanEckJPMEMLCBd
VanEckJrGoldMin
VanEckMerkGoldTr
VanEckPfdxFin
VangdSC Val
VangdDivApp
VangdEnergy
VangdExtDuratn
VangdFTSEAWxUS
VangdAWxUSSC
VangdFTSEDevMk
VangdFTSE EM
VangdFTSE Europe
VangdFTSE Pac
VangdFinls
VangdGrowth
VangdHiDiv
VangdInfoTech
VangdIntermBd
VangdLongTermBd
VangdMC
VangdRealEst
VangdS&P500ETF
VangdST Bond
VangdSC
VangdTaxExemptBd
VangdTotalStk
VangdTotWrldStk
VangdValue
WT EM SC Div
WT EurHdgEqFd
WT FRTrea
WT IndiaEarn
WT IntlHdgQual
WT JapanHdg
XtrkHarvCSI300
XtrkMSCIEAFE
XtrkUSDHYCpBd
YieldCoinOpt
YieldMSTROpt
YieldNVDAOpt
YieldTSLAOpt
YieldUltOptIncm
YieldUnivFdOpt
Tick
Sym
Yld
GLDM ...
GLD ...
HYMB 4.2
TFI 2.7
SPAB 3.6
SPDW 2.6
SPEM 2.7
SPHY 7.7
SPIB 4.1
SPTI 3.4
SPLB 5.0
SPTL 3.7
SPMB 3.4
SPYV 1.8
SPTM 1.3
SPLG 1.3
SPYG .9
SPYD 4.4
SPMD 1.4
SPSM 1.6
SPSB 4.5
SPTS 4.0
MDYG 1.0
KBE 2.9
SPY 1.3
XHB .7
KIE 1.4
XME .8
KRE 3.2
SCHE 3.6
FNDE 4.4
FNDF 3.2
FNDX 1.7
SCHR 3.5
SCHF 2.8
SCHO 4.1
SCHZ 3.6
SCHB 1.3
SCHD 3.4
SCHX 1.3
SCHG .4
SCHV 2.3
SCHH 3.3
SCHA 1.3
SCHP 3.1
SVOL 16.1
SFY 1.2
MDY 1.1
XBI .0
SDY 2.5
XOP 2.2
XRT 1.2
URNM 3.1
TCAF ...
XLK .7
WEAT ...
JETS ...
XLU 3.0
BIZD 10.3
GDX 1.4
FLTR 6.2
EMLC 6.3
GDXJ .6
OUNZ ...
PFXF 7.6
VBR 2.1
VIG 1.8
VDE 3.0
EDV 4.1
VEU 3.3
VSS 3.0
VEA 3.2
VWO 3.4
VGK 3.1
VPL 3.2
VFH 1.9
VUG .5
VYM 2.8
VGT .7
BIV 3.4
BLV 4.5
VO 1.5
VNQ 4.2
VOO 1.3
BSV 2.8
VB 1.5
VTEB 3.0
VTI 1.4
VT 2.0
VTV 2.4
DGS 4.3
HEDJ 3.0
USFR 5.4
EPI .1
IHDG 1.7
DXJ 2.4
ASHR 2.4
DBEF 3.9
HYLB 6.1
CONY 100.4
MSTY 152.2
NVDY 47.8
TSLY 92.9
ULTY 104.7
YMAX 36.8
Last
46.13
215.30
25.23
45.24
24.94
36.29
37.30
23.26
32.48
27.82
22.57
26.86
21.36
49.38
64.52
62.02
75.01
40.88
52.38
42.67
29.69
28.81
85.48
46.23
527.37
105.30
51.16
64.43
48.85
26.06
29.36
36.25
66.86
48.42
39.41
48.03
45.34
61.19
78.57
62.30
94.45
74.88
19.71
48.14
51.92
22.55
18.99
546.18
89.13
130.11
152.00
77.52
56.53
30.44
210.16
6.32
20.03
72.72
17.32
35.30
25.52
24.25
45.13
22.50
17.64
187.90
180.90
130.56
71.62
59.44
119.83
50.72
43.08
69.85
74.26
101.01
350.68
120.00
534.61
74.40
69.93
244.60
83.24
484.62
76.42
222.29
49.72
260.44
111.44
161.18
51.60
47.54
50.36
45.89
45.84
111.11
24.37
41.97
35.43
22.79
32.55
28.53
15.30
14.36
20.11
Div
Chg. Amt.
–0.15
–0.62
–0.14
–0.12
+0.01
+0.04
–0.89
+0.02
+0.06
+0.03
–0.05
–0.22
–0.01
+0.17
–0.28
–0.27
–0.86
+0.54
+0.15
+0.31
+0.05
+0.03
–0.30
...
–2.07
+0.15
+0.35
+1.10
–0.07
–0.70
–0.79
+0.17
+0.27
+0.04
+0.02
+0.06
–0.02
–0.28
+0.47
–0.43
–1.47
+0.26
+0.39
+0.04
+0.14
–0.12
–0.14
+1.57
+0.30
+0.59
+3.58
+2.57
+0.24
–0.28
–5.03
–0.10
–0.24
+1.22
+0.28
+0.04
+0.02
–0.17
+0.53
–0.06
+0.26
+0.88
–0.72
+2.66
–1.23
–0.41
–0.15
+0.03
–1.12
+0.13
–0.01
–0.12
–4.78
+0.62
–10.62
+0.04
–0.31
–2.00
+1.38
–2.11
+0.13
–0.30
–0.02
–1.43
–0.55
+0.33
–0.79
–0.24
+0.05
–0.87
–0.39
+1.53
–0.19
+0.08
+0.02
–0.87
–2.20
–0.02
–0.02
–0.15
–0.15
...
...
.0898
.1133
.0787
.3504
.5469
.1535
.1216
.0825
.0959
.086
.0608
.2556
.2069
.2024
.1065
.3729
.1628
.1442
.1211
.1022
.1332
.3108
1.5949
.1683
.1935
.1028
.3785
.8224
1.0175
.7692
.3186
.1491
.7038
.1671
.1414
.2243
.7423
.1958
.1037
.3941
.2245
.2331
.2083
.30
.1209
1.014
.0139
.7079
.7601
.1498
1.751
...
.3392
...
...
.5196
.4679
.5001
.1257
.1156
.2736
...
.0851
.9425
.7692
.9559
.7685
.2153
2.0534
.2865
.0385
.3704
.2868
.3997
.4676
.6555
1.259
.2277
.2596
.9735
.7324
1.5429
.2022
.6769
.131
.9105
.4212
1.0064
.455
.135
.225
.06
.215
.305
.5925
.0342
.1833
2.2807
2.5239
1.1988
.6942
1.2782
.7317
June 3, 2024
BARRON’S
MUTUAL FUNDS
D ATA
About Our Funds
The listings include the top 1250
open-end funds by assets. These
funds value their portfolios daily
and report net asset values (the
dollar amount of their holdings
divided by the number of shares
outstanding) to the National
Association of Securities Dealers.
Total returns reflect both price
changes and dividends; these
figures assume that all distributions are reinvested in the fund.
Because Lipper is constantly updating its database, these returns
may differ from those previously
published or calculated by others.
3 year returns are cumulative. The
NAV is the last reported closing
price for the week. Footnotes: NA:
not available. NE: performance
excluded by Lipper editor. NN: fund
not tracked. NS: fund not in
existence for whole period. e: ex
capital gains distributions. f:
previous day’s quote. n: no frontor back-end sales charge. p: fund
assets are used to pay marketing
and distribution costs (12b-1 fees).
r: fund levies redemption fee or
back-end load. s: stock dividend or
split of 25% or more. t: fund charges
12b-1 fees (for marketing and
distribution) and a back-end load.
v: capital-gains distribution may be
a return of capital. x: ex cash
dividend.
Net YTD 3-Yr.
NAV Chg. % Ret. % Ret.
For personal non-commercial use only. Do not edit or alter. Reproductions not permitted.
To reprint or license content, please contact Barron's reprints department at 800-843-0008 or www.djreprints.com
A
AAM:
B&GIncGroClI 24.75 -0.09
AB Funds:
CapFdInc.LCapGow105.71 -1.71
MuniIncmShares 10.95 -0.04
AB Funds - A:
LgCpGrA
93.64 -1.52
RelatValA
6.63 -0.03
AB Funds - ADV:
GlbBd
6.78 -0.01
HiIncmAdv
6.87 -0.01
IntlStraEquPtADV 13.20 -0.04
105.80 -1.71
LgCpGrAdv
NationalPtf
9.54 -0.03
SmMidCpValAdv 23.28 0.20
Advisers Inv Trst:
Balanced n
90.46 -0.01
117.55 0.04
Growth n
Akre Funds:
AkreFocusInst 62.57 -0.89
AkreFocusRtl 60.01 -0.86
AmanaGrowth n:
AmanaGrowth n 78.08 -1.42
Amer Beacon Insti:
SmCpInst
25.81 0.24
American Century G:
GlBond
8.63 -0.02
Sustain Equity 52.39 -0.36
American Century I:
EqInc
8.81 0.03
Growth
56.55 -0.78
IntTF
10.62 -0.03
MdCapVal
16.06 0.10
SmCapVal
10.69 0.06
Ultra
89.93 -1.07
American Century Inv:
DiscCoreVal n 35.10 -0.10
EqGro n
30.05 -0.21
EqInc n
8.80 0.04
Grwth n
54.68 -0.75
Heritage n
23.63 -0.61
MdCapVal n
16.04 0.11
OneChMod n
14.83 -0.06
111.27 -1.09
Select n
Ultra n
84.64 -1.01
American Century R6:
AmCentUltraFdR690.89 -1.08
Growth
56.78 -0.78
MdCapVal
16.06 0.10
SmCpVal
10.70 0.06
American Century Y:
IntTF
10.61 -0.03
American Funds Cl A:
2020TarRetA 13.37 -0.03
2025TarRetA 15.07 -0.05
2030TarRetA 16.84 -0.09
2035TarRetA 18.53 -0.13
2040TarRetA 19.72 -0.18
2045TarRetA 20.28 -0.20
2050TarRetA 19.97 -0.21
AmcpA
41.47 -0.71
AMutlA
54.03 -0.19
BondA
11.09 -0.02
BalA
33.73 -0.22
CapIBA
68.27 -0.14
CapWA
15.92 -0.03
CapWGrA
65.16 -0.80
EupacA
59.06 -0.79
FdInvA
79.52 -1.28
GBalA
37.54 -0.28
GovtA
11.70 0.00
GwthA
70.74 -1.06
HI TrA
9.56 -0.02
HiInMuniA
14.89 -0.05
39
Net YTD 3-Yr.
NAV Chg. % Ret. % Ret.
ICAA
55.66 -0.66
IncoA
24.22 0.00
IntBdA
12.29 0.02
IntlGrIncA
38.41 -0.25
LtdTEBdA
15.07 -0.03
N PerA
61.02 -0.77
NEcoA
59.44 -1.30
NwWrldA
79.48 -1.43
SmCpA
67.02 -0.40
STBFA
9.43 0.01
TECAA
16.45 -0.04
TxExA
12.20 -0.04
WshA
61.76 -0.46
AMG Managers Funds:
YachtmanFocFd I 20.91 NA
YacktFocFd N n 20.99 NA
YacktmanFd I 24.44 NA
Angel Oak Funds Trst:
AglOkMtiStFdClIn 8.46 NA
AQR Funds:
LgCapDefStyle I 23.64 -0.10
LngShrtEq I
16.02 0.23
MgdFutStrI
9.15 0.01
Artisan Funds:
GblOppInst
34.81 -0.62
Intl Inv n
29.37 0.17
IntlInst
29.52 0.17
IntlVal Inst
49.63 -0.11
IntlVal Inv n
49.45 -0.11
MidCapInst
42.94 -1.34
MidCapInv n
35.89 -1.11
10.8
4.1
-0.5
7.6
-0.9
9.2
10.1
5.9
1.2
0.8
-0.7
-1.0
8.3
NA
NA
NA
NA
33.4
10.4
-4.2
3.1
-2.1
9.4
6.7
-7.5
-14.7
-0.1
-3.5
-3.6
29.1
NA
NA
NA
NA
7.6 14.8
21.5 85.8
11.9 46.0
9.5
9.5
9.6
8.0
7.9
3.2
3.2
1.9
2.1
2.8
24.1
23.2
-11.7
-12.3
B
8.9 19.2
14.0 29.7
0.2 -3.5
13.9 28.4
8.7 22.7
-0.9 -5.8
2.3 6.3
14.4 8.3
14.0 29.4
-0.6 -3.4
4.9 6.7
7.5 19.0
10.7 33.3
4.7 19.4
4.6 18.5
9.3 33.8
3.5 13.5
-1.3 -6.5
10.7 30.3
4.9
12.7
-1.0
3.5
2.0
13.7
12.5
32.9
-2.8
13.8
4.2
29.4
7.6
11.0
5.0
12.6
8.0
3.4
4.7
11.1
13.6
6.5
17.5
11.9
32.1
1.5
13.2
3.4
29.8
28.7
13.7 30.0
12.7 33.5
3.6 14.4
2.0 4.7
-1.0 -2.7
3.1
3.4
4.3
5.6
6.8
7.1
7.3
8.8
6.4
-1.8
5.8
3.8
-3.6
8.7
8.0
11.5
3.7
-2.2
12.0
3.2
1.1
4.8
4.9
6.8
9.0
11.2
11.6
11.4
13.9
22.3
-9.3
12.9
9.7
-18.1
13.3
-7.1
26.9
4.3
-9.4
18.4
8.4
-2.1
Baird Funds:
AggBdInst
9.60 -0.02
CorBdInst
9.93 -0.03
IntBdInst
10.17 -0.02
ShtTBdInst
9.37 -0.02
Baron Funds:
Asset n
98.29 -3.25
Growth n
92.41 -2.46
138.76 -2.78
Partners n
SmallCap n
32.06 -0.50
Baron Instl Shares:
104.38 -3.44
AssetInst
EmergingMktsInst 14.39 -0.45
GrowthInst
97.74 -2.61
PartnersInst 144.63 -2.90
RealEstateInst 35.59 0.05
SmallCapInst 34.67 -0.54
Bernstein Fds:
DivrMuni n
13.73 -0.03
IntmDur n
11.05 -0.02
BlackRock Funds:
CoreBd Inst
8.11 -0.01
HiYBlk
7.01 0.00
HiYldBd Inst
7.00 -0.01
LowDurI Inst
8.96 0.01
BlackRock Funds A:
AdvLgCapCore 21.17 -0.15
CapAppr
36.54 -0.57
EqtyDivd
20.54 0.06
GlblAlloc
19.17 -0.10
HlthScOp
69.88 -0.19
MdCpGrA
33.20 -1.00
MultiAstIncome 9.99 -0.01
NatlMuni
10.01 -0.03
ScTechOppA 59.36 -1.43
BlackRock Funds III:
iShS&P500IdxK619.66 -3.06
iShUSAggBdIdxK 8.83 -0.01
BlackRock Funds Inst:
AdvLgCapCore 22.42 -0.16
CAInsMun
11.87 -0.03
EmgMkts
24.50 -0.73
EqtyDivd
20.65 0.06
FloRateIncPorIns 9.72 0.00
GlblAlloc
19.36 -0.10
HiEqInc
29.02 0.04
HlthScOp
74.83 -0.20
MdCpGrEq
39.19 -1.17
MultiAstIncome 10.00 -0.01
NatlMuni
10.00 -0.04
ScTechOppInst 65.51 -1.57
StratIncOpptyIns 9.32 0.00
StratMuniOppI 10.41 -0.06
TacOpp Inst
14.26 0.00
TotRet
9.69 -0.05
BNY Mellon Funds:
Aprec n
42.45 -0.49
Dr500In n
56.70 -0.29
Dreyf n
18.72 -0.19
DreyMid r Inv n 30.33 0.06
GlFxIncI
19.85 -0.01
InstS&PStkIdx I 57.86 -0.29
IntlStkI
25.19 -0.19
IntlStkY
24.87 -0.19
StrgVal I
45.12 -0.14
BNY Mellon Funds Tru:
NtlIntmMuni 12.74 -0.04
-1.2 -8.1
-0.8 -6.7
0.0 -3.8
1.3 2.5
0.3 -5.0
-3.4 -2.8
-13.1 -5.7
5.9 0.8
0.4 -4.3
2.6 -25.8
-3.3 -2.0
-13.0 -4.9
-0.4 -5.4
6.1 1.6
-0.4 -1.0
-1.6 -9.4
-1.4 -9.3
2.6 7.9
2.4 7.6
1.3 1.3
11.9
14.6
8.1
4.9
6.9
1.7
2.5
-0.7
16.5
26.5
20.1
17.5
-1.2
11.2
-10.9
2.3
-5.1
7.5
11.3 31.4
-1.5 -8.9
12.0 27.4
0.4 -1.7
1.0 -22.9
8.2 18.4
3.7 18.3
5.0 -0.5
7.0 19.9
7.0 12.1
1.8 -10.2
2.7 3.0
-0.7 -4.4
16.6 8.4
0.8 1.9
0.1 -5.4
7.3 16.5
-1.5 -9.5
6.7
11.1
15.9
7.7
0.0
11.2
6.0
6.0
9.1
21.5
29.6
45.0
13.0
-2.1
30.7
3.0
3.1
38.1
-1.7 -3.3
C
Calamos Funds:
Gr&IncA
45.86 -0.25
MktNeutI
14.55 0.00
8.5 17.3
2.8 10.1
D ATA P R O V ID E D BY LIP P E R
Net YTD 3-Yr.
NAV Chg. % Ret. % Ret.
Calvert Investments:
Eq A
79.59 -1.25
Carillon Reams:
CorePlBd I
29.17 -0.03
UnconstrndBd I 12.13 0.02
Carillon Scout:
MidCap I
24.14 -0.26
CausewayInst :
CausewayInst 20.93 0.00
CIBC Atlas:
DispEq Inst
30.31 -0.24
ClearBridge:
AggressGrowthA105.41 -2.56
AllCapValueA 14.76 -0.02
AppreciationA 34.35 -0.09
DividendStrat1 n 29.55 0.12
DividendStratA 29.51 0.11
LargeCapGrowthA 57.57 -0.81
LargeCapGrowthI68.54 -0.96
SmallCapGrowthIS 39.75 -0.10
Cohen & Steers:
GlbRltyI
50.88 0.81
InstlRlty
45.11 1.05
PrefSecIncnI 12.02 -0.05
RltyIncI
16.27 0.39
RltyShs n
61.65 1.45
Colorado BondShares:
ColoradoBdShs 8.75 -0.03
Columbia Class A:
BalancedA
51.50 -0.05
ContCoreA
34.93 -0.07
DisplCoreA
14.59 -0.05
DivIncA
32.37 -0.03
LgCpGrowA
65.07 -0.75
LgCpVl A
16.59 0.09
LiGoBalA
11.69 -0.02
SelgComuInfoA 125.15 -1.72
TaxEA
11.63 -0.07
Columbia Class Adv:
DivIncom
33.06 -0.03
Columbia Class C:
DivInc
31.17 -0.03
Columbia Class I:
Acorn I
11.36 -0.21
Balanced I
51.38 -0.05
ContCore I
35.38 -0.06
DivIncom I
32.41 -0.03
LgCpGrow I
69.76 -0.79
LgCpIdx I
57.31 -0.29
SelComunInfo 146.30 -2.00
SelLCVal
35.10 0.40
StratInc I
20.99 0.03
TotReBd I
29.56 0.00
Columbia Class I2:
DivIncom
33.03 -0.02
Columbia Class I3:
ContCore I3
36.36 -0.06
DivIncom
33.09 -0.02
3.9 19.5
-1.5 -7.3
0.6 3.1
10.7
6.7
7.0 22.5
9.2 20.8
0.9 -7.9
11.4 19.6
11.5 28.8
6.4 25.6
6.3 24.5
12.1 23.9
12.2 25.0
-2.0 -20.8
-2.2
-2.1
4.5
-1.5
-2.2
-10.9
-0.3
-1.0
-1.0
-0.6
1.8
6.8
7.1
12.5
11.8
7.0
14.2
8.5
6.4
11.9
-0.7
14.2
31.1
29.3
22.7
29.8
17.6
6.6
32.4
-6.0
7.1 23.6
6.6 19.9
3.9
7.2
12.6
7.1
14.3
11.2
12.1
10.3
0.5
-1.6
-9.8
15.0
32.1
23.6
30.8
30.9
33.4
17.8
-1.5
-12.2
7.1 23.8
12.6 32.6
7.1 24.0
D
Davis Funds A:
NYVen A
29.96 -0.09
Davis Funds C & Y:
NYVenY
31.22 -0.08
Del Invest Instl:
Value
17.34 0.07
Delaware Invest A:
GroInA
15.25 -0.02
Deutsche DWS:
CoreEq n
34.49 -0.20
Diamond Hill Funds:
LgCapI
34.14 0.21
LgCapY
34.19 0.22
LongShortI
29.65 0.01
Dimensional Fds:
2TGlFxd
9.89 0.00
5GlbFxdInc
10.19 0.01
DFARlEst
37.55 0.76
EmgMkt
28.82 -0.73
EmgMktSoCoEq 14.67 -0.32
EmgMktVa
31.34 -0.60
EmMktCorEq 23.63 -0.50
EmMktSmCp 23.77 -0.27
Fixd
10.24 -0.04
GblAll60 40Inst 21.30 -0.01
GlEqInst
33.09 -0.05
GlRESec
9.88 0.15
InfProtSec
10.85 0.04
IntGvFxdInc
10.79 0.00
IntlCoreEq
16.40 0.10
IntlREst
3.61 0.00
IntlSustCore1 13.05 0.03
IntlVal
22.08 0.23
IntlVectorEq
14.37 0.11
IntSmCo
20.55 0.15
IntSmVa
23.43 0.23
IntTermMuni
9.90 -0.05
IntVaIII
18.99 0.20
ITExQual
9.45 -0.01
LgCo
35.07 -0.18
LgCpIntl
28.31 0.12
SclCrEqInst
15.09 0.08
STExQual
10.40 -0.02
STGov
10.01 0.00
STMuniBd
10.13 -0.02
12.8 11.7
13.0 12.6
3.7
8.9
8.4 32.1
11.4 32.3
7.4 13.4
7.4 13.8
10.1 17.1
2.3
2.3
-3.9
4.9
5.1
6.7
5.6
4.3
2.4
5.9
8.9
-3.8
0.2
-1.8
7.2
-3.2
6.8
10.6
7.7
6.5
10.5
-1.5
10.5
-0.6
11.2
7.7
6.5
2.2
2.3
0.9
4.0
-1.1
-3.8
-7.5
-7.1
7.8
-2.5
2.6
6.0
10.9
19.3
-8.7
-4.6
-10.5
9.2
-17.2
4.2
24.9
10.0
1.3
16.5
-1.2
25.0
-7.6
31.2
11.2
4.3
1.4
1.6
3.3
Net YTD 3-Yr.
NAV Chg. % Ret. % Ret.
US CoreEq1
39.75 -0.10
US CoreEq2
35.62 -0.07
US Micro
27.10 0.06
US Small
45.93 0.08
US SmCpVal
46.67 0.35
US TgdVal
32.89 0.22
USLCpGr
34.63 -0.22
USLgVa
48.44 0.26
USLgVaIII
31.11 0.17
USSoCoreEq2 26.07 -0.11
USSustCoreI 41.04 -0.23
USVectorEq
25.88 0.04
Dodge & Cox:
104.38 0.44
Balanced n
Dodge & Cox n 10.76 -0.02
GblStock n
16.03 0.02
Income n
12.38 -0.01
Intl Stk n
52.77 -0.05
Stock n
257.73 1.48
DoubleLine Funds:
CoreFxdIncmI 9.05 -0.04
LowDurBdI
9.57 -0.03
ShillerEnhCAPEI 14.36 -0.03
TotRetBdI
8.57 -0.04
TotRetBdN n
8.57 -0.04
10.6
10.0
3.4
3.8
4.2
3.5
11.0
9.3
9.3
9.9
10.0
7.2
27.8
26.6
12.0
11.2
23.5
22.1
36.5
19.4
19.7
24.6
26.4
19.1
4.9
-1.0
7.4
-0.9
7.3
8.4
13.0
1.9
21.0
-4.4
13.7
23.2
-0.9 -7.5
2.1 6.0
2.7 9.2
-1.1 -8.3
-1.0 -9.0
Cash Track
Small Change: Equity and bond funds took in a bit more cash. For the last month, the average weekly
intake at stock funds rose a slight 3%, to $4 billion. Inflows at taxable-bond funds inched up a bare 1%, to
$3.8 billion. Money-market funds saw inflows fall by half, to $8 billion. Muni-bond fund cash inflows slipped
to $50 million.
Equity Funds
Municipal Bond Funds
Fairholme:
Fairholme n
34.99 0.18
FAM Value:
FAMValue n
97.26 -1.00
Federated Hermes A:
StrValDivA p
5.49 NA
Federated Hermes Int:
InsHiYld
8.70 -0.01
TtlRtnBdI
9.28 -0.01
Federated Hermes IS:
KaufmnSCI
49.26 -0.35
StraValDivIS
5.53 NA
UltraShortI
9.21 0.01
Federated Hermes R:
KaufmnR
5.56 -0.09
Federated Hermes R6:
FedInstHYBondL 8.70 -0.02
TtlRtnBdL
9.28 -0.01
Fidelity:
500IdxInstPrem n 183.61 -0.91
BalancedK6
15.13 -0.07
Contrafund K6 27.71 -0.21
EmgMktIdxInstPre n 10.43 -0.32
ExtMktIdxInstPre n 80.74 -0.80
FidAdAsset
13.38 -0.04
FidAdEm
37.91 -1.11
FidSAI
8.91 0.00
FidSAIEmerg 13.14 -0.39
FidSer5
7.56 0.02
FidSer0-5
9.63 0.03
FIDSerEmgMkt 8.87 -0.31
FidSerInt
8.48 -0.03
FidSerToMarket 17.25 -0.10
FIDSerTresIndxFd 9.93 0.00
FIDZroExtMktIx n 12.70 0.00
FIDZroLgCpIx n 18.73 -0.12
Flex 500 Index 22.56 -0.11
FlexIntIdx
13.34 NA
FlexUSBdIdx
8.91 -0.01
Freedom2060K 14.10 -0.10
GlexUSIdxInstPre n 14.89 NA
GrowthCompanyK6 26.69 -0.31
InflPrBdIndInsPr n 9.04 0.03
IntlIdxInstPrem n 50.24 NA
IntlIndex n
11.77 -0.06
IntrTresBdIxPrem n 9.44 -0.01
LgCpGwId InstPre n 33.35 -0.40
LgCpVlIdxIstPrem n 17.40 0.03
LTTrsBdIdxInstPr n 9.37 -0.07
MidCpInxInstPrem n 31.65 -0.22
OTCK6Port
23.55 -0.40
PuritanK6
15.42 -0.13
RealEstIdxInst n 15.01 0.25
SAIUSLgCpIndxFd 21.96 -0.10
SeriesBondFd 8.80 -0.01
SeriesOverseas 14.09 -0.10
SerLTTreBdIdx 5.42 -0.04
SmCpIdxInstPrem n 25.72 0.01
STBdIdx InstPrem n 9.73 0.02
STTreIdx InstPre n 10.04 0.01
TMktIdxInstPrem n 144.91 -0.81
TotalMarketIndex n 18.33 -0.10
TtlIntIdxInstPr n 13.86 NA
USBdIdxInstPrem n 10.12 -0.01
USSusIdx n
23.74 -0.17
Fidelity Adv Focus A:
-3.2 16.3
6.6 16.0
NA
NA
0.8 3.9
-1.4 -8.2
3.5 -18.2
NA NA
2.3 7.2
5.7 -12.1
0.8 3.8
-1.4 -8.2
11.3
7.6
20.3
3.8
3.4
1.6
6.1
2.8
8.3
-1.2
1.8
4.8
-1.8
10.2
2.1
3.7
11.2
11.3
NA
-1.5
9.0
NA
18.9
0.2
NA
6.3
-2.0
13.1
7.6
-6.1
5.7
17.0
9.8
-4.9
11.3
-1.5
8.6
-6.2
2.7
0.4
0.0
10.2
10.3
NA
-1.6
11.7
31.5
17.2
36.9
-17.0
-3.9
1.0
-14.7
3.9
1.2
NS
NS
-19.6
NS
25.0
8.8
2.7
30.0
31.5
NA
-9.0
11.9
NA
32.2
-4.1
NA
2.6
-10.9
37.2
17.2
-26.7
9.6
31.3
19.0
-6.8
31.4
-8.9
10.0
-26.7
-4.6
-1.4
-2.3
25.0
26.1
NA
-9.1
33.3
440
4100
270
400
100
-3300
-70
-240
May
Apr
Money Market Funds
May
Taxable Bond Funds
18900
6600
6100
5100
-6700
3600
-19500
2100
-32300
Apr
600
May
Apr
May
A red chart indicates a lower value than the starting period. Green means it's higher than the starting period.
The charts above show four-week moving averages of net cash flow in millions of dollars.
Net YTD 3-Yr.
NAV Chg. % Ret. % Ret.
F
7800
-7000
Apr
E
Eaton Vance Class A:
TMG1.0 n
2367.70-16.34 12.2 29.9
TMG1.1
106.45 -0.73 12.1 28.9
Eaton Vance Class I:
AtlCpSMID
40.64 -0.07 7.3 18.3
FltgRt
8.41 -0.02 3.5 15.6
GblMacAbR
8.42 NA NA NA
IncBos
5.12 0.00 2.1 9.0
NatlMuniInc
9.16 -0.04 -0.7 -2.7
Edgewood Growth Instituti:
EdgewoodGrInst 47.75 -0.75 9.2 2.3
B A R R ON S .C OM / D ATA
HthCarA
60.86 -0.30
110.52 -2.22
TechA
Fidelity Advisor:
SrsAdvIntlCapApp 31.83 -0.42
StragInc n
11.38 -0.02
TotBdFdClZ
9.33 -0.01
Fidelity Advisor A:
BalancA
28.22 -0.13
EqGrA p/r
19.92 -0.28
150.74 -2.60
GrOppA
NwInsghtA
38.51 -0.32
StrInA
11.22 -0.02
Fidelity Advisor Fun:
EqGrClZ
23.49 -0.32
InterDiscZ
49.65 -0.09
IntlGrwZ
20.54 -0.18
Fidelity Advisor I:
BalancI
28.98 -0.13
ConsvIncmMuni I n 10.01 0.00
EqGrI
23.13 -0.32
FAEmgMktI
30.60 -1.02
FAInvGrdI
7.05 -0.01
FltRatel
9.30 0.00
167.40 -2.87
GrOppI
HthCarI
67.78 -0.33
IntlGr
20.50 -0.18
MuniIncI
9.96 -0.03
NwInsghtI
40.34 -0.33
REIncmInst
11.58 0.06
StrInI
11.38 -0.02
Total Bd
9.33 -0.01
Fidelity Advisor M:
Balanced
28.67 -0.14
EqGr
19.16 -0.26
147.90 -2.55
GrOppM
NwInsghtM
35.78 -0.30
Fidelity Advisor Z:
AdvIntlSmCpZ 33.01 0.08
AssetManager50% 20.18 -0.11
AssetMngr85 25.76 -0.21
AsstMngr70
27.13 -0.19
EmMkt Z
30.54 -1.02
FloatRateHighInc 9.30 0.00
169.87 -2.91
GrOpp
IntCpAp
31.93 -0.42
InvestGradeBd 7.06 -0.01
NewMktsIncFdZ 12.50 -0.02
RE Income
11.58 0.07
StkSelAllCap 74.21 -0.61
Fidelity Freedom:
2060 K6
14.10 -0.11
FF2010 n
13.86 -0.04
FF2015 n
11.38 -0.04
FF2020 n
14.36 -0.06
FF2025 n
13.57 -0.07
FF2030 n
17.35 -0.10
FF2035 n
15.42 -0.09
FF2040 n
11.31 -0.08
FF2045 n
13.13 -0.10
FF2050 n
13.30 -0.10
Free2055 n
15.39 -0.11
Free2060InstPrem 17.24 NA
Freedom2020 K 14.35 -0.06
Freedom2020K6 14.28 -0.06
Freedom2025 K 13.55 -0.06
Freedom2025K6 13.50 -0.06
1.5 -3.2
16.1 45.6
7.1 6.5
1.6 1.2
-0.8 -5.9
7.4
16.6
17.5
19.1
1.5
15.1
34.1
10.7
32.7
0.3
16.8 35.6
12.5 -2.7
7.4 6.5
7.5
1.0
16.8
7.3
-1.3
3.6
17.6
1.6
7.3
-1.4
19.3
1.4
1.6
-0.9
15.9
4.9
35.1
-15.7
-8.0
18.6
11.6
-2.4
6.1
-2.3
33.6
2.1
1.0
-6.2
7.3 14.2
16.5 33.1
17.4 9.9
19.0 31.7
4.7
3.8
6.8
5.4
7.3
3.6
17.7
7.1
-1.3
2.8
1.5
8.0
4.1
4.4
10.3
7.9
-15.4
18.8
12.0
6.9
-7.6
-0.9
2.5
21.1
9.1
2.1
2.8
3.7
4.4
5.2
6.6
8.3
8.9
9.0
8.9
NA
3.7
3.8
4.5
4.5
12.4
-0.9
0.0
0.8
2.1
3.9
7.0
10.4
11.5
11.5
11.6
NA
1.1
1.5
2.4
2.8
Net YTD 3-Yr.
NAV Chg. % Ret. % Ret.
Freedom2030 K 17.34 -0.09
Freedom2030K6 17.27 -0.09
Freedom2035 K 15.40 -0.09
Freedom2035K6 15.35 -0.09
Freedom2040 K 11.32 -0.08
Freedom2040K6 11.27 -0.08
Freedom2045 K 13.12 -0.10
Freedom2045K6 13.07 -0.10
Freedom2050 K 13.29 -0.10
Freedom2050K6 13.27 -0.10
Freedom2055 K 15.39 -0.11
Freedom2055K6 15.37 -0.11
Freedom2060 n 14.10 -0.10
Idx2020InsPre 15.63 NA
Idx2025InsPre 18.21 NA
Idx2030InsPre 19.56 NA
Idx2035InsPre 22.46 NA
Idx2040InsPre 23.53 NA
Idx2045InsPre 24.69 NA
Idx2050InsPre 24.73 NA
Idx2055InsPre 20.35 NA
Idx2020 Premier 15.63 NA
Idx2025 Premier 18.20 NA
Idx2030 Premier 19.56 NA
Idx2035 Premier22.46 NA
Idx2040 Premier 23.52 NA
Idx2045 Premier24.69 NA
Idx2050 Premier 24.73 NA
Idx 2055 Premier20.34 NA
Idx 2060 Premier 17.24 NA
Fidelity Invest:
AggrInt n
28.41 -0.37
AilSectEq
11.96 -0.11
AMgr20% n
13.39 -0.04
AMgr50% n
20.24 -0.11
AMgr70% n
27.17 -0.20
AMgr85% n
25.91 -0.21
AstMgr30R n 11.64 -0.04
Balanc n
28.84 -0.13
BalancedK
28.84 -0.14
208.06 -2.04
BluCh n
BluChpGr K6
31.91 -0.31
209.27 -2.05
BluChpGrK
CAMun n
11.95 -0.05
CapAp n
45.24 -0.55
CapDevO n
23.60 -0.04
CnvSc n
33.15 -0.19
Contra n
19.34 -0.15
ContraK
19.40 -0.15
CpInc n
9.90 -0.04
DisEq n
67.18 -0.84
DivGth n
38.92 -0.25
44.80 -0.21
DivIntl n
DivIntl K6
14.80 -0.08
DivStkO n
37.00 -0.46
EmrgMktK
37.95 -1.12
EmrgMktsDebt 7.79 -0.01
EmrMkt n
37.93 -1.12
Eq Inc n
73.75 0.22
EqDivIncm n
28.81 0.18
Fidel n
86.65 -1.04
FltRateHi n
9.31 0.01
FocsdStk n
38.40 -0.51
FournOne n
56.68 NA
GNMA n
9.91 -0.01
GovtInc n
8.97 -0.01
GroCo n
37.83 -0.39
GroInc n
60.78 -0.07
5.3
5.3
6.6
6.7
8.4
8.5
9.0
9.1
9.0
9.1
9.0
9.1
8.9
NA
NA
NA
NA
NA
NA
NA
NA
NA
NA
NA
NA
NA
NA
NA
NA
NA
4.2
4.7
7.3
7.7
10.8
11.3
11.9
12.4
11.9
12.4
11.9
12.4
11.5
NA
NA
NA
NA
NA
NA
NA
NA
NA
NA
NA
NA
NA
NA
NA
NA
NA
7.1
13.6
1.5
3.7
5.4
6.8
2.2
7.5
7.6
20.1
18.9
20.1
-1.6
14.0
14.9
2.8
20.3
20.3
4.7
14.9
18.1
9.1
9.1
16.0
6.1
3.0
6.0
10.2
6.6
16.3
3.6
26.8
NA
-2.0
-2.0
18.5
12.5
6.6
34.6
0.9
4.2
7.6
10.1
1.6
16.0
16.2
31.4
31.8
31.8
-3.7
30.1
37.3
0.8
36.0
36.2
11.0
29.0
35.2
3.1
3.9
33.6
-14.7
-0.6
-15.1
23.1
22.3
36.1
18.8
40.0
NA
-8.9
-10.4
31.5
33.2
Net YTD 3-Yr.
NAV Chg. % Ret. % Ret.
GrowCoK
38.05 -0.39
GrowIncK
60.71 -0.07
GrStrt n
62.96 -1.07
GwthDiscovery n 62.96 -0.87
HighInc n
7.67 0.00
IntBd n
9.95 0.00
IntlCapiApp K6 16.40 -0.21
IntlDisc n
49.90 -0.09
IntlGrRet n
20.55 -0.18
IntlSmCap n
32.82 0.08
IntMu n
9.94 -0.03
InvGB n
7.04 -0.01
InvGrBd
9.81 -0.01
LargeCap n
51.65 -0.07
LevCoSt n
40.28 -0.58
LmtTrmMuniIncm n 10.23 -0.01
LowP n
47.92 0.11
LowPriStkK
47.85 0.11
LowPriStkK6 16.37 0.04
Magin n
13.92 -0.22
MAMun n
11.20 -0.05
Manager40 n 12.70 -0.06
Manager60 n 15.27 -0.09
MegaCpStk n 24.02 -0.08
MidCap n
43.07 -0.11
MuniInc n
12.03 -0.05
212.59 -2.34
NASDAQ n
NewInsights Z 40.53 -0.33
NewMill n
55.58 -0.47
NewMkt n
12.50 -0.02
OTC n
21.38 -0.35
OTC K
21.88 -0.36
Ovrse n
65.15 -0.45
PuritanK
25.44 -0.22
Puritn n
25.46 -0.23
RealE n
36.58 0.76
SAIIntlMinVolInd 11.16 0.04
SAILTTreBdIdx 6.91 -0.06
SAISm-MidCap500I 6.42 -0.03
SAIUSMinVolIndFd 20.12 -0.06
SAIUSQtyIdx 21.68 -0.25
SmCapDisc n 27.44 -0.09
SmlCapO n
15.17 -0.01
SmlCpGrth n
31.47 -0.12
SmlCpGrth K6 16.87 -0.05
SmlCpGrth Z
31.83 -0.12
SmlCpVal n
20.17 -0.02
Srs1000ValIndRet 15.81 0.03
SrsBlChGroRetail n 18.68 -0.17
SrsCommStrt 98.92 -1.89
SrsEmrgMkt
18.21 -0.65
SrsGlobal
14.65 NA
SrsIntlGrw
18.49 -0.15
SrsGroCoRetail 23.16 -0.24
SrsIntlSmCp
17.57 0.03
SrsIntlVal
12.97 0.10
STBF n
8.35 0.01
StkSelSmCp n 36.41 -0.03
StkSlcACap n 74.72 -0.61
StratDivInc n 16.63 0.06
TaxFrB n
10.78 -0.05
TotalBond n
9.34 -0.01
TotalBond K6
8.66 -0.01
177.41 -3.04
Trend n
Value n
15.50 0.07
ValueDisc n
36.82 0.24
Wrldw n
37.46 -0.31
Fidelity SAI:
18.6
12.5
11.6
16.9
2.8
-0.1
7.2
12.4
7.3
4.7
-1.4
-1.3
-1.2
14.5
15.5
-0.5
8.7
8.8
8.8
16.5
-1.5
3.0
4.5
14.7
6.3
-1.4
11.8
19.3
16.4
2.8
16.9
16.9
8.0
9.8
9.7
-5.0
2.1
-7.1
4.9
7.8
12.0
3.2
9.1
11.8
11.9
11.8
2.0
7.6
19.6
6.8
5.1
NA
7.9
19.0
3.6
11.1
1.1
9.0
8.0
5.1
-1.5
-0.9
-1.0
19.4
7.9
4.9
20.4
31.8
33.5
15.3
35.4
3.5
-4.2
7.1
-3.0
6.1
3.8
-2.2
-7.9
-6.6
36.2
21.4
-1.3
20.5
20.8
22.2
32.9
-4.6
3.0
5.5
38.3
16.5
-4.3
25.4
34.1
45.7
-1.3
30.6
30.9
6.1
18.5
18.2
-4.0
3.6
-29.3
7.3
24.2
39.6
12.9
17.6
4.0
5.1
4.3
8.1
17.4
34.5
20.4
-18.4
NA
8.4
35.1
-1.7
26.4
1.9
14.9
20.8
11.8
-4.0
-6.1
-6.0
35.9
23.3
11.3
21.8
BARRON'S • Lipper FMI
Net YTD 3-Yr.
NAV Chg. % Ret. % Ret.
FidSAICnsrvInc 10.01 -0.01
FidSAIEmgMktIndx 13.45 -0.42
FidSAIIntlIndxFd 14.48 NA
IntlValIdx
10.19 NA
LowDurationInc 10.10 0.01
Muni Inc
9.71 -0.04
SAIEmgMktLoVolIx 11.02 -0.27
SAIInflaFocFd 90.89 -1.22
ShortTermBd
9.59 0.01
TotalBd
8.84 -0.02
TxFreeBd
9.87 -0.04
U.S.TreBdIdx
8.58 0.00
USValueIndex 11.80 0.09
Fidelity Selects:
Biotech n
18.40 0.22
DfAero n
17.92 0.00
Energy n
63.72 1.19
Health n
28.31 -0.17
HlthCareSrvPt r n 123.54 1.33
ITSvs n
55.76 -1.67
MdTchDevis n 62.71 -1.52
Multimedia n 98.52 -0.31
Pharm n
28.66 0.03
Retail n
19.30 0.21
Semiconductors r n 33.25 -0.44
Softwr n
25.40 -1.51
Tech n
33.01 -0.68
116.40 1.72
UtilGr n
Fidelity Series:
Canada
15.30 0.02
IntMuni Z
9.96 -0.03
FidelityAdviAsset:
ADVAssetMan60 15.26 -0.09
First Eagle Funds:
GlbA
68.11 -0.01
OverseasA
25.76 -0.04
FPA Funds:
FPANwInc
9.70 -0.02
FPACres Inst 41.69 -0.10
FPACresentFnd 41.72 -0.11
Franklin A1:
CA TF A1
6.74 -0.03
Fed TF A1
10.66 -0.04
HiInc A1
1.71 -0.02
HY TF A1
8.73 -0.05
IncomeA1
2.34 0.00
NY TF A1
9.83 -0.04
US Gov A1
4.97 -0.02
Utils A1
22.05 0.46
Franklin Templeton:
TgtModA
15.12 NA
FrankTemp/Frank Adv:
CA TF Adv
6.73 -0.03
CvtScAdv
21.51 0.32
160.25 -3.54
Dynat Adv
136.40 -2.25
Growth Adv
IncomeAdv
2.32 0.01
RisDv Adv
92.64 -0.77
FrankTemp/Franklin A:
BAL A
12.43 -0.01
153.21 -3.39
DynaTech A
EqIn A
32.11 0.04
FoundFAlA
15.00 -0.05
GrOp A
47.96 -1.14
135.09 -2.23
Growth A
LwDuToRt A
8.85 0.01
1.0
3.6
NA
NA
2.2
-1.5
0.7
7.8
1.1
-0.7
-1.5
-1.7
9.4
NS
-17.3
NA
NA
8.7
-3.8
2.4
13.2
2.0
-5.6
-3.1
-9.8
25.9
3.6 -7.8
7.7 24.4
14.8 114.0
1.7 -2.3
-3.8 3.0
-4.9 -17.6
3.3 -9.3
15.1 9.0
22.4 46.3
9.9 4.6
37.1 120.1
-6.5 11.4
15.8 37.4
19.9 42.2
4.2 18.9
-1.4 -2.0
4.5
5.7
8.0 13.8
6.3 5.3
1.1 5.4
7.9 18.1
7.9 18.3
-1.2
-0.5
2.1
1.2
2.8
-1.1
-2.0
15.1
-4.8
-5.0
8.4
-5.7
11.2
-5.9
-9.0
24.2
NA
NA
-1.0
4.1
14.7
10.3
2.9
5.2
-4.4
1.1
10.4
21.3
11.8
20.7
1.9
14.6
10.0
7.1
12.1
10.2
1.1
6.9
9.5
22.6
12.2
12.1
20.4
1.8
40
BARRON’S
MUTUAL FUNDS
D ATA
Net YTD 3-Yr.
NAV Chg. % Ret. % Ret.
RisDv A
92.74 -0.77
SmMCpGrA
35.57 -0.95
StrInc A
8.18 -0.03
TtlRtn A
8.14 -0.01
FrankTemp/Franklin C:
Income C
2.39 0.01
FrankTemp/Franklin R:
FrkDynTchR6 162.70 -3.59
136.30 -2.25
FrkGrthR6
FrkIncR6
2.33 0.00
FrkRisDivR6
92.63 -0.77
FrkSmCpGrR6 25.28 0.02
FrankTemp/Mutual A&B:
Shares A
25.57 0.24
FrankTemp/Temp A:
Frgn A
8.51 -0.06
GlBond A
7.02 -0.10
Growth A
27.52 -0.04
World A
16.80 -0.35
FrankTemp/Temp Adv:
GlBondAdv
6.99 -0.09
Frost Family of Fund:
FrTRInst
9.63 -0.04
5.1
1.3
0.4
-1.2
19.8
-8.3
-1.7
-10.3
3.0
9.7
14.7
10.3
2.9
5.2
4.5
10.7
21.6
11.9
21.0
-10.9
5.8 11.6
6.0
-7.8
7.7
12.0
13.0
-14.2
10.1
11.0
-7.6 -13.4
2.7
7.6
G
GE Elfun/S&S:
Trusts n
87.85 -0.79
GMO Trust Class III:
Quality
31.71 -0.51
GMO Trust Class VI:
Quality
31.72 -0.51
Goldman Sachs Inst:
EmgMktEq
22.68 NA
HYMuni
9.06 -0.04
Muni
15.12 -0.06
Guggenheim Funds Tru:
MacOppFdClInstl 24.27 0.01
TotRtnBdFdClInst 23.17 -0.02
GuideStone Funds:
EqindxGS2
53.64 NA
MedDurGS2
12.45 NA
14.7 34.9
10.4 34.0
10.4 34.4
NA NA
0.7 -4.6
0.0 -1.7
2.4 3.9
-0.9 -8.4
NA
NA
NA
NA
For personal non-commercial use only. Do not edit or alter. Reproductions not permitted.
To reprint or license content, please contact Barron's reprints department at 800-843-0008 or www.djreprints.com
H
Harbor Funds:
109.55 -2.03
CapApInst
IntlInst
47.60 -0.01
SmCpValInst 40.77 -0.08
Harding Loevner:
IntlEq
26.77 -0.17
Hartford Funds A:
BalIncA
14.46 0.00
CapAppA
42.55 -0.18
DiscpEqA
51.44 -0.40
DivGth A
35.50 -0.06
EqInc
20.85 0.04
GrOppty
49.81 -0.91
MidCap A
25.36 -0.78
Hartford Funds C:
Bal IncC
14.19 0.00
Hartford Funds I:
BalIncI
14.47 0.01
DivGthI
35.27 -0.07
EmrgMktEqInv 16.37 -0.49
EqIncI
20.66 0.03
InterValue
19.06 0.12
IntlAlphaInv
17.85 -0.11
StrInc
7.71 -0.05
Hartford HLS Fds IA:
Balanced
30.01 -0.22
CapApp
50.55 -0.34
DiscEqui
21.29 -0.16
Div&Grwth
24.68 -0.04
TotRetBd
9.49 -0.01
13.5 23.8
7.9 6.1
5.7 10.0
3.2 -3.4
2.0
9.1
12.9
8.8
5.0
18.5
0.4
3.5
13.2
25.0
26.0
20.1
10.2
-11.2
1.7
1.2
2.2 4.4
8.9 26.8
4.8 -20.6
5.1 20.9
8.0 24.4
7.2 3.1
2.1 -2.0
4.3
9.8
12.9
9.1
-0.8
11.7
18.2
24.5
27.2
-8.0
I
IFP US Equity Fund:
IFP US EquityFd 18.83 NA
Invesco Fds Investor:
DivrsDiv n
18.80 0.02
Invesco Funds A:
500InxA
55.84 -0.28
ActiveAllA
13.75 -0.05
CapApprA p
75.32 -0.96
Chart
19.04 -0.10
CmstA
29.67 0.13
DevMktA
40.18 -0.93
DiscFdA p
92.87 -0.82
DisMdCpGrA 26.33 -0.72
DivIncm p
25.89 0.09
DivrsDiv p
18.80 0.01
EqIncA
10.56 -0.01
EqWtdA p
72.75 -0.13
GblStrIncmA p 3.08 0.00
GlbOppA p
48.30 -0.61
GrIncA
21.83 -0.01
HYMuA
8.37 -0.05
IntTMIA p
10.28 -0.03
InvGloblFdA
99.52 -1.93
MnStFndA
55.99 -0.29
MnStSmCpA p 28.38 -0.26
ModInvA
11.05 -0.02
MunInA
11.82 -0.05
RchHiYldMuniA 6.75 -0.04
June 3, 2024
NA
NA
7.2 18.6
11.0
5.1
17.1
12.1
9.0
2.1
10.9
11.9
6.0
7.1
5.2
5.3
0.0
-4.9
8.0
0.0
-0.1
10.8
12.7
6.2
4.0
-0.6
0.0
29.5
0.9
25.1
21.9
30.7
-26.3
-2.7
-1.0
18.3
18.2
11.0
14.2
-6.5
-36.3
21.2
-7.6
-3.2
7.2
23.4
11.4
-0.5
-5.6
-4.9
Net YTD 3-Yr.
NAV Chg. % Ret. % Ret.
RisingDivA
25.39 -0.06
RoMu A p
14.97 -0.11
SenFltRtA
6.65 0.00
SP IncomeA
5.64 0.05
Invesco Funds P:
Summit P p
26.14 -0.49
Invesco Funds Y:
DevMktY
39.48 -0.91
114.90 -1.01
DiscovY
EqWtdY
73.98 -0.13
101.17 -1.95
GloblY
IntGrowY
37.25 -0.24
IntlSmCoY
41.93 -0.37
Ivy Funds:
AssetStrA p
21.83 -0.21
CoreEqA t
17.23 -0.18
HiIncA p
6.05 -0.02
LgCpGwthA p 32.61 -0.59
LgCpGwthl r
35.86 -0.65
MidCapI
30.98 -0.95
MdCpGwthA p 26.81 -0.83
ScTechA p
53.08 -1.06
ScTechI r
69.80 -1.40
10.3
-1.5
3.6
13.6
30.1
-5.3
20.2
77.6
15.5
9.3
2.2
11.0
5.4
10.9
4.5
-1.5
-25.7
-2.0
15.1
8.0
-3.9
-16.2
9.0
13.5
2.8
9.4
9.5
2.0
1.9
15.7
15.9
14.0
31.8
3.9
31.4
32.5
-6.0
-6.8
19.7
20.6
JL
Janus Henderson:
Balanced C
44.29 -0.23
Balanced T n 45.02 -0.23
Enterprise T n 136.99 -0.37
GlbResch T nr 109.18 -0.45
GlLifeSci T nr 73.64 0.51
GlTech T nr
61.52 -1.17
Grw&Inc T n
72.31 -0.95
Resh T n
77.38 -0.74
Jensen I :
Jensen I
60.79 -0.79
JensenQualGrJ n:
JensenQualGrJ n 60.86 -0.80
JHF III DispVal:
DispVal
25.69 -0.05
DispVal I
24.53 -0.04
DispValMCI
29.11 -0.01
DispValMdCp 27.61 0.00
DispValMdCpR6 29.11 -0.01
DispValR6
24.60 -0.05
JHITFunLgCpCorFd:
FunLgCpCorA 68.29 -0.88
John Hancock:
500Index1
55.43 -0.28
BondI
13.23 -0.03
BondR6
13.26 -0.02
IntlGrwI
26.93 -0.35
John Hancock Class 1:
BlueChipGrw 55.77 -0.77
LSAggr
14.17 -0.09
LSBalncd
13.04 -0.05
LSGwth
13.74 -0.08
LSModer
12.03 -0.03
John Hancock Funds A:
BalA
27.97 -0.14
BondA p
13.23 -0.03
LifeBal
13.17 -0.06
LifeGrw
13.82 -0.08
JPMorgan A Class:
CoreBond
10.04 -0.03
CorePlusBd p
7.07 -0.03
EqInc p
23.73 0.04
GwthAdv p
34.91 -0.62
Inv Bal p
15.69 -0.04
InvCon p
12.32 -0.05
InvG&I p
19.02 -0.08
InvGrwt p
24.57 -0.13
LgCpGwth p
68.13 -1.34
MdCpGrw p
39.00 -1.22
USEquity
23.67 -0.13
ValAdv t
37.87 0.42
JPMorgan I Class:
CoreBond
10.03 -0.04
CorePlusBd
7.07 -0.03
EmMktEq I
30.31 -0.84
EqInc
24.22 0.04
GrAdv r
37.06 -0.66
LgCapVal
20.06 0.05
LgCpGwth
70.08 -1.38
MdCpGrw
48.61 -1.51
MdCpVal
37.45 0.14
MtgBckd
9.94 -0.03
ShtDurBnd
10.67 -0.02
SmCap
55.26 -0.18
USEquity
23.78 -0.13
ValAdv
38.22 0.42
JPMorgan Inst Class:
ValAdv L
38.27 0.42
JPMorgan L Class:
MdCpVal L
38.19 0.14
JPMorgan R Class:
CoreBond
10.05 -0.03
CorePlusBd
7.08 -0.03
HighYld r
6.37 -0.03
MtgBckd
9.93 -0.04
ShtDurBnd
10.67 -0.02
USRechEnhEq 41.31 -0.14
JPMorgPrm:
USEquity L
23.85 -0.13
Laudus Funds:
USLgCpGr nr 24.40 -0.37
6.6
6.9
6.1
14.9
7.2
18.9
5.2
17.5
10.7
13.4
12.9
25.3
18.7
26.9
22.0
32.8
3.1 21.1
3.0 20.3
10.5
10.6
6.4
6.2
6.4
10.7
26.0
27.0
19.6
18.7
19.9
27.4
9.4 20.4
11.1
-1.0
-0.8
9.2
30.3
-8.5
-8.1
-10.0
17.2 19.4
8.2 7.4
4.9 3.8
6.7 6.1
3.4 2.0
7.1 14.3
-1.1 -9.2
4.7 2.6
6.5 4.9
-1.0
-0.8
6.2
13.9
4.8
2.6
6.4
8.5
16.4
4.1
11.9
7.5
-8.3
-7.8
16.0
27.3
6.4
1.1
10.2
14.6
31.2
-0.7
31.4
17.5
-1.0
-0.7
2.7
6.3
14.0
6.9
16.5
4.3
6.2
-0.8
1.3
2.3
12.0
7.6
-7.6
-7.0
-27.9
16.8
28.3
17.4
32.2
0.1
13.1
-6.1
2.4
-1.1
32.4
18.4
7.7 18.9
6.3 13.6
-0.9
-0.5
2.0
-0.8
1.3
12.2
-7.1
-6.8
5.6
-5.7
2.5
35.4
12.1 33.0
15.2 19.6
D ATA P R O V ID E D BY LIP P E R
Net YTD 3-Yr.
NAV Chg. % Ret. % Ret.
Net YTD 3-Yr.
NAV Chg. % Ret. % Ret.
Lazard Instl:
EmgMktEq
18.13 -0.45 5.6 4.0
GlbLstInfr
15.47 0.04 2.1 23.6
IntStrtEq r
16.19 -0.15 4.6 -2.2
Legg Mason I:
IntlGrTrI
64.98 -0.45 6.6 -3.6
Longleaf Partners:
Partners n
22.94 0.20 1.6 -3.1
Loomis Sayles Fds:
LSBondI
11.42 -0.06 0.3 -2.9
Lord Abbett A:
Affiltd p
18.28 -0.03 8.9 18.1
BdDeb p
7.06 -0.01 2.2 -3.6
CalibrDivGr
21.50 -0.04 11.0 26.3
FloatRt p
8.19 -0.01 4.1 17.6
HYMuniBd p
10.72 -0.05 1.6 -7.2
IntrTxFr
10.11 -0.03 -0.5 -4.6
MultiAstBalOppty 11.62 -0.04 7.2 2.7
ShtDurIncmA p 3.84 0.00 1.5 1.8
TaxFr p
10.33 -0.05 -0.5 -6.9
Lord Abbett C:
ShtDurIncmC t 3.86 0.00 1.3 -0.3
Lord Abbett I:
BdDebentr
7.02 -0.01 2.2 -3.1
FloatRt
8.20 0.00 4.2 18.3
HiYld
6.31 -0.01 2.4 0.8
ShtDurInc p
3.84 0.01 1.9 2.4
Northern Funds:
BdIdx n
8.97 NA NA NA
EmMktsEqIdx nr 11.18 NA NA NA
HiYFxInc n
5.91 NA NA NA
IntlEqIdx nr
14.73 NA NA NA
MidCpIdx n
21.52 0.05 7.9 14.3
StkIdx n
54.33 -0.27 11.3 31.2
Nuveen Cl A:
AAMunBd p
10.06 -0.04 NA NA
HiYldMuBd p 14.88 -0.05 NA NA
Nuveen Cl I:
HYMunBd
14.89 -0.05 NA NA
Nuveen Cl R:
IntDMunBd
8.77 -0.03 NA NA
LmtTrmR
10.84 -0.02 NA NA
M
MainStay Fds A:
HiYldBdA
5.14 -0.02
LgCpGrA p
10.10 -0.23
TxFrBdA
9.23 -0.04
Mairs&Power:
MairsPwrGr n 163.06 -1.45
Mass Mutual:
SelBluChipGroClI22.68 -0.31
MassMutual Select:
MCGrEqIII
20.56 -0.41
Metropolitan West:
TotRetBd n
8.86 -0.01
TotRetBdI
8.85 -0.01
TRBdPlan
8.30 -0.01
UnconstrBdI
10.20 0.01
MFS Funds:
IIE
35.04 -0.26
MFS Funds Class A:
AgGrAIA
29.90 -0.21
CoEqyA
49.75 -0.47
185.93 -3.35
GrowthA
IntlVA
40.95 -0.27
MCapA
28.48 -0.85
MCapValA
32.28 0.04
MIGA
42.65 -0.75
MITA
38.34 -0.26
MuHiA
7.26 -0.03
MuInA
8.05 -0.04
ResBdA
9.31 -0.01
RschA
58.22 -0.58
TotRA
19.64 -0.02
UtilA
22.48 0.44
ValueA
50.70 0.27
MFS Funds Class I:
202.94 -3.65
GrowthI
MCapI
30.77 -0.91
MCapValI
33.32 0.05
MIGI
44.51 -0.78
ResBdI
9.30 -0.02
RschI
60.34 -0.60
ValueI
51.08 0.28
Morgan Stanley Inst:
CapGrI
36.66 -1.08
CapGrP p
32.80 -0.97
GloFranI t
34.82 -0.65
MorganStanleyPathway:
CoreFxIcm n
6.68 NA
LgCapEq n
23.98 -0.16
Munder Funds:
MndrIntlSmCpInv r 15.76 0.09
Mutual Series:
BeacnZ
16.60 0.06
GlbDiscA
31.16 0.07
GlbDiscz
32.14 0.08
QuestZ
14.54 0.17
SharesZ
25.99 0.24
2.2 7.0
12.3 29.3
-1.5 -5.6
10.8 25.7
14.2 24.2
3.8
1.9
-2.1 -11.4
-2.0 -10.9
-2.0 -10.7
1.2 0.4
6.4 13.5
7.3
9.5
17.8
9.6
6.5
8.2
8.4
11.7
1.1
-0.7
-1.0
9.1
3.8
8.0
7.7
10.8
24.0
26.7
4.5
3.7
19.6
24.6
23.8
-6.0
-4.9
-7.9
22.8
7.5
15.7
17.4
17.9
6.7
8.4
8.5
-1.0
9.2
7.8
27.6
4.5
20.5
25.5
-7.6
23.7
18.3
-4.6 -43.3
-4.7 -43.8
1.3 10.9
NA NA
9.3 20.1
8.7 -3.8
6.5
5.1
5.2
6.2
6.0
9.2
22.7
23.6
11.1
12.5
N
Natixis Funds:
InvGradeBdY
9.70 -0.01 -0.3 -4.3
LSGrowthY
25.67 -0.35 10.5 31.4
Neuberger Berman Fds:
GenesInst
63.67 -0.47 4.2 6.9
LCVal Inst
44.55 0.21 7.9 7.1
LgShInst
17.78 -0.10 1.9 13.1
StrIncInst
9.68 -0.01 0.7 0.3
Neuberger Berman Inv:
Genes n
63.50 -0.47 4.1 6.4
Guard n
27.18 -0.43 8.9 29.9
LCVal n
44.58 0.22 7.9 6.6
Neuberger Berman Tr:
GenesisFdR6 63.62 -0.47 4.2 7.1
Nicholas Group:
Nich n
92.32 -1.61 6.6 35.2
O
Oakmark Funds Invest:
EqtyInc nr
34.60 -0.02
140.97 -0.31
Oakmark n
OakmrkInt n
27.10 -0.03
Select n
70.11 -1.25
Old Westbury Fds:
AlCpCore n
25.46 -0.26
CreditIncomeFd n 7.92 -0.01
FixInc pn
9.99 0.00
LrgCpStr n
19.26 -0.11
MuniBd pn
11.35 -0.03
Sm&MdCapStrategi n 16.03 -0.05
Optimum Funds Inst:
Fixed Inc
8.08 -0.01
LgCpGrwth
22.94 -0.23
LgCpVal
18.90 0.07
Osterweis Strat Income:
OsterweisStrInc n 11.13 0.00
3.0 8.4
6.3 28.3
1.0 -5.9
-0.4 15.7
10.4
-1.0
-1.1
10.9
-2.0
3.9
23.4
-8.8
-5.6
11.3
-3.7
-10.6
-1.5 -10.0
14.5 17.4
8.1 20.4
3.0 12.0
PQ
Parnassus Fds:
ParnEqFd n
59.28 -0.81
Pear Tree:
ForeignVal I r 24.24 -0.06
Perm Port Funds:
Permanent n 55.82 0.20
PGIM Funds Cl A:
HighYield
4.68 -0.01
JennGrowth
57.94 -1.08
JennUtility
15.02 0.21
TotalReturnBond p 11.75 NA
PGIM Funds Cl Z:
HighYield
4.69 -0.01
JennGrowth 66.44 -1.23
TotalReturnBond 11.71 NA
PIMCO Fds Instl:
AllAsset
11.05 NA
CommodtyRR 13.76 NA
DivInc
9.47 -0.01
HiYld
7.89 -0.01
HiYldMuniBd
8.38 -0.04
IntlBdUSH
9.79 NA
InvGrdCrBd
8.76 NA
LgTrmCrdtBd
8.71 -0.04
LngDurTotRtrn 7.03 -0.04
LowDur
9.14 0.01
LowDurInc r
8.01 NA
ModDur
9.09 0.00
MortgOppBd
9.28 0.00
RealRtnI
9.92 0.02
ShortT
9.65 0.00
ShtAssetInv
9.94 0.00
StcksPLUSIntlHdg r 9.02 NA
StksPLS
12.56 NA
TotRetESG
7.51 -0.01
TotRt
8.42 NA
TrndsMgdFutStrgy 11.01 NA
PIMCO Funds A:
IncomeFd
10.49 0.00
LowDurInc
8.01 NA
TotRetA
8.42 NA
PIMCO Funds C:
IncomeFd
10.49 0.00
PIMCO Funds I2:
ComPLUSStrtgyFd 7.08 -0.10
Income
10.49 0.00
IntlBdUSH
9.79 NA
InvstGrCrBd
8.76 NA
LowDurInc
8.01 NA
ShtTm
9.65 0.00
TotRt
8.42 NA
PIMCO Funds Instl:
ComPLUSStrtgyFd 7.20 -0.10
DynamicBd
9.81 0.00
IncomeFd
10.49 0.00
InflRespMulAsset 8.23 NA
Pioneer Funds A:
CoreEqA
21.96 -0.08
DiscGrA
17.42 -0.20
PioFdA
41.86 -0.31
Pioneer Funds Y:
BondY
8.06 -0.01
StratIncY p p
9.31 -0.01
Price Funds:
2050RetFd n 18.39 -0.08
Balnanced n
26.81 -0.06
174.76 -2.38
BlChip n
7.7 23.8
5.5
0.8
9.0 15.1
1.6 3.0
13.3 22.3
16.5 24.1
NA NA
1.7 3.8
13.4 23.4
NA NA
NA NA
NA NA
1.1 -2.6
1.3 4.7
0.7 -2.4
NA NA
NA NA
-2.7 -17.2
-3.7 -20.2
1.0 0.0
NA NA
0.1 -3.8
1.8 2.5
0.5 -4.2
2.9 8.7
2.6 8.9
NA NA
NA NA
-0.6 -10.5
NA NA
NA NA
1.2
NA
NA
2.0
NA
NA
0.9 -0.3
9.6 51.7
1.3 2.9
NA NA
NA NA
NA NA
2.9 8.4
NA NA
9.6 52.2
2.4 1.3
1.3 3.2
NA NA
5.8 15.0
6.9 24.7
14.9 32.4
-1.1 -8.3
0.1 -4.1
8.8 11.6
6.8 9.6
17.0 18.9
Net YTD 3-Yr.
NAV Chg. % Ret. % Ret.
Communica&Tech n 137.34 -1.18
DivGro n
76.73 -0.24
EqInc n
36.67 0.21
EqIndex n
139.06 -0.69
GlbStk n
64.27 -0.71
GlbTech n
18.46 -0.29
Growth n
97.90 -1.13
HelSci n
92.25 -0.26
InstFLRfd r
9.48 0.00
InstHiYld
7.71 -0.01
LgCapGow I
75.10 -1.00
InstLCCoreGr 70.18 -0.95
LgCpVal
24.43 0.12
InstSmCap
27.06 -0.01
IntDis n
67.28 0.08
IntlStk n
19.91 -0.25
MCapVal n
34.17 0.20
MCEqGr
65.19 -1.19
MidCap n
103.61 -1.87
NAmer n
72.78 -0.73
NHoriz n
54.28 -0.97
OverS SF nr
13.24 -0.01
QMUSSmCpGrEq n 43.89 -0.31
SpectModerGwAllo n 39.64 -0.17
R2010 n
15.15 -0.02
R2015 n
12.55 -0.02
R2020 n
18.61 -0.04
R2025 n
16.51 -0.04
R2030 n
25.37 -0.07
R2035 n
20.62 -0.07
R2040 n
29.84 -0.13
Ret2045 n
21.63 -0.10
Ret2055 n
19.29 -0.08
SciTec n
47.74 -1.27
Sht-Bd n
4.54 0.00
SmCap n
52.86 0.13
SmCapStk n
58.91 -0.02
SpecGr n
25.50 -0.11
SpecInc n
11.16 -0.01
SuMuInt n
11.18 -0.04
TF Incom n
10.88 -0.05
TotIndex n
56.31 -0.31
U.S.EqResch n 52.47 -0.28
USLrgCpCore n 41.16 -0.22
Value n
46.91 0.09
Price Funds - Adv Cl:
Growth p
94.22 -1.09
R2030A p
25.01 -0.08
R2040A p
29.43 -0.12
Price Funds - R Cl:
R2030R p
24.63 -0.08
R2040R p
29.06 -0.12
PRIMECAP Odyssey Fds:
AggGrowth r nr 44.71 -0.45
Growth r nr
38.91 -0.32
Stock r nr
38.58 -0.10
Principal Investors:
CapApprA p
74.76 -0.51
HiYld IN
8.16 -0.05
InfPro IN
7.67 0.03
LgIndxI
25.92 -0.13
LT2020 In
12.40 -0.03
LT2030In
14.05 -0.06
LT2040I
16.15 -0.10
LT2050I
17.13 -0.12
MidCpBldA
39.43 -0.66
PreSecI
9.02 -0.04
PtrLV In
19.38 -0.03
RealEstSecI
26.65 0.56
SAMBalA p
16.17 -0.07
SAMGrA p
19.16 -0.12
StrGrw A p
22.25 -0.16
Putnam Funds Class A:
DynAABalA
16.42 -0.04
DynAAGthA 20.04 -0.09
PutLargCap p 35.03 0.03
GeorgePutBal 24.58 -0.17
GlbHlthCare p 62.36 -0.03
GrOpp p p
62.15 -0.93
StDurInc
10.09 0.01
SustainLdrsFd p 124.63 -1.01
Putnam Funds Class Y:
GrOpp Y
66.72 -1.00
PutLargCap
35.05 0.04
StDurInc
10.10 0.00
14.9 -1.2
8.6 24.9
9.3 20.1
11.2 30.8
12.2 3.0
17.8 -15.2
13.1 9.3
4.9 3.8
4.0 18.7
1.1 5.5
14.2 21.9
17.1 19.5
8.9 18.9
1.6 -3.9
6.8 -16.5
4.2 -3.4
9.5 26.2
3.6 4.1
3.6 4.1
13.8 26.3
-3.5 -20.6
6.2 4.9
7.0 6.8
7.8 6.4
4.1 3.8
4.4 4.5
4.7 4.9
5.1 5.5
6.0 6.7
7.1 8.4
8.0 9.8
8.6 11.1
8.9 11.5
18.8 12.3
1.2 0.9
1.7 -0.9
1.6 -3.8
9.7 15.0
0.6 -2.6
-1.3 -3.2
1.5 -4.0
10.2 25.1
12.7 35.4
15.5 33.8
11.9 19.8
12.9
5.9
7.9
8.4
5.9
8.9
5.8
7.8
5.1
8.2
4.2 1.0
5.9 17.0
10.0 25.1
12.7
2.0
0.1
11.2
3.3
4.2
6.1
7.5
7.4
4.4
7.7
-3.5
5.6
7.3
8.5
35.7
5.6
-4.8
30.8
2.8
4.4
8.2
11.0
16.8
0.5
19.1
-2.0
6.7
10.7
13.7
8.4
10.7
13.8
7.9
8.0
14.0
NA
15.1
13.3
17.9
36.0
16.9
26.7
34.1
NA
24.8
14.1 35.1
14.0 37.0
NA NA
R
Royce Funds:
PAMut I nr
9.72 -0.05
Russell Funds S:
StratBd
9.06 -0.01
TaxExBd
21.72 -0.06
TxMngUSLgCp 77.83 -0.49
Rydex Investor Class:
NasdaqInv n
77.92 -1.14
5.9 15.5
-1.8 -11.7
-0.8 -2.1
10.4 24.7
10.0 33.6
S
Schwab Funds:
1000 Inv nr
113.32 -0.69
CoreEq n
22.32 -0.19
FunIntlLgInst nr 11.26 0.05
FunUSLgInst nr 26.30 0.07
InflProSel n
10.19 0.02
IntI Sel nr
24.30 0.06
S&P Sel n
81.34 -0.41
SmCp Sel nr
33.39 0.02
TSM Sel nr
89.22 -0.50
10.7
11.1
7.2
8.4
0.1
7.7
11.3
2.7
10.2
27.3
27.1
16.5
28.4
-4.3
9.9
31.4
-4.7
24.9
Net YTD 3-Yr.
NAV Chg. % Ret. % Ret.
USSmCoIdx nr 16.85 0.09
SEI Portfolios:
CoreFxIn F
9.32 -0.01
IntlEmg F
11.00 -0.31
IntlEq F
12.51 -0.02
IntMuni F
10.94 -0.04
LgCapGr F
45.03 -0.74
TaxMgdLC F
36.01 -0.23
Selected Funds:
AmShD n
43.55 -0.11
SmeadFds:
SmeadValueInstl82.05 1.16
SSgA Funds:
SP500 n
250.01 -1.25
1.9
8.3
-1.9
2.6
7.8
-0.9
13.8
7.5
-11.2
-19.2
6.2
-3.8
30.6
21.5
13.6 14.8
7.7 38.2
11.2 31.0
T
TCW Funds:
EmMktInc n
6.44 -0.03
TotRetBondI n 7.72 -0.04
Thompson IM:
Bond n
10.27 0.04
Thornburg Fds:
IncBuildA t
25.45 0.00
IntVal I
28.08 0.06
LtdTIncI
12.75 0.01
LtdTMu I
13.38 -0.03
Thrivent Funds A:
LgCpStk
27.97 -0.14
MidCapStk
30.64 -0.06
Thrivent Funds S:
LgCpVal n
30.01 0.04
MidCapStk n
36.31 -0.06
TIAA-CREF/Instl Cl:
CoreBond Inst 8.96 -0.02
CorePlsBd
9.00 -0.01
TIAA-CREF/Retail Cl:
EqIdx
37.78 -0.21
Gro&Inc
25.67 -0.12
LrgCpGro
26.06 -0.48
TIAA/CREF Funds:
BdIdxInst
9.41 0.00
EqIdxInst
37.08 -0.20
Gr&IncInst
15.14 -0.07
IntlEqIdxInst 23.56 0.06
IntlEqIdxRet 24.16 0.07
IntlEqInst
14.25 0.05
LC2040Inst
10.90 -0.07
LCIdx2020Inst 19.20 -0.05
LCIdx2025Inst 21.46 -0.06
LCIdx2035Inst 26.06 -0.10
LCIdx2040Inst 28.20 -0.14
LCIdx2045Inst 29.59 -0.16
LrgCpGrIdxInst 58.60 -0.70
LrgCpGrInst
26.23 -0.49
LrgCpVl IdxInst 24.79 0.05
LrgCpVl IdxRet 25.30 0.05
LrgCpVl Inst
21.79 0.08
QuantSmCpEqInst 18.73 0.06
RealSecInst
16.57 0.38
S&P500IdxInst 57.92 -0.28
S&P500IdxRet 57.44 -0.28
SmCpBl IdxInst 23.32 0.01
SocChEqInst 28.03 -0.19
Tortoise Capital:
TorMLPPipInsCl 15.88 0.20
Touchstone Funds Gro:
MdCpY
53.93 -0.67
Touchstone Strategic:
LagCapFoc A p 63.80 -0.52
Transamerica A:
AsAlModGr p 12.81 -0.07
Trust for Professional Ma:
PrfTrtStrtBd Ins 19.38 -0.06
Tweedy Browne Fds:
GblValue n
29.67 0.15
2.5 -8.5
-1.9 -13.2
5.9
6.2
8.4 24.4
12.3 3.9
1.1 -0.1
-1.0 -1.7
8.3 14.3
6.1 7.7
8.0 25.8
6.2 8.5
-0.7 -7.7
-0.4 -6.8
10.0 24.4
16.5 34.0
10.9 17.6
-1.4
10.1
16.6
7.8
7.7
9.6
7.2
3.6
4.1
5.7
6.7
7.4
13.0
11.0
7.6
7.5
9.1
6.5
-5.2
11.3
11.2
2.7
8.9
-9.1
25.3
35.0
10.1
9.3
6.1
10.6
4.3
5.5
9.3
12.0
13.5
37.0
18.6
17.2
16.3
23.5
10.7
-10.3
31.4
30.4
-4.5
22.4
14.6 68.2
3.5 18.5
7.7 20.3
6.6
5.5
0.0 -5.1
8.4 15.5
U
UM Funds:
BehavVal
83.69 0.92
4.9 21.9
V
VALIC:
IntlEq
8.43 0.03
MidCpIdx
26.46 0.06
SciTech
28.45 -0.79
StckIdx
53.06 -0.27
ValUltra
15.09 -0.22
VANGUARD ADMIRAL:
400MCpIdxInst403.18 0.88
500Adml n
488.05 -2.42
BalAdml n
46.58 -0.16
CAITAdml n
11.18 -0.04
CALTAdml n
11.26 -0.04
CapOpAdml nr 195.89 -1.33
101.54 0.01
CoStIxAd nr
DivAppIdxAdm n 49.06 -0.24
EMAdmr n
35.85 -0.92
EnergyAd nr
65.23 1.32
EnergyAdml nr 94.44 1.98
EqIncAdml n 90.29 0.26
EuropeAdml n 87.36 0.28
108.20 -0.18
ExplrAdml n
ExtndAdml n 128.60 -1.29
7.6
7.7
15.4
11.2
14.9
8.2
13.4
17.0
30.3
24.1
7.8
11.3
5.5
-1.4
-1.4
9.3
8.3
6.6
5.0
12.1
12.3
7.8
8.9
4.8
3.4
14.4
31.4
10.7
-2.2
-3.6
20.7
20.0
23.0
-11.7
101.5
65.7
24.7
11.8
2.3
-3.9
B A R R ON S .C OM / D ATA
Net YTD 3-Yr.
NAV Chg. % Ret. % Ret.
GNMAAdml n
9.03 0.00
GroIncAdml n 101.89 -0.68
GrwthAdml n 180.63 -2.31
131.14 -0.71
HltClxAd nr
HlthCareAdml nr 90.29 -0.37
HYCorAdml nr 5.34 0.00
InfProAd n
23.00 0.07
InfTechIdx n 273.34 -5.88
IntlGrAdml n 110.79 -1.46
ITBondAdml n 10.05 0.00
ITIGradeAdml n 8.47 0.00
ITsryAdml n
9.69 0.01
ITTresIdx n
19.46 -0.04
121.95 -0.75
LarCapAd n
LTGradeAdml n 7.64 -0.03
LTsryAdml n
8.07 -0.06
MidCpAdml n 302.88 -2.45
MuHYAdml n 10.51 -0.05
MuIntAdml n 13.40 -0.05
MuLTAdml n 10.69 -0.05
MuLtdAdml n 10.72 -0.02
MuShtAdml n 15.67 -0.01
NJLTAdml n
11.16 -0.04
NYLTAdml n
10.67 -0.05
PacifAdml n
91.84 -0.05
PALTAdml n
10.61 -0.05
PrmcpAdml nr 172.85 -0.69
RealEstatAdml n 117.96 1.98
S&PSC600Idx 404.80 2.88
SmCapAdml n 106.43 -0.21
SmGthAdml n 88.05 -0.97
STBondAdml n 10.00 0.02
STCorpIx n
20.93 -0.02
STFedAdml n 10.01 0.01
STIGradeAdml n 10.17 0.02
STIPSIxAdm n 24.20 0.07
STsryAdml n
9.74 0.01
STTresIdx n
19.23 -0.03
TotBdAdml n
9.42 0.00
TotIntBdIdxAdm n 19.34 -0.09
TotIntlAdmIdx nr 32.90 -0.18
TotStAdml n 126.73 -0.72
TxMBal nr
42.79 -0.17
TxMCapAdml n 272.25 -1.50
TxMIn nr
16.30 0.03
TxMSC nr
88.97 0.62
USGroAdml n 164.35 -2.97
UtilIxAd nr
79.01 1.33
ValAdml n
62.85 0.10
WdsrllAdml n 82.56 -0.33
WellsIAdml n 61.06 0.05
WelltnAdml n 75.28 -0.34
WndsrAdml n 76.33 0.03
VANGUARD FDS:
CAIT n
11.18 -0.04
CapOp nr
84.87 -0.58
DivdGro n
38.41 -0.17
DivrEq n
47.96 -0.43
Energy nr
50.33 1.05
EqInc n
43.08 0.12
116.33 -0.20
Explr n
FTAlWldInAdml n 37.00 -0.22
GlbCapCyl Inv nr 13.35 -0.06
GlbEq n
35.30 -0.34
GloMinVolFdAdm n 30.25 -0.10
GNMA n
9.03 0.00
GroInc n
62.42 -0.41
214.11 -0.90
HlthCare nr
HYCor nr
5.34 0.00
InflaPro n
11.72 0.04
IntlExplr n
17.49 -0.02
IntlGr n
34.83 -0.46
IntlVal n
42.51 -0.41
ITIGrade n
8.47 0.00
LifeCon n
20.77 -0.05
LifeGro n
44.12 -0.21
LifeInc n
15.15 -0.03
LifeMod n
31.81 -0.11
LTIGrade n
7.64 -0.03
MATxEx n
9.97 -0.05
MidCpGro pn 24.02 -0.68
MuHY n
10.51 -0.05
MuInt n
13.40 -0.05
OHLTte n
11.41 -0.07
166.83 -0.67
Primcp nr
PrmcpCor n
35.17 -0.06
SelValu nr
30.01 0.13
STAR n
28.07 -0.15
STIGrade n
10.17 0.02
StratgcEq n
36.79 0.10
StrSmCpEqInv n 39.51 0.16
TgtRe2020 n 27.62 -0.06
TgtRe2025 n 19.10 -0.06
TgtRe2030 n 37.14 -0.14
TgtRe2035 n 23.33 -0.10
TgtRe2040 n 41.74 -0.19
TgtRe2045 n 28.51 -0.14
TgtRe2050 n 47.76 -0.24
TgtRe2060 n 49.11 -0.24
TgtRet2055 n 53.30 -0.27
TgtRetInc n
13.22 -0.02
USGro n
63.42 -1.15
WellsI n
25.21 0.02
Welltn n
43.59 -0.20
Wndsr n
22.63 0.00
WndsrII n
46.53 -0.19
VANGUARD INDEX FDS:
488.05 -2.43
500
EmgMktInstPl 90.69 -2.32
317.34 -3.18
ExtndIstPl
-2.0 -8.3
12.9 32.8
13.0 32.0
4.9 13.9
5.4 19.0
1.1 5.3
0.0 -4.3
10.6 46.9
8.8 -16.5
-1.5 -9.2
-0.6 -6.4
-1.3 -8.5
-1.5 -8.8
11.0 28.7
-4.1 -18.0
-6.4 -26.8
5.6 9.4
-0.3 -3.2
-1.3 -2.2
-1.4 -3.9
-0.2 1.2
0.6 3.8
-1.6 -3.5
-1.6 -4.1
3.2 -2.3
-1.5 -4.1
10.6 28.1
-4.9 -6.9
1.6 1.6
4.5 4.4
3.8 -7.9
0.3 -1.6
1.0 0.4
0.7 -1.5
1.1 0.5
1.7 5.9
0.5 -1.6
0.6 0.1
-1.6 -8.9
-1.1 -5.7
6.0 1.4
10.1 24.9
4.4 12.2
10.5 28.0
6.5 6.3
1.6 1.8
12.0 7.7
15.8 21.7
8.5 24.2
8.5 24.1
1.9 3.1
6.0 13.9
5.4 24.9
-1.4
9.3
4.4
9.1
12.3
7.7
4.8
6.4
9.1
8.1
7.4
-2.0
12.9
5.3
1.0
0.0
2.7
8.8
5.3
-0.6
2.5
6.5
0.5
4.5
-4.1
-1.5
3.3
-0.3
-1.4
-1.8
10.5
10.8
3.8
4.5
1.0
7.1
5.6
2.8
3.9
4.7
5.5
6.2
6.9
7.5
7.5
7.5
2.0
12.0
1.9
5.9
5.3
8.5
-2.4
20.5
20.7
17.7
65.3
24.4
1.9
2.1
31.7
5.3
17.4
-8.6
32.4
18.8
5.0
-4.6
-14.1
-16.8
3.6
-6.6
0.9
10.1
-3.7
5.5
-18.3
-4.9
-5.1
-3.5
-2.4
-5.6
27.8
26.9
23.1
3.6
0.2
20.8
18.5
2.7
4.5
6.2
8.0
9.8
11.6
12.8
12.8
12.8
1.2
7.4
2.9
13.6
24.5
23.8
11.2 31.0
5.0 -11.5
3.4 -3.9
Net YTD 3-Yr.
NAV Chg. % Ret. % Ret.
FTAIWdInPl 124.22 -0.75
IdxIntl
19.67 -0.10
ITTresIdx Inst 24.16 -0.04
LTTresIdx Inst 24.21 -0.24
MdCpGrAdml n 98.45 -2.16
MdCpVlAdml n 79.66 0.28
SmValAdml n 80.77 0.39
TotBd2
9.30 -0.01
TotIntlInstIdx r 131.57 -0.70
TotItlInstPlId r 131.61 -0.70
TotSt
126.69 -0.72
VANGUARD INSTL FDS:
BalInst
46.59 -0.16
DevMktsIndInst 16.32 0.02
DevMktsInxInst 25.51 0.04
EmMkInst r
27.26 -0.70
ExtndInst
128.59 -1.29
FTAlWldIst r 117.30 -0.70
FTScinst
35.88 -0.30
GrwthInst
180.64 -2.31
InPrSeIn
9.37 0.03
InstIdx
435.24 -2.16
InstPlus
435.24 -2.16
InstTStIdx
90.27 -0.51
InstTStPlus
90.24 -0.51
ITBdInst
10.05 0.00
LaCapInst
501.92 -3.10
MidCpInst
66.91 -0.54
MidCpIstPl
329.99 -2.67
RealEstaInstl 18.26 0.31
Rs1000GrwIdxInst676.84 -8.12
Rs1000Vl IdxInst303.37 0.60
Russ1000IdxInst463.02 -2.66
SmCapInst
106.43 -0.21
SmCapIstPl
307.20 -0.59
SmGthInst
70.51 -0.78
SmValInst
45.15 0.22
STBdIdxInstPl 10.00 0.02
STBDInst
10.00 0.02
STCorpIxInst p 25.62 -0.03
STIGradeInst 10.17 0.02
STIPSIxins
24.22 0.07
STTresIdx
24.16 -0.04
TotBdInst
9.42 0.00
TotBdInst2
9.30 -0.01
TotBdInstPl
9.42 0.00
TotIntBdIdxInst 29.01 -0.15
TotStInst
126.75 -0.72
TtlWrldIxInst p 227.22 -1.23
TxMCaInst r 135.27 -0.74
ValueInst
62.85 0.10
Victory Funds:
EstValA
49.16 0.07
EstValI
49.23 0.08
SmCoOppI
48.81 0.14
Victory Port:
Market Neutral I 8.53 -0.05
SSfnd
48.72 0.15
VsycamoreFnd 49.26 0.08
Victory Portfolios I:
500Indx Reward n 67.18 -0.42
CrnstModAggr n 27.12 -0.07
Gr&Inc n
25.78 -0.06
Grwth n
36.05 -0.48
Inco n
11.29 -0.04
IncStk n
19.80 0.11
IntmTerm n
12.37 -0.04
LgTerm n
11.86 -0.07
Nasdaq100 n 46.44 -0.68
ntTerBd n
9.01 -0.01
S&PIdx n
67.13 -0.41
TarRet2040 n 12.89 -0.04
VicAggFnd n 60.49 -1.17
SustWld n
29.63 -0.20
CorePlus INSTL 9.01 -0.02
Income Fund INST 11.28 -0.05
IntlFd INSTL 28.04 0.10
Short-Term INSTL 8.94 0.00
Virtus Equity Trust:
SmCapSusI
31.83 NA
VirtusFunds:
CeredexMdCpVlEqI 12.65 NA
VirtusFunds Cl I:
MulSStI
4.47 NA
SmCpCorI
53.37 NA
Vivaldi Merger:
Arbitrage Fund 10.92 0.02
Voya Fds:
InmdBdI
8.56 -0.01
6.4
6.0
-1.5
-6.5
4.3
6.6
5.0
-1.6
6.1
6.1
10.1
2.3
1.3
-8.7
-26.7
4.2
14.2
13.8
-9.1
1.5
1.6
24.5
5.5
6.4
6.4
5.0
3.4
6.4
10.4
13.1
0.0
11.3
11.3
10.1
10.1
-1.5
11.0
5.6
5.6
-4.9
13.0
7.6
10.5
4.5
4.5
3.8
5.0
0.3
0.3
1.0
1.1
1.7
0.6
-1.5
-1.6
-1.5
-1.1
10.1
8.6
10.5
8.5
10.8
6.4
6.4
-11.5
-3.9
2.2
27.2
32.0
-4.2
31.4
31.4
25.0
25.1
-9.1
28.8
9.4
9.5
-6.8
37.0
17.1
27.4
4.4
4.4
-7.9
13.8
-1.5
-1.5
0.4
0.6
6.0
0.1
-8.9
-8.9
-8.9
-5.6
25.0
15.4
28.1
24.2
6.3 18.9
6.4 20.1
0.8 8.9
-0.9 7.2
0.8 9.1
6.4 20.2
11.0
5.3
11.1
12.9
0.0
8.4
-0.7
-1.1
10.4
-0.4
10.9
6.8
15.0
11.3
-0.4
0.0
8.3
2.1
30.0
6.0
28.0
25.3
-6.1
26.2
-3.0
-5.7
36.9
-5.8
29.7
11.3
24.2
18.3
-5.6
-6.0
8.9
5.6
NA
NA
NA
NA
NA
NA
NA
NA
2.7 10.9
-0.7 -8.1
WXYZ
Wasatch:
CoreGr n
87.02 -0.34 0.8 1.1
WCM Focus Funds:
WCMFocIntlGrwIns 25.07 -0.25 10.1 -1.5
Weitz Funds:
CorPluInc Inst 9.49 NA NA NA
Western Asset:
CoreBondI
10.37 NA NA NA
CoreBondIS
10.38 NA NA NA
CorePlusBdI
9.13 NA NA NA
CorePlusBdIS
9.13 NA NA NA
ManagedMuniA 14.80 -0.07 -0.6 -3.9
SMAShCrPlCp n 6.01 NA NA NA
SmashSerM n 7.38 NA NA NA
Wm Blair Funds Cl I:
SmMidI r
29.28 0.05 3.5 -2.3
June 3, 2024
BARRON’S
41
MARKET LABORATORY
D ATA
B A R R ON S .C OM / D ATA
DJ Half-Hourly Averages
The Dow Jones Averages
Daily
Industrials
For personal non-commercial use only. Do not edit or alter. Reproductions not permitted.
To reprint or license content, please contact Barron's reprints department at 800-843-0008 or www.djreprints.com
40400
Components
Week's
Change
3M
Amazon.com
American Express
Amgen
Apple
Boeing
Caterpillar
Chevron
Cisco Systems
Coca-Cola
Disney
Dow
Goldman Sachs
Home Depot
Honeywell International
IBM
Intel
Johnson & Johnson
JPMorgan Chase
McDonald's
Merck
Microsoft
Nike Cl B
Procter & Gamble
Salesforce
Travelers
UnitedHealth Group
Verizon Communications
Visa Cl A
Walmart
0.47
-4.31
1.82
0.01
2.27
3.09
-10.38
4.55
0.08
0.93
2.15
-0.13
-4.66
9.77
2.50
-4.04
0.13
-0.30
1.92
0.78
-3.95
-15.03
3.30
-0.79
-37.85
2.37
-12.80
1.41
-2.03
0.38
39600
38800
38000
37200
36400
35600
34800
December
January
February
March
April
May
16450
Alaska Air Group
American Airlines Group
Avis Budget Group
CH Robinson Worldwide
CSX
Delta Air Lines
Expeditors Intl of Wash
FedEx
JB Hunt Transport
Kirby Corp
Landstar System
Matson
Norfolk Southern
Old Dominion Freight Line
Ryder System
Southwest Airlines
Uber Technologies
Union Pacific
United Airlines
United Parcel Service B
Week's
Change
16225
-0.68
-2.34
1.82
-0.35
-0.03
-0.82
2.94
6.37
3.13
1.78
1.95
7.55
-2.06
2.19
-0.13
0.00
0.30
0.77
1.26
0.27
15775
15550
15325
15100
14875
14650
January
February
March
April
May
Utilities
970
AES
American Elec Power
American Water Works
Atmos Energy
Consolidated Edison
Dominion Energy
Duke Energy
Edison International
Exelon
FirstEnergy
NextEra Energy
Public Svc Enterprise
Sempra
Southern
Xcel Energy
…
…
…
…
…
…
…
…
…
…
…
…
…
…
…
…
…
…
…
…
Market Advance/Decline Volumes
28
29
30
31
38985.17
39028.99
38927.28
38924.53
38925.53
38933.48
38922.26
38901.96
38864.44
38827.07
38788.87
38754.88
38771.50
38764.58
38852.86
39198.62
38617.83
39028.99
38706.14
–216.73
38565.38
38716.28
38507.81
38541.73
38498.28
38500.83
38495.50
38520.75
38502.87
38507.65
38500.95
38469.49
38450.67
38504.48
38441.54
38782.07
38195.08
38716.28
38413.67
–411.32
38076.86
38368.35
38082.99
38065.41
38055.10
NA
38088.90
38103.46
38179.29
38177.06
38173.46
38146.95
38145.65
38146.69
38111.48
38433.75
37778.96
38493.60
38000.96
–330.06
38152.67
38140.26
38145.45
38147.10
38159.80
38173.28
38160.94
38183.02
38223.42
38295.24
38334.35
38360.66
38368.09
38377.63
38686.32
38787.72
37861.51
38719.43
38092.27
+574.84
Week's
Change
0.68
1.28
2.54
3.31
0.12
1.13
1.40
2.28
0.86
1.29
3.41
0.72
1.19
2.39
1.73
930
890
850
810
December
January
February
March
April
May
Note: Theoretical highs and lows are shown. A red chart indicates a lower price than the starting period. Green means it's higher than the starting period.
28
29
30
31
... 382,807 140,832 636,795 1,532,221
... 517,244 720,202 255,136 458,223
... 1,774,878 671,773 2,536,821 3,869,803
... 1,908,227 2,856,317 1,223,933 1,546,823
...
13,120
6,654
5,127
23,140
...
4,184
11,163
6,951
8,060
... 3,528,261 2,486,632 4,389,184 3,643,604
... 2,668,182 4,128,513 2,204,768 2,826,909
...
95,191 39,230 154,370 183,593
... 144,446 218,298 70,633 133,917
…
–.23
–1.05
+.80
+.94
…
+1.23
–.91
+2.38
+1.76
…
+.03
–.72
+.57
+.54
Market Advance/Decline Totals
Weekly Comp.
Total Issues
Advances
Declines
Unchanged
New Highs
New Lows
Daily
15027.66
15001.29
15076.21
15011.97
15061.84
15081.80
15052.96
15033.36
15027.14
15032.34
15092.50
15114.46
15103.61
15105.81
15238.30
15264.32
14932.96
15245.58
15001.29
+262.41
Theoretical (t): High 15264.32 Low 14685.17
Actual (a): High 15245.58 Low 14761.18
914.41
913.94
915.23
914.53
915.65
NA
915.56
915.39
916.89
918.17
919.55
919.95
919.56
921.17
922.82
923.91
911.05
923.00
912.50
+11.79
925.55
924.80
932.06
927.54
933.83
935.98
936.17
936.18
933.84
936.88
937.52
939.90
940.40
939.50
946.42
948.42
923.42
947.42
924.58
+23.60
Dow Jones 65 Composite (divisor: 0.75472580699091)
Open (t)
… 12409.12 12248.59 12152.59
Open (a)
… 12419.48 12302.97 12207.47
10:00
… 12398.76 12238.85 12157.90
10:30
… 12386.14 12249.09 12160.96
11:00
… 12383.25 12236.53 12165.84
11:30
… 12390.31 12238.20
NA
12:00
… 12385.34 12239.82 12181.28
12:30
… 12379.92 12240.96 12192.44
1:00
… 12367.25 12239.21 12213.42
1:30
… 12355.77 12235.76 12212.66
2:00
… 12343.51 12233.87 12214.15
2:30
… 12330.30 12222.98 12203.96
3:00
… 12338.84 12217.98 12205.95
3:30
… 12335.42 12231.16 12207.76
Close
… 12357.32 12214.24 12206.04
High (t)
… 12481.28 12323.26 12285.17
Low (t)
… 12284.67 12139.14 12077.05
High (a)
… 12422.37 12302.97 12227.95
Low (a)
… 12316.33 12210.85 12142.52
Change
…
–69.01 –143.08
–8.20
12229.24
12220.16
12242.18
12243.02
12252.30
12255.42
12251.45
12251.01
12260.94
12285.22
12301.28
12307.05
12310.82
12310.97
12412.96
12441.88
12147.82
12422.29
12216.56
+206.92
Theoretical (t): High 948.42 Low 907.42
Actual (a): High 947.42 Low 909.15
Theoretical (t): High 12481.28 Low 12077.05
Actual (a): High 12422.37 Low 12142.52
May 27
NY Up
NY Off
NY Up - Comp.
NY Off - Comp.
NYSE Amer UP
NYSE Amer Off
NASD Up
NASD Off
NYSE Arca UP
NYSE Arca Off
% (QCHA)
% (QACH)
% (QCHAQ)
NYSE
NYSE
Amer
Nasdaq
NYSE
Arca
2,931
1,529
1,339
63
227
118
335
134
195
6
22
15
4,647
2,051
2,495
101
247
299
2,139
888
1,204
47
140
37
NYSE Composite Daily Breadth
Dow Jones 20 Transport (divisor: 0.15395808703479)
Open (t)
… 15087.94 14804.03 14813.58
Open (a)
… 15090.86 14903.02 14798.09
10:00
… 15043.60 14809.39 14786.07
10:30
… 15062.34 14840.86 14847.11
11:00
… 15029.99 14835.79 14890.44
11:30
… 15018.10 14827.53
NA
12:00
… 15041.96 14841.22 14951.34
12:30
… 15020.50 14835.37 14958.69
1:00
… 15004.97 14830.89 14970.31
1:30
… 15007.98 14827.24 14981.41
2:00
… 14997.22 14802.72 14984.36
2:30
… 14988.37 14802.32 14966.25
3:00
… 14964.88 14801.99 14951.54
3:30
… 14975.16 14799.89 14948.45
Close
… 14995.12 14781.56 14975.89
High (t)
… 15162.57 14933.61 15036.72
Low (t)
… 14891.36 14685.17 14763.91
High (a)
… 15090.86 14903.02 14988.50
Low (a)
… 14944.45 14761.18 14778.89
Change
…
–87.82 –213.56 +194.33
Dow Jones 15 Utilities (divisor: 1.19780346554510)
Open (t)
…
925.35
914.05
Open (a)
…
925.98
916.41
10:00
…
930.54
914.25
10:30
…
928.41
912.30
11:00
…
925.62
913.47
11:30
…
925.55
910.24
12:00
…
926.17
910.09
12:30
…
926.05
909.69
1:00
…
926.52
911.33
1:30
…
925.67
909.83
2:00
…
922.92
910.35
2:30
…
922.90
909.74
3:00
…
921.44
910.60
3:30
…
922.03
910.67
Close
…
921.46
911.03
High (t)
…
934.11
916.90
Low (t)
…
918.89
907.42
High (a)
…
932.89
916.41
Low (a)
…
920.55
909.15
Change
…
–4.65
–10.43
Daily
Week ended last Friday compared to previous Friday
16000
December
Components
Open (t)
Open (a)
10:00
10:30
11:00
11:30
12:00
12:30
1:00
1:30
2:00
2:30
3:00
3:30
Close
High (t)
Low (t)
High (a)
Low (a)
Change
May 27
Theoretical (t): High 39198.62 Low 37778.96
Actual (a): High 39028.99 Low 38000.96
Transportation
Components
Trading Diary
Dow Jones 30 Industrial (divisor: 0.15221633137872)
May 27
Issues Traded
Advances
Declines
Unchanged
New Highs
New Lows
Blocks - primary
Total (000) - primary
Total (000)
28
29
30
31
...
2,892
2,895
2,878
2,882
...
988
461
2,130
2,208
...
1,833
2,380
658
624
...
71
54
90
50
...
126
37
71
118
...
53
86
46
38
...
4,402
4,085
4,206
5,169
... 914,850 867,201 904,683 1,996,416
... 3,751,547 3,552,756 3,818,753 5,437,164
NYSE American Composite
Daily
Issues Traded
Advances
Declines
Unchanged
New Highs
New Lows
Blocks - primary
Total (000) - primary
Total (000)
May 27
28
29
30
31
...
309
314
308
320
...
144
97
160
159
...
144
210
128
148
...
21
7
20
13
...
14
6
5
12
...
10
4
3
4
...
178
217
161
219
... 17,925 17,899 12,726 31,764
... 303,054 432,930 244,564 381,342
Nasdaq
Daily
Issues Traded
Advances
Declines
Unchanged
New Highs
New Lows
Blocks - primary
Total (000)
May 27
28
29
30
31
...
4,378
4,357
4,355
4,361
...
1,810
1,113
2,462
2,484
...
2,420
3,100
1,733
1,725
...
148
144
160
152
...
135
63
71
82
...
117
159
99
98
... 59,283 66,172 69,127 49,274
... 6,293,384 6,652,484 6,659,298 6,674,092
NYSE Arca Composite
Daily
Issues Traded
Advances
Declines
Unchanged
New Highs
New Lows
Blocks - primary
Total (000) - primary
Total (000)
May 27
28
29
30
31
...
1,950
1,922
1,912
1,935
...
721
176
1,227
1,467
...
1,196
1,731
671
458
...
33
15
14
10
...
103
15
8
30
...
15
16
7
10
...
1,155
1,143
1,067
1,491
... 247,426 258,459 226,593 318,230
... 1,148,143 1,268,962 1,139,203 1,476,841
Other Market Indexes
Daily
NYSE Amer Comp
AmMajorMkt
BNY ADR Idx
Europe
Latin Am
Asia
Emerg M
DJ US TSM Float
Nasdaq Cmp
100 Index
Indus.
Insur.
Banks
Computer
Telecom
NYSE Comp.-z
Financial-z
Health Care-z
Energy-z
Russell 1000
2000
3000
Value-v
Growth-v
MidCap
S&P 100 Index
500
Ind.
MidCap
SmallCap
Value Line(A)
Value Line(G)
DJ US Small TSM
5/27
5/28
... 4978.81
... 3619.67
... 184.08
... 178.92
... 206.72
... 216.39
... 351.44
... 52638.27
... 17019.88
... 18869.44
... 9786.87
... 14099.61
... 3675.05
... 15908.00
... 381.58
... 18007.01
... 10520.21
... 25761.49
... 14345.50
... 2898.45
... 2066.85
... 3025.04
... 1723.34
... 3497.50
... 3264.94
... 2543.27
... 5306.04
... 7682.29
... 2957.40
... 1315.82
... 10281.59
... 594.33
... 14210.97
5/30
5/31
4898.26 4948.91
3583.75 3588.18
181.19
181.91
176.48
177.28
204.05 206.00
212.27
212.77
344.49 345.17
52223.25 51973.93
16920.58 16737.08
18736.75 18538.66
9722.64 9735.91
13984.29 14092.09
3606.18 3657.30
15839.83 15517.23
380.77 385.18
17794.89 17852.36
10399.04 10506.46
25573.76 25594.12
14117.59 14159.99
2876.28 2861.12
2036.19 2056.60
3000.81 2987.28
1703.76 1713.25
3480.98 3433.11
3225.69 3241.19
2529.54 2505.29
5266.95 5235.48
7628.91 7558.40
2919.56 2949.54
1299.77 1315.53
10150.19 10231.73
586.62
591.11
14025.57 14146.56
5/29
4975.53
3632.78
183.18
179.65
204.45
212.76
341.77
52354.32
16735.02
18536.65
9730.84
14182.03
3692.53
15490.14
392.92
18083.69
10647.37
25982.73
14471.13
2882.75
2070.13
3009.72
1737.96
3440.26
3268.40
2521.65
5277.51
7606.69
2982.86
1329.65
10348.53
597.69
14266.08
(A)-Arithmetic Index. (G)-Geometric Index.
(v)-Value 1000 and Growth 1000. (y)-Dec. 31,1965=50. (z)-Dec. 31,2002=5000.
42
BARRON’S
MARKET LABORATORY
D ATA
B A R R ON S .C OM / D ATA
The Week In Stocks For the Major Indexes
12-Month
High
Low
Weekly
Dow Jones Indexes
40003.59 32417.59
30 Indus
16695.32 13556.07
20 Transp
955.01
783.08
15 Utilities
12740.24 10596.53
65 Comp
Dow Jones Indexes
52892.35 40847.04
US TSM Float
1297.45
1001.58
US Market
949.22
674.40
Internet
New York Stock Exchange
18388.26 14675.78
Comp-z
10808.87 8154.87
Financial-z
26551.78 22022.96
Health Care-z
14932.83 12035.52
Energy-z
NYSE American Stock Exchange
5076.22
3996.51
NYSE Amer Comp
3693.18
2958.35
Major Mkt
Standard & Poor's Indexes
2543.27
1939.19
100 Index
5321.41
4117.37
500 Index
7682.29
5928.50
Indus
3046.36
2326.82
MidCap
1345.71
1068.80
SmallCap
Nasdaq Stock Market
17019.88 12595.61
Comp
18869.44 14109.57
100 Index
9936.81
7981.76
Indus
14491.11
11196.82
Insur
3842.86
2840.88
Banks
15908.00 10836.80
Computer
427.98
377.20
Telecom
Russell Indexes
2912.18
2250.71
1000
2124.55
1636.94
2000
3040.97
2351.42
3000
1765.86
1415.59
Value-v
3497.50
2585.72
Growth-v
3366.31
2594.10
MidCap
Others
10551.11
8310.43
Value Line-a
615.81
498.09
Value Line-g
14640.66 11320.09
DJ US Small TSM
1106.47
831.60
Barron's Future Focus
1166.53
907.97
Barron's 400
Friday
Change From
12/29
% Chg.
High
Low
Close
Chg.
38852.86
15238.30
946.42
12412.96
38111.48
14781.56
911.03
12206.04
38686.32
15238.30
946.42
12412.96
–383.27
155.36
20.31
–13.37
–0.98
1.03
2.19
–0.11
4923.56
1087.82
46.38
1280.03
14.58
7.69
5.15
11.50
996.78
–660.55
64.75
162.99
2.64
–4.15
7.34
1.33
52638.27
1291.83
916.81
51973.93
1274.91
885.17
52354.32
1284.23
885.17
–304.29
–8.06
–35.47
–0.58
–0.62
–3.85
9621.02
240.17
157.61
22.51
23.00
21.66
4566.85
116.51
33.68
9.56
9.98
3.96
18083.69
10647.37
25982.73
14471.13
17794.89
10399.04
25573.76
14117.59
18083.69
10647.37
25982.73
14471.13
–26.90
44.62
–58.23
299.31
–0.15
0.42
–0.22
2.11
2738.50
2010.77
3133.78
2273.43
17.85
23.28
13.72
18.64
1230.80
765.60
1815.59
1211.58
7.30
7.75
7.51
9.14
4978.81
3632.78
4898.26
3583.75
4975.53
3632.78
77.39
-4.53
1.58
–0.12
937.98
504.53
23.23
16.13
381.21
244.69
8.30
7.22
2543.27
5306.04
7682.29
2982.86
1329.65
2505.29
5235.48
7558.40
2919.56
1299.77
2521.65
5277.51
7606.69
2982.86
1329.65
–11.48
–27.21
–56.83
6.19
9.06
–0.45
–0.51
–0.74
0.21
0.69
520.19
995.14
1475.69
477.31
147.94
25.99
23.24
24.07
19.05
12.52
285.46
507.68
777.73
201.32
11.39
12.77
10.64
11.39
7.24
0.86
17019.88
18869.44
9786.87
14182.03
3692.53
15908.00
392.92
16735.02
18536.65
9722.64
13984.29
3606.18
15490.14
380.77
16735.02
18536.65
9730.84
14182.03
3692.53
15490.14
392.92
–185.78
–271.70
–89.40
–83.31
–7.96
–216.65
12.09
–1.10
–1.44
–0.91
–0.58
–0.22
–1.38
3.18
3494.25
3990.01
1072.26
2904.85
645.72
4294.57
12.78
26.39
27.43
12.38
25.76
21.19
38.36
3.36
1723.66
1710.72
257.13
1579.52
–82.58
2493.91
–24.18
11.48
10.17
2.71
12.53
–2.19
19.19
–5.80
2898.45
2070.13
3025.04
1737.96
3497.50
3268.40
2861.12
2036.19
2987.28
1703.76
3433.11
3225.69
2882.75
2070.13
3009.72
1737.96
3440.26
3268.40
–17.12
0.46
–16.93
2.98
–41.69
–23.14
–0.59
0.02
–0.56
0.17
–1.20
–0.70
538.46
239.22
551.29
237.61
780.97
482.10
22.97
13.07
22.42
15.84
29.37
17.30
260.61
43.05
261.51
108.54
388.59
156.53
9.94
2.12
9.52
6.66
12.73
5.03
10348.53
597.69
14266.08
1075.90
1148.19
10150.19
586.62
14025.57
1067.30
1134.95
10348.53
597.69
14266.08
1074.64
1147.83
26.75
0.90
12.83
–7.32
–4.97
0.26
0.15
0.09
–0.68
–0.43
1368.33
47.74
1732.87
175.11
211.83
15.24
8.68
13.83
19.47
22.63
330.36
3.83
213.61
46.28
75.44
3.30
0.64
1.52
4.50
7.03
High/Low's are based upon the daily closing index. a-Arithmetic Index. G-Geometric Index. V-Value 1000 and Growth 1000 y-Dec. 31,1965=50 z-Dec. 31,2002=5000
U.S. Dollar Index vs Euro and Yen
DXY (104.63)
DJ latest 52-week earnings and dividends adjusted by Dow Divisors
at Friday's close. S&P Dec. 4-quarter's GAAP earnings as reported
and indicated dividends based on Friday close.S&P 500 P/E ratios
based on GAAP earnings as reported. For additional earnings
series, please refer to www.spglobal.com. DJ latest available book
values for FY 2022 and 2021, and S&P latest for 2023 and 2022. rRevised data
DJ Ind Avg
P/E Ratio
Earns Yield %
Earns $
Divs Yield %
Divs $
Mkt to Book
Book Value $
DJ Trans Avg
P/E Ratio
Earns Yield %
Earns $
Divs Yield %
Divs $
Mkt to Book
Book Value $
DJ Utility Avg
P/E Ratio
Earns Yield %
Earns $
Divs Yield %
Divs $
Mkt to Book
Book Value $
S&P 500 Index
P/E Ratio
Earns Yield %
Earns $
Divs Yield %
Divs $
Mkt to Book
Book Value $
S&P Ind Index
P/E Ratio
Earns Yield %
Earns $
Divs Yield %
Divs $
Mkt to Book
Book Value $
5
Am Exp
Amgen
Apple
Boeing
Caterpillar
Chevron Corp
Cisco Sys
Coca Cola
Disney Walt
Dow
Goldman Sachs
Home Depot
Honeywell
IBM
Intel
0
-5
s
-10
YEN in $
-15
J
A
S
O
N
D
J
F
M
A
Prev. Week
Last Year
38686.32
26.62
3.76
1453.46
1.87
725.19
5.05
7664.40
15238.30
17.03
5.87
894.79
1.51
230.78
4.34
3514.52
946.42
20.86
4.79
45.37
3.35
31.71
2.10
450.45
5277.51
27.42
3.65
192.44
1.41
74.41
4.77
1106.21
7606.69
30.85
3.24
246.55
1.25
95.08
6.36
1195.42
39069.59
27.05
3.70
1444.52
1.86
728.48
5.10
7664.40
15082.94
16.86
5.93
894.79
1.53
230.78
4.29
3514.52
926.11
20.41
4.90
45.37
3.42
31.71
2.06
450.45
5304.72
27.57
3.63
192.44
1.40
74.27
4.80
1106.21
7663.52
31.08
3.22
246.55
1.24
95.03
6.41
1195.42
33762.76
22.01
4.54
1533.93
2.10
710.27
4.54
7439.45
14150.48
11.49
8.70
1231.22
1.44
203.32
4.40
3214.72
900.04
21.81
4.59
41.27
3.35
30.12
2.07
435.47
4282.37
24.79
4.03
172.75
1.63
69.80
4.18
1024.56
6131.00
26.41
3.79
232.18
1.45
88.90
5.59
1095.83
M
Source: Tullett Prebon
12.14
7.00
6.43
(3.55)
22.15
10.87
2.97
2.50
0.92
1.68
25.61
14.91
8.63
8.86
0.96
Book
Divs. Value
2.50 33.26
8.76 6.86
0.97 3.18
Nil (26.58)
5.20 30.73
6.28 83.17
1.57 9.68
1.87 5.57
Nil 52.09
2.80 29.39
11.00 317.90
8.68 1.54
4.27 24.99
6.65 24.22
0.50 24.52
Earns
Book
Divs. Value
Johnson&Johnson 8.39
4.81 29.39
JPMorganChase 16.56 4.25 90.29
McDonalds 11.78
6.38 (8.06)
Merck Co
0.90 3.00 18.12
Microsoft 11.55
2.93 27.75
Nike Inc
3.40
1.42 9.14
Proc Gam
6.12 3.8286 19.46
3M Co
(12.72)
5.21 26.80
Salesforce.com 5.56 0.40 57.84
Travelers Cos 13.46 4.00 92.89
UnitedHealthGrp 23.84
7.52 83.27
Verizon
2.68 2.6475 21.70
Visa
8.95
2.01 16.08
Amazon
0.42
Nil 14.26
Wal-mart
5.75 0.795 28.48
Transportation Stocks
Distributions
& Offerings
Secondary Distributions of common stocks
144 Filings
Bruker
6,000,000
$68.00 $408,000,000
CCC Intelligent Solutions 50,000,000
$11.50 $575,000,000
Celcuity
3,871,000
$15.50
$60,000,500
Corebridge Financial
30,000,000
$29.20 $876,000,000
FTAI Aviation Ltd
2,090,561
$82.00
$171,426,002
Gold Royalty
17,442,000
$1.72
$30,000,240
Hess Midstream LP
10,000,000
$34.30 $343,000,000
Insmed
14,514,562
$51.50 $747,499,943
Mcewen Mining
1,533,000
$21.23
$22,033,297
Merus NV
8,682,500
$53.00 $460,172,500
Source: Dealogic LLC, New York City; (212) 577-4400.
Coming U.S. Auctions
Yields (%)
When Issued*
Last Auction
Monday
$70.0 bil
$70.0 bil
* As of Friday afternoon.
3-month
6-month
5.381
5.348
5.255
5.170
SEC Form 144 must be filed by holders of restricted securities (also called letter stock) who intend to
sell shares. Shares Indicated: the number to be sold. Sales Date: the approximate date of the sale.
(Sometimes shares aren't sold, even though their owner has filed a Form144.) Source: Thomson
Reuters
Shares
Indicated
$ Value
Sale
Date
Seller
Title
Company
Sym
Maravai Lifesciences
MRVI 1,531,028 16,504,482 5/28/24
Herde, Kevin
Ccc Intelligent Solutions
CCCS 1,000,000 11,778,594 5/22/24
Ramamurthy, Githesh OD
NYSE 15 Most Active
Average Price
% Tot Vol
Stock Offerings $(z,v)
Last Week
Prev. Week
Year Ago
YOY % Chg
4,683,149
1,591,645
617,014
275,141
2,483,800
80,314
26,279,258
4,134,395
1,445,138
430,467
235,399
2,111,004
80,330
33,972,616
4,232,965
1,524,113
418,320
237,413
2,179,846
41,780
19,786,321
10.64
4.43
47.50
15.89
13.94
92.23
32.82
39.02
14.96
2,297,100
18.19
17.73
r4,839,800
17.31
16.09
1,706,310
125.42
-7.02
34.62
5/27
5/28
5/29
5/30
5/31
NYSE(a)
30 Inds (b)
20 Trans (b)
15 Utils (b)
65 Stks (b)
NYSE Amer(a)
Nasd(d)
...
...
...
...
...
...
....
914,850
306,719.1
91,029.1
53,954.7
451,703.0
17,925
6,293,384
867,201
294,723.3
239,165.1
47,237.5
581,125.9
17,899
6,652,484
904,683
365,274.4
119,090.6
64,243.6
548,608.7
12,726
6,659,298
1,996,416
624,927.9
167,729.2
109,705.4
902,362.5
31,764
6,674,092
NYSE 15 Most Active
Avg. Price
% Tot Vol
....
....
13.51
16.98
26.25
14.88
41.26
18.03
32.48
14.95
Daily Stock Volume
Numbers in thousands save price and percentages. (a) Primary volume. (b) Composite volume. (d) as of 4:10 pm.
(r) Revised. (v) W/E Thursday. (z) Source: LSEG.
NYSE Half Hour Volume
Daily
5/27
5/28
5/29
5/30
5/31
9:30-10:00
...
100,889
92,652
85,479
81,534
10:00-10:30
...
34,262
35,090
35,188
40,078
10:30-11:00
...
29,358
30,713
29,264
36,117
11:00-11:30
...
27,907
26,683
28,653
33,029
11:30-12:00
...
27,159
24,491
27,959
27,498
12:00-12:30
...
24,754
21,417
25,035
25,875
12:30-1:00
...
22,971
20,420
23,558
22,171
1:00-1:30
...
24,117
20,889
24,462
25,474
1:30-2:00
...
25,319
20,504
25,102
25,135
2:00-2:30
...
25,786
22,646
25,171
26,651
2:30-3:00
...
26,983
25,781
25,603
27,867
3:00-3:30
...
32,123
31,427
36,775
36,573
3:30-4:00
...
513,223
494,486
512,433
1,588,413
Selected IPOs
Kindly MD
Ticker
Initial Offer Price
IPO Date
Recent Price
KDLY
5.50
5/31
3.02
AlaskaAirGroup 1.87
AmericanAirlines 0.60
AvisBudgetGrp 31.68
C.H. Robinson 2.53
CSX Corp
1.82
Delta Air Lines 7.78
Expeditors Int'l 4.72
FedEx
17.34
Hunt (JB)
6.30
UberTechnologies (1.73)
Aspen Aerogels
ASPN
691,124 20,505,649 5/28/24
Young, Donald
OD
GM
326,316 14,108,505 5/28/24
Barra, Mary
OD
General Motors
GM
300,000 13,110,000 5/28/24
Barra, Mary
OD
Nil 29.92
Nil (8.91)
Nil (18.03)
2.44 11.64
0.46 6.11
0.40 10.26
1.38 20.15
5.04 103.86
1.70 35.34
Nil 3.66
Kirby Corp 4.23
Landstar Sys 6.50
Matson Inc 8.48
Norf Southern 6.21
Old Dominion 5.68
Ryder Sys
7.65
Southwest Air 0.63
Un Pacific 10.48
UPS
6.90
United Airlines 8.09
Nil 50.79
1.32 24.70
1.28 63.28
5.40 55.83
1.72 33.14
2.84 63.45
0.72 17.99
5.20 19.86
6.50 23.04
Nil 21.09
Mach Natural Resources Lp
MNR
300,000 6,069,000 5/23/24
Reineke, Daniel
AF
Insmed
INSM
241,288 12,064,400 5/28/24
Bonstein, Sara
O
Bentley Systems
BSY
215,000 11,261,700 5/29/24
Bentley, Keith
UT
Mach Natural Resources Lp
MNR
198,299 4,046,000 5/28/24
Reineke, Daniel
AF
General Motors
GM
150,000
Reuss, Mark
O
Utility Stocks
AES Corp.
AmericanElecPower
AmericanWaterWorks
Atmos Energy
Con Ed
DominionEnergy
Duke Energy
Edison Int'l
0.72
5.39
4.93
6.67
5.22
1.94
3.98
2.28
Investor Sentiment Readings
High bullish readings in the Consensus stock index or in the Market
Vane stock index usually are signs of Market tops; low ones, market
bottoms.
Last Week
0.68 2.39
3.47 46.50
2.89 42.30
3.16 66.85
3.28 58.27
2.67 31.26
4.10 61.51
3.04 35.70
Exelon
FirstEnergy
NextEra Energy
Xcel Energy
Pub Sv Ent
Sempra Energy
Southern Co.
2.32
1.89
3.67
3.33
3.61
4.52
3.88
1.48 24.89
1.64 17.77
1.92 19.74
2.11 30.34
2.31 27.62
2.41 83.43
2.82 27.67
2 Weeks Ago
3 Weeks Ago
65%
64%
%Chg
-45.1%
Consensus Bullish Sentiment
66%
AAII Index
Bullish
39.0%
47.0%
Bearish
26.7
26.3
23.3
Neutral
34.2
26.6
35.9
40.9%
69%
69%
68%
44.3%
43.0%
47.6%
Market Vane
TIM Group Market Sentiment
Indicator
Sources: Consensus Inc.; American Association of
Individual Investors; Market Vane; TIM Group
Arms Index
The Arms index, also known as the short term trading index,
is a number derived by dividing one quotient into another
quotient. The numerator in the index is the number of
advancing stocks divided by the number of declining stocks.
As of 3/14/11, the denominator in the index is now the
composite volume of advancing stocks divided by the
composite volume of declining stocks.
Daily
NYSE
NYSE American
Nasdaq
New Listings
NYSE
First Bancshares (FBMS)
NYSE American
None
Consensus Index
Bullish Consensus
B
General Motors
6,516,220 5/28/24
NYSE(a)
30 Dow Inds (b)
20 Dow Trans (b)
15 Dow Utils (b)
65 Dow Stks (b)
NYSE American (a)
Nasdaq(d)
This is a list of the Dow Jones trailing 52-week diluted share
earnings, dividends and book values as reported by the company.
Bolded numbers indicate new values. Sources Barron's Stats and
FactSet.
Industrial Stocks
Earns
s
EURO in $
Last Week
Per Share Values of Stocks
In the Dow Jones Averages
On the Level: Inflation plateaued in April. That, and a bump in unemployment applications, nourished hope
that the Fed will relax its hawkish vigilance and lower rates. Measuring the dollar against six currencies,
the ICE U.S. Dollar Index edged down 0.9% on the week. May was its first monthly decline this year.
10
J
Stock Volume
Indexes’ P/Es & Yields
12-Month
Chg.
% Chg.
Weekly
% Chg.
s
For personal non-commercial use only. Do not edit or alter. Reproductions not permitted.
To reprint or license content, please contact Barron's reprints department at 800-843-0008 or www.djreprints.com
June 3, 2024
5/27
5/28
5/29
5/30
5/31
...
...
...
.58
.31
.57
.82
.35
.60
1.56
1.69
.71
1.41
.46
1.12
Nasdaq
Inhibrx Biosciences (INBX)
Kindly MD (KDLY)
SmartKem (SMTK)
Trading
Suspended
NYSE
Enerplus (ERF)
NYSE American
None
Nasdaq
Applied UV (AUVI)
Finch Therapeutics (FNCH)
First Bancshares (FBMS)
Inhibrx (INBX)
Marpai (MRAI)
Name
Changes
NYSE
None
NYSE American
None
Nasdaq
LakeShore Biopharma (LSB),
formerly YS Biopharma (YS)
XChange TEC (XHG), formerly
FLJ Group (FLJ)
June 3, 2024
D ATA
BARRON’S
43
MARKET LABORATORY
B A R R ON S .C OM / D ATA
Dow Jones U.S. Total Market Industry Groups
Net Change
Top 20 Weekly Ranked
IG-Sym
Aluminum
Footwear
Mobile Telecom
Apparel Retailers
Furnishings
Nonferrous Metals
Industrial & Office REITs
Semiconductor
Publishing
Home Improvement Rtlrs
Technology Hardware & Equip
Fixed Line Telecom
Clothing & Accessories
Computer Hardware
Personal Goods
Brdcst & Entertainment
Specialty Retailers
Marine Transportation
Specialty REITs
Home Construction
DJUSAL
DJUSFT
DJUSWC
DJUSRA
DJUSFH
DJUSNF
DJUSIO
DJUSSC
DJUSPB
DJUSHI
DJUSTQ
DJUSFC
DJUSCF
DJUSCR
DJUSPG
DJUSBC
DJUSRS
DJUSMT
DJUSSR
DJUSHB
Close
152.16
2113.77
349.38
1464.66
332.77
699.74
97.66
17571.14
741.84
732.89
6640.81
104.89
270.15
9784.46
636.59
1081.46
2962.34
403.95
233.15
2496.70
Wkly
% Change and Ranking
YTD
+ 9.91
+ 53.45
+ 6.66
+ 25.45
+ 5.66
+ 10.43
+ 1.41
+ 179.50
+ 7.33
+ 6.30
+ 56.44
+ .88
+ 2.13
+ 76.03
+ 4.53
+ 6.55
+ 17.17
+ 2.20
+ 1.15
+ 11.77
36.01
–38.72
22.32
113.84
–26.33
130.29
–19.29
6,188.38
47.92
–24.13
1,463.75
5.02
–91.71
202.43
–77.00
–62.26
438.29
146.34
–15.69
116.98
For personal non-commercial use only. Do not edit or alter. Reproductions not permitted.
To reprint or license content, please contact Barron's reprints department at 800-843-0008 or www.djreprints.com
Top 20 Yr Ago Ranked
IG-Sym
Semiconductor
Marine Transportation
Nonferrous Metals
Home Construction
Travel & Tourism
Technology Hardware & Equip
Broadline Retailers
Internet
Bldg Materials & Fixtures
Publishing
Construction & Materials
Industrial Metals & Mining
Full Line Insurance
Property & Casualty
Electrical Comps & Equip
Heavy Construction
Banks
Apparel Retailers
Mortgage Finance
Commercial Vehicles
DJUSSC
DJUSMT
DJUSNF
DJUSHB
DJUSTT
DJUSTQ
DJUSRB
DJUSNS
DJUSBD
DJUSPB
DJUSCN
DJUSIM
DJUSIF
DJUSIP
DJUSEC
DJUSHV
DJUSBK
DJUSRA
DJUSMF
DJUSHR
Close
17571.14
403.95
699.74
2496.70
1003.09
6640.81
3787.20
4273.10
2097.33
741.84
1682.05
571.04
75.21
1669.64
703.68
1392.07
545.42
1464.66
10.39
4389.40
Wkly
Rank
Yr Ago
Rank
YTD
Rank
3 Yr
High
Low
+6.96
+2.59
+1.94
+1.77
+1.73
+1.51
+1.46
+1.03
+1.00
+.87
+.86
+.85
+.79
+.78
+.72
+.61
+.58
+.55
+.50
+.47
[1]
[2]
[3]
[4]
[5]
[6]
[7]
[8]
[9]
[10]
[11]
[12]
[13]
[14]
[15]
[16]
[17]
[18]
[19]
[20]
+35.79
+2.81
+19.23
+36.78
+5.22
+52.82
–6.94
+88.46
+43.35
+12.38
+47.74
+14.33
+.21
+11.62
–5.06
+1.89
+27.77
+66.70
+5.39
+49.55
[22]
[111]
[59]
[18]
[104]
[3]
[126]
[1]
[10]
[78]
[6]
[75]
[116]
[80]
[123]
[113]
[41]
[2]
[103]
[4]
+31.00
–1.80
+6.82
+8.43
–7.33
+22.88
–16.49
+54.37
+6.91
–3.19
+28.27
+5.03
–25.34
+2.11
–10.79
–5.44
+17.36
+56.80
–6.31
+4.92
[3]
[94]
[52]
[38]
[115]
[6]
[132]
[2]
[51]
[99]
[4]
[62]
[137]
[80]
[125]
[109]
[14]
[1]
[112]
[63]
+3.94
–5.33
–5.59
+5.81
–13.28
+6.98
–8.32
+35.57
+6.65
+1.95
+25.11
–7.84
–11.84
+15.56
–9.24
–18.71
+4.75
+23.50
–4.97
+18.10
152.16
2,406.01
358.39
1,472.38
389.87
733.85
120.63
18,097.19
741.84
877.30
6,745.70
106.92
363.96
9,840.88
754.99
1,221.75
3,071.00
403.95
251.50
2,723.52
79.97
1,754.88
273.15
1,055.09
274.00
444.65
87.24
8,771.72
518.23
604.36
4,251.91
78.61
259.51
8,291.37
590.93
1,017.92
2,074.76
238.94
201.35
1,626.41
% Change and Ranking
YTD
+ 179.50
+ 2.20
+ 10.43
+ 11.77
– 4.48
+ 56.44
– 24.10
– 93.62
– 55.72
+ 7.33
– 40.83
+ 1.86
+ .28
+ .77
– 15.11
– 18.80
– 8.91
+ 25.45
+ .01
– 105.85
52 Week
Week
Net Change
6,188.38
146.34
130.29
116.98
22.78
1,463.75
575.26
776.31
209.54
47.92
194.82
43.00
8.81
259.97
116.25
265.43
55.63
113.84
.59
287.61
52 Week
Week
Rank
Yr Ago
Rank
YTD
Rank
3 Yr
High
Low
+1.03
+.55
+1.51
+.47
–.44
+.86
–.63
–2.14
–2.59
+1.00
–2.37
+.33
+.37
+.05
–2.10
–1.33
–1.61
+1.77
+.06
–2.35
[8]
[18]
[6]
[20]
[55]
[11]
[63]
[108]
[121]
[9]
[117]
[24]
[21]
[39]
[107]
[83]
[94]
[4]
[38]
[116]
+88.46
+66.70
+52.82
+49.55
+48.41
+47.74
+46.26
+46.24
+44.21
+43.35
+43.21
+39.89
+39.34
+39.16
+38.98
+37.66
+36.92
+36.78
+36.59
+36.24
[1]
[2]
[3]
[4]
[5]
[6]
[7]
[8]
[9]
[10]
[11]
[12]
[13]
[14]
[15]
[16]
[17]
[18]
[19]
[20]
+54.37
+56.80
+22.88
+4.92
+2.32
+28.27
+17.91
+22.20
+11.10
+6.91
+13.10
+8.14
+13.27
+18.44
+19.79
+23.56
+11.36
+8.43
+6.06
+7.01
[2]
[1]
[6]
[63]
[78]
[4]
[10]
[7]
[29]
[51]
[23]
[41]
[22]
[9]
[8]
[5]
[28]
[38]
[56]
[50]
+35.57
+23.50
+6.98
+18.10
+5.00
+25.11
+4.45
+8.82
+8.70
+6.65
+10.60
+11.78
+13.03
+16.04
+10.75
+23.48
–2.53
+5.81
+5.48
+8.19
18,097.19
403.95
733.85
2,723.52
1,135.72
6,745.70
3,889.46
4,390.04
2,180.79
741.84
1,731.66
611.98
77.41
1,708.11
718.79
1,410.87
564.29
1,472.38
11.08
4,855.92
8,771.72
238.94
444.65
1,626.41
687.45
4,251.91
2,591.87
2,898.64
1,452.17
518.23
1,160.16
412.46
53.38
1,188.18
492.06
906.83
375.25
1,055.09
7.45
3,203.78
Groups are weighted by capitalization. 52-week highs and lows are based on daily closes. Dec. 31, 1991=100. In the U.S. listings, % vol chg column shows the change from previous 65-day moving
average. Volume figures do not reflect extended trading hours.
Delta Market
Sentiment
Indicator
The Delta MSI measures the
position of a representative set
of stocks relative to an
intermediate-term moving
average crossover (MAC) point.
When greater than 50% of the
stocks followed are above this
MAC point, the market is
bullish. When the indicator is
below 50%, risk is elevated and
stock exposures should be
reduced. Manager uses
discretion on asset allocation
when MSI is at 50% +/- 3%.
Bullish
Current Sentiment
52.5%
Last Week
64.6%
Pulse of the Economy
Only includes new reports.
Economic Growth and Investment
Gross domestic product
Personal income, (bil. $)
Personal Savings Rate, St.Louis Fed
All fixed investment, (bil. $)
Non–residential investment, (bil. $)
Residential investment, (bil. $)
Latest
Date
Latest Preceding
Data
Period
1st Qtr
1.3
3.4
2.2 2.90
Apr 23,823.7 r23,758.5 22,806.1 4.46
Apr
3.6
r3.6
5.2 –30.77
1st Qtr 4,074.5 4,016.0 3,905.9 4.32
1st Qtr 3,341.9 3,314.9 3,214.5 3.96
1st Qtr 771.3
744.1 731.1 5.50
May 25 81,411
May 24
94.3
May 31
728
May 25 1,735
May 25
78.1
74,022 72,230 12.71
91.7
93.1 1.29
720
793 –8.20
1,728 1,737 –0.12
77.8
77.2 1.17
Consumption and Distribution
Consumer spending, (bil. $)
Latest Preceding
Data
Period
Year YroYr
Ago % Chg
Orders
No Activity for this Week
Exports, (bil. $)
1st Qtr 2,535.6
2,528.2 2,525.4 0.40
Imports, (bil. $)
1st Qtr 3,510.9
3,446.8 3,460.5 1.46
Apr 19,340.6 r19,301.5 18,363.8 5.32
Instinet Research Redbook Avg. (monthly %) May 25 0.45
0.48 –0.03
….
Baltic Dry Index
May 31 1,815
1,797
919 97.50
Personal consumption, (bil. $)
1st Qtr 15,663.8 15,586.7 15,312.9 2.29
May 31 119.23
1st Qtr
121.60 111.81 6.64
3.0
1.6
3.9 –23.08
Employment
Initial jobless claims (thous.)
Continuing claims (mil.)
May 25
219
r216
231 –5.19
3 Weeks ago
Current Market Exposure:
100% Equities, 0% Bonds, 0%
Cash
Source: Delta Investment
Management
www.deltaim.com, (415)
249-6337
CBOE
9.80
0.90
7.90
0.80
6.00
0.70
4.10
0.60
2.20
0.50
0.30
0.40
J
J A S O N D J F M A M
Source: CBOE
Coming Earnings
Consensus Estimate
Year ago
$1.92
$2.14
M
Science Applications Int’l (Q1)
T
May 18
1.791
r1.787
1.729 3.59
Home Price Index S&P Case–Shiller – Comp. 10 (SA)
Mar 341.75
r336.21 315.96
8.16
Other Indicators
Consumer confidence (Conference Board)
0.33
-0.24
-0.19
Special Drawing Rights (SDR) are based on exchange rates for the U.S.,
British, and Japanese currencies. Source: International Monetary Fund.
a-Russian Central Bank rate. b-government rate. d-rebased as of Jan. 1,
2005. y-floating rate.
Campbell Soup (Q3)
0.71
0.68
Dollar Tree (Q1)
1.44
1.47
Money Rates
Smartsheet (Q1)
0.27
0.08
Stitch Fix (Q3)
W
TH
DocuSign (Q1)
0.79
0.72
Kirkland’s (Q1)
-0.80
-0.95
2.35
2.64
10.00
8.18
1.09
0.96
Vail Resorts (Q3)
F
Consensus Estimate
Day
Consensus Est Last Period
M
April Construction Spending
0.20%
-0.20%
T
April Durable Orders
0.70%
0.70%
April Factory Orders
0.70%
0.80%
TH
April Trade Balance
-$69.8 bil
-$69.4 bil
F
May Nonfarm Payrolls
180,000
175,000
3.9%
3.9%
$12.0 bil
$6.3 bil
May 31
0.42
0.45
–0.43
April Consumer Credit
Unless otherwise indicated, times are Eastern. a-Advanced;
f-Final; p-Preliminary; r-Revised
Source: FactSet
For more information about coming economic reports
- and what they mean - go to Barron’s free Economic
Calendar at www.barrons.com
American Debt and Deficits
Conference Call Calendar Earnings-
Adjustable Mortgage Rates
Latest
Report
Preceding
Report
Federal Budget Deficit (bil. $)-a
1,521FY'26
Budget Surplus/Deficit (bil. $)-b, April
+209.53
Trade Deficit (bil. $, sa)-c, March
–69.37
Treasury Gross Public Debt. (bil. $)-d
34,621.7
Treasury Statutory Debt Limit (bil. $)-d
*
Consumer Installment Debt (bil. $)-e, March
5,058.9
1,671FY'25
r-236.56
r-69.46
34,568.3
31,381.5
r5,052.6
Year Ago Yr over Yr
Report
% Chg
1,846FY'24
+176.18
–59.58
31,464.5
….
4,836.9
….
18.93
16.43
10.03
….
4.59
Sources: a-Office of Management and Budget, b-Monthly Treasury Statement, c-Monthly Commerce Dept.
Report, d-Daily Treasury Statement, e-Monthly Federal Reserve Release. *Statutory debt limit temporarily
suspended through January 1, 2025.
1 Year Treas Bills
2 Year Treas Notes
3 Year Treas Notes
5 Year Treas Notes
10 Year Treas Notes
20 Year Treas Bds
FHFA PMMS+ May
May 31
May 24
Yr. Ago
YOY % Chg
5.17
4.87
4.66
4.48
4.44
4.66
6.73
5.14
4.80
4.59
4.43
4.42
4.66
6.63
5.15
4.38
4.09
3.82
3.76
4.11
6.72
0.39
11.19
13.94
17.28
18.09
13.38
0.15
Fed annualized yields adjusted for constant maturity.
Latest Week
Prev. Week
Yr Ago
5.50
8.50
5.50
8.50
5.25
8.25
5.33
5.33
5.33
5.33
5.09
5.08
5.400
5.255
5.383
5.170
5.26
7.25
5.389
5.245
5.372
5.160
5.25
7.25
5.462
5.300
5.526
5.290
5.19
7.00
5.38
5.40
5.41
5.46
5.38
5.40
5.41
5.46
5.15
5.28
5.43
5.60
Canada
Germany
Japan
Switzerland
Britain
7.20
4.50
1.475
2.00
5.25
7.20
4.50
1.475
2.00
5.25
6.70
3.75
1.475
2.00
4.50
Other Money Rates
Fannie Mae Home Loan:
30-Year Fixed Conv
Bank money market-z
Interest Checking-z
6-Month Certif-z
12-Month Certif-z
30 Month Accounts-z
5-Year Certificates-z
6.58
0.60
0.09
1.91
2.05
1.39
1.47
6.56
0.60
0.09
1.91
2.05
1.39
1.47
6.15
0.32
0.06
1.33
1.68
1.25
1.21
2.70
2.70
2.50
Discount Rate (NY)
Prime Rate (base)
May Unemployment Rate
a-1997 equals 100. b-1982-84 equals 100. c-1982 equals 100. f-1996 equals 100. hbenchmark revision, 2016 equals 100. r-Revised.
Argentina (Peso)-y
.0011
.0011 895.6139 891.0294
Australia (Dollar)
.6652
.6626
1.5033
1.5092
Bahrain (Dinar)
2.6525
2.6532
.3770
.3769
Brazil (Real)
.1906
.1936
5.2454
5.1658
Bulgaria (Lev)
.5546
.5547
1.8031
1.8029
Canada (Dollar)
.7336
.7312
1.3630
1.3677
Chile (Peso)
.001089 .001103
917.92
906.63
China (Renminbi)
.1388
.1381
7.2042
7.2433
Colombia (Peso)
.0002589 .0002580 3862.33 3876.15
Denmark (Krone)
.1455
.1454
6.8751
6.8793
EcuadorUS Dollar
1.0000
1.0000
1.0000
1.0000
Egypt (Pound)-y
.0212
.0212 47.2712 47.1508
Hong Kong (Dollar)
.1279
.1280
7.8211
7.8126
Hungary (Forint)
.002785 .002824
359.01
354.07
Iceland (Krona)
.007276 .007236
137.43
138.19
India (Rupee)
.01198
.01204
83.438
83.055
Indonesia (Rupiah)
.0000615 .0000623
16257
16045
Israel (Shekel)
.2692
.2733
3.7150
3.6586
Japan (Yen)
.006358 .006369
157.27
157.00
Kazakhstan (Tenge)
.002236 .002259
447.21
442.58
Kuwait (Dinar)
3.2624
3.2576
.3065
.3070
Macau (Pataca)
.1241
.1243
8.0580
8.0462
Malaysia (Ringgit)-b
.2124
.2122
4.7075
4.7115
New Zealand (Dollar)
.6143
.6118
1.6279
1.6345
Norway (Krone)
.0952
.0945 10.5019 10.5810
Oman (Rial)
2.5976
2.5983
.3850
.3849
Pakistan (Rupee)
.00359
.00360 278.425 277.980
Philippines (Peso)
.01707
.01719
58.585
58.190
Poland (Zloty)
.2539
.2550
3.9388
3.9214
Qatar (Rial)
.2747
.2744
3.6408
3.6438
Saudi Arabia (Riyal)
.2666
.2666
3.7508
3.7506
Singapore (Dollar)
.7401
.7407
1.3512
1.3500
South Africa (Rand)
.0532
.0543 18.7957 18.4199
South Korea (Won)
.0007230 .0007310 1383.14 1367.92
Sri Lanka (Rupee)
.0033
.0033 300.7400 299.3400
Sweden (Krona)
.0949
.0936 10.5428 10.6875
Switzerland (Franc)
1.1080
1.0933
.9025
.9147
Taiwan (Dollar)
.03079
.03101
32.479
32.246
Thailand (Baht)
.02715
.02723
36.830
36.730
Turkey (New Lira)-d
.0310
.0310 32.2364 32.2305
Ukraine (Hryvnia)
.0246
.0249 40.6500 40.1500
U.K. (Pound)
1.2740
1.2738
.7849
.7851
Euro
1.0848
1.0845
.9219
.9221
0.57
102.5 –0.49
Domestic crude oil, (thous. bbls) Comm. (Excl. Lease Stck) May 24 454,689 458,845 459,657 –1.08
Gasoline, (thous. bbls)
May 24 228,844 226,822 216,070 5.91
U.S. $ in
Foreign
Currency
Last Fri.
0.33
r97.5
….
U.S. $ in
Foreign
Currency
Fri.
0.89
102.0
Citi Research Panic–Euphoria Reading
Foreign
Currency
in U.S.$
Last Fri.
CrowdStrike (Q1)
May
Inventories
Foreign
Currency
in U.S.$
Fri.
Bath & Body Works (Q1)
Construction
2 Weeks ago
65.1%
S&P 100
J.Jill (Q1)
ECRI Industrial Price Index f
Gross domestic product deflator
Country
Readings in the CBOE equity put-call ratio of 60:100 and in the
S&P 100 of 125:100 are considered bullish, for instance. Bearish
signals flash when the equity put-call level reaches the vicinity of
30:100 and the index ratio hits 75:100.
The J.M. Smuckers (Q4)
Trade
Inflation
Production
Electric power, (mil. kw hrs) (EEI)
Petroleum, related capacity, %
Rotary rigs running, U.S. & Can., (Hughes)
Steel, (thous. tons)
Steel, rated capacity, % (AISI)
Latest
Date
Year YroYr
Ago % Chg
Foreign Exchange
CBOE Put / Call Ratio
vs. S&P 100
Company
Bath & Body Works
Brown-Forman
Campbell Soup
Dollar Tree
Hewlett Packard Enterprise
Lululemon Athletica
Source: CCBN, www.ccbn.com
Date
Time
Related
Period
June 4
June 5
June 5
June 5
June 4
June 5
9:00AM
10:00AM
8:00AM
8:00AM
5:00PM
4:30PM
Q1
Q4
Q3
Q1
Q2
Q1
Fed Funds Rate
Avg effective offer
Avg weekly auction-c
T-Bills Rate
13 weeks, Coupon Yield
13 weeks, Auction Rate
26 weeks, Coupon Yield
26 weeks, Auction Rate
Avg weekly auction-c
Broker Call Rate
Bankers Acceptances
1 month
2 months
3 months
6 months
Foreign Prime Rates
U.S. Savings EE Bonds:
Long-Term (5yrs+)
c-Annualized yields, adjusted for constant maturity, reported by the Federal
Reserve on a weekly average basis. Sources: Tullett Prebon information, Ltd.
Factset. z-Bankrate.com.
44
BARRON’S
MARKET LABORATORY
D ATA
Barron’s Gold Mining Index
12-Month
High
Low
Year
Ago
Week %
Chg.
1010.36 849.03
+1.59
5/30
1026.42 744.74 Gold mining
1026.42
5/23
Handy & Harman
Gold, troy ounce
Silver, troy ounce
B A R R ON S .C OM / D ATA
Dividend Payment Boosts
Weekly Bond Statistics
New Offerings, (mil $) (v)
Last Week
Prev. Week
Yr Ago
16,864
4,468
r24,059
r13,936
18,643
6,704
5/31
5/24
Year Ago
2350.65
32.04
2342.70
30.31
1963.25
23.76
Base for pricing gold and silver contents of shipments and for making
refining settlement.
(Barron's index of 10 high-grade corporate bonds.)
4.12
4.06
4.25
Interm-Grade Bonds-y
(Barron's index of 10 medium-grade corporate bonds.)
5.18
5.03
5.03
Confidence Index
Coins
Krugerrand
Maple Leaf
Mexican Peso
Austria Crown
Austria Phil
U.S. Eagles
Price
Premium $
Premium %
2439.58
2463.04
2836.27
2302.30
2463.04
2463.04
93.83
117.29
8.00
3.00
117.29
117.29
4.00
5.00
0.28
0.13
5.00
5.00
Premium is the amount over the value of the gold content in the coin.
Source Manfra, Tordella & Brookes, Inc. Bullion spot gold price 2345.75
Gold Performance
New Hope: Renewed hope for a rate cut
lifted gold 0.3%, to $2,351 an ounce.
25
(High-grade index divided by intermediate-grade index; decline in
latter vs. former generally indicates rising confidence, pointing to
higher stocks.)
79.7
80.6
84.5
Other Confidence Indicators:
Bond Buyer 20 Bond Index
5
(Index of yields of 20 general obligation municipal bonds.)
4.13
4.00
0
Bond Buyer Municipal Bond Index
3.67
(Index of 40 actively-traded tax-exempt bonds; component issues
are changed regularly to keep the index a current picture of the
market. Source: The Bond Buyer
4.54
4.42
4.52
(Difference between yield on highest-grade corporate bonds and
yield on stocks on the DJIA.)
-2.25
-2.20
-2.15
Yield on DJ Equal Weight US Corp Bond Idx:
Corp Bonds, (y)
5.65
5.61
5.39
v-Week ended Thursday. y-Yield to maturity, week ended Thursday. zSource: LSEG.*Barclays T-Bond Index discontinued by firm.
Federal Reserve Data Bank
One week ended May 29:
Member Bank
Reserve Chgs. (Mil. $)
Prev.
Week
Change
Year
Ago
Change
-5,304
-895,410
U.S. Gov't securities:
Bought outright
6,855,939
Nuvei
Provident Fincl Hldgs
Southside Bancshares
Week’s
Dividend
Payment
This list includes payouts on
common stocks.
NASDAQ
Federal agency secur:
Bought outright
2,347
Reserve bank credit:
Primary Credit
Secondary Credit
Seasonal Credit
Float
Other F.R. Assets
Total Fed Credit #
Gold stock
SDR Certif. Accounts
Treas. Curr. Outst.
Total
Currency in circ
Treas. Cash Hldgs
Treas. Fed Deposits
Foreign Fed Deposits
Other Fed Deposits
Other FR liab/cap
Total factors
Reserves F.R. banks
Fgn hold U.S. debt
6,669
....
35
-369
33,562
7,260,340
11,041
5,200
52,910
7,347,383
2,352,465
439
704,335
9,684
171,074
-117,177
3,938,041
3,409,342
3,321,817
Reserve Aggr (Mil. $)
Month Ended Apr:
Latest
Month
Prev.
Month
Total Reserves:
NonborrowedRes
BorrowedReserves
Monetary Base
3,429,500
3,293,500
135,938
5,775,200
3,543,100
3,382,600
160,502
5,883,000
....
....
+98
+2,971
....
....
+10
+29
-123
-6
+1,618
-356
-5,184 -1,119,595
....
....
....
....
+14
+694
-5,227 -1,119,288
+4,750
+10,595
-11
+208
-21,041 +655,381
-77
-12
+13,167
-38,073
+2,651 -105,780
-23,775 -1,219,184
+18,548
+99,895
-1,972
-87,873
Month %
Chg.
Year
Ago
-3.21 3,269,500
-2.63 2,939,800
-15.30 329,662
-1.83 5,593,100
6-14
7-30
6-14
6-14
6-14
6-03
6-25
5-31
6-14
7-30
6-14
6-14
6-14
6-03
6-25
5-31
7-15
8-27
6-28
6-28
6-28
6-10
7-02
6-03
%
Record
Ex-Div
Company Name-Ticker Symbol (Exchange)
Adjusted
Yield
Period
To
From
Decrease
Date
Date
Date
Telephone & Data Sys-TDS (NYSE)
4.0
Q
.04
.19
-78.9 %
6-14
6-14
6-28
Payment
First
Closing
Closing
High
Closing
Low
Close Avg
Mean
Last
Close
Chg.
% Chg.
Avg.
P/E
Avg.
Yield
37903.29
39566.85
39087.38
38519.84
37715.04
40003.59
39566.85
39807.37
39131.53
38467.31
37903.29
37735.11
38585.19
38272.75
37266.67
39129.39
38401.22
39105.52
38720.52
37763.95
38686.32
37815.92
39807.37
38996.39
38150.30
+870.40
–1991.45
+810.98
+846.09
+460.76
+2.30
–5.00
+2.08
+2.22
+1.22
27.25
26.71
27.55
26.72
25.84
1.85
1.89
1.84
1.89
1.94
36245.50
33274.58
33433.35
34837.71
35630.68
34418.47
33061.57
34051.70
33601.15
32661.84
37710.10
35950.89
33997.65
34907.11
35630.68
35559.53
34408.06
34051.70
34098.16
33431.44
36054.43
33274.58
32417.59
33507.50
34099.42
33734.88
33061.57
32764.65
33301.87
31819.14
36947.93
34704.50
33319.49
34318.89
34880.66
34777.20
33904.98
33316.80
33731.28
32483.48
37689.54
35950.89
33052.87
33507.50
34721.91
35559.53
34407.60
32908.27
34098.16
33274.15
+1738.65
+2898.02
–454.63
–1214.41
–837.62
+1151.93
+1499.33
–1189.89
+824.01
+617.45
+4.84
+8.77
–1.36
–3.50
–2.36
+3.35
+4.56
–3.49
+2.48
+1.89
26.00
24.56
23.37
24.19
24.70
23.03
22.18
21.79
22.05
21.17
1.98
2.09
2.18
2.11
2.05
2.06
2.09
2.11
2.07
2.15
2024
May
Apr
Mar
Feb
Jan
2023
Dec
Nov
Oct
Sept
Aug
July
June
May
Apr
Mar
Monday (June 3)
Allegiant Travel
ConnectOne Bancorp
Enterprise Bancorp
Middlesex Water
Newmark Group
Selective Insurance
Strategic Education
Superior Group of Cos.
TPG
Twin Disc
Warner Music Group
Winmark
.60
.18
.24
.325
.03
.35
.60
.14
.41
.04
.17
.90
Tuesday (June 4)
BGC Group Cl A
Cheesecake Factory
Kelly Services Cl A
Kelly Services Cl B
LPL Financial Holdings
Nordson
Phillips Edison
Torm
.02
.27
.075
.075
.30
.68
.097
1.50
Friday (June 7)
Advanced Energy Inds
Amgen
Cogent Communications
Eagle Bancorp Montana
HMN Financial
Honeywell International
MKS Instruments
Vinci Partners Invt
WaFd
Willis Lease Finance
Wingstop
.10
.14
.36
.10
2.25
.975
.14
.10
1.08
.22
.17
.26
1.00
.22
Sat. (June 8)-Sun. (June 9)
NONE
Week’s
Dividend
Payment
This list includes payouts on
common stocks.
NYSE American
Monday (June 3)
NONE
Wednesday (June 5)
Apogee Enterprises
.25
Chesapeake Energy
.575
Chord Energy
1.25
Chord Energy
1.69
Hennessy Advisors
.138
MarketAxess Holdings
.74
Microchip Technology
.452
Paccar
.30
USCB Financial Holdings .05
Woodward
.25
Tuesday (June 4)
Mexco Energy
.10
Wednesday (June 5)
Cohen & Co
.25
Thursday (June 6)
Allient
Chesapeake Energy
Littelfuse
Saturday (June 8)
NONE
.03
.14
.65
Thursday (June 6)
NONE
Friday (June 7)
NONE
Sunday (June 9)
NONE
Company Name-Ticker Symbol (Exchange)
Record Ex-Div
Amount Date Date
Euro Tech Holdings-CLWT (NCM )
0.08
Infosys ADR-INFY (NYSE)
0.10
IRSA-Inversiones GDR-IRS (NYSE)
0.63
SilverSun Technologies-SSNT (NCM ) 3.27
StepStone Group-STEP (Nasdaq)
0.15
6-13
5-31
6-03
6-05
6-14
6-13
5-31
6-03
6-05
6-14
Week’s
Dividend
Payment
Wednesday (June 5)
Archer Daniels Midland
HF Sinclair
Home BancShares
Louisiana-Pacific
Ormat Technologies
Peabody Energy
Sprott
TechnipFMC
This list includes payouts on
common stocks.
Thursday (June 6)
BWX Technologies
Carpenter Technology
CNA Financial
Cummins
Discover Finl Svcs
Excelerate Energy
Guild Holdings
Himalaya Shipping
Ingersoll Rand
John Bean Technologies
Marriott Vacations
Matson
Southern
TJX Cos
Westlake
NYSE
Monday (June 3)
A10 Networks
.06
Aflac
.50
American States Water
.43
American Water Works .765
Brink's
.243
Bunge Global
.68
Carlisle Cos
.85
Carriage Services
.112
Church & Dwight
.284
ConocoPhillips
.58
ConocoPhillips
.20
Deluxe Corp
.30
Entergy
1.13
Ford Motor
.15
Fresenius Medical Care .634
Global Ship Lease Cl A
.375
IRSA-Inversiones GDR
.63
JM Smucker
1.06
Magnolia Oil & Gas
.13
Murphy Oil
.30
Murphy USA
.44
Phillips 66
1.15
Pinnacle West Capital
.88
Sensient Technologies
.41
SJW Group
.40
Southwest Gas Holdings .62
Standard Motor Products .29
SunCoke Energy
.10
Toyota Motor ADR
2.861
TransUnion
.105
Truist Financial
.52
Visa Cl A
.52
Tuesday (June 4)
Delta Air Lines
Gerdau ADR
INVESCO
Jabil
Johnson & Johnson
ONE Gas
Penske Automotive
Zoetis
.10
.055
.205
.08
1.24
.66
.96
.432
Pay
Date
6-27
5-31
6-03
6-12
6-28
.50
.50
.18
.26
.12
.075
.25
.05
.24
.20
.44
1.68
.70
.025
.50
.04
.02
.10
.76
.32
.72
.375
.50
Friday (June 7)
Alcoa
.10
Atlantic Union Bankshares .32
Badger Meter
.27
Bowlero
.055
Carter's
.80
Crawford & Co B
.07
Crawford Cl A
.07
Crescent Energy
.12
ENI ADR
.499
Evertec
.05
First Majestic Silver
.004
Fresh Del Monte Produce .25
Matador Resources
.20
Materion
.135
Moody's
.85
Otis Worldwide
.39
Parker Hannifin
1.63
Piper Sandler
.60
Pitney Bowes
.05
Quad/Graphics
.05
Reliance
1.10
Scotts Miracle-Gro
.66
Sherwin-Williams
.715
Sturm Ruger
.16
TE Connectivity
.65
Unilever ADR
.456
Vulcan Materials
.46
Yum! Brands
.67
Zurn Elkay Water Solns
.08
Sat. (June 8)-Sun. (June 9)
NONE
Stock Splits/Dividends
Company Name-Ticker Symbol (Exchange)
Record Ex-Div
Amount Date Date
Pay
Date
NONE
Wednesday (June 5)
Chicago Rivet & Machine
Week’s ExDividend
Dates
.10
Thursday (June 6)
NONE
Friday (June 7)
Silvercorp Metals
This list includes payouts on
common stocks.
Saturday (June 8)
NONE
NYSE American
Sunday (June 9)
NONE
Tuesday (June 4)
Monday (June 10)
CompX IntlA
NONE
.013
.30
U.S. Treasury Bills
Maturity
July 16
July 18
July 23
July 25
July 30
August 01
August 06
August 08
August 13
August 15
August 20
August 22
August 27
August 29
September 03
September 05
September 12
September 17
September 19
September 24
September 26
October 01
October 03
October 10
October 17
October 24
October 31
November 07
November 14
Nov 21 '24
Nov 29 '24
Dec 26 '24
Jan 23 '25
Feb 20 '25
Mar 20 '25
Apr 17 '25
May 15 '25
Top 5 Insider Purchases by
Company in 2024
Company
Number of Number of
Sym Insiders
Shares
$ Value
Avg.
Price
Townebank
Ul Solutions
Compass Diversified
Columbia Banking System
Community Trust Bancorp
TOWN
ULS
CODI
COLB
CTBI
66 52,297 1,434,784
22 590,669 16,538,732
17 194,368 4,337,723
13 52,666 1,083,289
12
10,421
435,510
$27.44
$28.00
$22.32
$20.57
$41.79
Top 5 Insider Sales by Company in 2024
Dividend Payment Reductions
Special Dividends
Stock/Bond Yield Gap-s
J J A S O N D J F M A M
5.3 %
3.2
11.1
67.6
7.7
7.2
50.0
0.3
To
Year
Month
10
-20
Q
.20
.19
Q 1.1367 1.101667
A
.50
.45
Q
.62
.37
Q
.14
.13
Q
1.34
1.25
Q
.09
.06
M .129063 .128625
Period
Bloomberg Barclays US Credit
(Index of total return from active Treasury notes and bonds. Dec.
31, 1996=100.)
269.09
270.30
271.18
Barron's Gold Mining Index (1026.42)
Payment
Date
The following table lists the monthly average of the Price/Earnings Ratio and Dividend Yield as reported weekly in Barron's Market Laboratory. The change is the difference between the recent month's close and the previous month's close. The high/low range is based upon the
closing average for each day during the month.
15
-15
From
Ex-Div
Date
(This index measures the performance of fixed-rate, nominal US
Treasuries with at least 10 years to maturity. Jan. 1, 1973=100.)
3034.41
3052.48 3255.96
Ryan Labs Treasury Index
-10
4.2
3.9
1.8
7.3
1.8
5.4
0.7
6.8
Record
Date
Monthly Dow Jones Industrial Average
20
-5
Alerus Financial-ALRS (NCM )
Bank of Montreal-BMO (NYSE)
Flanigan's Enterp-BDL (NYSE AMER )
Frontline-FRO (NYSE)
Iridium Communications-IRDM (Nasdaq)
LyondellBasell Inds-LYB (NYSE)
STMicroelectronics-STM (NYSE)
STRATS Allstate 2006-3-GJT (NYSE)
%
Increase
Bloomberg Barclays US Long Treasury*
(This index includes all publicly issued, fixed-rate, non-convertible,
investment-grade, dollar-denominated, SEC-registered corporate
debt.)
3014.08
3022.29 2913.09
Handy & Harman Gold Price
Adjusted
Yield
Company Name-Ticker Symbol (Exchange)
Corporate (z)
Municipal (z)
Best Grade Bonds-y
Gold & Silver Prices
For personal non-commercial use only. Do not edit or alter. Reproductions not permitted.
To reprint or license content, please contact Barron's reprints department at 800-843-0008 or www.djreprints.com
June 3, 2024
Bid
Asked
Wkly
Chg.
Ask
Yld.
5.27
5.25
5.27
5.27
5.26
5.26
5.26
5.25
5.25
5.24
5.25
5.24
5.23
5.25
5.24
5.22
5.22
5.24
5.23
5.22
5.22
5.24
5.20
5.21
5.21
5.19
5.19
5.16
5.17
5.16
5.15
5.06
4.93
5.00
4.98
4.97
4.93
5.26
5.24
5.26
5.26
5.25
5.25
5.25
5.24
5.24
5.23
5.24
5.23
5.22
5.24
5.23
5.21
5.21
5.23
5.22
5.21
5.21
5.23
5.19
5.20
5.20
5.18
5.18
5.15
5.16
5.15
5.14
5.05
4.92
4.99
4.97
4.96
4.92
0.01
0.01
....
0.03
0.01
0.02
0.01
0.01
0.01
....
....
....
....
0.02
....
....
....
....
....
-0.02
....
....
0.04
0.01
0.01
0.02
0.01
-0.02
-0.01
-0.02
0.01
-0.01
-0.03
-0.01
....
-0.02
-0.02
5.37
5.35
5.37
5.37
5.37
5.36
5.37
5.36
5.37
5.36
5.37
5.37
5.36
5.38
5.37
5.36
5.36
5.38
5.38
5.37
5.37
5.39
5.35
5.37
5.38
5.36
5.36
5.34
5.36
5.35
5.35
5.21
5.10
5.19
5.18
5.19
5.17
Salesforce
Coinbase Global
Celsius
Meta Platforms
Cloudflare
CRM
COIN
CELH
META
NET
Week’s ExDividend
Dates
This list includes payouts on
common stocks.
NYSE
Tuesday (June 4)
Air Lease
Cigna Group
Corteva
FutureFuel
Interpublic Grp
L3Harris Technologies
La-Z-Boy
Live Oak Bancshares
Lufax Holding ADR
Navigator Holdings
Newmont
Nordstrom
Old Republic Intl
Radian Group
Stanley Black & Decker
Suncor Energy
ZIM Integrated Shipping
.21
1.40
.16
.06
.33
1.16
.20
.03
.156
.05
.25
.19
.265
.245
.81
.398
.23
Wednesday (June 5)
Avery Dennison
Banco Bradesco Ord ADR
Caleres
Cedar Fair Dep Rec
Designer Brands
Enpro
H & R Block
Halliburton
Harley-Davidson
Okeanis Eco Tankers
PJT Partners
PVH Corp.
Schlumberger
Vector Group
.88
.003
.07
.30
.05
.30
.32
.17
.172
1.10
.25
.038
.275
.20
Thursday (June 6)
Aris Water Solutions
Dun & Bradstreet
Edgewell Personal Care
Flowers Foods
FNB Corp
ICL Group
Jackson Financial
Lear Corp
Liberty Energy
Mosaic
Noble
Ryerson Holding
Terex
Vontier
WPP ADR
.105
.05
.15
.24
.12
.046
.70
.77
.07
.21
.40
.188
.17
.025
.244
Friday (June 7)
Acushnet Holdings
.215
Albany International
.26
Bank of America
.24
Bath & Body Works
.20
BlackRock
5.10
Brown-Forman Cl A
.218
Brown-Forman Cl B
.218
Canadian National Railway .618
Gallagher
.60
General Motors
.12
Genuine Parts
1.00
Insperity
.60
Kimberly-Clark
1.22
Molson Coors A
.44
Molson Coors B
.44
Mueller Industries
.20
National Grid ADR
2.494
NY Community Bancorp
.01
Outfront Media
.30
Primo Water
.09
Public Svc Enterprise
.60
Schneider National
.095
Solaris Oilfield A
.12
Tapestry
.35
TEGNA
.125
Trane Technologies
.84
Unifirst
.33
Waste Management
.75
Williams Cos
.475
WPP ADR
1.54
Saturday (June 8)
NONE
Sunday (June 9)
NONE
52
35
27
25
23
1,359,828 387,652,981 $287.97
1,128,609 223,941,289 $198.42
5,821,636 353,229,553 $60.68
615,958 262,213,470 $425.70
2,233,657 208,623,830 $93.40
Monday (June 10)
Assurant
.72
Becton Dickinson
.95
Cato Cl A
.17
Clear Secure
.10
CNO Financial Group
.16
Elevance Health
1.63
Fidelity Natl Info Svcs
.36
First American Financial
.53
Flex LNG
.75
Genpact
.153
Knight-Swift Transport
.16
Kontoor Brands
.50
Kronos Worldwide
.19
NL Industries
.08
Occidental Petroleum
.22
Omnicom Group
.70
PPL Corp
.257
Rogers Communications B .366
TELUS Corp.
.284
Travelers
1.05
Valhi
.08
VF Corp
.09
Week’s ExDividend
Dates
This list includes payouts on
common stocks.
NASDAQ
Tuesday (June 4)
Amkor Technology
Analog Devices
Bentley Systems
Cass Info Systems
Linde
Monro
Wednesday (June 5)
Avnet
Commerce Bancshares
Hancock Whitney
Old Dominion Freight Line
Old National Bancorp
Phibro Animal Health
Thursday (June 6)
Jack in the Box
Kraft Heinz
NetEase ADR
Northrim Bancorp
Phibro Animal Health
SLM Corp
Star Bulk Carriers
.079
.92
.06
.30
1.39
.28
.31
.27
.40
.26
.14
.12
.44
.40
.495
.61
.12
.11
.75
Friday (June 7)
AAON
.08
Booking Holdings
8.75
CH Robinson Worldwide
.61
CME Group Cl A
1.15
Covenant Logistics Cl A
.11
Exponent
.28
First Merchants
.35
Golden Ocean Group
.30
Hub Group Cl A
.125
ICF International
.14
Lancaster Colony
.90
Mercantile Bank
.35
Navient Corp.
.16
Northern Trust
.75
PepsiCo
1.355
TriCo Bancshares
.33
Trustco Bank
.36
Unity Bancorp
.13
Vodafone Group ADR
.486
WesBanco
.36
Saturday (June 8)
NONE
Sunday (June 9)
NONE
Monday (June 10)
Alphabet Cl A
Alphabet Cl C
Auburn National Bancorp
Golar LNG
James River Group Hldgs
Red River Bancshares
Steven Madden
UMB Financial
Victory Capital Cl A
.20
.20
.27
.25
.05
.09
.21
.39
.37
June 3, 2024
D ATA
MARKET LABORATORY
Week’s
New Highs and
Lows
NYSE
227
118
New Highs
New Lows
Nasdaq
247
299
New Highs
New Lows
NYSE American
22
15
New Highs
New Lows
Only includes COMMON and REIT stocks
NYSE American
For personal non-commercial use only. Do not edit or alter. Reproductions not permitted.
To reprint or license content, please contact Barron's reprints department at 800-843-0008 or www.djreprints.com
NEW HIGHS
ArisMining
AultDisruptive
AvinoSilver
BiteAcqn
DenisonMines
GalianoGold
LogisticProp
MaiaBiotech
NanoViricides
NatlHealthcare
NewConceptEner
NewGold
RydeGroup
SilvercorpMetals
StrawberryFldREIT
VizslaSilver
NEW LOWS
AeonBiopharma
AIM Immuno
CleanCore
DDC Enterprise
DeltaApparel
i-80Gold
inTEST
IssuerDirect
LoopMedia
Northann
PineappleFinl
SachemCapital
SigningDaySports
Volato
Nasdaq
NEW HIGHS
ACV Auctions
AddusHomeCare
AeroVironment
AffinityBncshs
AgiosPharm
Agric&NatSolnsA
AI Transportation
AimeiHlthTech
AlarumTech
AllianceResource
AltairEngg
AmerSupercond
APxAcqnI A
Arhaus
AryaSciencesIV
ASP Isotopes
AST Space
AudioEye
45
BARRON’S
Avnet
Bank7
BarrettBus
BelFuse A
BeliteBio
Bioventus
BlueBird
CalliditasTherap
Camtek
CardiolTherap
CasellaWaste
CBAK Energy
CecoEnvl
ChefsWarehouse
CirrusLogic
CleanEnerSpec
ConstructionPtrs
ContextTherap
Costco
CredoTech
Criteo
Crocs
CSW Industrials
D-MarketElec
DataStorage
DecipheraPharm
DescartesSystems
DigitalHealth
DyadicInt
eBay
Enstar
EudaHealth
Everbridge
FirstSolar
Fitell
FitLifeBrands
Flex
Freshpet
FTACEmeraldA
FTAI Aviation
FTAI Infra
FusionPharm
Gaia
GenAsia I A
Genfit
GoldenMatrix
HamiltonLane
Hawkins
HeronTherap
HorizonSpaceI
Humacyte
Immersion
InceptionGrowth
Insmed
InteractiveBrkrs
IntuitiveSurgical
InvestorsTitle
IrisAcqn
IronHorseAcqns
Itron
JVSPAC Acqn A
KernelA
KindlyMD
KLA
KratosDefense
LakeShoreBancorp
Limbach
LogitechIntl
LPL Financial
Mama'sCreations
Marex
MartinMidstream
MicronTech
MillicomIntl
NanoNuclearEner
Napco Security
Natera
NatlCineMedia
NetApp
Netflix
NewProvidenceII A
Nova
NVIDIA
NXP Semicon
OCA Acqn A
Onfolio
PearlHldgsAcqnA
Pennant
PlumAcqnIA
PonoCapTwoA
PowellIndustries
PrimeEnergy
PriorityTech
PulseBiosciences
Qualcomm
RadNet
ResearchFrontiers
Rezolute
Robinhood
Sanmina
Semtech
ShockwaveMed
ShoeCarnival
SPAR Group
SpringValleyII A
StarBulkCarriers
StealthGas
StepStone
SummitTherap
Surmodics
T-MobileUS
TandemDiabetes
Teradyne
TexasInstruments
TexasRoadhouse
TLGY Acqn A
TransMedics
TSR
TTM Tech
TwelveSeasII A
U-BX Tech
UnitedGuardian
UnvlStainless
VeecoInstr
VictoryCapital
VitalFarms
WesternAcqn
WesternDigital
Woodward
ZhibaoTech
NEW LOWS
10xGenomics
180LifeSci
22ndCentury
AbleViewGlobal
AcadiaHlthcr
AcadiaPharm
ACELYRIN
Aditxt
AdlaiNortye
AdverumBiotech
AGM
Alpine4
AltoIngred
Amdocs
AmericanRscs
Amerisafe
Amplitech
AmylyxPharm
APA
ApollomicsA
Appian
AppliedDNA
AptoseBiosci
ArqitQuantum
ArtesianRscs A
ArtWayMfg
ATA Creativity
Atlassian
Auddia
Augmedix
AustralianOilseeds
AutonomixMed
AvenueTherap
Avinger
BinahCapital
Bio-Path
BioCardia
BioMarinPharm
Bionomics
BioVie
BioXcelTherap
BlackLine
Bloomin'Brands
BoundlessBio
BrenmillerEner
BridgfordFoods
BrighthouseFin
BroogeEnergy
BT Brands
BurgerFiIntl
CaesarsEnt
CaribouBio
ChampionsOncology
Charles&Colvard
Cheche
CheetahNetSupply
Chuy's
Cingulate
CiscoSystems
CISO Global
CN Energy
CoeptisTherap
ColumbiaFinl
CommVehicle
ConsumerPtf
CrackerBarrel
CueHealth
CumulusMedia
CVRx
Denny's
DermTech
DestinationXL
DigitalBrands
dLocal
Docebo
DonegalGroup A
DonegalGroup B
Dropbox
DuluthHoldings
EagleBancorp
EaglePharm
ECARX
EdibleGarden
EffectorTherap
Emcore
EverspinTech
EvokePharma
Evotec
ExactSciences
B A R R ON S .C OM / D ATA
Five9
Fortrea
Freshworks
FSD Pharma
Galapagos
GeneticTech
GileadSciences
GlycoMimetics
GreenlandTech
GreenPlains
GreenPowerMotor
GreenwaveTech
GromSocialEnts
GryphonDig
HallofFameResort
HeliusMedical
HelloGroup
HertzGlobal
HoldcoNuvo
Hywin
HyzonMotors
iCoreConnect
ICZOOMA
iHeartMedia
Immucell
Immuneering
InteractStrength
Intrusion
IonisPharm
IronwoodPharm
JBHunt
Jet.AI
Jiuzi
JohnsonOutdoors
KaivalBrands
Kaltura
KezarLifeSci
KindlyMD
KLX Energy
Knightscope
KrispyKreme
KY FirstFedBncp
KyvernaTherap
Leafly
LegalZoom
LibertyGlobalC
LibertySirius A
LibertySirius C
LightwaveLogic
LionsgateStudios
LipellaPharm
LixiangEduc
LoboEV
Longeveron
LoopIndustries
lululemon
MarketAxess
MaxeonSolar
MEI Pharma
mF Intl
MGP Ingredients
MicroAlgo
MicroCloudHologram
Microvast
MiddlefieldBanc
MinervaNeurosci
Mobile-health
Mobilicom
MolecularTemp
MongoDB
Monro
Movano
MustangBio
MVB Financial
MyMD Pharm
N2OFF
NaaSTechnology
NatlResearch
NatureWood
NavitasSemi
Neo-Concept
NewFortressEner
NewHorizAircraft
Nikola
Nukkleus
NuvveHolding
Nvni
NY Mortgage
ODP
OmegaFlex
OmniAb
PapaJohn's
PatriotNatBncp
PAVmed
PaycorHCM
PeapackGladFin
Peraso
PharmaCyteBiotech
PierisPharm
Pixelworks
PlumAcqnIA
PlutonianAcqn
PolestarAuto
PrestigeWealth
PrestoAutomation
ProfDiversity
ProgressSoftware
Prothena
PureCycle
QuinceTherap
RadiusRecycling
RailVision
RaptTherap
RCI Hospitality
Regis
RelianceGlobal
RemitlyGlobal
Replimune
RevanceTherap
RevelationBio
RichtechRobotics
Roku
RomaGreenFin
SagaComm
SageTherap
SciSparc
SeelosTherap
ServiceProperties
SharpLink
SidusSpace
SifyTech
Silvaco
SiyataMobile
SmartPowerr
Soligenix
SpectralAI
SpruceBio
Stratasys
SunCountryAir
SunriseNewEner
SunshineBio
T Stamp
TelesisBio
TenonMedical
Tharimmune
TheravanceBio
TitanMachinery
TopKingWin
TraconPharm
TransActTechs
TruGolf
TTEC
TungrayTech
TwinVee
Uniti
Vacasa
ValleyNatlBncp
VCIGlobal
Verastem
VeronaPharma
VerveTherap
Vitru
VividSeats
VivosTherap
Volcon
VorBiopharma
VOXX Intl
Wag!
WalgreensBoots
WeBuyGlobal
Wendy's
WindtreeTherap
WW Intl
XcelBrands
XIAO-I
YatraOnline
YunhongGreenCTI
YY Group
ZapataComputing
Zhongchao
Zoomcar
ZyVersaTherap
NYSE
NEW HIGHS
Aflac
AT&T
AXIS Capital
AZZ
Abercrombie&Fitch
AerCap
Alcoa
Ameriprise
ApolloGlblMgmt
Argan
ArloTech
AspenAerogels
Autoliv
BBB Foods
BRC
BW LPG
BankofAmerica
Barclays
Bath&BodyWks
BatteryFutureA
BenchmarkElec
Birkenstock
BootBarn
Bowhead
BrightView
Brink's
BrinkerIntl
Build-A-Bear
BurlingtonStrs
CAVA
CNX Resources
CTS
Cadeler
Cameco
CarpenterTech
Celestica
ClearwaterPaper
CoeurMining
Corning
Costamare
Danaos
DaVita
DeckersOutdoor
DellTechC
Despegar.com
Dick's
DorianLPG
Dover
DuPont
DycomInds
EMCOR
EdisonIntl
ElancoAnimal
EndeavourSilver
EnerpacTool
Equitable
Fabrinet
FederalSignal
Fluor
FortunaSilver
Frontline
GE Vernova
Gannett
Gap
GatosSilver
Glaukos
GlobalShipLease
GlobusMedical
GuildHldgs
HCA Healthcare
HP
Hafnia
HamiltonIns
HannonArmstrong
Heico
Heico A
HimalayaShipping
Hims&HersHealth
HowmetAerospace
InFinTAcqnA
IntlSeaways
J.Jill
KensingtonCapV A
KinrossGold
Kirby
KontoorBrands
KronosWorldwide
LennoxIntl
LeviStrauss
LibertyEnergy
EliLilly
LincolnNational
LumentFinance
Mytheresa
Matson
McKesson
MetalsAcqn
MillerIndustries
MineralsTechs
MoneyLion
NRG Energy
NYTimes A
NewparkResources
NexaResources
NextEraEnergy
nVentElectric
Oil-Dri
OnHolding
OrionGroup
OverseasShip
OwensCorning
PACS Group
PJT Partners
PanAmerSilver
PhilipMorris
PrimorisSvcs
PublicServiceEnt
PureStorage
PyrophyteAcqn
QuantaServices
REV
RTX
RayonierAdvMatls
Redwire
RigelResourceA
RoyalBkCanada
RushStreetInt
SPX Tech
SableOffshoreA
SafeBulkers
SelectWater
SelectQuote
SignetJewelers
SkechersUSA
Southern
SumitomoMits
TD Synnex
Teekay
TeekayTankers
TejonRanch
Telefonica
TenetHealthcare
TransDigm
TransportadGas
TripleFlagPrecMtl
TristarAcqnI
Tronox
TsakosEnergy
TurkcellIletism
TutorPerini
US Cellular
UniversalHealthB
ValensSemicon
Veralto
Viking
Vistra
Walmart
WarbyParker
Welltower
WestRock
WisdomTree
ZimIntShipping
NEW LOWS
AGCO
AccelEnt
Accenture
Adient
AltaEquipment
Ambev
AmericanWell
Ampco-Pitt
AnywhereRealEst
AppleHospREIT
Asana
BILL
BancoBradesco
BauschHealth
BectonDicknsn
BlackstoneMtg
BostonBeer
BoydGaming
BristolMyers
Brown-Forman A
Brown-Forman B
CVS Health
Capri
ChathamLodging
Chegg
Clarivate
ClarosMtg
CommunityHlthcr
ContainerStore
Cosan
Coursera
DHI Group
DXC Tech
Dayforce
Diageo
DineBrands
EPAM Systems
Endava
Envista
EveHolding
Eventbrite
Everi
EvolentHealth
Fastly
ForgeGlobal
fuboTV
FutureFuel
GXO Logistics
Gerdau
GinkgoBioworks
Globant
GranitePointMtg
GreatAjax
GreenTree
IntlGameTech
LG Display
LasVegasSands
Lear
Leggett&Platt
LightInTheBox
LithiumAmericas
MSC Industrial
MagnaIntl
Marcus
MolsonCoorsB
MyersIndustries
NerdyA
NineEnergy
POSCO
PSQ
PagerDuty
PaycomSoftware
PeakstoneRealty
PediatrixMedical
Perfect
Polaris
ReadyCapital
RobertHalf
Rubrik
Sasol
SeritageGrowth
Smucker
Snowflake
Solventum
StandardMotor
TelusIntl
TeladocHealth
TelekmIndonesia
Teradata
TItanIntl
Toro
UiPath
UPS B
UnitySoftware
VailResorts
Velo3D
W&T Offshore
Whirlpool
Workiva
Yext
Zeekr
ZKH
ZeppHealth
Zhihu
Barron’s 50-Stock Average
This index is a weighted average of 50 leading issues. Useful in security valuation. Source: Barron's Stats
S&P 500 Index
Barron’s 50 Index
May 30
May 23
May
2024
2024
2023
Yr-to-Yr
% Chg
5235.48 5267.84 4135.29
26.60
13207.56 13341.92 11171.60
18.22
Projected quarterly earn
124.04
126.60
164.70 –24.69
Annualized projected earn
496.15 506.39
658.79 –24.69
Annualized projected P/E
26.62
Five-year average earn
523.78
Five-year average P/E
25.22
Year-end earn
26.35
17.0
56.96
524.81 486.93
7.57
25.42
22.9
9.91
606.93 609.49
619.08
–1.96
Year-end P/E
21.76
21.89
18.0
20.59
Year-end earns yield, %
4.60
4.57
5.5
–17.08
Best grade bond yields, %
4.12
4.06
4.35
–5.29
Bond yields/stock ylds, %
0.90
0.89
0.78
14.21
259.36
259.18
243.79
6.39
1.96
1.94
2.18
–10.02
Actual year-end divs
Actual yr-end divs yld, %
BARRON’S
For personal non-commercial use only. Do not edit or alter. Reproductions not permitted.
To reprint or license content, please contact Barron's reprints department at 800-843-0008 or www.djreprints.com
O T H E R VO I C E S
We are entering a new era characterized by
factors that investors have not had to
contemplate for decades.
It’s a New World.
Investors’ Old Rules
No Longer Apply.
W
hether investors know it
or not, the
past eight
decades have
been among
the best in
history for peace, prosperity, profits—
and market returns. But given today’s
tempest of geopolitics—and the widening cracks in the foundation of the
post-1945 world order—one has to
wonder whether it was all an illusion.
Are we destined to revert to the
pre-1945 era of protectionism, tribalism, and war?
It’s too early to write the history of
BY JOSEPH
QUINLAN
The writer is chief
market strategist
for Merrill and the
Private Bank,
Bank of America.
June 3, 2024
this new era, but it’s plain that many
of the forces that have driven returns
for decades are changing.
The hallmark of recent decades is a
tendency toward international peace.
It wasn’t always that way. From 1850
to 1945, France and Germany went to
war three times, Russia and Germany
went to war twice, and Britain and
France together fought Russia once.
And prior to 1850, wars were commonplace, the rule not the exception.
Prosperity was another rarity. For
four centuries prior to 1950, global
gross domestic product was static and
basically flatlined. Life was often
brutish—famines weren’t uncommon,
malnutrition was widespread, and
sanitation conditions were deplorable. Per capita incomes barely
budged from generation to generation.
The post–World War II era has
been near-golden—shaped more by
peace than war, progress over poverty,
and economic growth rather than
stagnation. The foundation was laid
by U.S. support of war-torn Europe
and Asia after World War II, and
America’s willingness to underwrite a
liberal world order that encouraged
democracy, free market economies,
and unfettered cross-border flows of
trade and investment.
Out of the destruction of World War
II emerged the most prolonged and
prosperous era of global growth the
world has ever experienced. Annual
global GDP growth rose to nearly 4%
from 1950 to 2020, versus 1.6% growth
from 1820 to 1950 and a measly 0.3%
from 1500 to 1820. Against this backdrop, billions of people were lifted out
of poverty. Expanding cross-border
ties of trade and investment knitted the
world together, and allowed U.S. multinationals to gain access to new markets, resources, and labor. Emerging
market workers-cum-consumers, notably in China, helped propel global
growth and global earnings.
So did peace among superpowers.
No great powers have gone to war
against one another in decades—a
historical anomaly. True, wars and
armed conflicts have not been completely eliminated, but the collapse of
the Soviet Union and the end of the
Cold War in the late 1980s led to a
global “peace dividend.” Meanwhile,
the shift in the “commanding
heights” toward greater deregulation,
privatization, and unfettered crossborder flows of trade and capital
helped to suppress global inflation,
structurally lower the cost of capital,
and fundamentally boost global
earnings.
To be sure, there were economic
shocks along the way—but the U.S.led liberal economic order of the past
80 years, while bending, didn’t break.
The upshot: a bull market in U.S. assets like no others, with U.S. equities
returning over 11% on a compound
annual average basis since 1945.
Whether the past is prologue remains uncertain, however. The rulesbased, free-market-led interdependent
world of the past is fraying. It’s different this time—national security
trumps economics and profits. Trade
isn’t free; it’s managed. Potentially
inefficient industrial policies are back.
Global supply chains are being reconfigured at substantial costs to companies. And in a world where might is
right, the peace dividend has gone up
in smoke. The great-power rivalry
between the U.S. and China is on,
helping to boost global arms sales to
record levels last year.
While for decades the threats to the
U.S.-led economic order were limited,
today China and Russia, along with
North Korea and Iran, have coalesced
into an “axis of upheaval” whose
shared ambition is nothing short of
remaking the U.S.-led global liberal
economic order of the past 80 years.
Their objective is to overturn the rules
of the global economy, dethrone the
U.S. dollar, and create their own technology standards, among other
things.
Looking forward, we are entering a
new era characterized by factors that
investors have not had to contemplate
for decades. Portfolios now need to
account for rising geopolitical risks
among the great powers, structurally
higher inflation due in part to resource protectionism and industrial
nationalism, and the shift of the commanding heights toward the public
sector at the expense of the private
sector.
This doesn’t preclude solid investment returns in the future. We know
from history that whatever the circumstances, the countries that are the
most open, flexible, and innovative
generate higher returns.
The most adaptable companies
thrive. As do nimble investors, who
should think more active over passive
management of portfolios, greater
diversification across asset classes, a
preference for dividend and income
providers, and a bias toward hard
power (defense/cybersecurity leaders),
hard assets (commodities), and inflation-sensitive sectors. B
Illustration by Qianhui Yu
46
June 3, 2024
47
RETIREMENT
MAILBAG
Pump Up Your 401(k).
New Roth Rules Help.
Many Folks Would
Love a Cheap EV
BY ELIZABETH O’BRIEN
M
For personal non-commercial use only. Do not edit or alter. Reproductions not permitted.
To reprint or license content, please contact Barron's reprints department at 800-843-0008 or www.djreprints.com
BARRON’S
ost of us save diligently for
retirement through a 401(k)
account. But a twist on the
traditional version could be
a better deal. Roth 401(k)s are gaining
popularity, and they now have some
features that could help you keep more
of your money in retirement—and be a
boon to your heirs.
Roth 401(k)s are the post-tax version
of the traditional 401(k). With a Roth,
your contributions are taxed on the way
in, and you enjoy tax-free withdrawals
in retirement. With a traditional 401(k),
you get a tax deduction upfront but
must pay income taxes on the money
you withdraw in retirement.
Roth 401(k)s have been steadily
growing in recent years: Eighty-nine
percent of retirement plan sponsors offered a Roth 401(k) in 2022, up from
54% in 2012, according to the Plan
Sponsor Council of America.
Conventional wisdom says Roths are
great for early-career workers who can
get taxes out of the way when they’re
young and presumably in a low tax
bracket. But higher-income workers
should consider them too. Income-tax
rates are at historic lows, so it could pay
for wealthier investors to pay taxes
sooner rather than later.
Roth 401(k)s also have no income
restrictions for contributions. That
could make them appealing for high-income earners who wouldn’t be able to
contribute to a Roth individual retirement account. For 2024, individuals
making upward of $161,000 and married couples filing jointly making
$240,000 or more aren’t allowed to contribute to a Roth IRA. Roth conversions
aren’t subject to these limits.
Another reason to consider a Roth
401(k): Your money can now grow taxfree for longer.
A change in tax law has made it eas-
ier to keep your Roth 401(k) intact
through retirement while avoiding required minimum distributions, or
RMDs. Until this year, retirees had to
take RMDs from Roth 401(k)s starting
in their early 70s. The Secure 2.0 law of
2022 eliminated that requirement effective in 2024. Now, if you own a Roth
401(k), you won’t have to take RMDs,
bringing the accounts in line with rules
for Roth IRAs.
That change could be a boon for your
heirs. Your pool of money can keep
growing, whereas before you had to
start depleting it in your early 70s. Prior
to the new rule, even though you
wouldn’t have to pay taxes on those
withdrawals, they would still eat into
your account balance, chipping away at
your heirs’ inheritance.
Another benefit of Roth 401(k)s is
clear rules on withdrawals for your
heirs. Most non-spouse heirs won’t have
to withdraw the full balance until the
end of the tenth year after the original
owner’s death; spouses get a longer
timetable. The rules for inherited IRAs
and traditional 401(k)s, by contrast, are
far more muddled at the moment.
T
he bottom line is that Roth
401(k)s can rack up more
gains without tax consequences, benefiting both you
and your heirs. “It’s a huge gift you can
make to beneficiaries,” says Ed Slott, an
IRA expert and author of the forthcoming book The Retirement Savings Time
Bomb Ticks Louder.
It may not be easy paying taxes on
contributions, of course. But knowing
the government won’t take its cut of
your money later in life does buy peace
of mind, says Jonathan Lee, a portfolio
manager at U.S. Bank Private Wealth
Management in St. Louis.
With a Roth, he says, “one thing you
don’t have to think about is, ‘How much
of this money is mine?’ ” B
To the Editor,
I was taken aback by BofA Securities
analyst John Murphy’s quote that a
“stripped-down, small [vehicle] in
the U.S. is not what anybody wants”
(“China’s Cheap EVs Aren’t a Threat to
Tesla, Ford, and GM. Here’s What Is,”
Cover Story, May 24).
Speak for yourself, Murphy. A
$10,000 car is just what we need for
young people starting out, retirees living
on Social Security, single moms needing
to get to work, and anyone else who
needs to get around without spending
a fortune. There would be plenty of demand for cheaper cars and profit with
enough volume.
Perhaps U.S.-based auto manufacturers are just not up to the task and would
rather rely on tariffs to help them
compete, rather than rely on good oldfashioned American ingenuity.
Rich Woller
Lenox, Mass.
Annuities: A Better Idea
To the Editor:
Annuities are probably not right for
most retirees (“How to Build Your Retirement Paycheck—and Make It Last,”
May 24). The typical retiree receives
Social Security, $30,000 annually being
a not uncommon benefit. It would require a $600,000 lump sum to buy an
annuity at 5% to generate an additional
$30,000 annually. This would deplete
the liquid assets for many, if not most,
retirees.
Is it not better to retain assets in a
retirement plan, where they can generate a required minimum distribution—
monthly or annually—along with growing the retirement account via dividends
and capital gains (and keeping an estate
intact for family)?
Joseph G. Kozlowski
Maumee, Ohio
To the Editor:
I was surprised that your article didn’t
discuss charitable gift annuities. These
annuities provide the donor with an
opportunity to ensure lifetime income
and contribute to a nonprofit organization. When you take into account the tax
benefits of gift annuities, they provide a
return that is competitive with commercial annuities. Why make money for an
insurance company when you can support
a worthy cause?
Don Aronoff
Parkville, Md.
Work More, and Longer
To the Editor:
In “Every Single American Needs a Retirement Account. Let’s Do It, Washington”
(Sloan’s View, May 24), Allan Sloan outlines a mandatory defined contribution
program for employees who choose not
to create their own individual retirement
account. The plan anticipates a 5% matching contribution by the government, and
he estimates the annual cost to government at $35 billion. The government already mandates a generous and expensive
Social Security system as well as a private,
voluntary IRA system. If people choose
not to participate in an IRA, then they
should bear the consequences, including
potentially working more and longer.
Patrick J. Keogh
Llano, Texas
Send letters to Mail@Barrons.com.
To be considered for publication,
correspondence must bear the writer’s
name, address, and phone number.
Letters are subject to editing.
The Barron’s Daily is our morning briefing
for what you need to know for the day.
Sign up at barrons.com/newsletters.
For personal non-commercial use only. Do not edit or alter. Reproductions not permitted.
To reprint or license content, please contact Barron's reprints department at 800-843-0008 or www.djreprints.com
48
M
W
L
C
10
11
12
H
G
R
P
BARRON’S
THE ALL-ELECTRIC BMW i7.
BMWUSA.com
©2024 BMW of North America, LLC. The BMW trademarks are registered trademarks.
4
8
3
F
2
D
6
7
9
0
A
I
June 3, 2024